1
User’s
Manual
WX103
MXLOGGER
IM WX103-01E
8th Edition
This user’s manual contains useful information about the functions and operating
procedures of the MXLOGGER and lists the handling precautions of the software. To
ensure correct use, please read this manual thoroughly before beginning operation.
After reading this manual, keep it in a convenient location for quick reference in the event
a question arises during operation.
The following manuals are provided in addition to this one. Read them along with this
manual.
Manual Title
MX100 Data Acquisition Unit
User’s Manual
Manual No.
IM MX100-01E
MX100 Data Acquisition Unit
Installation and Connection Guide
IM MX100-72E
Description
Contains useful information about
the functions, installation and wiring
procedures, and handling precautions of
the MX100 Data Acquisition Unit.
Describes concisely the installation and
wiring procedures of the MX100 Data
Acquisition Unit.
Notes
• License numbers will not be reissued. Please keep your license numbers in a
safe place.
• This manual describes the functions and operating procedures of MXLOGGER when
connected to style number S3 of the MX100 Data Acquisition Unit. When connected to
a style number prior to S3 of the MX100 Data Acquisition Unit, certain functions may
not be available.
• The contents of this manual are subject to change without prior notice as a result of
continuing improvements to the software’s performance and functions. Display contents
illustrated in this manual may differ slightly from what actually appears on your screen.
• Every effort has been made in the preparation of this manual to ensure the accuracy
of its contents. However, should you have any questions or find any errors, please
contact your nearest YOKOGAWA representative, dealer, or sales office.
• This user’s manual does not cover the handling and operating procedures of Windows.
• Copying or reproducing all or any part of the contents of this manual without
YOKOGAWA’s permission is strictly prohibited.
Trademarks
• DAQWORX, DAQLOGGER, and DAQEXPLORER are registered trademarks or
trademarks of Yokogawa Electric Corporation.
• Microsoft, Windows, and Windows Vista are registered trademarks or trademarks of
Microsoft Corporation in the United States and/or other countries.
• Adobe and Acrobat are registered trademarks or trademarks of Adobe Systems
Incorporated.
• Company and product names that appear in this manual are registered trademarks or
trademarks of their respective holders.
• The company and product names used in this manual are not accompanied by the
registered trademark or trademark symbols (® and ™).
Revisions
•
•
•
•
•
•
•
•
1st Edition
2nd Edition
3rd Edition
4th Edition
5th Edition
6th Edition
7th Edition
8th Edition
July 2003
February 2005
June 2007
March 2008
January 2009
June 2010
January 2011
October 2011
8th Edition : October 2011 (YK)
All Rights Reserved, Copyright © 2003 Yokogawa Electric Corporation
IM WX103-01E
Software License Agreement
IMPORTANT - PLEASE READ CAREFULLY BEFORE INSTALLING OR USING:
THANK YOU VERY MUCH FOR SELECTING SOFTWARE OF YOKOGAWA ELECTRIC CORPORATION ("YOKOGAWA"). BY INSTALLING OR OTHERWISE USING THE
SOFTWARE PRODUCT, YOU AGREE TO BE BOUND BY THE TERMS AND CONDITIONS OF THIS AGREEMENT. IF YOU DO NOT AGREE, DO NOT INSTALL NOR USE
THE SOFTWARE PRODUCT AND PROMPTLY RETURN IT TO THE PLACE OF PURCHASE FOR A REFUND, IF APPLICABLE.
Software License Agreement
1. Scope
This Agreement applies to the following software products and associated documentation of Yokogawa (collectively, "Software Product"). Unless otherwise provided by
Yokogawa, this Agreement applies to the updates and upgrades of the Software Product which may be provided by Yokogawa.
Software Product: DAQWORX (It is limited to each software that you bought).
2. Grant of License
2.1 Subject to the terms and conditions of this Agreement, Yokogawa hereby grants to you a non-exclusive and non-transferable right to use the Software Product on a
single or, the following specified number of, computer(s) and solely for your internal operation use, in consideration of full payment by you to Yokogawa of the license
fee separately agreed upon.
Granted number of License: 1 (one)
2.2 Unless otherwise agreed or provided by Yokogawa in writing, the following acts are prohibited:
a) to reproduce the Software Product, except for one archival copy for backup purpose, which shall be maintained with due care subject to this Agreement;
b)to sell, lease, distribute, transfer, pledge, sublicense, make available via the network or otherwise convey the Software Product or the license granted herein to any
other person or entity;
c) to use the Software Product on any unauthorized computer via the network;
d)to cause, permit or attempt to dump, disassemble, decompile, reverse-engineer, or otherwise translate or reproduce the Software Product into source code or other
human readable format, or to revise or translate the Software Product into other language and change it to other formats than that in which Yokogawa provided;
e) to cause, permit or attempt to remove any copy protection used or provided in the Software Product; or
f) to remove any copyright notice, trademark notice, logo or other proprietary notices or identification shown in the Software Product.
2.3 Any and all technology, algorithms, know-how and process contained in the Software Product are the property or trade secret of Yokogawa or licensors to Yokogawa.
Ownership of and all the rights in the Software Product shall be retained by Yokogawa or the licensors and none of the rights will be transferred to you hereunder.
2.4 You agree to maintain the aforementioned property and trade secret of Yokogawa or licensors and key codes in strict confidence, not to disclose it to any party other
than your employees, officers, directors or similar staff who have a legitimate need to know to use the Software Product and agreed in writing to abide by the obligations
hereunder.
2.5 Upon expiration or termination of this Agreement, the Software Product and its copies, including extracts, shall be returned to Yokogawa and any copies retained in your
computer or media shall be deleted irretrievably. If you dispose of media in which the Software Product or its copy is stored, the contents shall be irretrievably deleted.
2.6 The Software Product may contain software which Yokogawa is granted a right to sublicense or distribute by third party suppliers, including affiliates of Yokogawa ("Third
Party Software"). If suppliers of the Third Party Software ("Supplier") provide special terms and conditions for the Third Party Software which differ from this Agreement,
the special terms and conditions separately provided by Yokogawa shall prevail over this Agreement. Some software may be licensed to you directly by Supplier.
2.7 The Software Product may contain open source software ("OSS"), for which the special terms and conditions separately provided by Yokogawa shall take precedence
over this Agreement.
3. Restrictions on Application
3.1 Unless otherwise agreed in writing between you and Yokogawa, the Software Product is not intended, designed, produced or licensed for use in relation to aircraft
operation or control, ship navigation or marine equipment control, or ground facility or device for support of the aforesaid operation or control, or for use in relation
to rail facility, nuclear related facility, radiation-related equipment, or medical equipment or facility, or under any other circumstances which may require high safety
standards.
3.2 If the Software Product is used for the abovementioned purposes, neither Yokogawa nor Supplier assumes liability for any claim or damage arising from the said use
and you shall indemnify and hold Yokogawa, Supplier, their affiliates, subcontractors, officers, directors, employees and agents harmless from any liability or damage
whatsoever, including any court costs and attorney's fees, arising out of or related to the said use.
4. Limited Warranty
4.1 The Software Product shall be provided to you on an "as is" basis at the time of delivery and except for physical damage to the recording medium containing the
Software Product, Yokogawa and Supplier shall disclaim all of the warranties whatsoever, express or implied, and all liabilities therefrom. If any physical defect is found
on the recording medium not later than twelve (12) months from delivery, Yokogawa shall replace such defective medium free of charge, provided that the defective
medium shall be returned to the service office designated by Yokogawa at your expense within the said twelve (12) months. THIS LIMITED WARRANTY PROVIDED
IN THIS CLAUSE IS IN LIEU OF ALL OTHER WARRANTIES OF ANY KIND WHATSOEVER AND YOKOGAWA HEREBY DISCLAIMS ALL OTHER WARRANTIES
RELATING TO THE SOFTWARE PRODUCT, WHETHER EXPRESSED OR IMPLIED, INCLUDING WITHOUT LIMITATION, ANY IMPLIED WARRANTIES OF
MERCHANTABILITY, FITNESS FOR ANY PARTICULAR PURPOSE, NON-INFRINGEMENT, QUALITY, FUNCTIONALITY, APPROPRIATENESS, ACCURACY,
RELIABILITY AND RECENCY. IN NO EVENT SHALL YOKOGAWA WARRANT THAT THERE IS NO INCONSISTENCY OR INTERFERENCE BETWEEN THE
SOFTWARE PRODUCT AND OTHER SOFTWARE NOR SHALL BE LIABLE THEREFOR. The warranty provisions of the applicable law are expressly excluded to the
extent permitted.
4.2 At the sole discretion of Yokogawa, Yokogawa may upgrade the Software Product to the new version number ("Upgrade") and make it available to you at your expense
or free of charge as Yokogawa deems fit. In no event shall Yokogawa be obliged to upgrade the Software Product or make the Upgrade available to you.
4.3 Certain maintenance service may be available for some types of Software Product at Yokogawa's current list price. Scope and terms and conditions of the maintenance
service shall be subject to those separately provided by Yokogawa. Unless otherwise provided in Yokogawa catalogues or General Specifications, maintenance services
will be available only for the latest version and the immediately preceding version. In no event will service for the immediately preceding version be available for more
than 5 years after the latest version has been released. In addition, no service will be provided by Yokogawa for the Software Product which has been discontinued for
more than 5 years. Notwithstanding the foregoing, maintenance service may not be available for non-standard Software Product. Further, in no event shall Yokogawa
provide any service for the Software Product which has been modified or changed by any person other than Yokogawa.
ii
IM WX103-01E
Software License Agreement
5. Infringement
5.1 If you are warned or receive a claim by a third party that the Software Product in its original form infringes any third party's patent (which is issued at the time of delivery
of the Software Product), trade mark, copyright or other intellectual property rights ("Claim"), you shall promptly notify Yokogawa thereof in writing.
5.2 If the infringement is attributable to Yokogawa, Yokogawa will defend you from the Claim at Yokogawa's expense and indemnify you from the damages finally granted
by the court or otherwise agreed by Yokogawa out of court. The foregoing obligation and indemnity of Yokogawa shall be subject to that i) you promptly notify Yokogawa
of the Claim in writing as provided above, ii) you grant to Yokogawa and its designees the full authority to control the defense and settlement of such Claim and iii) you
give every and all necessary information and assistance to Yokogawa upon Yokogawa's request.
5.3 If Yokogawa believes that a Claim may be made or threatened, Yokogawa may, at its option and its expense, either a) procure for you the right to continue using the
Software Product, b) replace the Software Product with other software product to prevent infringement, c) modify the Software Product, in whole or in part, so that it
become non-infringing, or d) if Yokogawa believes that a) through c) are not practicable, terminate this Agreement and refund you the paid-up amount of the book value
of the Software Product as depreciated.
5.4 Notwithstanding the foregoing, Yokogawa shall have no obligation nor liability for, and you shall defend and indemnify Yokogawa and its suppliers from, the Claim, if the
infringement is arising from a) modification of the Software Product made by a person other than Yokogawa, b) combination of the Software Product with hardware or
software not furnished by Yokogawa, c) design or instruction provided by or on behalf of you, d) not complying with Yokogawa's suggestion, or e) any other causes not
attributable to Yokogawa.
5.5 This section states the entire liability of Yokogawa and its suppliers and the sole remedy of you with respect to any claim of infringement of a third party's intellectual
property rights. Notwithstanding anything to the contrary stated herein, with respect to the claims arising from or related to the Third Party Software or OSS, the special
terms and conditions separately provided for such Third Party Software or OSS shall prevail.
6. Limitation of Liability
6.1 EXCEPT TO THE EXTENT THAT LIABILITY MAY NOT LAWFULLY BE EXCLUDED IN CONTRACT, YOKOGAWA AND SUPPLIERS SHALL NOT BE LIABLE TO ANY
PERSON OR LEGAL ENTITY FOR LOSS OR DAMAGE, WHETHER DIRECT, INDIRECT, SPECIAL, INCIDENTAL, CONSEQUENTIAL OR EXEMPLARY DAMAGES,
OR OTHER SIMILAR DAMAGES OF ANY KIND, INCLUDING WITHOUT LIMITATION, DAMAGES FOR LOSS OF BUSINESS PROFITS, BUSINESS INTERRUPTION,
LOSS OR DESTRUCTION OF DATA, LOSS OF AVAILABILITY AND THE LIKE, ARISING OUT OF THE USE OR INABILITY TO USE OF THE SOFTWARE PRODUCT,
OR ARISING OUT OF ITS GENERATED APPLICATIONS OR DATA, EVEN IF ADVISED OF THE POSSIBILITY OF SUCH DAMAGES, WHETHER BASED IN
WARRANTY (EXPRESS OR IMPLIED), CONTRACT, STRICT LIABILITY, TORT (INCLUDING NEGLIGENCE), OR ANY OTHER LEGAL OR EQUITABLE GROUNDS.
IN NO EVENT YOKOGAWA AND SUPPLIER'S AGGREGATE LIABILITY FOR ANY CAUSE OF ACTION WHATSOEVER (INCLUDING LIABILITY UNDER CLAUSE
5) SHALL EXCEED THE DEPRECIATED VALUE OF THE LICENSE FEE PAID TO YOKOGAWA FOR THE USE OF THE CONCERNED PART OF THE SOFTWARE
PRODUCT. If the Software Product delivered by Yokogawa is altered, modified or combined with other software or is otherwise made different from Yokogawa
catalogues, General Specifications, basic specifications, functional specifications or manuals without Yokogawa's prior written consent, Yokogawa shall be exempted
from its obligations and liabilities under this Agreement or law.
6.2 Any claim against Yokogawa based on any cause of action under or in relation to this Agreement must be given in writing to Yokogawa within three (3) months after the
cause of action accrues.
7. Export Control
You agree not to export or provide to any other countries, whether directly or indirectly, the Software Product, in whole or in part, without prior written consent of Yokogawa.
If Yokogawa agrees such exportation or provision, you shall comply with the export control and related laws, regulations and orders of Japan, the United States of America,
and any other applicable countries and obtain export/import permit and take all necessary procedures under your own responsibility and at your own expense.
8. Audit; Withholding
8.1 Yokogawa shall have the right to access and audit your facilities and any of your records, including data stored on computers, in relation to the use of the Software
Product as may be reasonably necessary in Yokogawa's opinion to verify that the requirements of this Agreement are being met.
8.2 Even after license being granted under this Agreement, should there be any change in circumstances or environment of use which was not foreseen at the time of
delivery and, in Yokogawa's reasonable opinion, is not appropriate for using the Software Product, or if Yokogawa otherwise reasonably believes it is too inappropriate
for you to continue using the Software Product, Yokogawa may suspend or withhold the license provided hereunder.
9. Assignment
If you transfer or assign the Software Product to a third party, you shall expressly present this Agreement to the assignee to ensure that the assignee comply with this
Agreement, transfer all copies and whole part of the Software Product to the assignee and shall delete any and all copy of the Software Product in your possession
irretrievably. This Agreement shall inure to the benefit of and shall be binding on the assignees and successors of the parties.
10. Termination
Yokogawa shall have the right to terminate this Agreement with immediate effect upon notice to you, if you breach any of the terms and conditions hereof. Upon termination of
this Agreement, you shall promptly cease using the Software Product and, in accordance with sub-clause 2.5, return or irretrievably delete all copies of the Software Product,
certifying the same in writing. In this case the license fee paid by you for the Software Product shall not be refunded. Clauses 2.4 and 2.5, 3, 5, 6 and 11 shall survive any
termination of this Agreement.
11. Governing Law; Disputes
This Agreement shall be governed by and construed in accordance with the laws of Japan.
Any dispute, controversies, or differences which may arise between the parties hereto, out of, in relation to or in connection with this Agreement ("Dispute") shall be resolved
amicably through negotiation between the parties based on mutual trust. Should the parties fail to settle the Dispute within ninety (90) days after the notice is given from either
party to the other, the Dispute shall be addressed in the following manner:
(i) If you are a Japanese individual or entity, the Dispute shall be brought exclusively in the Tokyo District Court (The Main Court) in Japan.
(ii)If you are not a Japanese individual or entity, the Dispute shall be finally settled by arbitration in Tokyo, Japan in accordance with the Commercial Arbitration Rules
of the Japan Commercial Arbitration Association. All proceedings in arbitration shall be conducted in the English language, unless otherwise agreed. The award of
arbitration shall be final and binding upon both parties, however, each party may make an application to any court having jurisdiction for judgment to be entered on
the award and/or for enforcement of the award.
12. Miscellaneous
12.1 This Agreement supersedes all prior oral and written understandings, representations and discussions between the parties concerning the subject matter hereof to the
extent such understandings, representations and discussions should be discrepant or inconsistent with this Agreement.
12.2 If any part of this Agreement is found void or unenforceable, it shall not affect the validity of the balance of the Agreement, which shall remain valid and enforceable
according to its terms and conditions. The parties hereby agree to attempt to substitute for such invalid or unenforceable provision a valid or enforceable provision that
achieves to the greatest extent possible the economic, legal and commercial objectives of the invalid or unenforceable provision.
12.3 Failure by either party to insist on performance of this Agreement or to exercise a right when entitled does not prevent such party from doing so at a later time, either in
relation to that default or any subsequent one.
End of document
IM WX103-01E
iii
Contents
Software License Agreement............................................................................................................. ii
Chapter 1 Before Using the Software
1.1 Functional Overview of MXLOGGER................................................................................... 1-1
Functional Overview............................................................................................................. 1-1
Logger................................................................................................................................... 1-2
Viewer................................................................................................................................... 1-3
Calibrator.............................................................................................................................. 1-3
1.2 MXLOGGER Operation Guide.............................................................................................. 1-4
Flow of Operations during Installation.................................................................................. 1-4
Overview of Operations ....................................................................................................... 1-5
1.3 PC System Requirements.................................................................................................. 1-20
1.4 Setting Up MXLOGGER..................................................................................................... 1-22
Setup Procedure................................................................................................................. 1-22
Installation Result............................................................................................................... 1-22
1.5 Starting and Exiting Software Programs............................................................................. 1-23
Chapter 2 Logger
2.1 Searching MX100 Data Acquisition Units and Configuring the Network............................... 2-1
Searching for MX100s.......................................................................................................... 2-1
Setting Up the Network......................................................................................................... 2-2
2.2 Configuring the System........................................................................................................ 2-5
Selecting the MX100s That Are to Monitor the Data............................................................. 2-5
Retrieving/Setting Module Configuration Information........................................................... 2-6
Assigning Input Modules to Measurement Groups . ............................................................ 2-7
Configuring a System Using MX100s That Are Not Connected........................................... 2-8
Setting the A/D Integration Time........................................................................................... 2-8
Setting the Temperature Unit for TC and RTD...................................................................... 2-8
MX100 Response Check...................................................................................................... 2-8
CF Card Information............................................................................................................. 2-9
Setting the Write Mode of the CF Card................................................................................. 2-9
2.3 Setting the Data Acquisition Conditions.............................................................................. 2-10
Data Acquisition Conditions................................................................................................ 2-10
Automatic Start Function.................................................................................................... 2-12
Setting the Measurement Channels and Computation Channels to Be Recorded............. 2-13
2.4 Setting the Measurement Conditions (Measurement Channel Settings)............................ 2-15
Setting the Input Mode........................................................................................................ 2-15
Setting the Measuring Range............................................................................................. 2-15
Setting the Span ................................................................................................................ 2-15
Setting the Scale (Only When Scaling)............................................................................... 2-15
Setting the Reference Channel for Difference Input (Valid Only When Measuring the
Difference with Respect to the Measured Value of the Reference Channel)...................... 2-15
Setting the Remote RJC Reference Channel (Valid Only When the Input Mode Is Set to
RRJC (TC))......................................................................................................................... 2-16
Setting the Unit, Tag Number, and Tag Comment ............................................................. 2-16
Setting the Time Constant of the First-Order Lag Filter (Valid Only When the Input Mode Is
Set to Something Other than DI) ....................................................................................... 2-16
Setting the Burnout (Valid Only When the Input Mode Is Set to TC).................................. 2-16
Setting the RJC (When the Input Mode Is Set to TC)......................................................... 2-16
iv
IM WX103-01E
Contents
Setting the Initial Balancing for Strain Input Channels (Only When the Input Mode Is Set to
STR) .................................................................................................................................. 2-17
Importing Tag Numbers and Tag Comments...................................................................... 2-18
When Setting the Measurement Conditions for Each Channel Individually........................ 2-18
2.5 Setting Computations (Setting the Computation Channels)............................................... 2-24
Setting the Expression........................................................................................................ 2-24
Setting the Span ................................................................................................................ 2-24
Setting the Unit, Tag Number, and Tag Comment ............................................................. 2-24
Setting the User-Defined Constant .................................................................................... 2-24
Importing Expressions........................................................................................................ 2-26
Importing User-Defined Constants..................................................................................... 2-26
Importing Tag Numbers and Tag Comments...................................................................... 2-26
Setting Timers (Only When Using Timers in the Computations)......................................... 2-27
When Calculating ±Overrange Values of Measurement Channels as the Maximum or
Minimum Value of the Measurement Range....................................................................... 2-27
Resetting Computation....................................................................................................... 2-27
When Setting Computations for Each Channel Individually............................................... 2-27
2.6 Setting Alarms..................................................................................................................... 2-37
2.7 Digital Output...................................................................................................................... 2-40
Setting the Digital Output of Alarms.................................................................................... 2-40
Setting the Digital Output Other Than Alarms..................................................................... 2-40
Changing the Manual DO Name and Specified Output...................................................... 2-41
2.8 Analog/PWM Output Settings............................................................................................. 2-43
Setting Analog Output . ...................................................................................................... 2-43
Setting PWM Output .......................................................................................................... 2-44
Editing Pattern Output........................................................................................................ 2-45
“Generate Automatically” Function..................................................................................... 2-47
Turning Transmission Output ON and OFF Collectively for Analog Output/PWM Output.. 2-50
2.9 Event Processing................................................................................................................ 2-52
Setting Alarm Events ......................................................................................................... 2-52
Setting Up Data File Events................................................................................................ 2-53
Setting Communication Events........................................................................................... 2-54
Setting Start Record Events............................................................................................... 2-55
Setting Stop Record Events................................................................................................ 2-56
Configuring FTP.................................................................................................................. 2-58
Configuring E-Mail.............................................................................................................. 2-58
User File Settings............................................................................................................... 2-58
Enabling/Disabling Events.................................................................................................. 2-59
2.10 Starting/Stopping Data Monitoring and Displaying the Monitor.......................................... 2-60
Start Data Monitoring.......................................................................................................... 2-60
Stop Data Monitoring.......................................................................................................... 2-60
Displaying the Trend Monitor Window and Changing Display Settings.............................. 2-61
Displaying the Numeric Monitor Window............................................................................ 2-61
Displaying the Meter Monitor Window................................................................................ 2-62
Displaying the All Channel Monitor Window....................................................................... 2-63
Displaying the Alarm Monitor Window................................................................................ 2-64
Changing Display Settings on the General Display Settings Window................................ 2-65
2.11 Pausing/Resuming the Updating of the Monitor Display and Reading Measured Values Using
Cursors .............................................................................................................................. 2-72
Pausing and Resuming the Updating of the Monitor Display............................................. 2-72
Reading Measured/Computed Values Using Cursors........................................................ 2-72
IM WX103-01E
1
2
3
4
5
Index
Contents
2.12 Starting and Stopping Data Recording............................................................................... 2-74
Starting the Recording ....................................................................................................... 2-74
Stopping the Recording ..................................................................................................... 2-74
2.13 Saving/Loading and Printing Setup Data (Project)............................................................. 2-76
Saving Setup Data (Project)............................................................................................... 2-76
Loading Setup Data (Project)............................................................................................. 2-76
Printing Setup Data............................................................................................................. 2-77
Print Preview....................................................................................................................... 2-77
Setting Up the Printer......................................................................................................... 2-77
2.14 Setting Up the Monitor Server............................................................................................ 2-79
Starting and Exiting the Monitor Server.............................................................................. 2-79
Changing the Port Number................................................................................................. 2-79
2.15 Setting Up the DDE Server................................................................................................. 2-81
Starting and Exiting the DDE Server.................................................................................. 2-81
2.16 Displaying the Software Version and Other Information..................................................... 2-83
Chapter 3 Viewer
3.1 Loading Data Files................................................................................................................ 3-1
3.2 Setting the Display................................................................................................................ 3-6
Changing the Display on the Waveform Display Window..................................................... 3-6
Changing the Display Using the Toolbar............................................................................... 3-6
Changing the Display Using the Menu................................................................................. 3-7
Changing the Display Using the Display Settings Window................................................... 3-7
3.3 Reading Values Using Cursors........................................................................................... 3-18
Clearing Cursors................................................................................................................. 3-19
3.4 Statistical Computation over an Area of Measured/Computed Data.................................. 3-20
3.5 Saving Display Settings...................................................................................................... 3-22
When Closing the Viewer................................................................................................... 3-22
3.6 Saving the Display Template.............................................................................................. 3-23
Saving Templates............................................................................................................... 3-23
Using Templates................................................................................................................. 3-23
3.7 Converting Data Formats.................................................................................................... 3-24
3.8 Printing Data....................................................................................................................... 3-26
Setting the Contents to Be Printed..................................................................................... 3-26
Executing the Print Operation............................................................................................. 3-27
Print Preview....................................................................................................................... 3-27
Setting Up the Printer......................................................................................................... 3-27
3.9 Displaying the Software Version and Other Information..................................................... 3-31
Chapter 4 Calibrator
4.1 Connecting the MX100 Data Acquisition Unit....................................................................... 4-1
When Setting a Password for Startup................................................................................... 4-2
4.2 Calibration Procedure........................................................................................................... 4-3
Chapter 5 Troubleshooting
5.1 Troubleshooting.................................................................................................................... 5-1
5.2 Error Messages and Their Corrective Actions...................................................................... 5-5
Error Messages on the Logger ............................................................................................ 5-5
Error Messages on the Viewer............................................................................................. 5-6
Error Messages on the Calibrator......................................................................................... 5-6
Index
vi
IM WX103-01E
Chapter 1
1.1
Before Using the Software
1
Functional Overview of MXLOGGER
Before Using the Software
Functional Overview
2
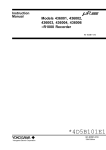
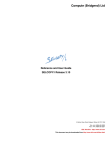
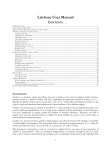
The MXLOGGER can be used to connect up to twenty MX100 Data Acquisition Units
(hereinafter, “MX100s”) to a single PC and acquire data.
MXLOGGER
3
<Maximum number of channels>
Data acquisition : 1200ch
MATH : 240ch
Total : 1440ch
PC
4
5
Hub
MX100 Data
Acquisition Unit
Index
MX100
MX100
MX100
Connect up
to 20 units
The MXLOGGER consists of the following three software programs: Logger, Viewer, and
Calibrator.
• Logger
You can use the Logger to set data record conditions and measurement conditions,
set up computations, set alarms, set digital outputs, start/stop data monitoring, display
the monitor, record (save) data, and so on.
IM WX103-01E
1-1
1.1 Functional Overview of MXLOGGER
• Viewer
You can use the Viewer to (1) display measured and computed data that has been
recorded (saved), (2) read values and perform statistical computation over an area
using cursors, and (3) convert the measured and computed data into various file
formats such as Excel.
• Calibrator
You can use the Calibrator to calibrate the MX100 universal input modules.
Logger
On the Logger, the following screens (windows) are used to enter settings.
• System Screen
On this screen, you can search for MX100s in the same network segment, set
communication parameters of the detected MX100s such as the IP address, select
the MX100s to be connected, select measurement groups (groups that have the same
monitor interval/record interval), and perform other functions.
• Acquisition Screen
You can set the monitor interval of the measured data, the record step of the data,
and the record start/stop conditions. You can also set the save destination and the file
name of the record data, set up the file division function, and perform other functions.
• Channel Setup Screen
For each measurement channel, you can set (1) the measurement conditions such
as the input mode, measurement range, and measurement span, (2) whether to
carry out measurement/recording, and (3) the alarm conditions. You can also set
up computations such as the four arithmetical operations using the measured data
(computation channel setting), set the signal to be output from the digital output
module (DO channel setting), and set up modules such as the analog output and
PWM output modules.
• General Display Settings Window
For each display group, you can set the channels to be displayed, display scale,
display zone, trip point (the value of interest in the waveform display), display color,
and other parameters.
1-2
IM WX103-01E
1.1 Functional Overview of MXLOGGER
• Monitor Screen
You can display the waveforms and numerical values of the measured/computed
data, change the display method, start/stop the recording of the measured/computed
data, pause the monitor, manually control the digital output, analog output, and PWM
output, and perform other operations. When the monitor is paused, you can display
the past data and read computed/measured values using cursors.
In addition to the operations described above, you can also save the setup data (project),
print a list of settings, and perform other operations from the menu.
Viewer
You can load the measured/computed data that was recorded (saved) in the past and
carry out the following operations.
• Synchronization
When the data file is opened, the measurement time is corrected based on the time
information of the PC.
• Display waveforms and numeric values
• Display a list of alarms and marks
• Change the display conditions (group assignments, scale, trip point, display color and
other parameters)
• Read the data values using cursors
• Perform statistical computation over an area
• Display and add marks
• Print the displayed waveform and numeric values
• Save or load display conditions
• Display the file information
• Convert data formats (ASCII, Excel, and Lotus)
• Print data (waveforms, numeric values, alarm/marker list, cursor values, statistics over
an area, and computed values)
• Using templates and save
• Join divided CF files
Calibrator
You can connect to the MX100, display the modules that can be calibrated, and carry out
calibration of each measurement range.
IM WX103-01E
1-3
1
Before Using the Software
On the Logger, you can also perform operations such as starting/stopping data
monitoring, displaying the monitor window, pausing the monitor, and starting/stopping
data recording, as well as displaying the Run screen used to monitor the communication
status of the connected MX100s and the status of data monitoring and recording.
The types of monitor windows available are the Trend Monitor that displays the data
using waveforms, the Numeric Monitor that displays the data using instantaneous values,
the Meter Monitor that displays the data using three types of meters, and the Alarm
Monitor that displays the status of alarm occurrences.
2
3
4
5
Index
1.2
MXLOGGER Operation Guide
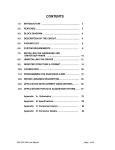
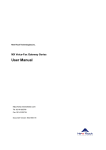
Flow of Operations during Installation
The figure below shows the general flow of operation when the MX100 is installed
initially.
Operations on the MX100
Operations on the PC
Section X.X indicates the referred
sections in this manual.
Install the MX100
Set up the
MXLOGGER
See the DAQWORX Installation
and Operation Guide (IM
WX1000-01E).
Wire the input/
output modules
Set the network
parameters of the PC
Set the appropriate IP address,
subnet mask, and default
gateway of the PC.
Connect the
network cable
Section 1.5
Start the
logger
See the Installation
and Connection Guide.
Section 2.1
Search the MX100/
configure the network
Connect the power
cord
Section 2.2
Turn ON the power
switch
Configure the system
Section 2.3
The Installation and Connection Guide (IM
MX100-72E) is an abridged manual provided with
the MX100 main module. The Installation and
Connection Guide does not explain all the
functions and operations. It also does not cover the
details of the precautions and limitations of usage.
For a detailed explanation, see the MX100 Data
Acquisition Unit User's Manual (IM MX100-01E)
contained in the manual CD-ROM.
Select the MX100 to be connected,
select the acquisition interval of
each input module, etc.
Select the acquisition interval to be
used, select the record interval, set
record start/stop conditions, etc.
Sections 2.4 and 2.5
Set the measurement
Set the input mode,
conditions/set
measurement range,
the computation
measurement span, etc.
Set the data
acquisition condition
Section 2.8
Set the transmission
output
Section 2.6
*The available digital
(DO) outputs are alarm
output, manual DO, fail
output, and error output.
Search all connected MX100s and
configure the network parameters
such as the IP address of the
connected MX100s.
Set the alarm
Section 2.9
Set up events
Section 2.10
Acquire/Monitor the data
and monitor the alarm
Set analog/PWM output and others
Set the alarm
See section 2.7 for digital output*
settings.
Set individual events
Section 2.10
Change the display
conditions
Section 2.12
Record the data
Section 1.5
Start the
Viewer
Sections 3.1 and 3.2
Display the recorded
data
Section 3.3
Read values using
cursors
Section 3.4
Perform statistical
computation over an
area of data
Section 3.7
Convert the data
format
Section 3.8
Print the displayed
data
1-4
IM WX103-01E
1.2 MXLOGGER Operation Guide
1
Overview of Operations
2
Note
For details on other operations, see the referred sections in this manual or other manuals
indicated in “Flow of Operations during Installation.”
Before carrying out the procedure below, connect the PC and the MX100s locally via a
hub and turn ON the power to the MX100s that are to monitor the data as indicated on
page 1-1.
Start the Logger
Before Using the Software
This section briefly explains the operations to be carried out after “Start the Logger”
described in the “Flow of Operations during Installation” on the previous page.
Choose Programs > YOKOGAWA DAQWORX > MXLOGGER > Logger.
The Logger starts and the main window opens.
3
4
For details, see
section 1.5.
5
Index
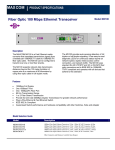
Search the MX100/
configure the network
1 Click here.
System screen of the Main window
For details, see
section 2.1.
To identify MX100s
2 Click Search.
3 Displays the MX100s that are connected in the
same segment.
4 Click Network Config.
5 Select the check boxes for the MX100s whose
network settings you wish to change.
6 Enter the machine name and
IP address.
7 Click Apply button. Click OK in
the dialog box that opens.
IM WX103-01E
The Network Config.
dialog box opens.
Default settings can be
used for local connection.
8 Click Close.
When the network configuration
is successful, Complete appears.
1-5
1.2 MXLOGGER Operation Guide
Configure the system
To retrieve current module information
For details, see
section 2.2.
To check which MX100 is connected
(When clicked, the word "--CALL--"
appears on the 7-segment LED
of the main module.)
When assigning the module to the measurement group
(see the figure below)
To check the size
Used when changing the unit number of the MX100
of the CF
(move up or down) or when adding/deleting the MX100
Select the check box to delete the old data
and save the data to the CF card repeatedly.
Select the A/D integral time
Module name
Select the temp. unit
1 Drag and drop the icon of the MX100 you wish to connect to the
Configuration area.
Click Yes when the dialog box below opens.
2 Click
Click the
the
button or
or the
the word
word Undefined
Undefine totoselect
button
selectthe
themeasurement
measurementgroup
groupon
oneach
each
module or
or click
click Auto
Auto Assignment
Assignment to
to automatically
automatically assign
assign suitable
suitable measurement
measurement groups.
groups.
module
If you
you click
Assignment
button,
the the
AutoAuto
Assignment
dialogdialog
box opens.
If
clickthe
theAuto
Auto
Assignment
button,
Assignment
box opens.
Click OK.
Click
OK.
Assign measurement groups in the Meas Groups area
Drag and drop the module icon to the Meas Group area.
1-6
IM WX103-01E
1.2 MXLOGGER Operation Guide
1
For details, see
section 2.3.
Before Using the Software
Set the data acquisition
condition
2 Set the acquisition interval for each measurement group.
You cannot set the acquisition interval of
measurement groups that do not have modules
assigned in step 2 of "Configure the system."
2
3 Set the record step for each group.
1 Click here.
3
4
Set the record start
4 condition.1
5
5 Set the record
stop condition.1 Click here to hide the Record
information area on the right.
6 Set the save destination and
name of the record file.2
IM WX103-01E
1-7
Index
1.2 MXLOGGER Operation Guide
Set the measurement
conditions/set the
computation
For details,
see section
2.4 and 2.5.
• Set the measurement conditions
Channel
number
* Cannot be used when Mode is set to RRJC
4 Select the input type.
Select the check boxes here to perform scaling*
5 Select the measurement
Decimal point position of the scale*
range.
Maximum/Minimum values of the scale*
Minimum/Maximum
value of span
1 Click here.
3 Select whether to make measurements.
2 Select whether to record (save) the data.
Click here to hide
When setting difference input*, remote RJC, unit, tab No., the right area
tag comment, filter, burnout, or RJC
Setup display/input area
for each channel
• Set the computation
2 Select whether to record (save) the computed data.
Channel number
3 Select whether to compute.
Labels indicating constants
1 Click here.
Constant values
5 Set the unit.
4 Set the equation.
Click here to hide
the right area
When setting the tag No.
or tag comment
Select the check box here to calculate
+Over and -Over as maximum and
minimum values of the measurement range
1-8
Set the parameters here when
using timers in the computation
Setup display/input
area for each channel
IM WX103-01E
1.2 MXLOGGER Operation Guide
1
3 Select the alarm 1 type.
4 Set the alarm value of alarm 1.
For details, see
section 2.6.
5 Set the hysteresis of alarm 1.
For measurement
channels
Switch to alarm settings
Click here to hide the right area
1 Click here.
Before Using the Software
Set the alarm
2
3
4
5
Index
6 Set Ararm2 to
Alarm 4 when
setting 2 to 4 alarms.
Alarm 2 type
Alarm value of alarm 2
Hysteresis of alarm 2
2 Scroll the setup parameters
to the right to display the
alarm setup parameters.
Setup display/input area
for each channel
Set the digital output
1 Click here.
For details, see
section 2.7.
Click here to hide the right area
Set the manual DO button
3 Select the output action.
2 Select output/not output.
Channel number
Alarm 1/alarm 2
reference
Reference channel range
when outputting alarm
4 Set these parameters
when outputting alarms.
To set the energize/de-energize of output relay or
hold/non-hold of output relay, scroll to the right.
IM WX103-01E
Setup display/input area
for each channel
1-9
1.2 MXLOGGER Operation Guide
Set up analog output
2 Click AO Channel.
For details, see
section 2.8.
1 Click here.
4 Select the output action.
3 Select Output/Not output.
Channel number
5 Select the reference
channel for
transmission output
Click here to hide
the right area
To set the range of analog output, span, output action,
and pattern output, scroll to the right.
Setup display/input area
for individual channels
Set up PWM output
2 Click PWM Channel.
For details, see
section 2.8.
1 Click here.
4 Select Output/Not output.
3 Select the output action.
Channel number
5 Select the reference
channel for
transmission output
Click here to hide
the right area
To set the span of PWM output, output action,
pulse, and pattern output, scroll to the right.
1-10
Setup display/input area
for individual channels
IM WX103-01E
1.2 MXLOGGER Operation Guide
1
1 Click here.
For details, see
section 2.9.
Before Using the Software
Set up events
2
The Event Setting window appears.
3
Event settings window
2 Click the event to be set.
3 3 Click or input items of the event to
be set
4 Input or select each item
4
5
Index
Click to open the folder containing the event
log file
IM WX103-01E
1-11
1.2 MXLOGGER Operation Guide
Start data recording,
monitor the data, and
monitor the alarm
For details, see
section 2.10.
1 Click here.
The Run screen appears when data
acquisition is started.
Run screen
Main operating status of MXLOGGER and current time
Name of manual DO*
Manual DO ON/OFF button
Operation of an user output
Information of communication
status of each MX100, etc.
Amount of used space/free space of the drive
containing the file save destination directory
Information about the record
* Can be changed when data recording is stopped.
2 Click the icon corresponding
to the monitor you wish to display.
Alarm monitor
Trend monitor
To pause the display updating on the monitor
To stop data recording
Digital monitor
Meter monitor
All Channel Monitor
• Alarm Monitor
To display alarm signals per display group
Click here.
To display alarm signals per
channel
Group number
When an alarm occurs,
yellow-green changes
to red.
If unacknowledged
alarms exist, a blinking
yellow ring appears
around the signal lamp.
Click here or choose
Display-Alarm ACK
from the Action menu
to acknowledge the
alarm. The outer ring
disappears.
1-12
Alarm indication per Channel
Switch between channel number,
tag No., and tag comment
IM WX103-01E
1.2 MXLOGGER Operation Guide
1
• Trend Monitor
Displays a red bar on the group with an alarm occurring
Before Using the Software
Switch the display group
Switch between channel number, tag No., and tag comment
2
Zoom in or out of the time axis
Click here.
Switch the display zone
3
Switch the grid density
Waveform display limit
ON/OFF (Clip)
Monitor interval
Change the grid density
Switch the Y-axis
4
Change the background
darkness
Waveform display ON/OFF
Switch the thickness of the
waveform
5
Channel number and
measurement unit
Y-axis
Time axis magnification
Index
• Numeric Monitor
Switch between channel number,
tag No., and tag comment
Click here.
Level with respect to
the scale width
Alarm indication
Channel number
Numeric display
Channel color
Unit
When the measured value exceeds the
measurement range
IM WX103-01E
1-13
1.2 MXLOGGER Operation Guide
• Meter Monitor
Displays a red bar on the group with an alarm occurring
Switch between channel number,
tag No., and tag comment
Alarm indication
Click here.
Channel color
Channel
number
Thermometer
Analog meter
Numeric Unit
display
Bar meter
• All Channel Monitor
Click here.
The All Channel Monitor screen opens.
Zoom in or out of the time axis
Switch the thickness of the
waveform
Monitor Interval
Turn ON/OFF the waveform
display limit
Change the grid thickness
Change the grid density
Change the background
darkness
1-14
IM WX103-01E
1.2 MXLOGGER Operation Guide
1
Change the display
conditions
For details, see
section 2.10.
Before Using the Software
1 Click here while data acquisition is in progress
2
Displays the General
Display Settings window
2 Change the items on the General Display Settings window
Select the
Display ON/OFF channel
Group name
Switch the display group
3
Execute automatic
channel assignment
Number of channels assigned
automatically
4
Max./Min. value of the scale Trip point
Channel
color
5
Index
2
1
Meter type
Turn scale ON/OFF
Display format of Y-axis
when displaying
multi-axes zone
Y-axis type (linear or logarithmic)
Display zone position
Turn ON/OFF collectively
Assign channels automatically
When making the settings the same as the first item
To copy
To not copy
Reset to default
1 To apply the setting changes, click OK. To not apply the changes, click Cancel.
To apply the changes and keep the screen opened, click Apply.
2 To copy/paste the settings at the channel level, click the respective buttons.
IM WX103-01E
1-15
1.2 MXLOGGER Operation Guide
Record the data
For details, see
section 2.12.
1 Click the
button or choose 1 Main from the Window menu
The Main window appears.
2 Click the Start Recording button while monitoring the data,
or choose Start Recording from the Acquisition menu.
or
To pause the monitor display,
click Pause or choose Pause
from the Acquisition menu.
To stop acquisition, click Stop Recording or
choose Stop Recording from the Acquisition menu.
To divide the data file, click Manual Save or choose Manual
Save from the Acquisition menu.
To stop recording, click Stop Recording or choose
Stop Recording from the Acquisition menu.
When Run is
displayed
Changes to red when
recording starts
A list of data files created in the past
Select a file and click the Open button
to start the Viewer. (You can also
double-click to start the program.)
Record time
Changes to red when recording starts
Display when the program is
waiting for the record start
condition to be met
1-16
For the procedure for setting the record start
conditions and setting the data file save
destination and file name, see page 1-7.
Display when processing record stop
IM WX103-01E
1.2 MXLOGGER Operation Guide
1
For details, see
section 1.5.
Before Using the Software
Start the
Viewer
Click the
button on the Logger toolbar or
choose Data Viewer from the File menu.
2
If the Logger is not running, choose Programs > YOKOGAWA DAQWORX > MXLOGGER > Viewer.
The Viewer window
appears.
3
4
Display the recorded
data
For details,
see section
3.1 and 3.2.
1 Click the
5
button on the toolbar or choose Open from the File menu.
The Open dialog box opens.
2 Select the folder that was specified as the save
destination of the record file.
Index
4 Click here.
3 Select the file
you wish
to load.
Information about
the selected file
5 If you open a data file that was recorded using the Logger, a dialog box opens asking you
whether you wish to synchronize the data file before the waveform display window opens.
* The time stamp of the MX100 main module
is attached to the data. The measurement
time is corrected by synchronizing. If you are
not synchronizing the data, a Select Unit No.
dialog box opens. Select the unit.
6 Click Yes or No.
Switch the display zone
Switch the grid density
Switch the active channel
Switch the
display group
Move the cursor to the
point wherethe alarm changed
Switch between channel number,
tag No., and tag comment
Alarm display
ON/OFF
Clip ON/OFF
Grid density
Waveform
display
window
Background
color density
Zone display
section ON/OFF
Channel ON/OFF
IM WX103-01E
Channel number and unit
Y-axis
1-17
1.2 MXLOGGER Operation Guide
Read values using
cursors
1 Click the tab of the group in which you wish to read values using the cursors
For details, see
section 3.3.
Measurement point
3 If you wish to read another
point simultaneously,
drag the cursor.
(Cursor B)
2 Click the position where you
wish to read the data value
(Cursor A)
4 From the Window menu, choose Control.
The Control window
appears.
Move Cursor A
Data number at the
Cursor A
Time at the Cursor A
Time at the Cursor B
Data number at the Cursor B
Move Cursor B
Time between Cursors A and B
Difference in the data number between Cursors A and B
Alarm indication
Channel color
Channel number and Value at the Value at the
measurement unit
Cursor A
Cursor B
Value at the Cursor B position – value at the Cursor A position
Perform statistical
computation over
an area of data
1 From the Window menu, choose Statistics.
For details, see
section 3.4.
The Statistics window
appears.
Data number at the
start position of the
Channel
Max. value –
statistical computation
display color over an area
Minimum value Min. value
RMS value
Scroll the
channel
Channel number
and measurement
unit
1-18
Data number at the
Maximum value
end position of the
Mean value
statistical computation
Copy data to the clipboard
over an area
IM WX103-01E
1.2 MXLOGGER Operation Guide
1
For details, see
section 3.7.
Before Using the Software
Convert the data
format
1 From the Convert menu, choose To ASCII, To Excel, or To Lotus.
2
The respective conversion dialog box opens.
2 Set the items in the conversion dialog box.
3
Select whether to set the range to be converted using groups or channels
Range of group numbers to be converted
Select the range of channels to be converted
(Show the channel selection dialog box)
Select the record interval
(Only the channels with the selected record interval
will be converted)
Measurement time of the data at the specified start
and stop points
Step when converting data at certain intervals
4
5
Specify the format when converting files
When changing the save destination or file name
3 Click OK.
Save destination and file name
Data range to be converted
(You can specify the data range using the cursor before opening this dialog box.)
Print the displayed data
For details, see
section 3.8.
1 Show the window you wish to print
If multiple windows are opened, click the window you wish to print to make it active.
2 From the File menu, choose Print Setting.
The Printout Setting dialog
box opens.
3 Set the items in the Printout Setting dialog box.
Select whether to print all or the range specified by the cursors
Switch to settings for numeric values
(The only item for numeric printing is Range only.)
Select monochrome or color print
Select the groups when Selected
Groups is selected
(Show the group selection
dialog box)
4 Click OK. Enter the comment to be printed
Select the group to be printed
5 From the File menu, choose Print.
In the Print dialog box that opens, click OK. Printing is executed.
IM WX103-01E
1-19
Index
1.3
PC System Requirements
PC
A PC that runs one of the OS above, and that meets the following CPU and memory
requirements.
When Using Windows 2000 or Windows XP
Pentium 4, 1.6 GHz or faster Intel x64 or x86 processor; 512 MB or more of memory
When Using Windows Vista
Pentium 4, 3 GHz or faster Intel x64 or x86 processor; 2 GB or more of memory
When Using Windows 7
32-bit edition: Intel Pentium 4, 3 GHz or faster x64 or x86 processor; 2 GB or more of
memory
64-bit edition: Intel x64 processor that is equivalent to Intel Pentium 4, 3 GHz or faster;
2 GB or more of memory
Note
• The specifications above are for a desktop PC, not a notebook PC.
• Even if the PC meets the specifications above, monitoring/recording may not be possible as
configured depending on the setup conditions (alarms, computations, etc.) on the Logger.
Operating System
Run DAQWORX under any of the following operating systems.
• Windows 2000 Professional SP4
• Windows XP Home Edition SP3
• Windows XP Professional SP3 (excluding Windows XP Professional x64 Editions)
• Windows Vista Home Premium SP2 (excluding the 64-bit editions)
• Windows Vista Business SP2 (excluding the 64-bit editions)
• Windows 7 Home Premium, SP1 (32-bit and 64-bit editions)
• Windows 7 Professional, SP1 (32-bit and 64-bit editions)
The language displayed by the software under different language versions of the OS are
as follows.
OS Language
Japanese
Other
Software Language
Japanese
English
File System
NTFS is recommended. With FAT32, the number of files that can be saved in a single
folder is much smaller. If the limit is reached and additional files cannot be saved, the
software will not function normally. To prevent this, please periodically stop recording by
the software and move the data to a different folder.
CD-ROM Drive
The drive is used to install the software.
Free Hard Disk Space and RPMs
Free disk space: 200 MB or more (more may be required depending on the amount of
data to be acquired)
RPMs:
7200 rpm or faster recommended
Monitor
A video card that is recommended for the OS and a display that is supported by the OS,
has a resolution of 1024×768 or higher, and that can show 65,536 colors (16-bit, high
color) or more.
1-20
IM WX103-01E
1.3 PC System Requirements
1
Printer and Mouse
Printer and mouse compatible with the OS that you are using.
Before Using the Software
Sound Board
2
A sound board is required for sounding the alarm on the PC when alarms occur.
Ethernet Port
An Ethernet compatible port (10BASE-T or 100BASE-TX (100BASE-TX recommended)).
3
4
5
Index
IM WX103-01E
1-21
1.4
Setting Up MXLOGGER
Setup Procedure
Set up the MXLOGGER according to the WX1000 DAQWORX Install & Operation Guide
(IM WX1000-01E) provided on the DAQWORX Installation CD.
Installation Result
If the software is properly installed, a folder named MXLOGGER is created in the
specified directory (by default, C:drive containing the OS\DAQWORX). MXLOGGER is
registered in the program list, and Logger, Viewer, and Calibrator are registered as in the
sub list.
Note
The Data folder and Work folder are created inside the Logger folder. The record files are
saved in the Data folder. The Work folder is used to store temporary files by the Logger. Do not
delete this folder.
1-22
IM WX103-01E
1.5
1
Starting and Exiting Software Programs
Before Using the Software
Procedure
2
Starting the Software Programs
As shown in the figure below, choose Start > Programs > YOKOGAWA DAQWORX >
MXLOGGER > Logger, Viewer, or Calibrator.
3
4
5
Note
If you enable the automatic start function, Logger starts automatically upon starting of
monitoring/recording. For details, see section 2.3, “Setting the Data Acquisition Conditions.”
Index
Exiting the Software
From the File menu, choose Exit.
The figure below shows an example for the Logger.
Note
When exiting the Viewer, a dialog box used to confirm whether the display settings are to be
saved opens if the display settings have been changed.
IM WX103-01E
1-23
Chapter 2
Logger
2.1
1
Searching MX100 Data Acquisition Units and
Configuring the Network
Procedure
Note
• Connecting MX100s and the PC to a backbone network before proper IP addresses are
assigned to the MX100s may adversely affect other connected devices on the network.
• If running under Windows XP or Windows Vista, connection problems may occur if
the firewall function is enabled. For details, see the MX Standard Software User’s
Manual (IM MX180-01E).
Searching for MX100s
3
4
5
When Starting the Logger for the First Time
1. Start the Logger according to the procedure given in section 1.5.
The System screen of the Main window appears. Icons indicating the MX100s that
are connected to the same network segment are displayed in the MXs nearby area.
Displays the icon of the MX100 in the same segment
Click here to display detailed
communication settings of
the MX100.
Instrument number (NO.) of the MX100
Note
If multiple MX100s are connected in the same network segment, multiple icons are displayed.
In this case, the instrument number that is marked on the name plate of the main module is
displayed on the icon indicating the MX100 (Serial No. on the screen) allowing you to identify
each MX100.
IM WX103-01E
2
Logger
Before carrying out the procedure below, turn ON the power to the relevant MX100s and
connect the MX100s to the network using Ethernet cables.
2-1
Index
2.1 Searching MX100 Data Acquisition Units and Configuring the Network
If the Logger Has Been Started Once Before
1. Start the Logger.
The screen of the Main window that was displaying when you exited the Logger the
previous time is displayed.
2. Click System.
The System screen appears.
Click here.
3. Click the Search button in the MXs nearby area.
Icons indicating the MX100s that are connected to the same network segment are
displayed in the MXs nearby area.
Click here.
Displays the icon of the MX100 in the same segment and the communication settings (only during detailed display)
Setting Up the Network
1. Click the Network Config. button in the MXs nearby area of the System screen.
The Network Configuration dialog box opens.
Checks the MX100 to be set
(-CALL- display)
Click here.
2-2
IM WX103-01E
2.1 Searching MX100 Data Acquisition Units and Configuring the Network
2. Select the Edit check boxes of the MX100s whose network configuration you wish to
change.
The Machine Name, Address, Subnet Mask, and Default Gateway items turn into
text boxes.
1
2
Logger
3
Machine name
(up to 64 characters)
IP address
Default settings can be used for local connection.
4
Select this check box.
Check boxes do not appear for MX100s in use when searching (the Info. column indicates Using).
3. Refer to the explanations below, and enter the required information in each text box.
4. Click the Apply button.
A dialog box with the message “Apply the edited network configuration of MXs?”
appears.
5. Click OK.
When the configuration is complete, the Info. column indicates Complete. If
configuration fails, Fail is displayed.
6. Click the Close button of the Network Configuration dialog box.
Explanation
Machine Name
As necessary, you can enter a name that is easy to identify using up to 64 characters.
Serial ID
The instrument number (NO.) marked on the name plate of the main module.
IP Address (Address)
Enter the IP address to assign to the MX100. The default address is 127.1.1.XX (where
XX is a unique number for the device). This default address cannot be used even when
the MX100 is connected locally to the PC. You must change to a different address such
as 192.168.1.XX (where XX is a value between 1 and 254). When making connections
locally, do not set the PC to obtain the IP address automatically. Enter the IP address
manually to an address other than the one that is to be assigned to the MX100.
Note
• To connect to the MX100 by entering a host name in the Host box in the Configuration
area of the System screen, the host name (name used on the TCP/IP network) must be
registered in a DNS server and the DNS server must be connected to the network. The
MX100 does not have a function for registering host names to the DNS server. For the
procedure for registering host names, consult your network administrator.
• To initialize all settings including the IP address to the their factory default values, turn OFF
the power to the main module, turn OFF dipswitch number 5 on the main module, and
turn ON the power. When the 7-segment LED displays bF, all settings are initialized. After
confirming the bF display on the 7-segment LED, turn OFF the power to the main module,
turn dipswitch number 5 back ON, and then turn ON the power to the main module.
IM WX103-01E
2-3
5
Index
2.1 Searching MX100 Data Acquisition Units and Configuring the Network
Subnet Mask
Enter the mask value used when determining the subnet network address from the IP
address. The default value is 255.255.255.0. When connecting to the PC locally, this
value does not need to be changed. In this case, set the subnet mask on the PC also to
255.255.255.0.
Note
Consult your network administrator for the subnet mask value. You may not need to set the
value.
Default Gateway
Set the IP address of the gateway (default gateway) used to communicate with other
networks. The default value is 0.0.0.0. When connecting to the PC locally, this value
does not need to be changed. In this case, you do not have to set the default gateway on
the PC.
Note
Consult your network administrator for the IP address of the default gateway.
Connected User (User)
Displays the computer name of the PC that is connected to the MX100. This item is
blank (- - - - -) if there is no PC connected to it.
Software
Displays the name of the software program that is connected to the MX100. This item is
blank (- - - - -) if there is no software program connected to it.
• MXLOGGER:
Logger of the MXLOGGER
• MX100 Standard: Integration Monitor of the MX100 Standard Software
• MX Calibrator:
Calibrator of the MXLOGGER or the MX100 Standard Software
• API:
Software application created using the MX100/DARWIN API (product sold separately)
2-4
IM WX103-01E
2.2
1
Configuring the System
Procedure
Selecting the MX100s That Are to Monitor the Data
Drag the MX100 icon displayed in the MXs nearby area onto the Configuration area. A dialog
box with the message “Invalid modules exist. Do you get configuration after reconstructing?”
appears. Click Yes. To monitor the data from multiple MX100s, repeat this procedure.
2
Logger
To perform the procedure below, you usually have the icons of the MX100s you wish to
connect shown in the MXs nearby area of the System screen according the instructions
given in section 2.1, “Searching MX100 Data Acquisition Units and Configuring the Network.”
3
4
5
Index
Drag and drop the icon of the MX100 you wish to connect to the Configuration area
The order in which the MX100 icon is dragged and dropped determines the unit number,
which is the highest two digits of the channel number. The unit number of the first MX100
that is dragged and dropped is assigned the number 0. The following MX100s are assigned
numbers 1 to 19 in order. If you wish to change the unit number, click the MX100 you wish
to change and click the Up or Down button to move the display position up or down.
Unit number
To change the unit number of the MX100, click the MX100 you wish to change and then click here.
To remove the MX100 that was placed in the Configuration area from the system,
click the relevant MX100 and then click here.
Note
Instead of dragging and dropping the icons onto the Configuration area, you can also drag and
drop the icons to the respective measurement groups under Meas Groups. If you do so, all input
modules of the MX100 are assigned to the measurement group where the icon was dropped.
IM WX103-01E
2-5
2.2 Configuring the System
Retrieving/Setting Module Configuration Information
If the MX100 is connected to the network and is not being used by another user, the
module information is automatically retrieved when you drag and drop the MX100 icon.
Module configuration
Slot number (see the MX100 Data Acquisition Unit User's Manual)
Red and blue indicate that a module with a minimum measurement interval of 10 ms and a module
with a minimum interval of 100 ms are installed, respectively.
If the MX100 is being used by another user and you drag the MX100 icon, the module
configuration is not retrieved. In this case, you select the modules by slots using the
module selection list box. If the other user releases the connection after you have
dragged and dropped the MX100 icon, you can click the Get Information button to
retrieve the module configuration.
If another user drops the connection with this MX100, you can click here to retrieve the module configuration.
If the target MX100 is being used by another user, select the module by slots from here.
Note
For instructions on configuring a system using MX100s that are not connected, see “Configuring
a System Using MX100s That Are Not Connected” in this section.
Structure Tab Slots When Selecting the VTD 30-CH Module
One unit of the VTD 30-CH module requires three slots worth of space when installing
on the base plate. When you select the VTD 30-CH module (MX110-VTD-L30) in the
structure tab, two slots to the left are occupied by the VTD 30-CH module. If another
module already exists on the left, a message, “Modules of Slot□ - Slot□ will be changed.
Ok to continue?” appears. Click OK to change to the VTD 30-CH module. You cannot
select the VTD 30-CH module if there are not two available slots to the left of the slot
where the module is installed.
On slot 1 to the left where the module is selected, if you
select the VTD 30-CH module, a dialog box is displayed.
Changes to the VTD 30-CH module
Click OK to change
Slots 2 and 3 cannot be selected
2-6
IM WX103-01E
2.2 Configuring the System
1
Assigning Input Modules to Measurement Groups
Auto Assignment
Click the Auto Assignment button in the Configuration area. A dialog box with the
message “Assign all modules to appropriate measuring groups?” appears.
2
Logger
3
4
Click here.
5
Index
Click OK.
Assigned to an appropriate measurement group*
* In this example, modules with a minimum measurement interval of 100 ms are
assigned to Meas Group 1 and those with a minimum measurement interval
Selecting the Measurement Group in the Configuration Area
Click the word “Undefined” (or the
icon) of the slot with an input module selected and
select the measurement group. The monitor interval that is assigned to the measurement
group can be confirmed on the Acquisition setup screen.
Click here.
Note
To improve the PC performance, it is recommended that whenever possible, only a single
measurement group be assigned to a single unit.
Selecting the Measurement Group in the Meas Groups Area
Drag the module icon in the Undefined area onto the desired measurement group area.
Drag and drop the icon of the input module to a measurement group.
IM WX103-01E
2-7
2.2 Configuring the System
Note
You can select multiple module icons simultaneously to be dragged and dropped by selecting
the module icons in the Meas Groups area while holding down the Shift or Ctrl key.The Shift
key is used to select a range of icons. The Ctrl key is used to select icons individually.
Configuring a System Using MX100s That Are Not Connected
Click the Add button in the Configuration area to display a virtual MX100. In this area,
you can configure the module and select the measurement group using the procedure
described earlier. This function is useful when configuring MX100s that are not connected
in advance.
Click here.
Enter the IP address or
host name of the MX100 to connect
Virtual MX100
Setting the A/D Integration Time
From the A/D Integration Time list box in the Configuration area, select AUTO, 50 Hz,
or 60 Hz.
Select the A/D integration time.
Setting the Temperature Unit for TC and RTD
From the Temp. Unit list box, select C or F.
Select the temperature unit.
MX100 Response Check
Click the Response button in each MX100 in the Configuration area. If the MX100
is connected, the 7-segment LED on the main module of the corresponding MX100
displays —CALL—.
Click here.
2-8
IM WX103-01E
2.2 Configuring the System
1
CF Card Information
You can check the status, maximum size, and free area of the CF card inserted into
the MX100. To check this information, click the CF Information button of the unit in the
Configuration area.
Logger
Click here.
2
3
4
Note
If communications fail when downloading the CF information, a dialog box appears with the
message, “Failed to acquire CF information. Check the host name and instrument status.”
5
Setting the Write Mode of the CF Card
If you wish to save new data files by deleting old files when there is no more free space
on the CF card, select the Use CF Card Cyclically check box in the Configuration area.
To stop the save operation when there is no more free space, clear the check box.
Click here.
Explanation
Unit Number
The unit number is assigned in the displayed order in the Configuration area of the
System screen from 0 to 19. The unit number is the highest two digits of the five-digit
channel number. For example, if the unit number is 2, the channel number is 02XXX
(where XXX is the channel number in the unit).
Measurement Group
The system is capable of monitoring the data using three different measurement
intervals. Therefore, each input module is assigned to any of the three measurement
groups. You can set the measurement interval (Mon. Interval on the screen) of each
measurement group on the Acquisition setup screen (see the next section).
Setting the A/D Integration Time of the Universal Input Modules
Settings are possible under the following conditions.
• When the measurement interval of the 4-CH, High-Speed Universal Input Module is 50 ms
• When the measurement interval of the 10-CH, Medium-Speed Universal Input Module
is 500 ms
• When the measurement interval of the 30CH, Medium-Speed DCV/TC/DI Input
Module is 1s.
• When the measurement interval of the 6-CH, Medium-Speed 4 Wire RTD Resistance
Input Module is 500 ms
• When the measurement interval of the 4-CH, Medium-Speed Strain Input Module is 200 ms
In these cases, you can select from the following. The default setting is AUTO.
• AUTO: Automatically sets the corresponding A/D integration time for 50 Hz or 60 Hz
according to the frequency of the power supplied to the main module.
• 50 Hz: Sets the integration time to 20 ms.
• 60 Hz: Sets the integration time to 16.67 ms.
Setting the Write Mode of the CF Card
IM WX103-01E
If a CF card is inserted and the connection to the MX100 is cut off while the measured/
computed is being recorded, the measured data is saved (backed up) to the CF card.
If the Use CF Card Cyclically check box is selected and measured data is saved in
backup mode, the data continues to be saved by deleting the oldest data file when there
is no more free space on the CF card. If the check box is cleared, the data save operation
stops when there is no more free space on the CF card. This setting applies to all units.
2-9
Index
2.3
Setting the Data Acquisition Conditions
This is an explanation of data acquisition condition settings, automatic start function
settings, and settings for measurement and computation channels to be recorded.
Data Acquisition Conditions
Click Acquisition. The Acquisition setup screen is displayed, and the following items can
be set.
• Monitor interval assignments to measurement groups and record step (record interval)
• Record start/stop conditions
• Data file settings
Note
You can set the monitor interval only when monitoring is stopped.
Procedure
Assigning Monitor Intervals to Measurement Groups and Setting the
Record Step (Record Interval)
1. In the Monitor Interval & Record Step area, select the monitor intervals of Meas
Group 1, Meas Group 2, and Meas Group 3 from the Mon. Interval list boxes.
The interval cannot be assigned while data monitoring is in progress.
Select the acquisition interval for each measurement group
The selectable acquisition interval varies depending on the types of modules assigned to
the same group and the measurement range.
Automatically set to the minimum acquisition interval of the measurement group with modules assigned
or 100 ms, whichever is less (cannot be changed).
2. Enter the record step in the Record Step text box.
You cannot set the step while recording is in progress. You can confirm the record
step in the Record Information area.
Enter the multiplication factor with respect to the acquisition interval of
the measurement group or math group (record step)
Record interval =
acquisition interval × record step
Setting the Record Start/Stop Conditions
1. In the Recording Condition & File area, select On Record, Fixed Time, Interval, or
Math under Start Condition.
If you select Fixed time, enter the start date/time. If you select Interval, enter the
interval condition.
2. Select Continuously, Fixed Period, Fixed Time, Interval, or Math under Stop
Condition.
If you select Fixed Period, enter the record time. If you select Fixed Time, enter the
stop date/time. If you select Interval, enter the interval condition.
3. To reset the computed results at the same time recording is started, select the Math
Clear on Start check box.
2-10
IM WX103-01E
2.3 Setting the Data Acquisition Conditions
Immediately start recording with record start operation
Start recording when the specified date/time is reached
Start recording when the specified interval condition is met
Start recording when a certain condition* is met
in the computation
Stop recording when a certain condition* is
met in the computation
*See the explanation in this section, “Measurement and Computation Channels to Be Recorded.”
Setting the Data File
1. Enter the file save destination in the Directory box in the Recording Condition and
File area.
Click the Browse button to open the Browse for Folder dialog box in which you can
select the save destination folder. You can also select the save destination folder,
click the New Folder button, and enter the folder name to create a new folder within
the save destination folder and make it the save destination.
2. Enter the name of the data file in the File Name box.
To add the record date to the file name, select the Add Date check box. To add the
record time to the file name, select the Add Time check box. If you select both check
boxes, the record data and time are added to the file name.
If a file with the same name already exists, a hyphen and a four-digit sequence
number starting with 0000 is added to the end of the file name.
3. To divide the file at specified intervals, select Fixed Period or Interval under
Division. If you select Fixed Period, enter the time. If you select Interval, select or
enter Monthly, Weekly, Daily, Hourly, date/day, or time.
4. To attach a comment to the file, enter the comment text in the Comment box.
5. To apply a limit to the number of files per measurement that can be created in
the folder, select the check box then enter a limit from 4 to 100. When the limit is
exceeded, old files are deleted.
To select the save destination from the Browse for Folder dialog box, click the folder icon.
Name of the record file
Select the check box when adding the record date/time
File save destination
information to the specified file name
The time when data is recorded to a new file every specified time interval
The interval when data is recorded to a new file every specified interval
File comment (up to 127 characters)
Select the box and enter a number from 4 to 100 to limit the number of files created
Browse For Folder dialog box
Click and enter the folder name to create a new folder within the save destination folder
IM WX103-01E
2-11
2
Logger
Stop recording when the specified interval
condition is met
Select this check box to reset the computed result at
the same time recording is started
Immediately stop recording with record stop operation
Stop recording when the specified time elapses
Stop recording when the specified date/time is reached
1
3
4
5
Index
2.3 Setting the Data Acquisition Conditions
Automatic Start Function
To automatically start monitoring or recording when loading files, perform the following.
Procedure
1. From the File menu, choose Auto Start Configuration.
2. To start monitoring when a file is opened, select the check box in the Auto Start
Configuration dialog box.
3. To start recording when a file is opened, select the “The record is started
automatically at the time of the file open” check box in the Auto Start Configuration
dialog box.
2-12
IM WX103-01E
2.3 Setting the Data Acquisition Conditions
Setting the Measurement Channels and Computation Channels to Be Recorded
Click here.
1
2
Logger
1. Click Channel. The Channel setup screen appears.
2. Click the Meas. Channel tab to set measurement channels to be recorded; click the
Math Channel tab to set the computation channels to be recorded.
3. Select the Record check boxes of the channels whose measurement/computation
data you wish to record.
3
4
Click the channel of the measured data you wish to record (the same for Math Channel)
5
Explanation
Measurement Groups and Monitor Intervals
A data measurement (monitor) interval is assigned to each of the three measurement
groups. The monitor update interval of the data and alarm detection interval follow the
monitor interval. However, if the specified monitor interval is short, the monitor update
interval of the data may be slower depending on the PC environment. If Monitor Interval
is set greater than or equal to 2 min, the Logger acquires data from the MX100 at the
specified monitor interval, but the measurement interval and alarm detection interval on
the MX100 are 1 minute.
Note
The shortest interval that you can specify for the monitor interval is the longest measurement
interval of the shortest measurement intervals of all the input modules assigned to the same
measurement group. For example, if an input module with the shortest measurement interval of
10 ms and an input module with 100 ms are assigned, 100 ms is the shortest interval that can
be specified for the group.
Record Step of Measurement Channels
The record interval is the interval at which the data of measurement channels is saved
to a storage medium such as a hard disk. It is set as an integer multiple of the monitor
interval (up to ×128).
Monitor Interval and Record Step of Computation Channels
The monitor interval of computation channels (computation interval) is the shortest
monitor interval of the measurement group or 100 ms, whichever is greater. The record
step set as an integer multiple of the monitor interval (up to ×128).
Record Start Condition
Select the start condition for saving the data of measurement/computation channels from
the following.
• On Record
Immediately starts recording when the Start Recording button is clicked or Start
Recording is chosen from the Acquisition menu.
• Fixed Time
Starts recording at the specified date/time. Set the date/time as “year/month/day
hours:minutes:seconds” If the specified time has already been passed, the operation
is the same as On Record.
• Interval
Starts recording at the specified time every day or the specified day. Set the time as
“hours:minutes:seconds”
IM WX103-01E
2-13
Index
2.3 Setting the Data Acquisition Conditions
• Math
Starts recording when the StartRec() event function (see section 2.5, “Event
Functions” is executed on a computation channel. This is valid when you click the
Start Recording button and the word “Waiting” is displayed.
Record Stop Condition
Select the condition for stopping the recording from the following:
• Continuous
Immediately stops recording when the Stop Recording button is clicked or Stop
Recording is chosen from the Acquisition menu.
• Fixed Period
Stops recording after the specified time elapses after the recording is started. Set the
time as “hours:minutes:seconds”
• Fixed Time
Stops recording at the specified date/time. Set the date/time as “year/month/day
hours:minutes:seconds” If the specified time has already been passed, the operation
is the same as Continuously.
• Interval
Stops recording at the specified time every day or the specified day. Set the time as
“hours:minutes:seconds”
• Math
Stops recording when the StopRec() event function is executed on a computation
channel.
Record (Save) Destination and File Name of the Data File
Select the record (save) destination on the hard disk of your PC. The default setting is
the Data folder in the MXLOGGER folder where the MXLOGGER is installed.
Note
Do not set the save destination to a storage medium other than the hard disk or to a network
drive. Doing so may cause problems in terms of performance.
The default file name is “data” If the multiple files are created, it is “data-XXXX” (where
XXXX is a four-digit sequence number starting with 0000). The extension is .mxd. You
can also add the file creation date and time to the file name as follows.
• When both the date and time are added:data-0314-1316 (recording started at 13
hours 16 minutes on March 14)
• When only the date is added:data-20030314 (recording started on March 14, 2003)
• When only the time is added:data-1316 (recording started on 13 hours 16 minutes)
If a file with the same name already exists, a hyphen and a four-digit sequence number
starting with 0000 are added to the end of the file name.
Setting the Data File Divisions
The file can be divided every specified time interval. Set the time as “hours:minutes:
seconds”
Even if file division is not specified, the file is automatically divided when the size of a
single file exceeds approximately 1 GB or when the number of data points of any of the
channels in the file exceeds 2 million.
Number of Characters That Can Be Entered for the Comment of the Data
File
The number of characters that can be entered is up to 127 characters.
2-14
IM WX103-01E
2.4
1
Setting the Measurement Conditions
(Measurement Channel Settings)
Procedure
2
Logger
1. Click Channel. The Channel setup screen appears.
2. Click the Meas Ch tab.
3
Setting the Input Mode
3. Select the input mode from the Mode list box.
4
Setting the Measuring Range
4. Select the measurement range from the Range list box.
Setting the Span
5. Click the Min box or Max box under Span and enter the minimum or the maximum
value of the span.
Setting the Scale (Only When Scaling)
6. Select the Use check box under Scale.
7. Select the decimal point position from the Point list box under Scale.
8. Click the Min box or Max box under Scale and enter the minimum or the maximum
value of the scale.
9. Click the Unit box and enter the unit of the scaled value.
Setting the Reference Channel for Difference Input (Valid Only When Measuring
the Difference with Respect to the Measured Value of the Reference Channel)
10. Select the Use check box under Difference Input.
11. Select the reference channel for the difference input from the Ref. Ch. list box under
Delta.
* Cannot be used when Mode is set to RRJC
Select the input type
When changed, the Range and the items to the right of it are initialized (excluding Tag No. and Tag Comment)
Select the measurement range
When changed, Span and the items to the right of it are initialized (excluding Tag No. and Tag Comment)
Minimum/Maximum value of span
Select the check boxes here to perform scaling*
Decimal point position of the scale*
Check here to select
the monitor channel
IM WX103-01E
Maximum/Minimum values of the scale*
Check here to measure the difference input
(difference with respect to the measured value
of the reference channel)*
Select the reference channel for
difference input*
2-15
5
Index
2.4 Setting the Measurement Conditions (Measurement Channel Settings)
Setting the Remote RJC Reference Channel (Valid Only When the Input Mode Is
Set to RRJC (TC))
12. Select the reference channel for the remote RJC from the Ref. Ch. list box under
RRJC.
Note
If the reference channel setting for difference input or the reference channel setting for the
remote RJC is inappropriate when switching from the Channel screen to the Display or Monitor
screen, a Channel dialog box opens (see the figure below). To disable the measurement
channels with inappropriate settings (clear the Monitor check box on the Channel screen) and
move to the Display or Monitor screen, click Yes. To change the settings of the inappropriate
measurement channels without moving to the next screen, click No.
Setting the Unit, Tag Number, and Tag Comment
13. Click the Unit, Tag No., and Tag Comment text box and enter the unit, tag number,
and tag comment, respectively.
Setting the Time Constant of the First-Order Lag Filter (Valid Only When the
Input Mode Is Set to Something Other than DI)
14. Select the time constant from the Filter list box.
Setting the Burnout (Valid Only When the Input Mode Is Set to TC)
15. Select the direction in which the measured value is set off the range (+OVER or –
OVER) when a burnout occurs from the Burnout list box.
Setting the RJC (When the Input Mode Is Set to TC)
16. Click the Type box under RJC and select Internal or External.
17. If you select External, click the Volt box under RJC and enter the compensation
voltage.
Select the reference channel for the remote RJC
(valid only when the input mode is set to RRJC (TC))
Enter the unit (up to six characters, only
when the Use check box of Scale is selected)
Enter the tag No.
(up to 15 characters)
Enter the tag comment
(up to 30 characters)
2-16
Set the time constant of the first-order
lag filter
(when the input mode is other than DI)
Set the burnout
(valid only when the input mode
is set to TC)
Set the RJC
(valid only when the input
mode is set to TC)
IM WX103-01E
2.4 Setting the Measurement Conditions (Measurement Channel Settings)
1
Setting the Initial Balancing for Strain Input Channels (Only When the Input
Mode Is Set to STR)
Set the initial balance for strain input channels (only when the input mode is set to STR)
2
Logger
18. Click the Initial Balance button under Strain, or the Execute button under Reset.
The Executing Initial balancing dialog box appears, and Executing is displayed in
the Status box. When Execution is complete, the result is displayed in the Status
box.
3
4
5
Index
Note
• You can execute initial balancing and reset the initial balance value on multiple recording
channels at once by selecting the channels and clicking the Execute All button.
Channel on which to perform initial
balancing to select them
Collective execution ON/OFF button
Selected channels are displayed with red
characters against a gray background
• To execute initial balancing on a strain input module, you must enter channel settings and
send them. Therefore, if invalid channel settings are entered, a dialog box will appear
prompting you to correct the settings.
IM WX103-01E
2-17
2.4 Setting the Measurement Conditions (Measurement Channel Settings)
Importing Tag Numbers and Tag Comments
You can import just the tag numbers and tag comments from the saved setup data and
replace the current tag numbers and tag comments with the imported information.
From the File menu, choose Import Tag. Then, select an MXLOGGER project file (a file
with the .mxe extension) in the Open dialog box.
Only the tag numbers and tag comments are imported.
Select the MXLOGGER project file
(file with .mxe extension) you wish to load
Note
When you carry out the procedure above, the tag numbers and tag comments of computation
channels are also imported.
When Setting the Measurement Conditions for Each Channel Individually
Click a desired channel number and enter the settings in the area on the right to set the
measurement conditions.
Click the channel number to be configured
Click here to show or hide the Meas Ch. area
Clicking the slot number here displays the channel settings in the
corresponding module in red
2-18
Measurement channel to be configured
To move to the next channel
To move to the previous channel
IM WX103-01E
2.4 Setting the Measurement Conditions (Measurement Channel Settings)
1
Explanation
Input Mode and Measurement Range
MXLOGGER
Software version
R2.05 or later
*1
Connectable module types
or setting items
30ch module
MX110-VTD-L30
GOST range
MX100 Hardware
*2
Style Number
S3
S2
S1
Yes
No
No
Yes
No
No
Notes
3
4
Can be set only for MX110-UNV-M10,
MX110-UNV-H04, MX110-V4R-M06, and
MX110-VTD-L30
Yes: Setting and operation allowed
No: Setting possible, but not operation
*1 To check the version, see section 2.16, “Displaying the Software Version and Other
Information.”
*2 The style number is printed on the MX100 main module name plate.
5
On the channels of the universal input module, select from the modes below according
to the input signal. For details of the measurable range, measurement accuracy, and
resolution, see chapter 4, “Specifications” in the MX100 Data Acquisition Unit User’s
Manual (in the manual CD-ROM)
• VOLT (DC voltage)
Select the measurement range from 20 mV, 60 mV, 200 mV, 2 V (default), 6 V, 20 V,
100 V, 60 mV (HQ), 1 V (HQ), and 6 V (HQ). HQ denotes high resolution.
Note
Current input is possible by attaching a shunt resistor to the input terminal and converting to voltage
input. The shunt resistors in the table below are available for purchase separately. For example, a
250 Ω shunt resistor is used to convert the signal in the range of 1 to 5 V for 4 to 20 mA input.
Part Name
Shunt resistor
(for clamp terminal)
Shunt resistor
(for screw terminal)
Model
415920
415921
415922
438920
438921
438922
Resistance
250 W ± 0.1%
100 Ω ± 0.1%
10 Ω ± 0.1%
250 Ω ± 0.1%
100 Ω ± 0.1%
10 Ω ± 0.1%
• TC (Thermocouple)
Select the thermocouple type (referred to as Range in the setup) from Type-R (default), Type-S,
Type-B, Type-K, Type-E, Type-J, Type-T, Type-N, Type-W, Type-L, Type-U, and KpvsAu7Fe,
PLATINEL, PR40-20, NiNiMo, WRe3-25, W/WRe26, Type-N(AWG14), and Type-XK.
• RTD1 (resistance temperature detector, measurement current: 1 mA) on the 4-CH,
High-Speed Universal Input Module
Select the RTD type (referred to as Range in the setup) from Pt100 (default), JPt100,
HQ Pt100, HQJPt100, Ni100:SAMA, Ni100:DIN, Ni120, RN Pt100, RN JPt100 and
Pt100G. HQ and RN denote high resolution and noise resistance, respectively.
IM WX103-01E
2
Logger
The measurement channel settings differ depending on the combination of the
MXLOGGER software version and the MX100 hardware style number. The table below
shows the relationship between MXLOGGER measurement channel settings (by
software version) and the MX100 hardware style.
2-19
Index
2.4 Setting the Measurement Conditions (Measurement Channel Settings)
• RTD2 (resistance temperature detector, measurement current: 2 mA) on the 4-CH,
High-Speed Universal Input Module
Select the RTD type (referred to as Range in the setup) from Pt100 (default), JPt100,
HQ Pt100, HQ JPt100, Pt50, Cu10:GE, Cu10:L&N, Cu10 :WEED, Cu10:BAILEY, J263B,
Cu10 a=0.00392, Cu10 a=0.00393, Cu25, Cu53, Cu100, Pt25, HQ Cu10:GE, HQ Cu10:
L&N, HQ C10:WEED, HQ Cu10:BAILEY, RN Pt100, RN JPt100, Cu100G, Cu50G, and
Cu10G. HQ and RN denote high resolution and noise resistance, respectively.
The RTD2 selection is not available on the 10-CH, Medium-Speed Universal Input
Module or the Six-Channel, Medium-Speed, Four-Wire RTD Resistance Input Module.
• RTD1 (resistance temperature detector, measurement current: 1 mA) on the 10-CH,
Medium-Speed Universal Input Module/Six-Channel Medium-Speed Four-Wire RTD
Resistance Input Module
Select the RTD type (referred to as Range in the setup) from Pt100 (default), JPt100,
HQ Pt100, HQ JPt100, Ni100:SAMA, Ni100:DIN, Ni120, Pt50, Cu10:GE, Cu10:L&N,
Cu10 :WEED, Cu10:BAILEY, J263B, Cu10 a=0.00392, Cu10 a=0.00393, Cu25,
Cu53, Cu100, Pt25, HQ Cu10:GE, HQ Cu10:L&N, HQ Cu:WEED, HQ Cu10:BAILEY,
Pt100G, Cu100G, Cu50G, and Cu10G. HQ denotes high resolution.
• RTDEx (resistance temperature detector, measurement current: 0.25 mA) on the SixChannel, Medium-Speed Four-Wire RTD Resistance Input Module
Select the RTD type (referred to as Range in the setup) from Pt500 (default setting) or
Pt1000.
• OHM (resistance) on the Six-Channel, Medium-Speed Four-Wire RTD Resistance
Input Module
Choose 20 ohm (measurement current: 1 mA), 200 ohm (measurement current: 1
mA), or 2 kohm (measured current: 0.25 mA).
• DI (Digital Input)
On the channels of the 10-CH, High-Speed Digital Input Modules, only the DI (digital
input) setting is available (no input mode selection). With numerical input module
channels, select LEVEL (D10) (voltage input) for -D05, or CONTACT (D10) (contact
input) for the measurement range to match the input. -DI24: LEVEL (24 V) only.
On the 4-CH, High-Speed Universal Input Module, select LEVEL (voltage input) or
CONTACT (HS) (contact input) according to the input.
On the 10-CH, Medium-Speed Universal Input Module or the Six-Channel MediumSpeed Four-Wire RTD Resistance Input Module, select LEVEL (voltage input) or
CONTACT (SC) (contact input) according to the input.
• STR (Strain)
On the 4-CH Medium-Speed Strain Input Modules, select a measurement range of
2000 µSTR, 20000 µSTR (default value), or 200000 µSTR.
• RRJC(TC) (Remote RJC)
In measuring temperature with thermocouples within the same unit, when the item
to be measured is located at a great distance, you can setup relay terminals near
the item, measure the temperature of the relay terminal section using thermocouples
(reference channel), and use the resultant value as the reference junction
compensation value for the temperature measurement. By connecting a copper wire
between the relay terminal and input terminal of the input module, and a thermocouple
between the DUT and relay terminal, you can measure the temperature of the DUT
without the need for a large amount of expensive thermocouples.
2-20
IM WX103-01E
2.4 Setting the Measurement Conditions (Measurement Channel Settings)
1
Relay terminal (to be furnished by the user)
Thermocouple*
Reference channel
Copper wire
Thermocouple*
Copper wire
Thermocouple*
2
Logger
Input terminal
MX100
3
* Use the same type of thermocouples.
Setting the Measurement Span
Set the minimum and maximum values of the range that is actually measured within the
measurable range.
4
Setting the Scale
Set this item when linearly scaling the measured values. Set the scale by entering the
maximum and minimum values corresponding to the maximum and minimum values of
the measurement span and selecting the decimal point position of the scaled value (see
the figure below). The selectable range of the scale is -30000 to 30000. The decimal
point position can be set to 4 (XXXXX), 3 (XXXXX), 2 (XXXXX), 1 (XXXXX), or 0 (XXXXX).
Also, you can specify units for the scale value. You can set the units using up to six
characters.
Scale maximum 100
Scale minimum
0
0
Span minimum
3[V]
Span maximum
Setting the Reference Channel for Difference Input
Set this item when making the difference between the measured value of the channel
and the measured value of the reference channel the measured value (referred to as
difference computation). The reference channel can be set to a channel that is scaled.
Difference computation can be executed even if the measurement range of its own
channel and that of the reference channel are not the same.
If the decimal point position setting is different between its own channel and the reference
channel, the decimal point position of the measured value of the reference channel is
matched to that of its own channel, and the difference is computed.
Example: When the measured value of the channel set to difference input is 10.00 and
the measured value of the reference channel is 100.0
The computed result is 10.00 – 100.0 = –90.00.
Set the reference channel for difference input to a measurement channel that has the
Monitor check box selected.
Setting the Remote RJC Reference Channel (Valid Only When the Input
Mode Is Set to RRJC (TC))
This item sets the reference channel when the input mode is set to RRJC (TC).
Set the reference channel for remote RJC to a channel that meets the three conditions
below.
IM WX103-01E
2-21
5
Index
2.4 Setting the Measurement Conditions (Measurement Channel Settings)
• The reference channel is a measurement channel (channel existing on the
measurement channel page) with the Monitor check box selected.
• The range of the reference channel and that of the corresponding measurement
channel are the same.
• The channel is in the same unit (MX100).
Setting the Time Constant of the First-Order Lag Filter (Valid Only When
the Input Mode Is Set to Something Other than DI)
A first-order lag filter is available. Select from the Filter list box, the time constant N (time
until 63.2% of the output value is reached) for the case when the measurement interval
(Monitor interval in the settings) is set to 1 s. Time constants when the measurement
interval is set to a value other than 1 s follow the equation below.
Time constant = measurement interval × N (where N = 5, 10, 20, 25, 40, 50, or 100)
The table below lists the relationship.
Measurement Interval (s)
0.01
0.05
0.1
0.2
0.5
1
2
5
10
20
30
60
Selectable Time Constants (s)
0.05
0.1
0.2
0.25
0.4
0.25
0.5
1
1.25
2
0.5
1
2
2.5
4
1
2
4
5
8
2.5
5
10
12.5
20
5
10
20
25
40
10
20
40
50
80
25
50
100
125
200
50
100
200
250
400
100
200
400
500
800
150
300
600
750
1200
300
600
1200 1500 2400
0.5
2.5
5
10
25
50
100
250
500
1000
1500
3000
1
5
10
20
50
100
200
500
1000
2000
3000
6000
Input
63.2% of the output value
Output curve when
the filter is used
Time constant in the table above
Setting the Burnout
When the input mode is set to TC, you can set the burnout detection behavior. (This
setting is possible when the input mode is set to a mode other than DI, but the setting
takes effect only when the mode is TC.) If set to Up, the measured value is fixed to
+OVER when a burnout is detected (condition in which the input signal level exceeds
the upper limit of the measurement range). If set to Down, the measured value is fixed
to – OVER (condition in which the input signal level exceeds the lower limit of the
measurement range). To not detect burnouts, select Off (default).
Setting the RJC
When the input mode is TC, select whether to use the internal reference junction
compensation function of the input module or an external reference junction
compensation function. (This setting is possible when the input mode is set to a mode
other than DI, but the setting takes effect only when the mode is TC.) When using the
external reference junction compensation function, set an appropriate reference junction
compensation voltage (Volt in the setup) in the range of –20000 µV to 20000 µV. For
example, if the reference junction temperature of the external reference compensation is
T0°C, set the reference compensation junction voltage to the thermoelectromotive force
of the 0-°C reference of T0°C.
2-22
IM WX103-01E
2.4 Setting the Measurement Conditions (Measurement Channel Settings)
Initial Balancing of Strain Input Channels (Initial Unbalance Adjustment)
Measured value
2
3
4
Initial balance
1
Logger
When configuring a bridge circuit with a strain gauge, due to the slight deviation in
resistance of the strain gauge, the bridge circuit will not necessarily be balanced even if
the strain of the circuit under test is zero, and the measured value may not be zero (the
value in such cases is called the initial unbalanced value.)
Therefore, when taking measurements you must first balance the bridge and, if the strain
is zero, obtain a measured value of zero. This is called initial balancing (setting the initial
unbalanced value to zero).
Initial unbalanced value
0
5
Strain
Reset
Index
With the MX100, initial balancing is performed in the ±10000µ strain range.
Initial balance: The value when the command is executed is taken as the initial
unbalanced value, and the measured value is set to zero.
Reset:
The value set during initial balancing is reset to zero. The initial
unbalanced value is used for the measured value as-is.
Note
If the measuring range is changed, the initial balancing is reset. After a range change, you must
redo initial balancing.
The results of initial balancing are as follows.
Status box display
----Successful
Failed
OVER
Executing
Status
Not executed
Initial balancing was executed successfully.
Initial balancing failed.
Initial balancing succeeded, but the output value exceeded the
upper limit or fell below the lower limit, and the value was rounded
to the upper or lower limit.
Executing initial balancing
Note
If initial balancing fails, the 7-segment LED on the MX100 displays “
” Check the module’s
installation status, then perform initial balancing again. If the error occurs even after
recalibrating, servicing is required. Please contact your nearest Yokogawa representative.
Scaling Settings of the Strain Gauge Sensor
When using the scaling settings to measure physical quantities such as load and length
using a strain gauge type sensor, set the scaling. For instructions on entering scaling
settings, see chapter 1 of the MX100 Data Acquisition unit User’s Manual, “Functional
Explanation.”
IM WX103-01E
2-23
2.5
Setting Computations
(Setting the Computation Channels)
Procedure
1. Click Channel. The Channel setup screen appears.
2. Click the Math Ch tab.
Setting the Expression
3. Click the Expression box, and enter the expression.
Setting the Span
4. Select the decimal point position from the Point list box under Span.
5. Click the Min box or Max box under Span and enter the minimum or the maximum
value of the span.
Setting the Unit, Tag Number, and Tag Comment
6. Click the Unit, Tag No., and Tag Comment text box and enter the unit, tag number,
and tag comment, respectively.
Setting the User-Defined Constant
7. Click the Label box under Constant and enter the name to identify the constant.
8. Click the Value box under Constant and enter the value of the constant.
Enter the equation (up to 127 characters, not case sensitive)
Equations that are appropriate are displayed in black
Equations that are inappropriate are displayed in peach
Select the number of digits after the decimal point for the span (0 to 4)
Enter the minimum and maximum value of span
Click here.
Click the Math Ch. tab
Scroll to set the units, tag No.
Enter the constant value
or tag comment
Enter the label indicating the constant
Appropriate labels are displayed in black
Inappropriate labels are displayed in peach
Click here to hide the area of setup items related to timers
2-24
Click here to hide the area of setup items
related to constants
IM WX103-01E
2.5 Setting Computations (Setting the Computation Channels)
1
Enter the unit of the computed value (up to six characters)
Enter the tag No. (up to 15 characters)
Enter the tag comment (up to 30 characters)
2
Logger
3
4
5
Index
Click here to hide the area of setup items related to timers
To show the area of setup items related to
constants or timers, click here.
Note
Two hundred and forty computation channels are always shown.
IM WX103-01E
2-25
2.5 Setting Computations (Setting the Computation Channels)
Importing Expressions
From the File menu, choose Import Expression. Then, select an MXLOGGER project
file (a file with .mxe extension) in the Open dialog box.
Only the saved expressions are imported.
Select the MXLOGGER project file
(file with .mxe extension) you wish to load
Note
For instructions on saving MXLOGGER project files, see section 2.11, “Saving/Loading and
Printing Setup Data (Project).”
Importing User-Defined Constants
From the File menu, choose Import Constant. Then, select an MXLOGGER project file (a
file with .mxe extension) in the Open dialog box.
Only the saved user-defined constants are imported.
Select the MXLOGGER project file
(file with .mxe extension) you wish to load
Importing Tag Numbers and Tag Comments
You can import just the tag numbers and tag comments from the saved setup data and
replace the current tag numbers and tag comments with the imported information. From
the File menu, choose Import Tag. Then, select an MXLOGGER project file (a file with
.mxe extension) in the Open dialog box.
Only the tag numbers and tag comments are imported.
Select the MXLOGGER project file
(file with .mxe extension) you wish to load
Note
When you carry out the procedure above, the tag numbers and tag comments of measurement
channels are also imported.
2-26
IM WX103-01E
2.5 Setting Computations (Setting the Computation Channels)
1
Setting Timers (Only When Using Timers in the Computations)
7.
8.
9.
2
Logger
Click Action of a timer and select Edge or Level.
When not using the timer, select Off (default).
Click the Interval box, and enter the interval.
If Action was set to Edge, click the On-period box and enter the time interval over
which the timer is to be turned ON. If Action was set to Level, click the On-period or
Off-period box and enter the time over which the timer is turned ON or OFF.
3
If Action is set to Level, enter the time when the timer is to turn OFF.
If Action is set to Edge or Level, enter the time when the timer is to turn ON.
4
Set the timer interval
To use a timer in the computation, select Edge or Level
When not using the timer, select Off (default).
5
When Calculating ±Overrange Values of Measurement Channels as the Maximum
or Minimum Value of the Measurement Range
10. Select the Calculate +Over/–Over as the MAX/MIN value of a range check box.
Check here to calculate +Over and –Over as maximum and minimum values
of the measurement range (see the explanation in this section, “Setting Computations”).
Resetting Computation
From the Action menu, choose Reset Math.
When Setting Computations for Each Channel Individually
Click a desired channel number and enter the settings in the area on the right to set the
computation.
Click the channel number to be configured
Math channel to be configured
Click here to show or hide the Math Channel area
IM WX103-01E
2-27
Index
2.5 Setting Computations (Setting the Computation Channels)
Explanation
Overview of Computation
You can enter computing equations using constants, operators, and functions described
below. The computed results can be displayed and recorded (saved) as computed data.
Computation allows you to determine the average/maximum/minimum of a specified
channel on a specified date/time or output events (start/stop record, reset time, etc.)
under specified conditions. The number of available computation channels is 240, and
the number of characters that can be used in the equation is 127.
Setting the Computation Span
You can set the span of transmission output for the analog output and PWM output
modules.
Constants
The following three types of constants can be used.
• User Defined Constants
A constant can be assigned to an arbitrary string (name). You can set up to 240 userdefined constants. Set the Name of the constant using a string (up to 10 characters)
that is not used by predefined constants or functions. They are not case-sensitive.
The precision and range of the constant values are the same as the single-precision
floating point format (32 bits, negative values: -3.4028235E+38 to -1.401298E-45, and
positive values: 1.401298E-45 to 3.4028235E+38).
• Predefined Constants
The five strings below are used for predefined constants. They are not case-sensitive.
• NaN: Represents an invalid value or error value. For a description of the
computed result when NaN is used in the computation, see “Notes on
Computation” in this section.
• POver: Represents +Over (positive overrange). The expression POver > x is
satisfied for any arbitrary value x.
• MOver: Represents –OVER (negative overrange). The expression MOver < x is
satisfied for any arbitrary value x.
Represents the ratio of the circumference (3.14...).
• Pi:
Represents the base of the natural logarithm (2.718...).
• e:
• Numerical Constants
Numeric values that are written directly in the equation. They are expressed in the
following form.
[digits][.digits][{d|D|e|E}[digits]]
Example: 1.0d+1 represents 10.0.
Channel Numbers
Channel numbers can be used to specify the <channel> (measurement or computation
channels). The channel number is specified using five digits: the unit number is the
highest two digits and the channel number within the unit is the lowest three digits.
Measurement channels are specified using 990001 to 99240.
Tag Numbers
Tag numbers can be used to specify the <channel> (measurement or computation
channels). The tag numbers are enclosed in double quotation marks as in “TagNo.00001”
They are case-sensitive.
Note
If the same tag number is specified on multiple channels, the operation is undefined.
Alarm Level
Use 1 to 4 to specify the level of alarms 1 through 4.
2-28
IM WX103-01E
2.5 Setting Computations (Setting the Computation Channels)
1
Manual, and User Output (DO Channels, AO Channels, and PWM
Channels)
3
Operators
The operators listed below can be used.
Operator
+
!
+
*
/
%
Explanation
Unary plus operator
Unary minus operator
Logical NOT operator; 1 when 0, or 0 when not 0.
Addition
Subtraction
Multiplication
Division
Remainder
<
&&
Less than, 1 when the condition is met and 0
when it is not
Greater than, 1 when the condition is met and 0
when it is not
Less than or equal to, 1 when the condition is
met and 0 when it is not
Greater than or equal to, 1 when the condition
is met and 0 when it is not
Equal to, 1 when the condition is met and 0
when it is not
Not equal to, 1 when the condition is met and 0
when it is not
Logical product, also calculated after NOT
||
Logical sum, also calculated when true
^^
Exclusive OR
?:
Conditional operators
,
Order operator
>
<=
>=
==
!=
Example
+ch(00010)
-ch(00010)
!ch(00010)
ch(00010)+ch(00011)
ch(00010)-ch(00011)
ch(00010)*ch(00011)
ch(00010)/ch(00011)
ch(00001)%ch(00002)<=1 ?
AlarmAck() : 0
ch(00001) > ch(00002) ?
AlarmAck() : 0
ch(00001) < ch(00002) ?
AlarmAck() : 0
ch(00010)<=1.0 ? StartRec() : 0
4
5
Index
ch(00010)>=1.0 ? StartRec() : 0
ch(00010)==1.0 ? StartRec() : 0
ch(00010)!=0 ? StartRec() : 0
ch(00001) && ch(00002)==1 ?
AlarmAck() : 0
ch(00001) || ch(00002)==1 ?
AlarmAck() : 0
ch(00001) ^^ ch(00002)==1 ?
AlarmAck() : 0
ch(00010)>=1.0 ? StartRec() : 0
(“if a then b otherwise c” expressed
as [a?b:c])
Condition?(ResetTimer(),
StartRec()) : 0
The order of precedence of the operators is as follows. ← indicates that the left operator
has precedence over the right operator.
+ - ! (unary operators) ← + - * / % (arithmetic operators) ← < > <= >= == != (relational
operators) ← && || ^^ (logical operators) ← ? (conditional operator) ← ,(order operator)
IM WX103-01E
2
Logger
Specify an integer starting with 1. The arguments for the ManualDO() and ManualAO()
functions are as follows.
<ManualDONo.>: 1-4
<ManualAONo.>: 1-4
2-29
2.5 Setting Computations (Setting the Computation Channels)
Reference Functions and TLOG Functions
The functions below are used to retrieve measured values and alarm values. The
functions are not case sensitive. For the format used to specify the <channel>, <alarm
level>, and <manual> see “Channel Numbers,” ” Alarm Level,” and “Manual” in this
section.
Function
ch (<channel>)
prech (<channel>)
alarm (<channel>,
<alarm level>)
alarm (<channel>)
alarm()
tlogmax (<channel>)
tlogmin (<channel>)
tlogpp (<channel>)
tlogsum (<channel>)
tlogave (<channel>)
ManualDO (<manual>)
ManualAO((<manual>)
Description
Returns the current value of the specified
channel (see page 2-36)
Returns the previous value of the specified
channel (see page 2-36)
Returns the alarm value of the specified
channel and specified alarm level;
ON=1, OFF=0
Returns the alarm value of the specified
channel, ON=1, OFF=0
Returns the alarm value of an arbitrary
channel, ON=1, OFF=0
Returns the maximum value of the TLOG
computation of the specified channel
Returns the minimum value of the TLOG
computation of the specified channel
Returns the (maximum-minimum) value of the
TLOG computation of the specified channel
Returns the sum of the TLOG computation
of the specified channel
Returns the average value of the TLOG
computation of the specified channel
Returns the values being output on the
specified ManualDO.
Returns the values being output on an
arbitrary channel.
Example
ch(00001)/ch(“Tag”)
prech(00001)/
prech(“Tag”)
alarm(00001,2)/
alarm(“Tag” 2)
alarm(00001)/
alarm(“Tag”)
alarm()==1 ?
StartRec() : 0
tlogmax(00001)/
tlogmax(“Tag”)
tlogmin(00001)/
tlogmin(“Tag”)
tlogpp(00001)/
tlogpp(“Tag”)
tlogsum(00001)/
tlogsum(“Tag”)
tlogave(00001)/
tlogave(“Tag”)
ManualDO(1)
ManualAO(1)
*1
The TLOG computation computes the maximum, minimum, maximum-minimum, sum, and average values of the specified channel.If the TLOG function is present in the equation, the computation is executed.
*2
The reference function or TLOG function returns NaN in the following cases.
• When the data to be referenced by the CH function or PRECH function does not exist
(when disconnected or immediately after starting the monitor operation)
• When the specified channel does not exist or when the specified alarm level is not 1 or 2.
• When the MX100 returns an INVALID value
*3
Select the behavior taken when the value of the measurement channel is ±Over from the following:
• Continue the computation as ±Over (behavior when the check box is not selected)
• Continue the computation by setting ±Over to the maximum or minimum value of the measurement range of the specified channel (see “Notes on Computation” in this section).
The selection is made using the Calculate +Over/-Over as the MAX/MIN value of a range check box.
2-30
IM WX103-01E
2.5 Setting Computations (Setting the Computation Channels)
1
Arithmetic Functions
Below are the arithmetic functions that are available. They are not case-sensitive.
Description
Returns the sine of the <value>
Returns the cosine of the <value>
Returns the tangent of the <value>
Inverse sine
Inverse cosine
Hyperbolic sine
Hyperbolic cosine
Hyperbolic tangent
<value1> to the power of <value 2>
sqrt (<value>)
logE (<value>)
log10 (<value>)
expE (<value>)
exp10 (<value>)
abs (<value>)
max (<value>, ..., <value>)
sum (<value>, ..., <value>)
Square root
Natural logarithm
Common logarithm
e to the power of <value>
10 to the power of <value>
Absolute value
Maximum value among multiple
specified values
Minimum value among multiple
specified values
(Maximum - minimum) among
multiple specified values
Sum of multiple specified values
ave (<value>, ..., <value>)
Average of multiple specified values
poly(<x>,<a0>,<a1>, ..., <an>)
Polynomial with variable parameters
n
n-1
0
Calculate 0x +a1x +...+anx
Returns the minimum integer greater
than <value>
Returns the maximum integer less
than <value>
If x is outside the range defined by a
and b,round the value to b.
Returns a random number between
0 and 1
Returns 1 if \value is NaN, otherwise
returns 0.
min (<value>, ..., <value>)
pp (<value>, ..., <value>)
ceil (<value>)
floor (<value>)
limit(<x>,<a>,<b>)
rnd()
IsNaN (<value>)
IM WX103-01E
Example
sin(ch(“TagNo.00001” ))
cos(ch(“TagNo.00001” ))
tan(ch(“TagNo.00001” ))
asin(ch(“TagNo.00001” ))
acos(ch(“TagNo.00001” ))
sinh(ch(“TagNo.00001” ))
cosh(ch(“TagNo.00001” ))
tanh(ch(“TagNo.00001” ))
pow(ch(00001),
ch(00002))
sqrt(ch(00001))
logE(ch(00001))
log10(ch(00001))
expE(ch(00001))
exp10(ch(00001))
abs(ch(00001))
max(ch(00001),
ch(00002),ch(00003))
min(ch(00001),
ch(00002),ch(00003))
pp(ch(00001),ch(00002),
ch(00003))
sum(ch(00001),
ch(00002),ch(00003))
ave(ch(00001),
ch(00002),ch(00003))
poly(ch(00001)
ch(00002),ch(00003)),
ceil(ch(00001))
floor(ch(00001))
limit(ch(00001),10,20)
ch(00001)*rnd()
IsNaN(ch(00001))
2-31
2
Logger
Function
sin (<value>)
cos (<value>)
tan (<tan>)
asin (<value>)
acos (<value>)
sinh (<value>)
cosh (<value>)
tanh (<value>)
pow (<value1>, <value2>)
3
4
5
Index
2.5 Setting Computations (Setting the Computation Channels)
Time Functions
The table below shows the functions related to time. The functions are not case sensitive.
Only integer numeric constants can be written in the function parameters <year>,
<month>, <day>, <hours>, and <minutes> in the table below. The terminology used in
the description in the table are defined below.
Edge: Returns 1.0 for computation immediately after the specified absolute or
relative time.
Previous edge: Returns 1.0 for computation immediately before the specified absolute
or relative time.
Level: Returns 1.0 during the specified absolute time or relative time.
• Parameter Setting Ranges
Year: <month>:
<day>:
<week day>:
<hours>:
<minutes>:
Function
time(<year>,<month>,<day> <hours>,
<minutes>)
bfTime(<year>,<month>,<day>,<hours>,
<minutes>)
time(<year A>,<month A>,<day A>,<hours A>,
<minutes A>,<year B>,<month B>,<day B>,
<hours B>,<minutes B>)
monthly (<day>,<hours>,<minutes>)
bfMonthly (<day>,<hours>,<minutes>)
monthly (<day A>,<hours A>,<minutes A>,
<day B>,<hours B>, <minutes B>)
weekly (<week day>,<hours>,<minutes>)
bfWeekly (<week day>,<hours>,<minutes>)
weekly (<week day A>,<hours A>,
<minutes A>,<weekday B>,
<hours B>,<minutes B>)
daily (<hours>,<minutes>)
bfDaily (<hours>,<minutes>)
daily (<hours A>,<minutes A>,<hours B>,
<minutes B>)
hourly (<minutes>)
bfHourly (<minutes>)
hourly (<minutes A>, <minutes B>)
timer(<timerNo>)
2-32
1970-2036
1-12
1-31
0 to 6 (0: Sunday, 1: Monday, ..., 6: Saturday)
0-23
0-59
Description
Edge operation on the date/time
Example
time(2003,6,3,9,53) ? StartRec() : 0
Previous edge operation on the
date/time
Level operation between date/time
A and B
bfTime(2003,6,3,9,3) ? StartRec() : 0
Edge operation every month on the
specified day, hour, and minute.
Previous edge operation every month on
the specified day, hour, and minute.
Level operation between the specified
day, hour, and minute of A to the specified
day, hour, and minute of B every month.
Edge operation every week on the
specified week day, hour, and minute.
Previous edge operation every week on
the specified week day, hour, and minute.
Level operation between the specified
week day, hour and minute of A to the
specified week day, hour, and minute of B
every week.
Edge operation at the specified hour and
minute every day
Previous edge operation at the specified
hour and minute every day
Level operation between time A and time
B
Edge operation at the specified minute
every hour
Previous edge operation at the specified
minute every hour and minute every hour
Level operation between minute A and
minute B
Returns the status of the specified timer
time(2003,6,3,8,53,2003,6,3,9,13) ?
sum(ch(00001),ch(00002),
ch(00003)) : 0
monthly(3,9,53) ? StartRec() : 0
bfMonthly(3,9,53) ? StartRec() : 0
monthly (3,9,3,4,9,3) ? StartRec() : 0
weekly(3,9,53) ? StartRec() : 0
bfWeekly(3,9,53) ? StartRec() : 0
weekly(3,10,00,4,11,05) ?
sum(ch(00001),ch(00002),
ch(00003)) : 0
daily (10,00) ? StartRec() : 0
dfDaily(10,00) ? StartRec() : 0
daily(10,00,11,05) ?
sum(ch(00001),ch(00002),
ch(00003)) : 0
hourly(30) ? StartRec() : 0
bfHourly(30) ? StartRec() : 0
hourly (10,20) ? sum(ch(00001),
ch(00002),ch(00003)) : 0
timer(1)==1.0 ? StartRec() : 0
IM WX103-01E
2.5 Setting Computations (Setting the Computation Channels)
• Timer (<timerNo>)
1
2
Logger
Up to eight timers can be specified. The timer is specified using a number between 1
and 8.
Select the timer operation from the choices below. Select Off to disable the timer.
Edge operation: Returns 1.0 when performing computation after the ON time elapses
after the beginning of each interval. Specify the interval for detecting
the condition and the ON time in ms.
Level:
Returns 1.0 from the time after the ON time elapses until after the
OFF time elapses. Specify the interval for detecting the condition,
ON time, and OFF time.
The condition detection interval that can be set is from 1000 ms to 232–1 ms. The
ON/OFF time is specified from the beginning of the interval to the elapsed time.
3
4
Timer Level Operation
• When ON < OFF
Interval
Interval
Returns 1.0
Returns 1.0
ON
ON
ON setting
OFF
OFF
5
t
Index
OFF setting
• When ON > OFF
Interval
Returns 1.0
ON setting
Interval
Returns 1.0
OFF
ON
OFF
Returns 1.0
ON
t
OFF setting
Manual AO Function
Below are the pattern outputs that are available with the manual AO function. The
functions are not case sensitive. Specify <manual> as described in the explanation for
manual and user output in this section. The operation does not take place if the relevant
user output channel is not set to pattern output mode.
Function
StartPTN()
StopPTN()
SuspendPTN()
ResumePTN()
StartPTN(<manual>)
StopPTN(<manual>)
SuspendPTM(<manual>)
ResumePTN(<manual>)
IM WX103-01E
Description
Start pattern output
Description
Stop pattern output
Description
Pause pattern output
Description
Resume pattern output
Description
Start pattern output on the
specified user output channel
Stop pattern output on the
specified user output channel
Pause pattern output on the
specified user output channel
Resume pattern output on the
specified user output channel
Example
ch(00010) >=0 ? StartPTN() : 0
ch(00010) >=0 ? StopPTN() : 0
ch(00010) >=0 ? SuspendPTN() : 0
ch(00010) >=0 ? ResumePTN() : 0
ch(00001) ==0 ? StartPTN(1) : 0
ch(00001) ==0 ? StopPTN(1) : 0
ManualDO(1)==1 ? SuspendPTN(1)
: Resume(1)
ManualDO(1)==1 ? SuspendPTN(1)
: Resume(1)
2-33
2.5 Setting Computations (Setting the Computation Channels)
Event Functions
Function used to carry out a given operation (event). They are not case-sensitive. They
are mainly used in conjunction with the conditional operator (?).The return values are
indicated below. The event is actually executed after the computation is complete.
• Execution successful: 1.0
• Execution failed: 0.0
• Invalid parameter: NaN
Function
AlarmAck()
ResetMath()
ResetTimer()
ResetTimer(<timerNo>)
ResetTLog()
StartRec()
SplitRec()
StopRec()
Mark(“mark”
•
•
2-34
Description
Issue an alarm acknowledge
Reset the computation
Reset the values of all timers
Reset the specified timer
Reset the TLOG computation
Start recording
Valid after carrying out the
record start procedure.
Discarded if the recording is
already started (returns 1.0).
Move to the next data file
Valid after carrying out the
record start procedure.
Stop recording
Valid after carrying out the
record start procedure.
Discarded if the recording is
already stopped (returns 1.0).
Create a mark. The text inside
the double quotation marks is
arbitrary.
Example
ch(00001)>ch(00002) ? AlarmAck() : 0
ch(00010)>=1.0 ? ResetMath() : 0
ch(00010)>=1.0 ? ResetTimer() : 0
ch(00010)>=1.0 ? ResetTimer(1) : 0
ch(00010)>=1.0 ? ResetTLog() : 0
ch(00010)>=1.0 ? StartRec() : 0
ch(00010)>=1.0 ? SplitRec() : 0
ch(00010) >=0 ? StopRec() : 0
ch(00010) >=0 ? Mark(“mark” : 0
If the spacing between the execution of StopRec() and StartRec() is short, StartRec() may not be executed. When repeating start/stop frequently, consider using the Split function.
The computed result at the time record start is executed is not necessarily recorded to
the file.
IM WX103-01E
2.5 Setting Computations (Setting the Computation Channels)
Notes on Computation
Ch 1:
Ch 2:
Ch 3:
Ch 4:
Ch 5:
Math:
: Data at time t
: Data near tie t
: Newest data
: Oldest data
: NaN
t
Example 2:
If the disconnection (disconnected after
value of Ch 3.
Ch 1:
Ch 2:
Ch 3:
Ch 4:
Ch 5:
Math:
3
4
Index
Measured value used in
the computation of
: Data at time t
: Data near tie t
: NaN
: Oldest data
: NaN
Measured value used in
the computation of
• Alarm values used in computations
Basically handled the same as measured values except the behavior differs in the
following two cases.
• When the alarm value does not exist (Ch 5 in example 1 above)
Always returns 0 (no alarm).
• When the communication is cut off (Ch 3 in example 2 above)
Always returns the most-recent value.
• Syntax error and execution error
• Syntax error
Equations containing items that are inappropriate are indicated in peach when the
equation is being entered. If monitoring is started without correcting the equation,
they are ignored.
• Execution error
Execution errors are detected after starting the execution. Below are the two cases.
NaN is returned as the result in either case.
• When the reference destination does not exist when monitoring is started
• When the computed result is undefined.
IM WX103-01E
2
5
) is detected, NaN is used as the measured
t
1
Logger
• The equation is not case sensitive. The exception is tag numbers specified on the
Channel setup screen.
• The precision and range of computed values are the same as data in single-precision
floating point format.
• The sampling interval of the computed channel is 100 ms to 10 min.
• Measured values used in computations
The measured value with the closest time is used among the measured values
existing at the time of computation. Resampling of the measured value or interpolation
are not performed while computation is being executed.
Example 1:
If the measured values indicated by and exist and computation indicated by
is performed, the measured value indicated by on each channel is used. If the
measured value does not exist such as in Ch 5, NaN is used as the measured value.
2-35
2.5 Setting Computations (Setting the Computation Channels)
• Handling of NaN values
• In the case of a TLOG function (tlogmax, tlogmin, tlogpp, tlogsum, and tlogave)
If NAN exists in the channel values, it is handled as though the value did not exist.
• In the case of the IsNan() function
This function can determine whether the value is NaN.
• In the case of min, max, sum, ave, and pp functions
NaN values are discarded.
• In the case of &&, ||, ^^, and ! operators
NaN values are considered true.
• For all other computations
Computation is performed taking NaN as a value. Thus, NaN is returned as the
computed result.
• The numeric value display on the Monitor screen displays INVALID.
• Handling when the value of a measurement channel is ±Over (exceeding the upper
and lower limits of the measurement range)
If the measured value used in the reference function or TLOG function is ±Over,
computation continues in one of two ways. Select the handling method using the
Calculate +Over/-Over as the MAX/MIN value of a range check box.
• Continue the computation as ±Over.
• Continue the calculation by setting ±Over to the maximum or minimum value of the
measurement range of the specified channel.
Use the following values as the maximum and minimum value of the measurement
range.
• DC voltage: ±10% of the range
However, 0/+63.000 mV for 60-mV (HQ) range and 0/+6.3000 V for 6-V (HQ)
range.
Example: 6 V range
+OVER: +6.6 V
–OVER: –6.6 V
• Temperature: ±10°C of the rated measurement range
However, 0 K and 10 K for KpVsAu7Fe and J263B.
• Linear scaling: Maximum and minimum values of the scale corresponding to
±10% of the measurement span
However, ±32000 when the scale value exceeds ±32000.
Example 1: When the measurement span is set to ±1 V and the scale is set to
±10000 at 2 V range
+OVER: +22000
–OVER: –22000
Example 2: When the measurement span is set to ±1 V and the scale is set to
±30000 at 2 V range
+OVER: +32000
–OVER: –32000
To suppress ±Over from occurring in the computation, use the limit function.
• Alarms for computation using the Alarm() function
The alarm corresponding to the current value is used for the alarm of a measurement
channel.
The alarm corresponding to the current value is also used for the alarm of a
computation channel. However, for computation channels that have not yet computed
the current value, the alarm corresponding to the previous value is used.
2-36
IM WX103-01E
2.6
1
Setting Alarms
Procedure
Click Channel.
The Channel setup screen appears.
Click the Meas. Ch tab or the Math Ch tab.
Select the alarm type from the Type list box under Alarm 1 to Alarm 4.
When not using difference input on measurement channels, select OFF, High, or
Low. When using difference input, select OFF, dHigh, or dLow.
On math channels, select OFF, High, Low, rHigh, or rLow.
4. Click the Value box, and enter the alarm value.
5. Click the Hysteresis box, and enter the alarm hysteresis value.
6. If you selected a rate-of-change alarm rHigh or rLow for the alarm type on a
computation channel, select the interval used to detect the rate-of-change from the
Interval of rate-of-change alarm list box.
For measurement channels
Click here.
For math channels
Alarm 1 type
Alarm value of alarm 1
Hysteresis of alarm 1
Click here to set the alarm
per channel
Hysteresis of alarm 2
Alarm value of alarm 2
Alarm 2 type
Alarm 1 type
Alarm value of alarm 1
Hysteresis of alarm 1
Click here to set the alarm
per channel
Set Alarm 2 in a similar fashion
Scroll the screen and set alarms 3 and 4 in the same manner
Rate-of-change interval when the Type is set to rHigh or rLow
IM WX103-01E
2-37
2
Logger
1.
2.
3.
3
4
5
Index
2.6 Setting Alarms
Note
When using computation channel alarms, do not disconnect the MX100 and the PC software.
Computation channel alarms will not occur because the computation function does not work
when using only the MX100.
Explanation
Alarm Types
There are six types of alarms.
When not using difference input on measurement channels, select OFF, High, or Low.
When using difference input, select OFF, dHigh, or dLow.
On math channels, select OFF, High, Low, rHigh, or rLow.
•
•
•
Upper Limit Alarm (High)
An alarm occurs when the measured/computed value exceeds the alarm value.
Lower Limit Alarm (Low)
An alarm occurs when the measured/computed value falls below the alarm value.
Difference Input Upper Limit Alarm (dHigh)
An alarm occurs when the difference input (difference between the measured value of
its own channel and that of the reference channel) exceeds the alarm value.
• Difference Input Lower Limit Alarm (dLow)
An alarm occurs when the difference input (difference between the measured value of
its own channel and that of the reference channel) falls below the alarm value.
Upper-limit alarm/difference input
upper limit alarm
Alarm occurrence
Lower-limit alarm/difference input
lower limit alarm
Measured value or
computed value
Alarm reset
Alarm value
Alarm reset
Measured value or
computed value
Alarm value
Alarm occurrence
• Rate of Change Upper Limit Alarm (rHigh)
An alarm occurs if the amount of change in the computed value in the rising direction
exceeds the alarm setting value within the rate-of-change detection interval.
• Rate of Change Lower Limit Alarm (rLow)
An alarm occurs if the amount of change in the computed value in the falling direction
exceeds the alarm setting value within the rate-of-change detection interval.
Change in the
computed value
T2
Amount of change in
the setting
T2–T1
T1
t1
t2
Interval
t 2 –t 1
Time
Low limit on rate-of-change alarm
Computed value
Computed value
High limit on rate-of-change alarm
T1
Amount of change in
the setting
T1–T2
T2
t1
t2
Change in the
computed value
Time
Interval
t2 –t1
The rate-of-change detection interval is equal to measurement interval x measurement
count. Select the measurement count (1 to 15) using the Interval of rate-of-change alarm
box.
2-38
IM WX103-01E
2.6 Setting Alarms
1
The table below shows the relationship between the number of MXLOGGER alarm
settings (by version) and the MX100 hardware style number.
MXLOGGER
Software version
Connectable module types
or setting items
Alarm level setting (alarm1
to alarm 4)
Notes
Yes
No: Operation possible with alarm 1 and
alarm 2
No
No
2
Logger
R2.05 or later
*1
MX100 Hardware
*2
Style Number
S3
S2
S1
3
Yes: Setting and operation allowed
No: Setting possible, but not operation
*1 To check the version, see section 2.16, “Displaying the Software Version and Other
Information.”
*2 The style number is printed on the MX100 main module name plate.
4
When acquisition is started, the hardware style numbers, alarm settings, and operating
statuses of the connected MX100s are displayed in the Unit Status area in the Run
screen on the Main window.
MX100 Hardware style number
This indicates that for hardware style S2 or earlier,
even if Alarm 3 and Alarm 4 have been set, they are
not functioning.
Setting and operation with alarm1 to alarm 4 allowed
Alarm Hysteresis
You can set a width (hysteresis) to the values used to activate and release alarms.
Alarm hysteresis prevents frequent activation and release of alarms when the measured/
computed value is unstable around the alarm value.
Upper limit alarm
Alarm occurrence
Lower limit alarm
Alarm value
Measured value or
Alarm reset
computed value
Hysteresis
Measured value or Alarm reset
computed value
IM WX103-01E
Alarm occurrence
Alarm value
2-39
5
Index
2.7
Digital Output
Procedure
1. Click Channel. The Channel setup screen appears.
2. Click the DO Ch tab.
3. Select the Use check boxes for the DO channels you wish to output.
Setting the Digital Output of Alarms
4. Click the Alarm button under Action.
5. Click From or To under Ref. Ch. and then enter the range of reference measurement
channel numbers or math channel numbers of the alarm output.
6. Click the Level 1 button or the Level 2 button or both under Ref. Ch..
7. Click the Energize box to select the output relay action, energize or de-energize.
8. Click the Hold box to select the output relay behavior, hold or non-hold.
Alarm reference channel range
Select energize/de-energize
Alarm 1 reference
Select output or not output
of output relay
Alarm 2 reference
(Select the check box to select output)
Select hold/non-hold
Alarm 3 reference
Select the alarm
of output relay
Alarm 4 reference
Setting the Digital Output Other Than Alarms
4. Click the option button under Action to select the action used as the digital output
source.
5. If you set Action to Manual, click any of the Manual DO buttons 1 to 4.
6. If you set Action to Manual or Error, click the Energize box to select the output relay
action, energize or de-energize.
7. If you set Action to Error, click the Hold box to select the output relay behavior, hold
or non-hold.
If Action is set to Manual, click any button from 1 to 4.
Select output or not output
(Select the check box to select output)
Select the source action
Select energize/de-energize of
output relay
Select hold/non-hold of
output relay
2-40
IM WX103-01E
2.7 Digital Output
1
Changing the Manual DO Name and Specified Output
1. Click Run. The Run screen opens.
Changing the Name
2. While data monitoring is stopped, click the manual DO button name box shown in
the Manual DO area and enter the name.
Logger
Click here.
3
Click here and enter the name.
4
Output ON/OFF Operation
The procedure below can be carried out when data is being monitored.
2. Click the manual DO button or choose Manual DO1 to Manual DO4 from the Action
menu.
The output turns ON, and the word “OFF” on the manual DO button changes to “ON.”
If “ON” is displayed, the output is turned OFF, and the word “ON” changes to “OFF.”
5
Index
or
Click here.
Explanation
Alarm Reference Channel Range
The alarm detection of multiple measurement channels and math channels can be
assigned to a single DO channel. When an alarm occurs on any of the assigned
channels, alarm output is activated. A range of consecutive channel numbers are
assigned. The range can span over units.
Note
• The alarm detection in the unit and the DO output is processed within the unit. Therefore, the
DO output continues even when the connection to the PC is cut off. If the alarm reference
channel range spans over multiple units or if the digital output module is not available in the
same unit, alarm detection is performed on the PC. In this case, alarm detection stops when
the connection is cut off. In addition, even when the connection is established, the alarm
detection interval may slow down.
• Alarms other than those on measurement channels do not function when not connected to
the PC.
Digital Specified Output Other Than Alarm Output
The digital output can be enabled for the following causes.
• Manual DO [manual]
The relay contact signal of specified DO channels are turned ON/OFF collectively
when you click the manual DO button shown on the Run screen or when you choose
Manual DO1 to Manual DO4 from the Action menu.
• FAIL Output [Fail]
Outputs a relay contact signal when an error occurs in the main module CPU of a unit
containing a digital output module.
When the CPU is normal, the relay is energized and FAIL output is ON. When the
CPU is abnormal or if a power failure occurs, it is OFF.
IM WX103-01E
2
2-41
2.7 Digital Output
• Error Output [Error]
Outputs a relay contact signal when any of the following events occur in the main
module CPU of a unit containing a digital output module. When the CPU is normal,
the relay is energized and FAIL output is ON. When the CPU is abnormal or if a power
failure occurs, it is OFF.
• A data output request timeout (60 s) occurs while recording data.
(except when the MX100 /DS option functions are enabled)
• A module error occurs.
• An input module detected at power-on that is able to make measurements is
removed.
• A module breaks down.
• An unidentifiable module is attached.
When using the energize setting for contact output, the circuit switches from open
to short when the output is enabled. When using the de-energize setting, the circuit
switches from short to open.
Energized/De-energized Operation of Output Relays
You can select whether the output relay is energized or de-energized when an output
event (such as an alarm) occurs. If de-energized is selected, the output relay behaves in
the same fashion as when an output event occurs if the power is shut down. The default
setting is Energized.
NO
C
NO
C
De-energize NO
C
NO
C
Energize
NO
C
When power is
shut down
NO
When alarm is
not occurring
C
When alarm is
occurring
NO: Normally Opened, C: Common
Hold/Non-Hold of Output Relays
Select the behavior of the output relay when an output event is released (recovers to a
normal condition). The default setting is Non-hold.
• Turn OFF the output relay with the release of the output event (non-hold).
• Hold the output relay at ON until the Relay ACK button (see below) is clicked.
Relay ACK button
• When set to non-hold
Output cause
occurrence
• When set to hold
Output cause
occurrence
Relay ACK
2-42
Relay output ON
Relay output ON
Relay output OFF
Relay output OFF
IM WX103-01E
2.8
1
Analog/PWM Output Settings
Procedure
2
1.
2.
3.
4.
Click Channel to show the Channel setup screen.
Click the AO Channel tab.
Select the Use check boxes for the AO channels you wish to output.
Specify a channel operation of Transmission Output or User Output 1 through
User Output 4. If user output is specified, you can enter settings in the monitor
screen.
Of all the AO and PWM channels selected for user output, only one can be specified
for each channel, for a total of four.
5. When Transmission Output is specified, enter the reference channel. The
Reference Channel cannot be entered if the channel operation is user output.
6. Select a range from the Range list box.
7. Click the Min box or Max box under Span and enter the minimum or the maximum
value of the span.
Click here
Click the AO Channel tab.
Select output or no output
Select the source action
Transmission output reference channel
Select the
output range
Minimum/Maximum value
setting for the output span
Scroll to set the output action and pattern output
8. Click the Power ON box under Specified Output and select Hold or Preset Value.
9. Click the Error box under Specified Output and select Hold or Preset Value.
10. If you select Preset Value under Specified Output, click Preset Value under
operation, and enter the voltage or current.
11. Click the Default box under Pattern Output and select ON or OFF for the initial
operation in the loop settings.
12. Click the Type box under Pattern Output and select Continuous or Times.
13. If you select Times for Type under Pattern Output, click the Count box under
Pattern Output, and enter the number of loops.
IM WX103-01E
2-43
Logger
Setting Analog Output
3
4
5
Index
2.8 Analog/PWM Output Settings
14. Click Edit under Pattern Output to open the Edit Pattern window.
Select the output action upon startup
Select the output action upon errors
Set the default pattern output,
type, and times
Set the output value upon startup or error occurrence
Edit pattern button for pattern output
Scroll to select an action or set the reference channel, output range, or span
15. Edit the output pattern in the Edit Pattern window. For instructions, see “Editing
Patterns” in this section.
Setting PWM Output
1.
2.
3.
4.
Click Channel to show the Channel setup screen.
Click the PWM Channel tab.
Select the Use check boxes for the PWM channels you wish to output.
Specify a channel operation of Transmit or User Output 1 through User Output 4.
If user output is specified, you can enter settings in the monitor screen.
Of all the
AO and PWM channels selected for user output, only one can be specified for each
channel, for a total of four.
5. When Transmit is specified, enter the reference channel. The reference channel
cannot be entered if the channel operation is User Output.
6. Click the Min box or Max box under Span and enter the minimum or the maximum
value of the span.
Click the PWM Channel tab.
Click here
Select output or no output
Select the source action
Transmission output
reference channel
Set the minimum/maximum
values for the output span
Scroll to set the output action and pattern output
2-44
IM WX103-01E
2.8 Analog/PWM Output Settings
1
2
Logger
7. Click the Power ON box under Specified Output and select Hold or Preset Value.
8. Click the Error box under Specified Output and select Hold or Preset Value.
9. If you select Preset Value under Specified Output, click Preset Value and enter
the duty.
10. Select 1 msec or 10 msec in the Resolution box under Pulse.
Click the Interval (msec) box under Pulse, and enter the pulse interval.
11. Click the Default box under Pattern Output and select ON or OFF for the initial
operation in the loop settings.
12. Click the Type box under Pattern Output and select Continuous or Times.
13. If you select Times for Type under Pattern Output, click the Count box under
Pattern Output, and enter the number of loops.
14. Click Edit under Pattern Output to open the Edit Pattern window.
3
4
5
Index
Set the default pattern
output and set the type
and times.
Select the resolution of the pulse output
Edit pattern button for pattern output
Set the output value upon startup or error occurrence
Select the output action upon startup
Select the output action upon errors
Enter the
pulse interval
Scroll to select an action or set the reference channel, or span
15. Edit the output pattern in the Pattern Edit window. For instructions, see “Editing
Pattern Output” in this section.
Editing Pattern Output
Adding Points
1. Click Edit under Pattern Output to open the Edit Pattern window.
2. Click the Add button under Edit Pattern to open the New Point window. (To edit at
a particular time after the previous point, click the Insert button instead. )
3. Enter an elapsed time from the start time (or from the previous point) in the Time box
in the New Point window.
4. Enter an output value in the setting box in the New Point window.
5. Click OK in the New Point window to create the new point.
Editing Points
1. Click the point you wish to edit in the Edit Pattern window. The point changes from
gray (or orange) to red.
IM WX103-01E
2-45
2.8 Analog/PWM Output Settings
2. Click the Edit button under Edit Pattern to open the Edit Point window (you can
double-click a point to open the Edit Point window even if it is red.)
3. Perform the same procedure as when editing new points.
Deleting Points
1. Click the point you wish to edit in the Edit Pattern window. The point changes from
gray (or orange) to red.
2. Click the Delete button under Edit Pattern to delete a point .
For voltage output on the analog
output module, the Y-axis units are V
Select to enable. The Add button in the
bottom right of the window changes to
the Insert button.
Click to add a new point
For PWM output on the
analog output module,
the Y-axis units are %
For current output on the analog
output module, the Y-axis units are I
Select the “Elapsed time from point before” check box under
Edit Pattern to change the display to that of the elapsed time
from point before.
Enter the elapsed time
Enter the setting value
The units change to match the module setting
The point that can be edited appears in red
Edit the point displayed in red
Deletes the point displayed in red
2-46
IM WX103-01E
2.8 Analog/PWM Output Settings
1
You can edit multiple points at the same time by dragging a selection of editable red
points.
2
Logger
Displays the setting value
when the point is moved
3
4
“Generate Automatically” Function
The following four types of patterns can be created.
• Fixed output
• Rectangular waveform output
• Trapezoidal waveform output
• Pyramidal waveform output
Click the displayed button for any pattern in the upper right of the Edit Pattern window.
The patterns can be edited after being created.
fixed output
rectangular waveform output
trapezoidal waveform output
pyramidal waveform output
Fixed Output
1.
2.
3.
4.
5.
Click the Fixed Output button.
Enter the time interval for the points in the Interval box.
Enter an output value in the Set value box.
Enter the number of points in the Point Num. box.
Click the Generate Automatically button to create the pattern.
Execute the “Generate Automatically” function
Click here
Input the interval between points
Enter the number of points
Specify the output value.
Interval
IM WX103-01E
Output setting
2-47
5
Index
2.8 Analog/PWM Output Settings
Rectangular Waveform Output
1.
2.
3.
4.
Click the Rectangular Waveform Output button.
Enter the pattern interval in the Interval box.
Enter the pattern duty ratio in the DUTY Ratio box.
Enter the maximum setting value for pattern output in the Max box. Or, enter the
minimum setting value for pattern output in the Min box.
5. Enter the number of points in the Point Num. box.
6. Click the Generate Automatically button to create the pattern.
Execute the “Generate Automatically” function
Enter the pattern DUTY ratio*
Click here
Enter the pattern interval Enter the number of points
Enter the minimum and
maximum setting value
for the pattern output
Interval
Maximum setting
d
Minimum setting
*DUTY ratio =
d
Interval
x 100 [%]
Trapezoidal Waveform Output
1.
2.
3.
4.
Click the Trapezoidal Waveform Output button.
Enter the time for the pattern’s slope in the Ramp Time box.
Enter the time for the pattern’s constant portion in the Soak Time box.
Enter the maximum setting value for pattern output in the Max box. Or, enter the
minimum setting value for pattern output in the Min box.
5. Enter the number of points in the Point Num. box.
6. Click the Generate Automatically button to create the pattern.
2-48
IM WX103-01E
2.8 Analog/PWM Output Settings
1
Execute the “Generate Automatically” function
Enter the ramp time
Click here
Enter the soak time
Enter the number of points
2
Logger
ramp time soak time
Enter the minimum and
maximum setting value
for the pattern output
3
Maximum setting
4
Minimum setting
5
Index
Pyramidal Waveform Output
1. Click the Pyramidal Waveform Output button.
2. Enter the time interval for the points in the Interval box.
3. Enter the maximum setting value for pattern output in the Max box. Or, enter the
minimum setting value for pattern output in the Min box.
4. Enter the number of points in the Point Num. box.
5. Click the Generate Automatically button to create the pattern.
Execute the “Generate Automatically” function
Click here Input the interval between points
Enter the number of points
Enter the minimum and
maximum setting value
for the pattern output
Maximum setting
Interval
Minimum setting
IM WX103-01E
2-49
2.8 Analog/PWM Output Settings
Turning Transmission Output ON and OFF Collectively for Analog Output/PWM Output
1. From the Action menu, choose Transmit.
Transmission output on active channels on the AO and PWM channel tabs is
performed collectively (All ON).
2. From the Action menu, choose Transmit again.
Transmission output on all active channels on the AO and PWM channel tabs is held
at the values that were in use immediately before this operation was carried out (All
OFF).
Explanation
Setting Output for AO Channels
[Transmit]:
Computed values resulting from values measured on the MX100 and
computation results set on the computation channels are converted to
analog voltages (-10.000 V-10.000 V) or analog current (0.000mA-20.000
mA) and output.
Note
The output range is -11.000-11.000V or 0.000-22.000 mA, but the span setting range is
-10.000-10.000V or 0.000-20.000 mA.
[User Output]: Output continuously or a specified number of times an analog voltage or
analog current values using a previously set pattern. Also, you can enter
an arbitrary setting for User (Manual) in the Run screen. The setting
ranges are -10.000-10.000 V (voltage), or 0.000-20.000 mA (current).
Setting up Output for PWM Channels
[Transmission Output]:Outputs a duty pulse waveform corresponding to the measurement
values from the MX100 and the computation results set on the
computation channel.
[User Output]: Output continuously or a specified number of times a pulse duty ratio
(0.000 to 100.000%) using a previously set pattern. Also, you can enter
an arbitrary setting for User (Manual) in the Run screen.
Output width
DUTY ratio =
Output width
Pulse interval X 100 [%]
Pulse interval
Setting Patterns
You can edit patterns when not monitoring. Point setting values consist of the elapsed
time from pattern start and the output value. The elapsed time for the first point is fixed at
0 seconds. Up to thirty-two points can be defined. Up to two points can occupy a single
point in time.
Also, you can easily generate four types of patterns using the Generate Automatically
function.
User Output
You can set up to four user outputs. With pattern output collective operation buttons, you
can output, stop, or pause all user outputs at once.
Collective action buttons (output, stop, pause)
User Output Procedure
• Pattern
1. Click the Pattern tab in the User Output space.
2. Click the triangle button. The previously set pattern is output.
2-50
IM WX103-01E
2.8 Analog/PWM Output Settings
Output value display
Displayed output pattern
1
Click the Pattern tab.
2
Logger
Click the output pattern button to start pattern output
3
Stop output Pause output (the PAUSE display appears)
4
Select to output continuously or a specified number of times
Note
5
The Repeat check box in the User Output space is selected when the Default box under
Pattern Output (Loop Setting) in the channel settings is turned ON.
• Manual
1. Click the Pattern tab in the User Output space.
2. To change the output value, turn the rotary switch icon by dragging it to the left or
right, click a direction key, or type a value directly into the output value display box.
Output value display (can also be used for direct input)
Click the Manual tab.
Drag with the cursor to turn the rotary switch icon to the left and right
Turning the rotary switch icon*
*You can also turn the rotary switch icon by
holding down the Ctrl key (or Shift key)
and turning the mouse wheel.
Click a direction key to change the output value
Overview of Output during When Transmit Is Set
Value held
Output
value
Power ON
Measurement start
Measurement stop
Measurement restarts
Operation Status of Transmission Output by Communication Status
Operation of analog output, PWM output and other forms of transmission output depend
on the communication status as follows.
• For transmission output within the same unit, the operation does not depend on the
communication status.
• For computation or transmission from other units, if communication is broken the
operation is that specified for Error under Specified Output.
• For user output, if communication is broken the operation is that specified for Error
under Specified Output.
IM WX103-01E
2-51
Index
2.9
Event Processing
Event processing means to monitor for the specified type of event, and execute a
specified process when conditions are met. The following events are available.
• Alarm Event
• Data file Event
• Communication Event
• Start Record Event
• Stop Record Event
Procedure
Choose Event > Setting on the menu bar or click the Event Setting icon. The Event
Setting window appears.
Select each event
Event processing settings tab
Location of event log
(click to display the destination
folder in a separate window)
Setting Alarm Events
1. Click Alarm. The screen changes to the Alarm Event setting screen.
Entering Conditions
2. Click the Condition tab.
3. If the check box in the Action space is selected, the event becomes active.
4. Enter the target channel for the event in the Channel Range box in the Condition
Setting space.
5. Select the check box for the desired alarm under Ref. Alarm in the Condition
Setting space.
Setting Processes
6. Click the Process tab.
7. Select the The File is set with FTP check box in the Event Processing space to
send user files via FTP.
8. Select the Sending E-Mail check box in the Event Processing space and select the
User File check box under Attach File to send user files as an e-mail attachment.
9. In the Sending E-Mail item in the Event Processing space, select the User File and
Message check boxes under Body to copy the contents of the user file to the body of
an e-mail message, and send the message.
2-52
IM WX103-01E
2.9 Event Processing
Setting Up FTP, E-mail, and User Files
10. For FTP settings, click the FTP tab. For e-mail settings, click the E-mail tab. For
user file settings, click the User File tab. For instructions on settings in each of
these tabs, see the FTP Settings, E-Mail Setting, or User File Setting items in this
section.
2
Logger
Click the Condition tab.
Click here.
1
3
Select to enable
4
Enter the channels for the event
Select the alarm for reference
5
Click the Process tab.
Index
Select to send user files by FTP
Select to attach user files to an e-mail
Select to add message to the body of the e-mail
Select to add user file to the body of the e-mail
Setting Up Data File Events
1. Click Data File. The screen changes to the Data File Event setting screen.
Entering Conditions
2. Click the Condition tab.
3. If the check box in the Action space is selected, the event becomes active.
Condition Processing
4. Click the Process tab.
5. Select the The File is set with FTP check box in the Event Processing space to
send data files via FTP.
6. Select the Sending E-Mail check box in the Event Processing space and select the
Data File check box under Attach File to send user files as an e-mail attachment.
7. In the Sending E-Mail item in the Event Processing space, select the User File
and Message check boxes under Body to copy the contents of the message to the
body of an e-mail, and send the e-mail.
IM WX103-01E
2-53
2.9 Event Processing
Setting Up FTP and E-mail
8. For FTP settings, click the FTP tab. For e-mail settings, click the E-mail tab. For
instructions on settings, see the FTP Settings or E-Mail Setting items in this section.
Click the Condition tab.
Click here.
Select to enable
Click the Process tab.
Select to send data files by FTP
Select to attach data files to an e-mail
Select to add message to the body of the e-mail
Setting Communication Events
1. Click Comm.. The screen changes to the Communication Event setting screen.
Entering Conditions
2. Click the Condition tab.
3. If the check box in the Action space is selected, the event becomes active.
4. If the Disconnected check box in the Condition Settings space is selected, the
condition becomes valid when a communications disconnection is detected.
5. If the Reconnected check box in the Condition Settings space is selected, the
condition becomes valid when a communications reconnection is detected.
6. If the Data Lack check box in the Condition Settings space is selected, the
condition becomes valid when a communications related data dropout is detected.
Setting Processes
7. Click the Process tab.
8. Select the The File is set with FTP check box in the Event Processing space to
send unit information files via FTP.
9. In the Sending E-Mail item in the Event Processing space, select the Message
and Unit Information check boxes under Body to copy the message and unit
information to the body of an e-mail, and send the e-mail.
2-54
IM WX103-01E
2.9 Event Processing
Setting Up FTP and E-mail
10. For FTP settings, click the FTP tab. For e-mail settings, click the E-mail tab. For
instructions on settings, see the FTP Settings or E-Mail Setting items in this section.
Click the Condition tab.
Click here.
1
2
Logger
3
Select to enable
Select to perform an action when data
dropouts are detected
4
Select to perform an action when
communication reconnection is detected
Select to perform an action when broken
communication is detected
5
Click the Process tab.
Index
Select to send unit information files by FTP
Select to add unit information to the body of
the e-mail
Select to add message to the body of the e-mail
Setting Start Record Events
1. Click Start Record. The screen changes to the Start Record Event setting screen.
Entering Conditions
2. Click the Condition tab.
3. If the check box in the Action space is selected, the event becomes active.
Process Settings
6. Click the Process tab.
7. Select the The File is set with FTP check box in the Event Processing space to
send user files via FTP.
8. Select the Sending E-Mail check box in the Event Processing space and select the
User File check box under Attach File to send user files as an e-mail attachment.
9. In the Sending E-Mail item in the Event Processing space, select the User File
and Message check boxes under Body to copy the contents of the user file to the
body of an e-mail message, and send the message.
IM WX103-01E
2-55
2.9 Event Processing
Setting Up FTP, E-mail, and User Files
10. For FTP settings, click the FTP tab. For e-mail settings, click the E-mail tab.
For user file settings, click the User File tab. For instructions on settings in each of
these tabs, see the FTP Settings, E-Mail Setting, or User File Setting items in this
section.
Click the Condition tab.
Click here.
Select to enable
Click the Process tab.
Select to send user files by FTP
Select to attach user files to an e-mail
Select to add message to the body of the e-mail
Select to add user file to the body of the e-mail
Setting Stop Record Events
1. Click Stop Record . The screen changes to the Stop Record Event setting screen.
Entering Conditions
2. Click the Condition tab.
3. If the check box in the Action space is selected, the event becomes active.
Setting Processes
4. Click the Process tab.
5. Select the Synchronize Data File check box in the Event Processing space to
execute synchronization. When doing so, the File conversion check box becomes
available for selection.
6. Select the Excel, Lotus, or ASCII check box in the File Processing space to
convert synchronized data to the corresponding format. When doing so, the Select
Range and Folder boxes becomes available for selection.
7. Select the Select Range box under File Conversion to specify a range of
synchronized data for conversion.
8. Enter a folder name for saving the file in the Folder box. Select the Folder check
box to save converted files to the specified folder.
2-56
IM WX103-01E
2.9 Event Processing
1
2
Logger
9. Select the Synchronized File or Converted File check box under The File is sent
with FTP in the Event Processing space to send synchronized or converted files
via FTP.
10. Select the Synchronized File or Converted File check box under the Sending
E-Mail item in the Event Processing space to send synchronized or converted files
as e-mail attachments.
11. In the Sending E-Mail item in the Event Processing space, select the User File and
Message check boxes under Body to copy the contents of the message to the body
of an e-mail, and send the e-mail.
3
Setting Up FTP and E-mail
12. For FTP settings, click the FTP tab. For e-mail settings, click the E-mail tab. For
instructions on settings, see the FTP Settings or E-Mail Setting items in this section.
Click the Condition tab.
4
Click here.
5
Select to enable
Index
Click the Process tab.
Select to enable
Select the desired format
Select a range to convert
The input box shows the selected range
Select to specify a storage folder
Enter a name for the storage folder
Select to send synchronized files by FTP
Select to send converted files by FTP
Select to attach synchronized files to an e-mail
Select to attach converted files to an e-mail
Select to add message to the body of the e-mail
When specifying channels for the conversion
range, the channel number input box appears.
When specifying groups for the conversion
range, the group number input box appears.
IM WX103-01E
2-57
2.9 Event Processing
Configuring FTP
1.
2.
3.
4.
5.
6.
Click the FTP tab for an event.
Enter the name of the FTP server in the Server Name box.
Enter the port used for connection in the Port No. box.
Enter a login name in the Login Name box.
Enter a password to be used during login in the Password box.
Enter a directory name for transferring files in the Directory box.
Click the FTP tab.
Enter these items
Enter the directory where the file is to be sent
Copy the specified settings
Apply the copied settings
Configuring E-Mail
1. Click the E-Mail tab for an event.
2. Enter the name of the SMTP server in the Server Name box in the SMTP Server
space.
3. Enter the port used for connection in the Port No. box in the SMTP Server space.
4. Enter the subject of the e-mail in the Subject box in the E-Mail Setting space.
5. Enter the sender of the e-mail in the From: box in the E-Mail Setting space.
6. Enter the recipient of the e-mail in the To: box in the E-Mail Setting space.
7. Enter recipients of copies of the e-mail in the Cc: box in the E-Mail Setting space.
8. Enter the message of the e-mail in the Message box in the E-Mail Setting space.
Click the E-Mail tab.
Enter the name of the SMTP server
Enter the port number
Enter the items
Copy the specified settings
Apply the copied settings
User File Settings
1. Click the User File tab for an event.
2. Select the Alarm Information check box to include alarm information in the user file
output data.
3. Select the Instantaneous Value check box to include instantaneous values in the
user file output data.
4. Enter channel numbers in the box to specify a range of output data channels.
2-58
IM WX103-01E
2.9 Event Processing
1
5. Select the output data format.
Click here.
Select to add alarm information to the user file
Apply the copied contents
Enabling/Disabling Events
Enabling and disabling of each event can be performed using menus in addition to using
the Event Setting window.
Choose Event > Alarm Event (or other events). Select the check box next to an event
item to enable it.
Description
Data File Events
If the data file creation interval is extremely short, event processing may not be able to
be carried out.
Setting Up FTP and E-mail
This is available for all events. Also, you can set FTP and E-Mail for each event. To
copy selected contents from one event to another, click the Copy button in the lower right
of the setting screen. Then, click the Paste button in the FTP or E-Mail setting screen of
the event to which you wish to copy the contents.
Please consult with your network administrator regarding the FTP and SMTP server
names.
Note
• When sending e-mail, an extremely large number of e-mails can be generated.
• When attaching files to e-mail, the file sizes can be extremely large.
Executing Event Processing
An icon is displayed in the status bar when events occur and resulting processes are
carried out only icons of events processes executed are displayed)
Stop Record Event
Start Record Event
Communication Event
Data file Event
Alarm Event
Logging of Events
The processing of each event is saved to the created LOG folder. The location of the
LOG folder is shown in the lower left of the Event Setting window.
The log file contains one week’s worth of data.
IM WX103-01E
3
4
Copy the specified contents
2
Logger
Select to add instantaneous values to the user
file
Enter the range of data channels to add to
the user file
Enter the format of the data to add to t he user
file
2-59
5
Index
2.10 Starting/Stopping Data Monitoring and
Displaying the Monitor
Procedure
Start Data Monitoring
Click the Start Mon. button, or choose Start Monitoring from the Acquisition menu.
Click either one.
or
When you click the Start Mon. button, the Start Mon. button changes to the Stop Mon.
button, and the Run screen appears. If communication is possible, connections to the
MX100s selected on the System screen are established, and data monitoring starts. The
Comm. column in the Unit Status area shows Connect. If the IP address is not correct
or if another use is using the MX100, the Comm. column in the Unit Status area shows
Disconnect.
Start Recording button changes to Stop Recording button
Connect: When data monitoring is in progress.
Disconnect: When the power to the target MX100 is OFF.
When the target MX100 is not connected to the network,
When another use is using the target MX100, or
When the IP address is not correct
For a description of other contents displayed on this screen,
see the explanation in this section.
Note
If you enable the automatic start function, monitoring or recording starts automatically upon
starting of MXLOGGER. For details, see section 2.3, “Setting the Data Acquisition Conditions.”
Stop Data Monitoring
Click the Stop Mon. button, or choose Stop Monitoring from the Acquisition menu.
Connections to all MX100s on which data monitoring is in progress are dropped, and
data monitoring stops.
2-60
IM WX103-01E
2.10 Starting/Stopping Data Monitoring and Displaying the Monitor
1
Click either one.
or
When recording is stopped, the display changes to Start Recording
2
Logger
3
Displaying the Trend Monitor Window and Changing Display Settings
1. Click the Trend Monitor button on the toolbar or choose Trend Monitor from the
Window menu.
4
or
Click here
5
2. To change display settings, follow the instructions in the figure below.
If the channels of different measurement groups or channels of math groups are
assigned to the same display group, a monitor is displayed for each measurement group
or math group (see the figure below). (In other words, multiple monitors are displayed.)
A single Trend Monitor window can display up to four waveform display areas.
When setting multiple units, if channels of different units assigned to the same
measurement group are assigned to the same trend monitor display group, the trend
is displayed in a separate window.
Switch between channel number, tag No., and tag comment
Common to the Trend Monitor, Numeric Monitor, Meter Monitor, and Alarm Monitor
Displays a red bar on the group with an alarm occurring
Zoom in or out of the time axis
Switch the thickness of the displayed waveform
Switch the grid density
Switch the display group Switch the display zone
Turn ON/OFF the waveform
display limit (clip)
Monitor interval
Grid density
Channel number, tag No., tag
comment, and measurement unit
Switch the Y-axis
Background color density
Waveform display ON/OFF
Alarm display area
Y-axis
Time axis magnification
Displaying the Numeric Monitor Window
Click the Numeric Monitor button on the toolbar or choose Numeric Monitor from the
Window menu.
or
IM WX103-01E
Click here.
2-61
Index
2.10 Starting/Stopping Data Monitoring and Displaying the Monitor
A Numeric Monitor window opens as shown below.
Channel number
Alarm indication
Level with respect to the scale width
Numeric display Unit
Channel color
+OVER: When the measured value exceeds the upper limit of the measurement range or scale display range
–OVER: When the measured value exceeds lower limit the measurement range or scale display range
INVALID: After the power is turned ON until the data monitoring is established or when invalid computation
is found in the difference computation or remote RJC computation (see pages 2-18 and 2-19)
ILLEGAL: When a module is removed, when a module is broken, or when the MX100 module configuration
and the module configuration detected on the PC do not match
Displaying the Meter Monitor Window
Click the Meter Monitor button on the toolbar or choose Meter Monitor from the Window
menu.
or
Click here
A Meter Monitor window opens as shown below.
Displays a red bar on the group with
an alarm occurring
Channel color
Alarm indication
Channel number
Numeric display Unit
Bar meter
2-62
Analog meter
Thermometer
IM WX103-01E
2.10 Starting/Stopping Data Monitoring and Displaying the Monitor
1
Displaying the All Channel Monitor Window
Click the All Channel Monitor button on the toolbar or choose All Channel Monitor from
the Window menu.
2
or
Logger
Click here.
3
The All Channel Monitor opens as shown below.
Zoom in or out of the time axis
Switch the thickness of the waveform
Monitor Interval
4
Turn ON/OFF the waveform display limit
Switch the grid density
5
Change the grid density
Index
Change the background darkness
Note
Since data from all channels are displayed, the screen may update more slowly. The All
Channel Monitor dialog box will be displayed to warn you of this. To compensate, you can
increase the display magnification or decrease the size of the window.
IM WX103-01E
2-63
2.10 Starting/Stopping Data Monitoring and Displaying the Monitor
Displaying the Alarm Monitor Window
Click the Alarm Monitor button on the toolbar or choose Alarm Monitor from the Window
menu.
or
Click here.
An Alarm Monitor window opens as shown below.
Click the Group tab to display alarms by display groups; click the Channel tab to display
alarms by channels.
To display alarms per group, click Group.
Group name
Changes to red when an alarm occurs.
If unacknowledged alarms exist, a blinking
yellow ring appears around the signal lamp.
Click alarm indication area or choose Display-Alarm
ACK from the Action menu to acknowledge the alarm.
The ring disappears.
You can also click the icon that is displayed in
the status display bar at the bottom section of the
Main window to acknowledge alarms.
To display alarms per channel, click Channel
Alarms per channel
Status display bar at the bottom section of the Main window
Click here to acknowledge the displayed alarms.
Note
• If you choose Cascade or Tile from the Window menu when multiple windows are displayed,
the windows are displayed cascaded or tiled.
If you choose Arrange Icons from the Window menu when multiple windows are minimized,
the icons are rearranged at the bottom of the screen.
• If you click the Link ( ) button on the toolbar to enable the link, you can change the display
group of other windows from a single window.
• The maximum number of Monitor Windows that can be displayed for a single project is 20.
For Alarm Monitor windows, only up to two windows can be displayed.
• If you choose Alarm Sound from the Action menu, an alarm can be sounded on the PC
when an alarm occurs.
2-64
IM WX103-01E
2.10 Starting/Stopping Data Monitoring and Displaying the Monitor
1
Changing Display Settings on the General Display Settings Window
1. While data monitoring is in progress, click the General Display Settings button on the
toolbar or choose General Display Settings from the View menu.
2
or
2. Change the display settings according to the explanation in the figure below.
Display settings are entered for each display group. You can set up to 50 display
groups.
Display ON/OFF
Number of channels
assigned automatically
Execute automatic channel
Switch the display group assignment
Group name
Trip point
Channel color
4
Index
Show the channel
selection dialog box
Selecting the Maximum/Minimum Display zone Turn ON/OFF the trip
meter type value of the scale position
point display
Select the display format of the Y-axis (normal/exponential)
Y-axis when using
multi-axes zone Select the Y-axis type (linear/logarithmic)
Initializing, Copying, and Pasting of Settings on the General Display
Settings Window
On the General Display Settings window, you can reset the settings to default or copy
and pate the settings of one or multiple waveforms to the settings of other waveforms.
You can copy and paste according to the procedure below.
Click the copy source waveform number (No. column), click the Copy button at the
bottom of the window, click the copy destination waveform number, and click the Paste
button at the bottom of the window.
Click to select all
Drag to select a range of waveforms
To copy/paste
the item, click
to show the flag
To not copy/paste
the item, click to
hide the flag
Click this icon to reset to default settings
To select a meter collectively, click the respective icon
Click this icon to enter the same settings as the first channel in the selected range
Click this icon to automatically assign the channels
Click this icon to turn ON/OFF the channels collectively
IM WX103-01E
3
5
Logger
Click here.
2-65
2.10 Starting/Stopping Data Monitoring and Displaying the Monitor
Explanation
Run Display
See the explanation in section 2.11, “Pausing/Resuming the Updating of the Monitor Display
and Reading Measured Values Using Cursors” for further information on “Record Information.”
• Main Status
Displays the main operating status of the MXLOGGER.
Current time
Displays the data rate using a bar
Move the cursor here to display
the data rate in bytes/second
Write error
: No,
: Yes
Data dropout
: No,
: Yes
Communication error
: Connected,
: Disconnected
Monitor/Record status
: Stopped,
: Monitoring (green),
: Recording (red)
• Disk Information
Displays the amount of used disk space using a bar
Move the cursor here to display the remaining space
as a percentage
Used disk space
Free disk space
• Unit Status
Displays the status of each unit.
Status and
Capacity of the CF card
: Inserted,
: Not inserted,
: Inserted but not available
: Free space *.* MB
: Used space (orange)
(yellow): Broken module
(red): Module different from
the configuration
! (yellow): Calibration error module
Data dropout
: No,
: Yes
Monitor/Record status
: Stopped,
: Monitoring (green),
Communication error
: Connected,
: Disconnected
: Recording (red)
• Status display bar at the bottom section of the Main window
Display-Alarm ACK button
Displayed only when an alarm is occurring (see page 2-64)
Click here to acknowledge alarms
Show the DDE server window
Displayed only when the DDE server is
running (See 2.15, “Setting Up the DDE Server”)
Show the Monitor Server window
Displayed only when the monitor server
is running (See 2.14, “Setting Up the
Error indication while writing
Current
Monitor Server”)
time/record time To acknowledge, click the respective button
: Write error ACK button
Communication status
Monitor/Record status
: Data dropout ACK button
: Connected,
: Disconnected
: Stopped
Icon indicating the writing is in progress
: Monitoring
Displays the icon and the number of remaining data files to be written
: Recording
Display when events are executing
Displayed only when events are being
executed (see 2.9, “Event Processing”)
Note
If there are data files that have not been finalized (data writing have not been completed) in the
previous connection, the finalization of the data file is carried out immediately when the Logger
is started. If this happens, the remaining number of data files that have not been finalized is
shown to the left of the icon indicating that the writing is in progress on the status display bar
at the bottom section of the Main window. The remaining number indicates the progress of
finalization. If the remaining number is zero, it is not displayed.
2-66
IM WX103-01E
2.10 Starting/Stopping Data Monitoring and Displaying the Monitor
Simplified Display of the Run Screen
If you carry out the procedure described in the figure below when the Run screen is
displayed, the Run screen is reduced to a simplified display.
This is useful such as when displaying the Run screen next to Trend Monitor windows.
1
2
Logger
3
Click here.
Click here.
4
Simplifies the Run display
When manual DO settings exist,
the Manual DO area is also
displayed.
5
Display Groups and Group Names
Trend, Numeric, Meter, and Alarm Monitor windows show channels using groups. The
measured/computed values can be divided into up to 50 groups. Up to 32 channels can
be registered to a single group. The channels that can be registered are those that have
the Monitor check box selected on the Channel setup screen. When you click a channel
selection button on the General Display Settings window, the numbers of the channels
that can be registered are displayed (see the figure below).
To turn ON/OFF the trend waveform display on the Trend Monitor window, click the
lightblue button below the scale bar as shown in the figure below.
Hide the waveform
You can enter a group name using up to thirty characters. By default, group names
Group 01 to Group 50 are assigned. The names of the display groups that have channels
registered are displayed on each monitor window.
IM WX103-01E
2-67
Index
2.10 Starting/Stopping Data Monitoring and Displaying the Monitor
Y-Axis Type
You can select linear or logarithmic scale for the Y-axis when displaying the waveforms.
Linear
Logarithmic
Maximum and Minimum Values of the Y-Axis and the Display Format of the
Scale Values
Specify the maximum and minimum values of the Y-axis scale. The scale values can also
be displayed using logarithmic format as shown below.
Select the exponential
format
Selecting the Display Zone of the Waveform
You can select from the following. In the Zone setting on the General Display Settings
window, assume the bottom and top edges of the waveform display area to be 0% and
100%, respectively, and set the waveform display position by specifying the minimum
value (0 to 99%) and the maximum value (1 to 100%).
• User Zone
Displays each waveform at the position specified by Zone on the General Display
Settings window. A single Y-axis scale of the active waveform is displayed.
Select user zone
Set the display zone
Displays the active Y-axis scale
Indicates the active Y-axis
Click the bar to specify the
Y-axis you wish to activate
• Edit Zone
Like the user zone, each waveform is displayed at the position specified by Zone
on the General Display Settings window. However, you can change the zone on the
Trend Monitor window. A single Y-axis scale of the active waveform is displayed.
Select edit zone
Drag the knob to change the minimum/maximum
value of the zone separately
Drag the bar to change the zone position without
changing the zone width
2-68
IM WX103-01E
2.10 Starting/Stopping Data Monitoring and Displaying the Monitor
• Full Zone
Displays all the waveforms over the full zone of the waveform display area regardless
of the Zone settings on the General Display Settings window. A single Y-axis scale of
the active waveform is displayed.
Select full zone
2
Logger
1
3
Waveform display area (full zone)
• Slide Zone
Displays the waveforms by slightly offsetting the display position of each waveform
vertically regardless of the Zone settings on the General Display Settings window. A
single Y-axis scale of the active waveform is displayed.
4
5
Select slide zone
Index
Slide in this manner
• Auto Zone
Displays the waveforms by dividing the waveform display area evenly according to
the number of displayed waveforms regardless of the Zone settings on the General
Display Settings window.
Select auto zone
Divided evenly automatically
• Multi-Axes Zone
All the Y-axes of the displayed waveforms are aligned horizontally. To hide a Y-axis,
clear the Y-Axis check box on the General Display Settings window. The display zone
is set to the position specified by Zone on the General Display Settings window.
Select multi-axes zone
Indicates the active Y-axis
Turn OFF the Y-axis
display of Ch00002
Click the bar to move the
specified Y-axis to the left end
The scale of Ch00002 is not displayed.
IM WX103-01E
2-69
2.10 Starting/Stopping Data Monitoring and Displaying the Monitor
Trip Points
You can display a trip line to indicate a particular value of interest (trip point) in the
waveform display area. Two trip points (trip 1 is red, trip 2 is blue) can be set on each
waveform. The trip line of the waveform corresponding to the left-most Y-axis is shown in
the waveform display area.
Trip 1 value
Trip 2 value
Trip 2 value
Trip line
Turn ON the trip line display
Trip 1 value
Channel Colors
Clicking the channel color displayed in the Color column on the General Display Settings
window opens the Color dialog box. You can select the color of each channel using the
Color dialog box. To create custom colors, click the Define Custom Colors button in the
Color dialog box.
Clipping of Waveforms
By default (clip OFF), the waveform is not displayed when the measured/computed value
exceeds the minimum/maximum value of the scale (see the lower left figure). When clip
is turned ON, values that are smaller than the minimum value of the scale are displayed
as the minimum value and the values that are larger than the maximum value of the
scale are displayed as the maximum value.
Clip OFF
Clip ON
Expanding or Reducing the Time Axis on the Waveform Display
On the waveform display, you can click the expand/reduce icon to expand or reduce
the time axis for each waveform display area. The maximum magnification is x20. The
minimum magnification varies depending on the size of the waveform display area.
Time axis expand/reduce icon
Magnification
2-70
IM WX103-01E
2.10 Starting/Stopping Data Monitoring and Displaying the Monitor
Adding Marks
You can display marks in the waveform display area (see the figure below). You can
enter a text to be attached to the mark (“Mark” by default) using up to 15 characters.
Click the Mark button or choose Mark Configuration from the Action menu. You can enter
the text in the dialog box that opens.
3
Up to two hundred marks can be displayed. When two hundred is exceeded, marks are
overwritten starting from the oldest ones. However, when recording is in progress, the
marks that are overwritten are saved to the data file.
Mark setup dialog box
Mark
5
Index
If this check box is selected, the mark is placed without
displaying the dialog box when you choose Put a Mark
from the Action menu.
Note
Marks cannot be placed when the monitor update is paused.
Grid Density
You can change the displayed grid density. The available settings are standard, dense
grid 1, or dense grid 2.
Standard Grid
4
Text of the specified mark
Enter the text to be
displayed as a mark
Dense Grid 1
Dense Grid 2
IM WX103-01E
2
Logger
Click either one
1
2-71
2.11 Pausing/Resuming the Updating of the Monitor
Display and Reading Measured Values Using
Cursors
Procedure
Pausing and Resuming the Updating of the Monitor Display
To pause the updating of the monitor display, click the Pause button or choose Pause
from the Acquisition menu. When paused, the word “Pause” on the button toggles
between red and orange.
or
Click either one.
Choose this.
Note
Recording continues even when the updating of the monitor display is paused.
To resume the monitor display, click the Pause button or choose Pause from the
Acquisition menu.
Reading Measured/Computed Values Using Cursors
1. Click the position where you wish to read the measured/computed data in the
waveform display area of the Monitor screen. If you wish to read another point
simultaneously, drag the cursor. Cursor A appears at the position where you first
clicked; Cursor B appears at the position where you released the mouse button. A
yellow circle is displayed where the waveform and the cursor cross.
You can move the waveform that is displayed in the waveform display area using the
scroll buttons or scroll bar.
Measurement point
Cursor A
Cursor B
Scroll button
Scroll bar
2. From the View menu, choose Cursor’s Values.
2-72
Choose this.
IM WX103-01E
2.11 Pausing/Resuming the Updating of the Monitor Display and Reading Measured Values Using Cursors
1
A Cursor’s Values window opens as shown below.
Waveform
Readout value of Cursor A
display color
Readout value of Cursor B
Channel number
(Readout value of Cursor B) – (readout value of Cursor A)
2
Logger
3
Time between Cursors A and B
Time at Cursor B
Time at Cursor A
4
To clear the cursors, choose Erase Cursor from the View menu.
5
Choose this.
Index
Explanation
Pausing the Updating of the Waveform Display
While monitoring the waveform, you can pause the updating of the waveform display and
check the past waveforms.
Pausing the display on the numeric display holds the current values immediately before
the pause operation on display.
Reading Measured/Computed Values Using Cursors
When the updating of the waveform display is paused, you can read values using
cursors. Two cursors can be displayed. Below are the values that can be read using
cursors.
• Values at the cursors.
• Difference in the value between the cursors.
• The time at the cursor position.
• The time between the cursors.
IM WX103-01E
2-73
2.12 Starting and Stopping Data Recording
Procedure
Data monitoring must be in progress to start the recording operation. For instructions on
starting the data monitoring, see section 2.10, “Starting/Stopping Data Monitoring and
Displaying the Monitor.”
Starting the Recording
Click the Start Recording button, or choose Start Recording from the Acquisition
menu.
or
Click either one.
Choose this.
When recording starts, the display changes as shown in the figure below. To divide the
file during recording, click the Save button or choose Manual Save from the Acquisition
menu.
or
Click either one.
Choose this.
While the Record Start Condition specified on the Acquisition Condition screen is not
met, the word “Waiting” appears on the Record Start button (see figure below).
Displays Waiting while the record start condition is not met
Note
Clicking the Start Rec. or Stop Rec. buttons repetitively at short intervals or clicking the Manual
Save button many times may hinder the measurement operation and file division process.
Stopping the Recording
To stop recording when Stop Condition specified on the Acquisition screen is set to
Continuous or before the Stop Condition is met, click the Stop Rec. button or choose
Stop Recording from the Acquisition menu.
or
Click either one.
Choose this.
2-74
IM WX103-01E
2.12 Starting and Stopping Data Recording
Click the Stop Rec button or the Stop button on the tool bar, or select Stop Recording
from the Acquisition menu. Click OK in the dialog box that is displayed (like the one
below).
2
Starting/Stopping the Recording
Data is recorded according to the Start condition and Stop condition specified on the
Acquisition setup screen. Recording starts immediately when you click the Start Rec
button only when Start Condition is set to On Record. For all other settings, the detection
of whether the start condition is met is started when you click the Start Rec button.
Note
• The creation of the data file starts after the recording is stopped. Therefore, it may take time
for the data save operation to complete.
• You cannot exit the software if the saving of the data is not complete. If you attempt to do
so, a dialog box with the message “Writing data files Currently” opens. In this case, the
remaining number of data files to be finalized is displayed to the left of the icon indicating
that the writing is in progress on the status display bar (see page 2-43) at the bottom section
of the Main window. You can close the software when this number indication clears.
• If the specified directory for saving files does not exist when recording is started, the
directory is created. If the directory cannot be created, the files are saved to the Data
directory in the MXLOGGER installation directory.
• Do not specify the file save destination to a non-writable drive.
Run Display
The Run screen displays the run information. For a description of the displayed contents
on the Run screen other than those described below, see the explanation in section 2.10,
“Starting/Stopping Data Monitoring and Displaying the Monitor.”
• Record Information
Record time
File creation progress indication bar
Move the mouse pointer here to display the remaining time value
Number of data files created
Estimated size of the file currently being created
Estimated completion time of the file currently being created
• Files created in the past
Record files created in the past
3
4
Explanation
Logger
Click OK. When you click OK, the word “Stop Rec.” on the button changes to “Saving”
until the recording actually stops.
IM WX103-01E
1
Select a file and click the Open
button to start the Viewer.
(You can also double-click to
start the program.)
2-75
5
Index
2.13 Saving/Loading and Printing Setup Data
(Project)
Procedure
Saving Setup Data (Project)
1. From the File menu, choose Save or Save As.
2. If you choose Save As or choose Save when saving the setup data for the first time,
enter the file name in the Save As dialog box and click Save.
If you attempt to save the file using an existing file name, a dialog box appears for
you to confirm whether the file is to be overwritten.
or
Loading Setup Data (Project)
1. From the File menu, choose Close.
If data monitoring is in progress, a message “Stop monitoring and quit?” appears.
Click OK.
2. From the File menu, choose Open.
3. In the Open dialog box, select a project file and click the Open button.
Note
When you carry out the procedure above, the current setup data is discarded and changed to
the setup data of the project that is loaded. If you need the current settings, save the project
first before loading the setup data.
2-76
IM WX103-01E
2.13 Saving/Loading and Printing Setup Data (Project)
1
Printing Setup Data
1. From the File menu, choose Print.
The Print dialog box opens.
2. In the Print dialog box, select the printer, print range, and the number of copies, and
then click the OK button.
Logger
Display example of the Print Setup dialog box
2
3
4
5
Print Preview
From the File menu, choose Print Preview.
The print image is displayed.
Index
Setting Up the Printer
1. From the File menu, choose Print Setup.
The Print Setup dialog box opens.
2. Set the paper size, orientation, etc. Then, click the OK button.
Display example of the Print Setup dialog box
IM WX103-01E
2-77
2.13 Saving/Loading and Printing Setup Data (Project)
Explanation
Saving Setup Data (Project)
When the Logger is started, the screens are displayed according to the setup data of
the project file that is automatically created (latest.mxe in the MXLOGGER folder). In
this case, the setup specified on each screen is automatically saved when the Logger is
closed.
If you save the setup data (project) as a project file by assigning a name and you open
the project file, the setup specified on each screen is not automatically saved when the
Logger is closed. To save the setup data, you must choose Save from the File menu.
Save Destination
The default save destination varies depending on the system that is running.
File Name
The extension is .mxe. The default file name is NewProject1.mxe.
Creating a New Project
Create a new project when you wish to monitor the measured/computed data using new
settings.
Print Contents of Setup Data
The following figure show how the setup data is printed.
2-78
IM WX103-01E
1
2.14 Setting Up the Monitor Server
Procedure
2
Starting
Click the Monitor Server button on the toolbar or choose Run Server from the File menu.
Logger
Starting and Exiting the Monitor Server
3
or
4
Click here
5
The Monitor Server window opens as shown below.
Status display bar at the bottom section of the Main window
Click here to display the Monitor Server window
Displayed only when the Monitor Server is running
Exiting
On the Monitor Server window, choose Exit from the Monitor Server menu.
Choose this.
Changing the Port Number
1. From the File menu, choose Port No..
The Port No. dialog box opens.
2. Enter the desired port number in the Port No. box and click OK.
Port number (50284 by default)
Use this port number unless this number is
being used by another software program
3. In the dialog box with the message “Port No. is available for next time.” click OK.
Then, restart the server to activate the new port number.
IM WX103-01E
2-79
Index
2.14 Setting Up the Monitor Server
Explanation
Monitor Server Function
The Monitor Server function allows PCs running the following software programs to
monitor the data that the MXLOGGER is monitoring.
• AddObserver
• AddObserver Runtime
• AddMulti
• AddTrigger
The MXLOGGER can hold up to 61 data memories*. A system No. between 0 and 60 is
assigned to each data memory according to the monitor interval of the individual units
specified on the Logger. Each system number has information on the unit No., the
channel range, the monitor interval, and the number of channels.
Clients (PCs running AddObserver, AddObserver Runtime, AddMulti, or AddTrigger) can
monitor the data by specifying this system number.
For instructions on monitoring the data on each software program, see the user’s manual
for each software.
* Each unit (MX100) has three monitor intervals, and the MXLOGGER can connect up to
20 MX100s. Therefore, the maximum number of data memories is 3 × 20 = 60. Adding the
monitor interval of the computation channel makes it 61.
Host name (computer name) of the connected client
Maximum number of connections: 32
Number of channels
Number of channels being monitored within the channel range
Monitor interval
Data monitor interval of the respective measurement group
Channel range
Channel range corresponding to the unit NO. and monitor interval
Unit No.
Unit number on the Logger
00 [Meas.] to 19 [Meas.]: Measurement data that the MX100 acquired
99 [Math]: Computed data
System No.
Number assigned to each data memory (0 to 60)
Port Numbers
The default value is 50284. Unless other software programs are using a different port
number, it is recommended that this port number be used.
2-80
IM WX103-01E
1
2.15 Setting Up the DDE Server
Procedure
2
Starting
Click the DDE Server button on the toolbar or choose DDE Server from the File menu.
Logger
Starting and Exiting the DDE Server
3
or
4
Click here.
5
The DDE Server window opens as shown below.
Topic sdata tab
Topic data tab
Index
Status display bar at the bottom section of the Main window
Click here to display the DDE Server window
Displayed only when the DDE Server is running
Exiting
On the DDE Server window, choose Exit from the DDE Server menu.
Choose this.
IM WX103-01E
2-81
2.15 Setting Up the DDE Server
Description
DDE Server Function
The DDE server function displays the following data on application software that supports
the DDE server.
Parentheses indicate item names.
Measured Data
Computed data
Date and time (date)
Time (time)
Seconds (sec)
Data number (no)
For Excel, enter “application|topics!item” in a cell. For example, to display measured data
from channel 1, enter “MXDde|data!ch0001.” For details on data specification, see the
documentation for the software you are using.
2-82
IM WX103-01E
1
2.16 Displaying the Software Version and Other
Information
Procedure
2
Logger
Click the About button on the toolbar or choose About from the Help menu.
A dialog box showing the version number and other information opens.
3
or
Click here.
4
Version
5
Index
IM WX103-01E
2-83
Chapter 3
Viewer
3.1
1
Loading Data Files
Procedure
2
1. Start the Viewer.
2. From the File menu, choose Open.
You can also click the
button on the toolbar.
The Open dialog box opens.
3
Viewer
4
5
File information
In the case of data saved using the
Integration Monitor of the MX100
Standard Software, MX100 Standard
Logger is displayed by Creator.
Index
3. Select the file you wish to load and click Open.
The waveform display window opens.
If you open data files that were recorded using the Logger of the MXLOGGER or the
Integration Monitor of the MX100 Standard Software, a dialog box is opened with
the message, “File not synchronized. Synchronize data file?” before the waveform
display screen appears. To synchronize the data, click Yes, otherwise, click No.
If you open a file containing recorded data of multiple MX100s and you click the
No button, the Select Unit No. dialog box opens. Click the desired MX100 unit
number to display the data corresponding to the unit. When displaying data without
synchronization, data of different units cannot be displayed simultaneously.
Opening Data Saved to the CF Card on the MX100
Before the waveform display window is displayed, if a CF file that can be joined
exists, a dialog box appears with the message “Join Related Files?” To join the data
files, click Yes, otherwise, click No.
IM WX103-01E
3-1
3.1 Loading Data Files
Click the unit number
Synchronized file
A file with .mxs extension
Unsynchronized file
A file with .mxd extension
The waveforms of the measurement channels and math channels are divided by the Mon.
Interval specified on the Acquisition screen of the Logger even when in the same group.
Note
If you click the Yes button in the synchronization confirmation dialog box when a synchronized
file already exists, the message dialog box below opens. Click OK to load the synchronized file
and open the waveform display window.
Explanation
Loadable Files
• Data files recorded using the Logger of the MXLOGGER or the Integration Monitor of
the MX100 Standard Software (.mxd extension).
• Data files saved after performing synchronization using the Viewer (.mxs extension).
• Data files saved to the CF card using the MX100 (.mxd extension).
• Data files saved after being joined on the Viewer (with the .mxc extension)
Display Range, File Size, and Number of Data Points of the Loadable Data
•
•
•
•
50 groups
Maximum channels per group: 32
Example: 2 GB
Data points: 5 million
Note
• When loading a file of close to five million points, the error message “Insufficient Memory.
Close immediately.” appears. If this happens, set Total paging file size for all drives to 2 GB
or more. On PC, you can change the setting in the dialog box that opens by choosing from
the System Properties dialog box, Advanced > Settings under Performance > Advanced
> Change under Virtual memory.
• Please avoid loading multiple files containing close to five million data points. Doing so may
degrade the PC performance greatly.
3-2
IM WX103-01E
3.1 Loading Data Files
Synchronization
The Logger of the MXLOGGER or the Integration Monitor of the MX100 Standard
Software sends PC’s time information to the MX100 at measurement intervals. The PC’
s time information is received along with the measured data when the data is received
from the MX100. When measured data is recorded, the PC time information (the MX100’
s time information is used on the monitor display of the Logger) is also recorded.
2
3
PC
Viewer
Packet
PC Time
1
4
Packet
MX100
PC Time Measured data
...
...
MX100
5
MX100
PC Time Measured data
On the other hand, each MX100 makes measurements based on the main module clock.
Therefore, the PC’s time that is recorded with the measured data and the PC’s time when
measurements were made may be offset. When loading the data, the Viewer can process
the time information to match the PC’s time that was present at time of measurement.
This process is called synchronization (for details, see Note on the next page).
Note
• Details of Synchronization
Given M recorded data points of a given channel of a data file that has not been
synchronized, synchronization (linear interpolation) is carried out as follows:
1. From the record start/stop time and record interval, determine N, the number of data
points that will result after synchronization of the relevant channel.
2. From the record start time and record interval, determine Stn (n=0, ... , N-1), the PC time
after synchronization of each data point.
3. From the record start/stop time and the PC millisecond clock counter values at record
start/stop, determine PCcntPerms, the clock counter value per millisecond.
4. From the PC millisecond clock counter values recorded with the data before
synchronization and PCcntPerms, determine Rtm (m=0, ... , M-1), the PC time of the
data before synchronization.
5. Determine m such that the expression Rtm-1 ≤ Stn < Rtm is satisfied and retrieve the
data values before synchronization VRtm-1 and VRtm at the PC time of Rtm-1 and Rtm.
6. Determine the data values after synchronization from the expression VStn = (Stn –
Rtm-1) × (VRtm – VRtm-1)/(Rtm – Rtm-1) + VRtm-1 where (n=0, ... , N-1 and m=0, ... ,
M-1).
7. Determine the data values after synchronization for N data points, and then write them to
the synchronized file.
Data value
VRtm
VStn
VRtm-1
VRtm+1
VRtm-2
Rtm-2
Rtm-1
Stn
Rtm
Rtm+1
PC time
• When loading a data file saved by the MX100 to the CF card, synchronization is not possible
because the PC time information needed in the data synchronization is not present.
IM WX103-01E
3-3
Index
3.1 Loading Data Files
• Synchronization may take time depending on the number of divided files and the number of
data points in the divided files.
• It is recommended that synchronization be performed on a hard disk with adequate free
space.
• Even when synchronization is performed, the files before synchronization (.mxd extension)
are not deleted.
• Performing synchronization on the Viewer or loading a file with a great number of data
points while data monitoring/computation is in progress on the Logger of the MXLOGGER
or the Integration Monitor of the MX100 Standard Software may adversely affect the data
monitoring and computation (such as data dropouts).
• If you change the PC’s time while data is being monitored on the Logger of the MXLOGGER
or the Integration Monitor of the MX100 Standard Software, the error in the clock counter
value per millisecond of the PC used in the synchronization process will become large. If the
error in this value is greater than or equal to 2% when synchronizing the data file created at
the time PC’s time was changed, the clock counter value of 1 millisecond is considered to
be 1 for the purpose of synchronization.
• If communication is disrupted temporarily due to power failure or network failure during the
recording operation, the PC time of the data measured by the MX100 while communication
is disrupted (see “Details of Synchronization” above) is recorded as the old PC time before
communication was disrupted in the file created immediately after communication recovers.
If you attempt to synchronize this file, a dialog box with the message “Some channels do
not have enough information to synchronize.” appears. In this case, synchronization is
performed with the premise that the MX100 measured the data using the logical (estimated)
record interval.
Data Files Created by Synchronization
The data file created by synchronization takes on the same file name with .mxs
extension.
When synchronizing, if the backup file is placed in the same folder, data dropout from
the recording file is embedded in the backup file (data saved to the CF card), and
synchronization of channel data is performed. Also, the between channel delay in the
medium speed modules is compensated during synchronization.
Synchronized files created by the synchronization process are created in the same
directory as the data file normally displayed. The file name is “the name of the file being
displayed (excluding the .mxd extension)” + “mxs extension” However, if the destination
storage medium is write-protected, the file is created in the temporary file directory. The
temporary file directory is displayed in an error message dialog box.
Joining of Divided Files
When divided data files are loaded, they are joined by the synchronization process.
If a file that can be joined to the displayed data exists and you synchronize the data,
the existing synchronized file is overwritten. If the existing synchronized file cannot be
overwritten (set to read-only attribute, for example), a new synchronized file is created.
A sequence number is added to the name of the new synchronized file (“the name of the
file being displayed” + “sequence number” + “mxs extension” For example, if the existing
synchronized file name is “data-0000.mxs” the new file name is “data-0000- 1.mxs”
The following limitations exist in the joining of files through synchronization.
• If any of the divided data files are missing, the data files after (or before) the missing
file are not joined.
• If the total number of measured data points in the divided data files exceeds 5 million
(including data that is dropped due to power failures and other failures), files that
would not cause the total number of displayed data points to exceed 5 million are
joined.
3-4
IM WX103-01E
3.1 Loading Data Files
1
2
3
Viewer
When synchronizing data files that exceed the 5 million point range, the file is used
as the start file and succeeding files are joined. If 5 million points is not exceeded
when the last file is joined, files before the start file is searched in order, and files that
would not cause 5 million points to be exceeded are joined. In this case, because
the files before the start file are also joined to the previous synchronized file, two
synchronized files for this file would exist. If you open a file before the start file and
perform synchronization, the viewer displays the first file the OS finds (either of the
two existing synchronized files). In such cases, it is recommended that the files you
wish to join are selected so that the limit is not exceeded, copied to the user’s working
folder, and synchronized there.
• Divided files can be joined up to the point in which the size of the joined file reaches 2
GB.
4
CF File Joining Function
Data saved to the CF card on the MX100 can be joined.
• The data that can be joined are CF files that were created on the same unit from
record start to record stop.
Group of files with
file number 0
This group becomes the unit of joining
Measurement
Interval 1
[File 0]
Start condition:
start
Stop condition:
divide
[File 1]
Start condition:
divide
Stop condition:
divide
[File 2]
Start condition:
divide
Stop condition:
divide
• • •
[File N*]
Start condition:
divide
Stop condition:
stop
Measurement
Interval 2
[File 0]
Start condition:
start
Stop condition:
divide
[File 1]
Start condition:
divide
Stop condition:
divide
[File 2]
Start condition:
divide
Stop condition:
divide
• • •
[File N*]
Start condition:
divide
Stop condition:
stop
Measurement
Interval 3
[File 0]
Start condition:
start
Stop condition:
divide
[File 1]
Start condition:
divide
Stop condition:
divide
[File 2]
Start condition:
divide
Stop condition:
divide
• • •
[File N*]
Start condition:
divide
Stop condition:
stop
5
Index
*Max number of files
time
Recording start
Recording stop
• Data are joined by file groups of data with multiple measurement intervals of the same
file number.
• If a number of files equalling the number of measurement intervals of the specified file
number (if three measurement intervals are specified, the number would be 3) does
not exist in the file group, files just prior to the file group of the relevant file number are
joined.
• The resulting files that are created are limited to five million points/2 GB.
• The extension of the joined files is .mxc.
The operation is carried out by choosing File > Join in the menu. Also, when opening
data files, if you choose data saved to the CF card in the MX100 main unit, the “Join
related files” dialog box appears and the files are joined.
CF files or joined data files displayed in the active window can themselves be joined, and
Join in the menu is enabled.
If the data files displayed in the active window are not CF or joined files, Join is disabled
in the menu.
Note
When joining or performing other such processes, copy the data files onto the hard disk of the
PC from the CF card first.
IM WX103-01E
3-5
3.2
Setting the Display
Procedure
Changing the Display on the Waveform Display Window
Change the display settings according to the explanation is the figure below.
Alarm display ON/OFF
Zoom in or out of the time axis
Switch the display zone
Switch the grid density
Clip display ON/OFF
Move the cursor to the point where
the alarm changed
Switch the display group
Change the grid density
Switch the active channel
Change the background
darkness
Y-axis
Channel number and measurement unit
Zone display section ON/OFF
Channel ON/OFF
Changing the Display Using the Toolbar
Change the display settings according to the explanation is the figure below.
Show the General Display
Settings window
Add a mark
3-6
Show the waveform display window
Show the numeric display window
Alarm/marker list display
Show the window for displaying cursor values
Show the window for displaying statistical
computation over an area
Switching between Absolute and Relative time
Tag comment display
Tag No. display
Channel number display
Move cursor B to the right mark
Move cursor B to the left mark
Move cursor A to the right mark
Move cursor A to the left mark
IM WX103-01E
3.2 Setting the Display
Changing the Display Using the Menu
Choose appropriate commands from the Edit, View, and Window menus to change the
display.
Show the General Display Settings window
Change the data file display
Switch between channel number, tag No.,
and tag comment displays
Erase the cursor
Select a mark search
Add/Delete a mark
* Displays also the Format item during
numeric display
5
Switch the display window
Index
Changing the Display Using the Display Settings Window
See the explanation in the figure below. Change the display settings and click OK.
Set the display for each display group.
Switch the display group
Group name
Channel display color
Turn ON/OFF the trip point display
Trip point value
Display zone position
Maximum/Minimum value of the scale
Select the Y-axis display format
Select the Y-axis type (linear or logarithmic)
Turn Y-axis display ON/OFF when displaying multi-axes zone
Select channels (displays the channel selection dialog box)
IM WX103-01E
3
4
Arrange the display window (select cascade or tile)
Arrange window icons
Show the waveform display window
Show the numeric display window
Select how to arrange the display area from auto, horizontal, and vertical
Alarm/marker list display
Show the window for displaying cursor values
Show the computation result display window
Display ON/OFF
2
Viewer
Switch between absolute and relative time*
Turn ON/OFF the toolbar
Turn ON/OFF the status bar
1
3-7
3.2 Setting the Display
Explanation
Display Groups and Group Names
The values of each channel that are loaded are divided into groups that were used during
recording and displayed using waveforms or numeric values. The measured/computed
values can be divided into up to 50 groups. Up to 32 channels can be registered to a
single group. If you click the channel selection button on the General Display Settings
window, the Channel No. dialog box opens (see the figure below). The labels used to
identify the waveforms can be set to tag numbers or tag comments in addition to channel
number on the View menu. The selected label type (channel number, tag number, or tag
comment) is used in the Channel No. dialog box. Select <None>, if you are not assigning
a channel.
To turn ON/OFF the trend waveform display on the waveform display window, click the
button below the active channel switch bar as shown in the figure below.
Hide the waveform
The name assigned to each group can be changed using up to 30 characters. The
names of the display groups that have channels registered are displayed on the
waveform display window or numeric display window.
Y-Axis Type
You can select linear or logarithmic Y-axis for displaying the waveforms.
Linear
Logarithmic
3-8
IM WX103-01E
3.2 Setting the Display
Maximum and Minimum Values of the Y-Axis and the Display Format of the
Y-Axis Values
The maximum and minimum values of the scale on the waveform display can be
changed. If you click the Scale Calc. button on the General Display Settings window,
the maximum and minimum values of the scale on the selected channels are calculated
automatically according to the maximum and minimum values of the data.
The Y-axis can also be displayed using logarithmic format as shown below.
1
2
3
Viewer
Select the exponential format
4
Selecting the Waveform Display Zone
You can select from the following. In the Zone setting on the General Display Settings
window, assume the bottom and top edges of the waveform display area to be 0% and
100%, respectively, and set the waveform display position by specifying the minimum
value (0 to 99%) and the maximum value (1 to 100%).
• User Zone
Displays each waveform at the position specified by Zone on the General Display
Settings window. A single Y-axis active channel waveform can be displayed.
Set the display zone
Select user zone
Indicates the bar of
the active channel
Display the Y-axis of the active channel
Click the bar to specify the active channel
• Edit Zone
Like the user zone, each waveform is displayed at the position specified by Zone
on the General Display Settings window. However, you can change the zone on the
waveform display window. A single Y-axis of the active waveform can be displayed.
Select edit zone
Drag the knob to change
the minimum/maximum
value of the zone separately
IM WX103-01E
Drag the bar to change the zone position
without changing the zone width
3-9
5
Index
3.2 Setting the Display
• Full Zone
Displays all the waveforms over the full zone of the waveform display area regardless
of the Zone settings on the General Display Settings window. A single Y-axis of the
active waveform is displayed.
Select full zone
Waveform display area (full zone)
• Slide Zone
Displays the waveforms by slightly offsetting the display position of each waveform
vertically regardless of the Zone settings on the General Display Settings window. A
single Y-axis of the active waveform is displayed.
Select slide zone
Slide in this manner
• Auto Zone
Displays the waveforms by dividing the waveform display area evenly according to
the number of displayed waveforms regardless of the Zone settings on the General
Display Settings window.
Select auto zone
3-10
Divide evenly automatically
IM WX103-01E
3.2 Setting the Display
• Multi-Axes Zone
All the specified Y-axes of the displayed waveforms are aligned horizontally. To
hide a Y-axis, clear the Y-Axis check box on the General Display Settings window.
The display position is set using Zone on the General Display Settings window.
Dragging the channel bar to the waveform display area shows the Y-axis of the
corresponding channel. Drag the Y-axis to the zone display area hides the Y-axis of
the corresponding channel.
Indicates the
specified Y-axis
1
2
3
Select multi-axes
zone
Viewer
4
Turn OFF the Y-axis
display of Ch00002
5
The Y-axis display of Ch00002 is not displayed.
Click the bar to move the specified Y-axis to the right end
Index
Trip Points
You can display a trip line to indicate a particular value of interest (trip point) in the
waveform display area. Two trip points (trip 1 is red, trip 2 is blue) can be set on each
waveform using the Trip 1 and Trip 2 settings on the General Display Settings window.
The trip line of the waveform corresponding to the right-most Y-axis bar is shown in the
waveform display area.
Trip 1 value
Trip 2 value
Trip line
Trip 1 value*
Turn ON the trip line display
Trip 2 value*
* Can be moved
by dragging
Channel Colors
Clicking the channel color displayed in the Color column on the Display setup screen
opens the Color dialog box. You can select the color of each channel using the Color
dialog box. To create custom colors, click the Define Custom Colors button in the Color
dialog box.
IM WX103-01E
3-11
3.2 Setting the Display
Clipping of Waveforms
By default (clip OFF), the waveform is not displayed when the measured/computed value
exceeds the minimum/maximum value of the scale (see the lower left figure). When clip
is turned ON, values that are smaller than the minimum value of the scale are displayed
as the minimum value and the values that are larger than the maximum value of the
scale are displayed as the maximum value.
Clip ON
Clip OFF
Expanding or Reducing the Time Axis on the Waveform Display
On the waveform display window, you can click the expand/reduce icon to expand or
reduce the time axis in the range of 20 to 1/1000 times for each waveform display area.
Time axis expand/reduce icon
Magnification
Adding Marks
In addition to the marks placed using other programs such as the Logger, you can add
marks at the positions where you click (displays a cursor) on the waveform display
area. You can enter a text to be attached to the mark (“Mark” by default) using up to 15
characters. You can also select Left, Center (default), Right, or Flag (small mark without
text) for the Type. For types other than Flag, the specified string and the relative or
absolute time at the mark position are displayed.
You can set the string and type in the Mark dialog box that opens when you click the
Append Mark icon (or choose Append Mark from the Edit menu). In the Mark dialog box,
you can select whether to add the mark to the waveforms of all groups (default) or only
the waveforms of the displayed group.
To delete specific displayed marks, select the range using cursors, and then choose
Delete Mark from the Edit menu. To delete all the marks added using the Viewer, choose
Reset Mark from the Edit menu.
Display the cursor
Left end
Mark display icon
or
Flag Center
Marks added on the Viewer are green,
marks added created through
computation are yellow, and marks
created using the Logger or MX100
Standard Software are orange.
Double-click the mark to change the settings
Grid Density
You can change the displayed grid density. The available settings are standard, dense
grid 1, or dense grid 2. For instructions, see section 2.10, “Starting/Stopping Data
Monitoring and Displaying the Monitor.”
3-12
IM WX103-01E
3.2 Setting the Display
1
Switching between Absolute and Relative Time
By default, the time axis is displayed using absolute time. The time axis can also be
displayed using time relative to the first data position.
Switch absolute/relative time
2
Relative time
Absolute time
3
Viewer
4
On the numeric display, you can select the display format of the absolute or relative time
and turn ON/OFF the data numbers using Format on the View menu.
5
Index
Showing/Hiding Alarms
You can hide the alarm display area that indicates the status of alarm occurrence. The
alarms are displayed in the same fashion as the alarms displayed in the waveform
display area of the Integration Monitor.
Show/Hide the alarms
No alarm display
Alarm display area
IM WX103-01E
3-13
3.2 Setting the Display
Alarm/Mark List Display
Displays a detailed list of alarms and marks.
From the Window menu, choose Alarm/Mark List Display.
You can also click the
button on the toolbar.
• Alarm List Display
Currently sorted by the mark item
Sorted by the clicked item
• Marker List Display
Currently sorted by the mark item
Sorted by the clicked item
Mark added in the
Monitor screen
Mark added by
computation
Mark added by
Viewer software
Names of groups with marks
If no group is specified, all groups have marks
3-14
IM WX103-01E
3.2 Setting the Display
The alarm/marker list display’s cursors are linked with those of the waveform display and
numeric display layout screens. Alarms or marks selected with the cursor in the alarm/
mark list display can be copied to the clipboard using the Edit > Copy command.
The alarm/mark list can be converted to ASCII, Excel, or Lotus format (see section 3.7).
1
2
Alarm display limitation: One file can display a maximum of 10000 alarms.
3
Left-to-Right Alarm Search (Waveform Display Screen Only)
Viewer
Select the active channel
Move cursor A to the next alarm change point on the left
Move cursor A to the next alarm change point on the right
Move cursor B to the next alarm change point on the left
Move cursor B to the next alarm change point on the right
4
5
Alarm indication
Cursor A
Index
Cursor B
Left-to-Right Mark Search (Waveform Display Screen Only)
In the waveform display screen, move cursor A and B to the right or left side of the mark.
From the Edit menu, choose Mark Search. Or click the corresponding toolbar button.
Move cursor A to the left mark
Move cursor A to the right mark
Move cursor B to the left mark
Move cursor B to the right mark
Mark
The marks added in the Monitor
screen are orange, marks added in
the computation (event function
Mark) are yellow, and those added
in the Viewer software are green.
Cursor A
IM WX103-01E
Cursor B
3-15
3.2 Setting the Display
Numeric Display
Numeric display can be shown along with the waveform display window. When channels
with different record intervals exist within the same group, the screen is divided. The
display group, active channel, and mark display are synchronized to the waveform
display.
If cursors are displayed on the waveform display window, the data values between the
cursors are displayed in red. Also, the data column corresponding to the cursor position
is displayed in gray.
Active channel
(Y-axis display channel on
the waveform display)
Switch the
display group
Display per
record interval
Channel display color
Mark indication
Date/Time
Data number
Horizontal scroll
Alarm Value
Note
• If you open the numeric display window when two cursors are shown on the waveform
display window, the numeric values in the interval between the cursors is displayed in red.
If you choose Copy from the Edit menu (press the Ctrl + C key) in this condition, the data in
the interval is copied to the clipboard as text data.
• Up to 1000 lines can be copied. (Copy on the Edit menu is not available if the number of
lines specified by the cursors is above 1000.)
• If data with multiple record intervals is being displayed, the numeric values between the
cursors on the data sheet of the active record interval are copied. The title line displaying the
“Absolute Time [No.]” and channel number of the data sheet of the active record interval is
displayed using grayish light blue color. The color of the title line and the color of the “Absolute
Time [No.]” column are displayed using the same color on inactive sheets. You can activate
a sheet by clicking the sheet.
Waveform/Numerical Display Layout
The waveform or numeric display of data with differing measurement intervals is
arranged according to those intervals, but the layout of the display can be selected from
Auto, Horizontal, or Vertical.
• Auto
Switches between vertical and horizontal automatically according to the
window size.
• Horizontal Sets horizontal orientation regardless of the window size.
• Vertical Sets vertical orientation regardless of the window size.
Horizontal/landscape layout of the waveform display
3-16
IM WX103-01E
3.2 Setting the Display
1
Vertical/portrait layout of the waveform display
2
3
Viewer
4
Initializing, Copying, and Pasting of Settings on the General Display
Settings Window
On the General Display Settings window, you can reset the settings to default or copy
and paste the settings of one or multiple waveforms to the settings of other waveforms.
You can copy and paste according to the procedure below.
Drag the copy source waveform number (No. column), click the Copy button, drag the
copy destination waveform number, and click the Paste button.
Drag to select a range of waveforms
Click to select all
Click this icon to reset
to default settings
To set the scale to match
To copy
the maximum and
the settings
minimum values of the data
Click this button to enter the same settings as
the first channel in the selected range
Click this button to assign the channels in order
To not copy/paste the item,
click to hide the flag
To paste the copied settings
To copy/paste the item,
click to show the flag.
Click this button to turn ON/OFF the channels collectively
IM WX103-01E
3-17
5
Index
3.3
Reading Values Using Cursors
Procedure
1. On the waveform display window, click the tag of the group from which you wish to
read the value using cursors.
2. Click the position where you wish to read the data in the waveform display area of
the waveform display window.
If you wish to read another point simultaneously, drag the cursor. Cursor A appears
at the position where you first clicked; Cursor B appears at the position where you
released the mouse button. A yellow circle is displayed where the waveform and the
cursor cross.
You can move the waveform that is displayed in the waveform display area using the
scroll buttons or scroll bar.
Group selection tab
Measurement
point
Cursor A
Cursor B
3. From the Window menu, choose Control.
The Cursor Value window opens.
Time at the Cursor A position
Data number at the Cursor A position
Time at the Cursor B position
Data number at the Cursor B position
Move
Cursor A
Time between Cursors A and B
Move
Cursor B Difference in the data number between Cursors A and B
Channel display color
Alarm indication
Value at the Cursor B position – value at the Cursor A position
Channel number and
Value at the Cursor B position
measurement unit
Value at the Cursor A position
3-18
IM WX103-01E
3.3 Reading Values Using Cursors
Clearing Cursors
From the Edit menu, choose Erase Cursor.
The cursors are cleared as well as the cursor values displayed in the Control dialog box.
1
2
Explanation
Reading Measured/Computed Values Using Cursors
3
Viewer
Two cursors can be displayed. The following values can be read on the Control window.
• Values at the cursors.
• Difference in the value between the cursors.
• Absolute time and data number at the cursor position.
• Time between the cursors and the difference between the data numbers.
• Alarm status of the value at the cursor.
4
Note
• The cursors used to display cursor values and those used to specify the interval for
statistical computation over an area are the same.
• The Cursor Value window and the Statistics window can be displayed simultaneously.
• If you click the tab of another group on the waveform display window while the Cursor Value
window is open, the cursor values of the selected group are displayed on the Cursor Value
window.
• You can change the cursor positions on the waveform display window while the Cursor
Value window is open.
• If you choose Select All from the Edit menu, Cursor A is displayed at the first data position
and Cursor B is displayed at the last data position.
IM WX103-01E
3-19
5
Index
3.4
Statistical Computation over an Area of
Measured/Computed Data
Procedure
1. On the waveform display window, click the tab of the group on which you wish to
perform statistical computation over an area.
2. Click the start position of the computation area in the waveform display area.
A light-blue cursor appears in the waveform display area. If multiple waveform
display areas are displayed, the cursor is displayed at the time position each
waveform display area.
3. Drag the cursor to the end position of the computation area
Another light-blue cursor appears at the position where the cursor was dragged.
Group selection tab
Cursor (the end of the statistical computation over an area)
Cursor (the start of the statistical computation over an area)
4. From the Window menu, choose Statistics.
The Statistics window opens.
Data number at the start position
of the statistical computation
over an area
Channel display color
Minimum value
Maximum value – minimum value
RMS value
Scroll
the channel
Maximum value Mean value
Copy data to the clipboard
Channel number and
measurement unit
3-20
Data number at the end position of the statistical
computation over an area
IM WX103-01E
3.4 Statistical Computation over an Area of Measured/Computed Data
1
Explanation
Copy data to the clipboard
If you click the Copy button, the results of statistical computation over an area are
copied to the clipboard as text data. You can press the Ctrl + C key when the statistical
computation over and area window is active to copy the displayed results as text data in
the same manner to the clipboard.
2
Statistical Computation over an Area
3
Specify using two cursors the interval over which computation is to be performed.
If the cursors are not displayed, all the data are used in the statistical computation.
The statistical parameters are the minimum value, the maximum value, the P-P value
(maximum – minimum), the average value, and the rms value.
Viewer
4
Note
• To redo the computation after changing the computation area, you must select the button or
the menu again.
• The cursors used to specify the interval for statistical computation over an area and those
used to read values are common.
• The Statistics window and the Cursor Value window can be displayed simultaneously.
5
Index
IM WX103-01E
3-21
3.5
Saving Display Settings
Procedure
From the File menu, choose Save Display Setting File.
You can also click the
button on the toolbar.
The display setting file is created in the same folder as the data files.
When Closing the Viewer
If you open a file and change the display settings, the dialog box below opens when you
attempt to close the Viewer. To save the changed display settings, click Yes.
Explanation
Display Settings That Are Saved
• Information about the group whose waveform or numeric display is open.
• Settings entered using the tool buttons at the top section of the waveform display area
of each group.
Alarm display ON/OFF, magnification, scale, clip ON/OFF of the waveform display.
• Cursor position (absolute time).
• General Display Settings on the View menu.
• Channel No., Tag ID, or Tag comment setting on the View menu.
• Absolute Time or Relative Time setting on the View menu.
• Graph/Sheet Layout setting on the Window menu.
• Check box items in the File Information dialog box on the Information menu
The items are used as headers when the data is printed.
• Print Setting on the File menu.
Range, Color, Print Groups, and Comment.
• Marks created on the Viewer.
• Position of the display screen
Display Settings File
The display setting file (with .mxv extension) is created in the folder containing the data
files. If the data file name is data.mxs, the display setting file name is data.mxs.mxv. The
next time the data file is opened, the display opens according to the information in the
display setting file.
If the display setting file is deleted or moved to another folder, the display opens
according to the display settings used when the data file was created.
Note
• You cannot open a file containing the data you wish to view by selecting a file with .mxv
extension.
3-22
IM WX103-01E
3.6
1
Saving the Display Template
Procedure
2
Saving Templates
1. From the File menu, choose Save Template.
The currently displayed settings are saved as a template file to the same folder as
the displayed data.
Viewer
4
Using Templates
1. From the File menu, choose Use Template.
If the currently displayed data file is not accompanied by its display settings file, it
is displayed according to the setting information of the template file residing in the
same folder.
If the currently displayed data file is accompanied by its display settings file, it is
displayed according to the setting information of the display settings file.
Explanation
The template file is saved with the name default.mxt in the folder of the currently
displayed data.
When using a template file, the template file residing in the same folder as the displayed
data is used.
The setting information saved to the template file is as follows.
• Information about the group whose waveform or numeric display is open.
• Settings entered using the tool buttons at the top section of the waveform display area
of each group.
Alarm display ON/OFF, magnification, scale, clip ON/OFF of the waveform display.
• General Display Settings on the View menu.
• Channel No., Tag ID, or Tag comment setting on the View menu.
• Absolute Time or Relative Time setting on the View menu.
• Graph/Sheet Layout setting on the Window menu.
• Check box items in the File Information dialog box on the Information menu
The items are used as headers when the data is printed.
• Print Setting on the File menu.
Range, Color, Print Groups, and Comment.
• Position of the display screen
IM WX103-01E
3
3-23
5
Index
3.7
Converting Data Formats
Procedure
1. From the Convert menu, choose To ASCII, To Excel, or To Lotus.
2. After entering required settings in the dialog box that opens, click OK.
The file is created at the specified destination.
Enter the range of group numbers to be converted
Select whether to set the range
to be converted using groups
or channels
Select the record interval
Only the channels with the selected
record interval are converted
Enter the data range to be converted
Can be specified using cursors before
opening this dialog box
Displays the save destination and file name
Select the range of channels to be converted
Click to open the selection dialog box.
Displays the time of the specified data
Step when saving data at certain intervals
Select normal/trans position for the format
used for data conversion
When changing the save destination or file name
Click to open the save destination and file name setup
dialog box.
Explanation
Convertible Data Formats
• ASCII
Text data with each data point separated by a comma. The extension is .txt.
• Excel
Data that can be opened using Microsoft’s spreadsheet application Excel version 8.0
(Excel97) or later. The extension is .xls.
• Lotus
Data that can be read using IBM’s Lotus 1-2-3 spreadsheet program version 2.0 or
later. The extension is .wj2.
Converted Data
Specify the range using group numbers or channel numbers. You can select the channel
number by clicking in the dialog box as shown below.
If multiple recording intervals exist in the data to be converted, select the recording
interval. Only the data of the channels having the selected record interval is converted.
3-24
IM WX103-01E
3.7 Converting Data Formats
1
Conversion Range and Step
You can specify the range using data numbers or by using cursors. For the method
of specifying the range using cursors, see the procedure in section 3.4, “Statistical
Computation over an Area of Measured/Computed Data.”
By specifying the step, you can save data sampled at certain intervals rather than
converting all the data in the range (when step is set to 1).
2
Specifying Formats
Display Example of the Converted Data (normal)
Version
Version
Display Example of the Converted Data (trans position)
Version
Version
3
Viewer
Select the format for the converted data. When outputting channel data in columns select
Normal, and for rows, select Trans position.
4
5
Index
Notes When Converting Data
• There is a limit in the number of data points that Excel and Lotus1-2-3 can handle.
Before executing the conversion, set the channels/groups to be converted, the
conversion range, and the step so that the number of data points is appropriate. If the
limit is exceeded, perform automatic division prior to conversion. Serial numbers are
attached to divided-converted files. In addition, if the free memory space on the PC is
low, you may not be able to load the data using Excel or Lotus 1-2-3.
• If you set the save destination to a storage medium that has slow access such as a
floppy disk, the saving of the data may take an extended time. It is recommended that
such storage medium not be selected for the save destination.
• Select a save destination with adequate free space.
• The measured data during a burnout or measured data that exceeds the upper/lower
limit of the measurement range are indicated as “+OVER” or “-OVER”
• If invalid data exists in the converted data (measured value of a channel without input
or computed value when the data used in the equation does not exist), the data is
indicated as “INVALID”
IM WX103-01E
3-25
3.8
Printing Data
Procedure
Setting the Contents to Be Printed
1. From the File menu, choose Print Setting.
2. In the Print Setting dialog box, set Range, Color, and Print Group, and then click OK.
Enter a comment in the Comment box as necessary.
When printing numeric values, you only need to set the range.
Select to print all or print only the range specified by cursors
Switch to settings for numeric values
Select the group to be printed
Select black/white or color print
Select the groups when Selected Groups
is selected
Click to open the group selection dialog box
Enter the comment to be printed
Settings for numeric values
3-26
IM WX103-01E
3.8 Printing Data
Executing the Print Operation
1. From the File menu, choose Print.
The Print dialog box opens.
2. In the Print dialog box, select the printer, print range, and the number of copies, and
then click the OK button.
When printing waveforms, you cannot set the print range.
Display example of the Print dialog box
1
2
3
Viewer
4
5
Print Preview
From the File menu, choose Print Preview.
The print image is displayed.
Index
Setting Up the Printer
1. From the File menu, choose Print Setup.
The Print Setup dialog box opens.
2. Set the paper size, orientation, etc. Then, click the OK button.
Display example of the Print Setup dialog box
IM WX103-01E
3-27
3.8 Printing Data
Explanation
Printed Items
To print waveforms, open the waveform display window; to print numeric values, open
the numeric display window. If multiple waveform display windows or numeric display
windows are open, click the window you wish to print.
To print cursor values or statistical computation over an area, open those windows also.
You can also print a list of alarms and marks.
Print Range
If you wish to print a specified range of the waveform, specify the range using cursors.
For the method of specifying the range using cursors, see the procedure in section 3.4,
“Statistical Computation over an Area of Measured/Computed Data.”
Printed Colors of Waveforms
You can select black/white print or color print.
Print Groups
•
•
•
On Display Only
Only the groups whose waveforms are displayed are printed.
All Groups
All groups that can be displayed on the waveform display window are printed.
Selected Groups
Groups selected in the dialog box that opens (see the figure below) when the Select
button is clicked are printed.
Printing a Comment
You can enter a comment using up to 127 characters. The comment is printed in the Print
Comment column.
Printing File Information
When you print data, the file information is also printed. You can check the file information
in the dialog box that opens by choosing About Data from the Information menu. You can
also select the items to be printed using the check boxes.
3-28
IM WX103-01E
3.8 Printing Data
1
Print Example
• When only the waveforms are printed
2
File information about
the printed data
3
Viewer
4
5
Index
Note
If you wish to arrange the waveform graphs vertically when printing the waveforms of multiple
record intervals, choose Tile Vertical under Graph/Sheet Layout from the Window menu. To
arrange the waveform graphs horizontally, choose Tile Horizontally.
• When cursor values, values of statistical computation over an area, and waveforms
are printed
File information about
the printed data
Statistical computation
over an area
Cursor values
IM WX103-01E
3-29
3.8 Printing Data
• When printing a list of numeric values
3-30
IM WX103-01E
3.9
1
Displaying the Software Version and Other
Information
Procedure
2
Click the About button on the toolbar or choose About from the Help menu.
A dialog box showing the version number and other information opens.
3
Viewer
4
Version
5
Index
IM WX103-01E
3-31
Chapter 4
4.1
Calibrator
1
Connecting the MX100 Data Acquisition Unit
Notes on Using the Calibration Software
• If another user or another software program is connected to the MX100, drop the
connection before connecting with the Calibration Software.
• If you change the module configuration before connecting with the Calibration
Software, carry out system configuration on the Logger (see section 2.2, “Configuring
the System”).
• When calibrating, do not perform other operations. Use extra caution in the operation,
because the module may malfunction if you execute a wrong operation while
calibration is in progress.
Procedure
Execute connection
When the connection is established, information about the unit’s module
configuration is displayed. If you click the Check button, the 7-segment LED on the
main module of the connected unit shows the text “—CALL—” flowing from right to
left.
Information about the connected MX100
To disconnect the connected MX100
To turn on the 7-segment
LED on the connected
MX100 to check which unit
is the one connected
Modules attached to the
connected MX100 Data
Acquisition Unit
IM WX103-01E
4
5
Index
Enter the host name or IP address of the MX100 to be calibrated.
3
Calibrator
1. Start the Calibrator.
The Unit Information window opens.
2. In the IP Address/Host Name box, enter the IP address or host name of the MX100
to be calibrated.
3. Click Connect.
2
4-1
4.1 Connecting the MX100 Data Acquisition Unit
If the specified IP address or host name is not correct, or the MX100 is connected by
another software program, the following dialog box opens.
Note
• The Calibrator cannot be used to change the MX100 network settings (such as the IP
address). Use the Logger for this purpose.
• If you change the module configuration before connecting with the Calibrator or if modules
that are not operating properly exist, X marks are displayed on the modules as shown
below. If you change the module configuration, reconfigure the system.
When Setting a Password for Startup
You can use the following procedure to set the Calibrator up so that it prompt the user to
enter a password upon startup.
1. From the File menu, click Set Password.
The New Password dialog box opens.
2. Click the New Password box, and enter a password.
There are no restrictions on the characters that can be used in the password. You
can enter up to 30 characters for the password.
3. Enter the same password in the Confirm New Password box, then click OK.
If you restart the Calibrator, a password confirmation dialog box opens. If you enter
a wrong password and click OK, a dialog box with the message “The password is
wrong.” opens. Click OK to close the Calibrator.
Note
To set up the Calibrator so that no password dialog box is displayed, open the password setting
dialog box, make sure the entry boxes are blank, and click OK. There are no other means of
clearing the password. Be sure not to forget the password.
4-2
IM WX103-01E
4.2
1
Calibration Procedure
Procedure
2
1. Click the illustration of the universal input module that you wish to calibrate.
3
4
Calibrator
Moving the cursor over
an input module that can
be calibrated shows the
word “Calibrate”
5
Index
2. On the calibration detail setup screen that appears, select the channel and
measurement range to be calibrated and click the >> button.
The figure below is an example of the 4-CH, High-Speed Universal Input Module.
Items to be calibrated
You can also click to select
Select the channel and
the measurement range
to be calibrated from
the list
To move to the calibration
execution screen 1
IM WX103-01E
4-3
4.2 Calibration Procedure
The figure below is an example of the 10-CH, Medium-Speed Universal Input
Module. Channels are not selected.
Items to be calibrated
You can also click to select
Select the measurement range
to be calibrated from the list
To move to the calibration
execution screen 1
The figure below is an example of the 30-CH, High-Speed Analog DCV/TC/DI Input
Module. A range is not selected.
Items to be calibrated
You can also click to select
Select the measurement range
to be calibrated from the list
To move to the calibration
execution screen 1
The figure below is an example of the 6-Channel, Medium-Speed, Four-Wire RTD
Resistance Input Module. Channels are not selected.
Items to be calibrated
You can also click to select
Select the measurement range
to be calibrated from the list
To move to the calibration
execution screen 1
4-4
IM WX103-01E
4.2 Calibration Procedure
1
The figure below is an example of the 4-CH, Medium-Speed Strain Input Module.
Channels are not selected.
2
Items to be calibrated
You can also click to select
Select the measurement range
to be calibrated from the list
3
4
Calibrator
To move to the calibration
execution screen 1
5
The figure below is an example of the 8-CH, Medium-Speed Analog Output Module.
A range is not selected.
Index
Items to be calibrated
You can also click to select
Select the measurement range
to be calibrated from the list
To move to the calibration
execution screen 1
IM WX103-01E
4-5
4.2 Calibration Procedure
3. After making the connections according to the explanation given on the calibration
execution screen 1, click the Calibrate button.
The figure below is an example of the 4-CH, High-Speed Universal Input Module.
Start calibration
To return to the previous screen
To return to the Unit Information screen
The figure below is an example of the 8-CH, Medium-Speed Analog Output Module.
Start calibration
To return to the previous screen
To return to the Unit Information screen
When you click the Calibrate button, a message “Please wait and do not perform any
other operation.” appears.
When the calibration completes successfully, the calibration execution screen 2
appears.
If the calibration fails, a message “Failed to calibrate.” appears.
Note
For a description of the accuracy of the connected input module, the calibration accuracy,
and the environmental conditions for calibration, see the MX100 Data Acquisition Unit User’s
Manual.
4-6
IM WX103-01E
4.2 Calibration Procedure
4. After making the connections according to the explanation given on the calibration
execution screen 2, click the Calibrate button.
The figure below is an example of the 4-CH, High-Speed Universal Input Module.
1
2
3
4
Calibrator
5
Start calibration
The figure below is an example of the 8-CH, Medium-Speed Analog Output Module.
Index
Start calibration
The figure below is an example of the 30-CH, Medium-Speed DCV/TC/DI Input
Module.
Example of the clamp terminal
Start calibration
IM WX103-01E
4-7
4.2 Calibration Procedure
Example of the M4 screw terminal
Start calibration
When you click the Calibrate button, a message “Please wait and do not perform any
other operation.” appears.
5. Repeat steps 1 to 4 until all calibrations are completed.
6. From the File menu, choose Write.
The calibration values are written to the input module.
Note
During calibration, do not perform any other operations (particularly turning OFF the MX100 or
dropping the connection). Doing so may cause the MX100 to malfunction.
4-8
IM WX103-01E
4.2 Calibration Procedure
1
Explanation
Calibrated Parameters
• 4-CH, High-Speed Universal Input Module (MX110-UNV-H04)
Input Value 1
0 mV
0 mV
0 mV
0V
0V
0V
0V
0V
0Ω
0Ω
0Ω
0Ω
0Ω
0Ω
0Ω
2
Input Value 2
20 mV
60 mV
200 mV
1V
2V
6V
20 V
100 V
200 Ω
300 Ω
500 Ω
30 Ω
100 Ω
300 Ω
250 Ω
3
4
Calibrator
Measurement Range to Be Calibrated
20 mV
60 mV
200 mV
1V
2V
6V
20 V
100 V
RTD (1 mA) 200 mV
RTD (1 mA) 600 mV
RTD (1 mA) 1 V
RTD (2 mA) 60 mV
RTD (2 mA) 200 mV
RTD (2 mA) 600 mV
RTD (2 mA) 1 V
5
• 10-CH, Medium-Speed Universal Input Module (MX110-UNV-M10)
Measurement Range to Be Calibrated
20 mV
60 mV
200 mV
1V
2V
6V
20 V
100 V
RTD (1 mA) 60 mV
RTD (1 mA) 200 mV
RTD (1 mA) 600 mV
Input Value 1
0 mV on Ch1
0 mV on Ch1
0 mV on Ch1
0 V on Ch1
0 V on Ch1
0 V on Ch1
0 V on Ch1
0 V on Ch1
0 Ω on Ch3
0 Ω on Ch3
0 Ω on Ch3
Index
Input Value 2
20 mV on Ch2
60 mV on Ch2
200 mV on Ch2
1 V on Ch2
2 V on Ch2
6 V on Ch2
20 V on Ch2
100 V on Ch2
60 Ω on Ch6
200 Ω on Ch4
300 Ω on Ch5
• 30-CH, Medium-Speed DCV/TC/DI Input Module (MX110-VDT-L30)
Measurement Range to Be Calibrated
20 mV
60 mV
200 mV
1V
2V
6V
20 V
100 V
RTD (1 mA) 60 mV
RTD (1 mA) 200 mV
RTD (1 mA) 600 mV
IM WX103-01E
Input Value 1
0 mV on Ch1
0 mV on Ch1
0 mV on Ch1
0 V on Ch1
0 V on Ch1
0 V on Ch1
0 V on Ch1
0 V on Ch1
0 Ω on Ch3
0 Ω on Ch3
0 Ω on Ch3
Input Value 2
20 mV on Ch2
60 mV on Ch2
200 mV on Ch2
1 V on Ch2
2 V on Ch2
6 V on Ch2
20 V on Ch2
100 V on Ch2
60 Ω on Ch6
200 Ω on Ch4
300 Ω on Ch5
4-9
4.2 Calibration Procedure
• Six-Channel, Medium-Speed Four-Wire RTD Resistance Input Module (MX110V4R-M06)
Measurement Range to Be Calibrated
20 mV
60 mV
200 mV
1V
2V
6V
20 V
100 V
RTD (1 mA) 20 mV
RTD (1 mA) 60 mV
RTD (1 mA) 200 mV
RTD (1 mA) 600 mV
RTD (0.25 mA) 600 mV
RTD (0.25 mA) 1 V
Input Value 1
0 mV on Ch1
0 mV on Ch1
0 mV on Ch1
0 V on Ch1
0 V on Ch1
0 V on Ch1
0 V on Ch1
0 V on Ch1
0 Ω on Ch3
0 Ω on Ch3
0 Ω on Ch3
0 Ω on Ch3
0 Ω on Ch3
0 Ω on Ch3
Input Value 2
20 mV on Ch2
60 mV on Ch2
200 mV on Ch2
1 V on Ch2
2 V on Ch2
6 V on Ch2
20 V on Ch2
100 V on Ch2
20 Ω on Ch4
60 Ω on Ch5
200 Ω on Ch6
300 Ω on Ch4
2400 Ω on Ch5
3000 Ω on Ch6
• 4-CH, Medium-Speed Strain Input Module (MX112-B12-M04, MX112-B35-M04,
MX112-NDI-M04)
Measurement Range to Be Calibrated
2000 µSTR (strain)
20000 µSTR (strain)
200000 µSTR (strain)
Connect1
120.000 Ω on Ch2
120.000 Ω on Ch2
120.000 Ω on Ch2
Connect2
117.154 Ω on Ch2
113.010 Ω on Ch2
80,000 Ω on Ch2
Use a 4-gauge method connection when performing calibration. For information on
this connection, see section 2.4 of the MX100 Data Acquisition Unit User’s Manual (IM
MX100-01E).
• 8-CH, Medium-Speed Analog Output Module (MX120-VAO-M08)
Adjust so that all channels output 0 V and 10 V. This differs from other input modules.
Range to Be Calibrated
10 V
Output val. 1
0V
Output val. 2
10 V
Note
For a description of the measurement range and accuracy of each input module, see sections 4.4
and 4.5 in the MX100 Data Acquisition Unit User’s Manual (IM MX100-01E).
4-10
IM WX103-01E
Chapter 5
5.1
Troubleshooting
1
Troubleshooting
If servicing is necessary, or if the instrument is not operating correctly after performing
the corrective actions below, contact your nearest YOKOGAWA dealer for repairs.
2
The 7-segment LED does not illuminate.
Probable Cause
The power switch is not ON.
The supply voltage is too low.
The fuse is blown.
The power supply is broken.
Corrective Action
Turn ON the power switch.
Check whether the voltage is within the supply voltage rating
range.
Servicing required.
Servicing required.
Reference Page
*
*
3
-
4
* See the MX100 User’s Manual (IM MX100-01E).
The 7-segment LED blinks repeatedly.
Corrective Action
Remove the module one by one and determine which module
is broken. (Servicing required.)
Replace the main module. (Servicing required.)
Reference Page
*
5
*
Index
* See the MX100 Data Acquisition Unit User’s Manual (IM MX100-01E).
After power up, the 7-segment LED displays something other than “
number is 00).
”(when the unit
Probable Cause
The display is b*
(where * is any character other than F)
The dipswitch settings are not correct.
The display is bF.
The dipswitch settings are not correct.
Reference Page
*
The display is F*
(where * is any character).
Hardware error on the main module
The display is E*
(where * is any character).
Hardware error on the input/output
module.
The display is P0.
Media (CF card) operation error.
The display is P1.
Media (CF card) error.
The display is P2.
Format error.
The display is P3.
Insufficient free space
The display is P4.
Number of files over the limit
The display is P5.
Overwrite error in the data storage
buffer
The display is C1.
Multiple TCP connections
Corrective Action
Turn OFF the power, remove the CF card, turn ON all
dipswitches, and power up again. If the situation does not
change, servicing required.
Powering up in setup reset mode. Turn OFF the power, turn
ON all dipswitches, and power up again. Since all settings
such as the IP address are initialized, reconfiguration is
necessary.
Servicing required.
2-3,2-4
*
-
The slot number is indicated by * in the n* display following the *
E* display.
Remove the relevant module and power up again.
The relevant module must be serviced.
Do not manipulate the CF card while it is being accessed.
*
Reformat the CF card or replace the CF card.
*
Check whether the CF card is inserted correctly.
Then, reformat the CF card or replace the card.
Delete the files on the CF card to free up some space.
*
The number of created files exceeded the allowed amount.
Stop the recording. Replace the CF card or delete files and
restart.
The time needed to store the file must be reduced.
Delete unneeded data to increase the free space, or format
the CF card.
Turn OFF the power and reconnect.
*
-
*
*
* See the MX100 Data Acquisition Unit User’s Manual (IM MX100-01E).
IM WX103-01E
Troubleshooting
Probable Cause
The power supply is shorted inside
the input/output module.
The power supply is shorted inside
the main module.
5-1
5.1 Troubleshooting
The MX100 cannot be detected from the PC or cannot be detected with the Search
button.
Probable Cause
The LINK LED does not turn ON.
The cable is broken.
The LINK LED does not turn ON.
There is a problem with the hub.
The LINK LED does not turn ON.
There is a problem with the PC.
The ACT LED does not turn ON.
There is a problem in the connection
between the hub and the MX100.
The ACT LED does not turn ON.
There is a problem with the PC.
There is a problem in the network
configuration.
The settings are not correct.
There is a problem in the network
configuration.
The setting changes have not taken
effect.
The PC and the MX100 are not in the
same segment.
Corrective Action
Replace the Ethernet cable.
Reference Page
-
Check the hub’s power supply. If it still does not work, replace the
hub and check the hub’s operation. Also, try to connect the MX100
using the 10-Mbps fixed mode.
Check whether the PC can connect to the network.
Replace the PC’s NIC.
Check the hub’s power supply. If it still does not work, replace the
hub and check the hub’s operation. Also, try to connect the MX100
using the 10-Mbps fixed mode.
Check whether the PC can connect to the network.
Replace the PC’s NIC.
Check that the IP address, subnet mask, and default gateway
settings of the PC correspond to the MX100 settings.
-
Turn OFF the power to the PC and the MX100, and carry out
reconnection.
-
Connect the PC and the MX100 in the same network segment.
If the PC and the MX100 are connected as shown in the following
figure, the Search button cannot be used to detect the MX100.
However, you can make a connection manually by specifying the
IP address.
2-3, 2-4
*
2-3, 2-4
MX
Network A
Router
Network B
PC
* See the MX100 Data Acquisition Unit User’s Manual (IM MX100-01E).
The MX100 is detected by clicking the Search button, but connection cannot be made.
Probable Cause
The IP address is set to the default
value.
The default value cannot be used to
make the connection.
There is a problem in the network
configuration.
Follow the rules for I/O on the PC
software module style number, and
release number
Corrective Action
Enter the correct IP address.
Reference Page
2-3, 2-4
Check that the IP address, subnet mask, and default gateway
settings of the PC and the MX100 settings are correct.
Check the PC software release number and main unit style
number Upgrade to a later style.
[PC software release no.] ≥ [main unit style no.] ≥ [module style
no.]
2-3, 2-4
*
* See the MX100 User’s Manual (IM MX100-01E).
Six-Channel Four-Wire RTD resistance input module recognized as a 10-CH universal
input module
Probable Cause
The MX100 main unit style number
remains at 1.
Corrective Action
Upgrade to a later style.
Reference Page
**
**See the MX100 Upgrade Kit user’s manual (IM MX100-77).
5-2
IM WX103-01E
5.1 Troubleshooting
1
MX100 cannot be connected using the Calibrator
Probable Cause
Attempting to make multiple connections.
Another software program is already
connected.
Corrective Action
Exit all other software programs.
Reference Page
-
2
The connected input/output module is not detected.
Probable Cause
Module connection or module startup
error.
Attached the module while the power was
ON.
Carried out an incorrect calibration.
Corrective Action
Reference Page
Turn OFF the power. Detach the input/output module once *
and
attach it again.
Recalibrate.
3
4-1
4
* See the MX100 User’s Manual (IM MX100-01E).
Alarms are not output.
Probable Cause
There is a problem in the alarm setting.
Corrective Action
Reference Page
Both the alarm and output relay must be set appropriately. 2-37~2-42
Make the alarm and output relay settings appropriate.
5
Troubleshooting
Current is not output from the analog output module, and no output comes from the
PWM output module.
Probable Cause
External power supply required.
Corrective Action
Connect an external power supply.
Index
Reference Page
*
Transmission output is not output from the analog output module, nor from the PWM
output module.
Probable Cause
“Transmit not enabled” Enable it.
Corrective Action
Enable it.
Reference Page
2-50
No output from the PWM output module
Probable Cause
The output current limit (1A) has been
exceeded. Turn OFF the external power
supply, check the load, power cycle.
Corrective Action
Once the limit is exceeded the protection circuit activates,
and you must power cycle the external power supply or it
will not recover.
Reference Page
-
No output from the PWM output module
Probable Cause
The fuse is blown.
(4A/module limit has been exceeded)
Corrective Action
Servicing required.
Reference Page
-
Corrective Action
Replace the CF card.
Eject and format the CF card, then insert it again.
Reference Page
*
The CF card is not detected.
Probable Cause
There is a problem with the CF card.
* See the MX100 Data Acquisition Unit User’s Manual (IM MX100-01E).
IM WX103-01E
5-3
5.1 Troubleshooting
The measured value is not correct.
Probable Cause
The input wiring is not correct.
The measured value is at +Over or –Over.
The measurement range setting and input
range do not match.
The temperature error is large or is
unstable. The TC type setting and the type
actually connected are different.
The temperature error is large or is
unstable.
The RJC setting is not correct.
The temperature error is large or is
unstable.
The wind is hitting the terminals.
The temperature error is large or is
unstable.
The ambient temperature change is
drastic.
The temperature error is large or is
unstable.
There is an error in the wiring resistance
(in the case of an RTD).
The measurement error is large or is
unstable.
Noise effects.
The measurement error is large or is
unstable.
Effects from the signal source resistance.
The temperature error is large or is
unstable.
Effects from parallel connections.
Measured value from strain gauge type
sensor not correct.
On the strain module (-B12, -B35), the
gauge method dipswitch settings is not
correct.
On the strain module (-B12, -B35), the
gauge resistance and internal bridge
resistance values are different.
On the strain module, scaling
corresponding to the gauge method is
not set. (for 2 gauge, 4 gauge methods,
the amount of strain is doubled or
quadrupled.)
On the strain module (-NDI), a strain
gauge type sensor without a remote
sensing wire is being used.
Corrective Action
Check the input wiring.
Change to an appropriate setting.
Reference Page
*
*
Change to the correct setting.
*
Change to the correct setting.
*
Block the wind from hitting the terminals.
-
Suppress changes in the ambient temperature such as by
placing the MX100 in a box.
-
Match the thickness and length of the three wires.
*
Take measures against noise.
*
Reduce the signal source resistance such as by inserting a
converter.
-
Stop parallel connections.
Do not use the burnout setting.
-
When using a sensor without a remote sensing wire,
use the DV450-001 (conversion cable).
Enter the correct settings.
*
Use a module that supports the resistance value of the strain
gauge (For 120Ω, -B12, and for 350Ω, -B35.)
*
*
Displayed with 1 gauge method conversion. Depending on the *
gauge method, set scaling appropriately.
When using a sensor without a remote sensing wire, use the
DV450-001 (conversion cable).
*
* See the MX100 User’s Manual (IM MX100-01E).
5-4
IM WX103-01E
5.2
1
Error Messages and Their Corrective Actions
Error Messages on the Logger
Code
–
Message
Undetermined Directory.
E5501
E5502
E5503
Recording or Working.
Cannot open file.Check viewer.
It failed in acquisition of CF
information. Please verify the usage
condition of the equipment
Failed to get channel and network
configuration.
Failed to get information. Check
connecting MX.
Failed to create folder.
E5504
E5505
E5506
E5507
W5531
W5532
W5533
M5561
M5562
M5563
M5564
M5565
M5566 State: Active
Max.: □□□ bytes
Free: □□□ bytes
M5567
M5568
M5569 Apply the edited network
configuration of MXs?
M5570 Modules of Slot□ - Slot□ will be
changed. Ok to continue?
Reference Page
2-11
Check the disk capacity and whether the file system is
correct.
Check the disk capacity and whether the file system is
correct.
Check the disk capacity and whether the file system is
correct.
Specify a valid folder name.
2-6
Use characters other than the following: “ \\ /: , ; * ? " < >
|CON PRN AUX CLOCK$ NUL COM1-9 LPT1-9”
–
Click No and change the settings of inappropriate
channels.
To disable the inappropriate channels, click Yes.
2-20 to 2-23
Click No and change the settings of inappropriate
channels.
To disable the inappropriate channels, click Yes.
2-20 to 2-23
Click OK to reconfigure the system based on the
information acquired from the main unit.
Click OK to stop recording.
Click OK to stop acquisition.
Click OK to assign automatically.
1-6
Please wait until writing of data is finished.
Restart the monitor server to apply the changed port
number.
–
–
2-79
Check whether the CF card is formatted.
Insert a CF card.
Click OK to send settings.
–
*
2-3
1-22
–
2-6
3
4
2-6
–
5
–
Index
2-74
2-76
1-6
2-9
Click OK to change the specified module. Cancel to return 2-6
to the previous screen.
* See the MX100 User’s Manual (IM MX100-01E).
IM WX103-01E
2
Troubleshooting
E5508
Invalid folder name.
Please enter a new name.
Cannot contain any of the following
characters:\n \\ / : , ; * ? " < > |\nCON
PRN AUX CLOCK$ NUL COM1-9
LPT1-9
The current channel setup contains
invalid use of reference channels.
Channels whose mode is set to RRJC.
Channels used for difference input.
Transmission AO channels.
Transmission PWM channels.
Do you wish to continue after
disabling the invalid channels?
In order to balance the strain
channels, it’s necessary for channels
to be set up correctly.
The current channel setup contains
invalid use of reference channels.
Some measurement channels set to
RRJC mode.
Channels used for difference input.
Transmission AO channels.
Transmission PWM channels.
Do you wish to continue after
disabling the invalid channels?
Invalid modules exist. do you get
configuration after reconstructing?
Stop record?
Stop monitoring and quit?
Assign all modules to appropriate
measuring groups?
Corrective Action/Description
The save destination of the record file cannot be found.
Check whether the save destination exists.
Try again once recording stops.
If a dialog box is open in the Viewer, close it.
Check whether the host name is correct, and whether the
main unit is connected.
5-5
5.2 Error Messages and Their Corrective Actions
Error Messages on the Viewer
Code
E0002
Message
Insufficient memory. Please close at
once.
E0004
E3111
File write error.
Channels of the specified recording
interval do not exist.
E3114
Sampling data number is over the
Viewer display limit of 5 M.
W3115 Converting operation exceeded the
limitation of MS Excel.
W3116 Converting operation exceeded the
limitation of Lotus 1-2-3.
E0212 Can’t read file.
E3120 Not an MX file.
Corrective Action/Description
Attempting to load multiple files containing close to five
million data points. Insufficient free memory in the PC
virtual memory. Set the size of the PC’s virtual memory to
2 GB or more.
The file cannot be created for some reason.
Channels with the specified measurement interval do not
exist in the conversion of the data format.
Change to the correct setting.
Attempting to load a file containing 5 million or more data
points.
Change the range to be converted so that it is within the
allowed range of Excel.
Change the range to be converted so that it is within the
allowed range of 1-2-3.
The file cannot be loaded, or the file has been deleted.
Cannot load the file.
Reference Page
3-2
–
3-24
3-2
3-25
3-25
3-2
3-2
Error Messages on the Calibrator
Code Message
W4700 Connection failure.
Check the IP Address/Host Name.
W4701 Failed to write the calibrated value.
W4702 Failed to calibrate.
5-6
Corrective Action
To change the network settings such as the IP address,
start the Logger.
Recalibrate. If still displayed, service required.
Recalibrate. If still displayed, service required.
Reference Page
2-3
4-3 to 4-7
4-3 to 4-7
IM WX103-01E
Index
1
Index
Symbols
[Transmission Output]......................................................... 2-50
[Transmit]:............................................................................ 2-50
[User Output]....................................................................... 2-50
A
B
browse.................................................................................. 2-11
browse for folder dialog box................................................. 2-11
burnout....................................................................... 2-16, 2-22
C
calibrated parameters............................................................ 4-9
calibration procedure............................................................. 4-3
calibration software............................................................... 4-1
CF card.................................................................................. 2-9
CF card information............................................................... 2-9
CF file joining function........................................................... 3-5
channel.............................................................. 2-13, 2-15, 2-37
channel colors...................................................................... 3-11
channel numbers................................................................. 2-28
clearing cursors................................................................... 3-19
clipping of waveforms................................................. 2-70, 3-12
colors................................................................................... 2-70
comment.............................................................................. 2-14
comment box........................................................................ 2-11
communication events......................................................... 2-54
computation................................................................ 2-28, 2-35
computation channels......................................................... 2-13
computation interval............................................................ 2-13
computation span................................................................ 2-28
configuration area.................................................................. 2-5
IM WX103-01E
D
data file....................................................................... 2-11, 2-14
data file events.................................................................... 2-53
data folder........................................................................... 2-14
DDE server.......................................................................... 2-81
DDE server menu................................................................ 2-81
de-energized operation....................................................... 2-42
default gateway.............................................................. 2-3, 2-4
deleting points..................................................................... 2-46
dHigh................................................................................... 2-38
DI......................................................................................... 2-20
difference computation........................................................ 2-21
difference input........................................................... 2-15, 2-21
difference input lower limit alarm......................................... 2-38
difference input upper limit alarm........................................ 2-38
digital input.......................................................................... 2-20
digital output........................................................................ 2-40
disk information................................................................... 2-66
display................................................................................... 3-7
display groups.............................................................. 2-67, 3-8
display settings file.............................................................. 3-22
display template.................................................................. 3-23
display zone........................................................................ 2-68
divided files............................................................................ 3-4
division....................................................................... 2-11, 2-14
dLow.................................................................................... 2-38
DO ch tab............................................................................ 2-40
E
edit check box....................................................................... 2-3
editing Points....................................................................... 2-45
edit zone....................................................................... 2-68, 3-9
enabling/disabling events.................................................... 2-59
energized............................................................................. 2-42
erase cursor........................................................................ 2-73
error............................................................................ 2-40, 2-42
error output.......................................................................... 2-42
event functions.................................................................... 2-34
event processing................................................................. 2-52
excel.................................................................................... 3-24
executing event processing................................................. 2-59
execution error.................................................................... 2-35
exiting the software............................................................. 1-23
F
FAIL output.......................................................................... 2-42
file information..................................................................... 3-28
file name..................................................................... 2-14, 2-78
file name box........................................................................ 2-11
filter list box................................................................ 2-16, 2-22
first-order lag filter...................................................... 2-16, 2-22
Index-1
2
3
4
5
Index
Index
A/D integration time........................................................ 2-8, 2-9
about................................................................................... 2-83
absolute and relative time................................................... 3-13
acquisition........................................................................... 2-10
add button............................................................................. 2-8
add date check box.............................................................. 2-11
adding marks.............................................................. 2-71, 3-12
address.................................................................................. 2-3
add time check box.............................................................. 2-11
alarm/mark list display......................................................... 3-14
alarm 1................................................................................ 2-37
alarm detection.................................................................... 2-41
alarm hysteresis.................................................................. 2-39
alarm level........................................................................... 2-28
alarm monitor window......................................................... 2-64
alarm reference channel range........................................... 2-41
alarms.................................................................................. 2-40
alarms and marks................................................................ 3-14
alarm search........................................................................ 3-15
alarm types.......................................................................... 2-38
all channel monitor window................................................. 2-63
analog......................................................................... 2-43, 2-50
apply button........................................................................... 2-3
arithmetic functions............................................................. 2-31
ASCII................................................................................... 3-24
auto assignment.................................................................... 2-7
automatic start function....................................................... 2-12
auto zone.................................................................... 2-69, 3-10
configuring e-mail................................................................ 2-58
configuring FTP................................................................... 2-58
configuring the network......................................................... 2-2
connected user...................................................................... 2-4
constant............................................................................... 2-24
constants............................................................................. 2-28
continuous........................................................................... 2-14
convertible data formats...................................................... 3-24
current input........................................................................ 2-19
cursors...................................................... 2-72, 2-73, 3-18, 3-19
Index
fixed period.......................................................................... 2-14
fixed time.................................................................... 2-13, 2-14
full zone...................................................................... 2-69, 3-10
G
general display settings window.......................................... 2-65
group names....................................................................... 2-67
H
high...................................................................................... 2-38
hold...................................................................................... 2-42
host name.............................................................................. 2-3
I
info. column........................................................................... 2-3
initial balancing........................................................... 2-17, 2-23
input mode.................................................................. 2-15, 2-19
installation............................................................................. 1-4
interval................................................................................. 2-13
IP address............................................................................. 2-3
J
join......................................................................................... 3-5
join the data files................................................................... 3-1
L
label box.............................................................................. 2-24
loadable Data........................................................................ 3-2
loadable files......................................................................... 3-2
loading................................................................................. 2-76
loading data files................................................................... 3-1
logging of events................................................................. 2-59
lotus..................................................................................... 3-24
low....................................................................................... 2-38
lower limit alarm................................................................... 2-38
M
machine name....................................................................... 2-3
main status.......................................................................... 2-66
manual........................................................................ 2-29, 2-51
manual AO function............................................................. 2-33
manual DO.......................................................................... 2-41
manual DO buttons............................................................. 2-40
manual DO name................................................................ 2-41
mark search......................................................................... 3-15
math.................................................................................... 2-14
math ch tab.......................................................................... 2-24
maximum and minimum values of the Y-axis...................... 2-68
meas ch tab......................................................................... 2-15
measurement channels....................................................... 2-27
measurement conditions..................................................... 2-15
measurement group....................................................... 2-7, 2-9
measurement groups.......................................................... 2-13
measurement range............................................................ 2-19
measurement span.............................................................. 2-21
measuring range................................................................. 2-15
menu..................................................................................... 3-7
meter monitor window......................................................... 2-62
mode list box....................................................................... 2-15
module configuration information.......................................... 2-6
monitor display.................................................................... 2-72
monitor interval.................................................................... 2-10
monitor intervals.................................................................. 2-13
monitor server..................................................................... 2-79
monitor server function........................................................ 2-80
Index-2
multi-axis zone........................................................... 2-69, 3-11
MXs nearby area................................................................... 2-2
N
new project..........................................................................
non-hold..............................................................................
numerical constants............................................................
numeric display...................................................................
numeric monitor window......................................................
2-78
2-42
2-28
3-16
2-61
O
OHM....................................................................................
on record.............................................................................
on record events..................................................................
operators.............................................................................
output relays........................................................................
2-20
2-13
2-55
2-29
2-42
P
parameter setting ranges....................................................
pattern.................................................................................
pattern output......................................................................
pause button........................................................................
pausing the updating of the waveform display....................
PC system requirements.....................................................
port number.........................................................................
port numbers.......................................................................
predefined constants...........................................................
print.....................................................................................
print contents of setup data.................................................
printing.................................................................................
printing data.........................................................................
print preview........................................................................
print range...........................................................................
project..................................................................................
PWM output.........................................................................
2-32
2-50
2-45
2-72
2-73
1-20
2-79
2-80
2-28
2-77
2-78
2-77
3-26
2-77
3-28
2-78
2-43
R
range list box....................................................................... 2-15
rate-of-change detection interval......................................... 2-38
rate of change lower limit alarm.......................................... 2-38
rate of change upper limit alarm.......................................... 2-38
recording condition and file area.......................................... 2-11
record interval...................................................................... 2-10
record start.......................................................................... 2-10
record start condition........................................................... 2-13
record step.......................................................................... 2-13
record step area.................................................................. 2-10
record stop condition........................................................... 2-14
record stop events............................................................... 2-56
reference channel..................................... 2-15, 2-16, 2-21, 2-40
reference functions.............................................................. 2-30
relay ACK button................................................................. 2-42
remote RJC................................................................ 2-16, 2-20
resetting computation.......................................................... 2-27
resistance temperature detector.......................................... 2-19
response check..................................................................... 2-8
rHigh.................................................................................... 2-38
RJC...................................................................................... 2-16
rLow..................................................................................... 2-38
RRJC (TC).................................................................. 2-16, 2-20
RTD1................................................................................... 2-19
RTDEx................................................................................. 2-20
RTD Resistance Input Module............................................. 2-20
run....................................................................................... 2-41
run display.................................................................. 2-66, 2-75
run server............................................................................ 2-79
IM WX103-01E
Index
S
U
unit.............................................................................. 2-16, 2-24
unit number........................................................................... 2-9
unit status............................................................................ 2-66
universal input module........................................................ 2-19
upper limit alarm.................................................................. 2-38
use check box..................................................................... 2-15
user....................................................................................... 2-4
user-defined constant.......................................................... 2-24
user defined constants........................................................ 2-28
user file settings.................................................................. 2-58
user output.......................................................................... 2-29
user zone...................................................................... 2-68, 3-9
using templates................................................................... 3-23
V
value box............................................................................. 2-24
values.................................................................................. 2-72
Viewer.................................................................................... 1-3
VOLT................................................................................... 2-19
voltage input........................................................................ 2-19
W
waveform/numerical display layout..................................... 3-16
waveform display window...................................................... 3-6
waveform display zone.......................................................... 3-9
window menu...................................................................... 2-61
write mode............................................................................. 2-9
Y
Y-axes................................................................................... 3-11
Y-Axis Type................................................................... 2-68, 3-8
T
tag comment...................................................... 2-16, 2-18, 2-24
tag number............................................... 2-16, 2-18, 2-24, 2-28
TC........................................................................................ 2-19
temperature unit.................................................................... 2-8
templates............................................................................. 3-23
thermocouple....................................................................... 2-19
time axis..................................................................... 2-70, 3-12
time constant.............................................................. 2-16, 2-22
time functions...................................................................... 2-32
timer..................................................................................... 2-33
timer level operation............................................................ 2-33
timers................................................................................... 2-27
TLOG functions................................................................... 2-30
toolbar................................................................................... 3-6
transmission output............................................................. 2-50
trend monitor window.......................................................... 2-61
IM WX103-01E
1
Index-3
2
3
4
5
Index
Index
save destination.................................................................. 2-78
saving display settings........................................................ 3-22
saving setup data................................................................ 2-78
scale........................................................................... 2-15, 2-21
scaling settings.................................................................... 2-23
search button......................................................................... 2-2
searching............................................................................... 2-1
serial ID................................................................................. 2-3
serial No................................................................................ 2-1
setting alarm events............................................................ 2-52
setting analog output........................................................... 2-43
setting patterns.................................................................... 2-50
setting PWM output............................................................. 2-44
setting the expression......................................................... 2-24
setting the RJC.................................................................... 2-22
setting the span................................................................... 2-24
setting up MXLOGGER....................................................... 1-22
setting up the DDE server................................................... 2-81
setting up the Monitor Server.............................................. 2-79
setting up the printer................................................... 2-77, 3-27
setup data.......................................................... 2-76, 2-77, 2-78
showing/hiding alarms......................................................... 3-13
shunt resistor....................................................................... 2-19
slide zone................................................................... 2-69, 3-10
software................................................................................. 2-4
software license......................................................................... ii
software version.................................................................. 2-83
span..................................................................................... 2-15
specifying formats............................................................... 3-25
start data monitoring............................................................ 2-60
starting/stopping the recording............................................ 2-75
starting and exiting the Monitor Server................................ 2-79
starting the logger for the first time........................................ 2-1
starting the recording........................................................... 2-74
starting the software programs............................................ 1-23
start Mon. button................................................................. 2-60
start the Viewer...................................................................... 3-1
statistical computation over an area.................................... 3-20
stop condition...................................................................... 2-10
stop data monitoring............................................................ 2-60
stop Mon. button.................................................................. 2-60
stopping the recording......................................................... 2-74
STR..................................................................................... 2-20
strain input channels.................................................. 2-17, 2-23
subnet mask................................................................... 2-3, 2-4
synchronization..................................................................... 3-3
syntax error......................................................................... 2-35
system screen................................................................ 2-1, 2-5
trip points.................................................................... 2-70, 3-11
type box............................................................................... 2-16