1
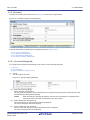
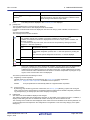
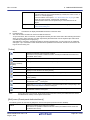
User’s Manual
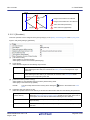
CS+ V3.02.00
Integrated Development Environment
User’s Manual: RH850 Debug Tool
Target Device
RH850 Family
All information contained in these materials, including products and product specifications,
represents information on the product at the time of publication and is subject to change by
Renesas Electronics Corp. without notice. Please review the latest information published by
Renesas Electronics Corp. through various means, including the Renesas Electronics Corp.
website (http://www.renesas.com).
www.renesas.com
Rev.1.00
2015.08
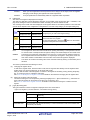
Notice
1.
Descriptions of circuits, software and other related information in this document are provided only to illustrate the operation of
semiconductor products and application examples. You are fully responsible for the incorporation of these circuits, software,
and information in the design of your equipment. Renesas Electronics assumes no responsibility for any losses incurred by you
or third parties arising from the use of these circuits, software, or information.
2.
Renesas Electronics has used reasonable care in preparing the information included in this document, but Renesas Electronics
does not warrant that such information is error free. Renesas Electronics assumes no liability whatsoever for any damages
incurred by you resulting from errors in or omissions from the information included herein.
3.
Renesas Electronics does not assume any liability for infringement of patents, copyrights, or other intellectual property rights of
third parties by or arising from the use of Renesas Electronics products or technical information described in this document. No
license, express, implied or otherwise, is granted hereby under any patents, copyrights or other intellectual property rights of
Renesas Electronics or others.
4.
You should not alter, modify, copy, or otherwise misappropriate any Renesas Electronics product, whether in whole or in part.
Renesas Electronics assumes no responsibility for any losses incurred by you or third parties arising from such alteration,
modification, copy or otherwise misappropriation of Renesas Electronics product.
5.
Renesas Electronics products are classified according to the following two quality grades: “Standard” and “High Quality”. The
recommended applications for each Renesas Electronics product depends on the product’s quality grade, as indicated below.
“Standard”:
Computers; office equipment; communications equipment; test and measurement equipment; audio and visual
equipment; home electronic appliances; machine tools; personal electronic equipment; and industrial robots etc.
“High Quality”: Transportation equipment (automobiles, trains, ships, etc.); traffic control systems; anti-disaster systems; anticrime systems; and safety equipment etc.
Renesas Electronics products are neither intended nor authorized for use in products or systems that may pose a direct threat to
human life or bodily injury (artificial life support devices or systems, surgical implantations etc.), or may cause serious property
damages (nuclear reactor control systems, military equipment etc.). You must check the quality grade of each Renesas
Electronics product before using it in a particular application. You may not use any Renesas Electronics product for any
application for which it is not intended. Renesas Electronics shall not be in any way liable for any damages or losses incurred
by you or third parties arising from the use of any Renesas Electronics product for which the product is not intended by Renesas
Electronics.
6.
You should use the Renesas Electronics products described in this document within the range specified by Renesas Electronics,
especially with respect to the maximum rating, operating supply voltage range, movement power voltage range, heat radiation
characteristics, installation and other product characteristics. Renesas Electronics shall have no liability for malfunctions or
damages arising out of the use of Renesas Electronics products beyond such specified ranges.
7.
Although Renesas Electronics endeavors to improve the quality and reliability of its products, semiconductor products have
specific characteristics such as the occurrence of failure at a certain rate and malfunctions under certain use conditions. Further,
Renesas Electronics products are not subject to radiation resistance design. Please be sure to implement safety measures to
guard them against the possibility of physical injury, and injury or damage caused by fire in the event of the failure of a Renesas
Electronics product, such as safety design for hardware and software including but not limited to redundancy, fire control and
malfunction prevention, appropriate treatment for aging degradation or any other appropriate measures. Because the evaluation
of microcomputer software alone is very difficult, please evaluate the safety of the final products or systems manufactured by
you.
8.
Please contact a Renesas Electronics sales office for details as to environmental matters such as the environmental compatibility
of each Renesas Electronics product. Please use Renesas Electronics products in compliance with all applicable laws and
regulations that regulate the inclusion or use of controlled substances, including without limitation, the EU RoHS Directive.
Renesas Electronics assumes no liability for damages or losses occurring as a result of your noncompliance with applicable laws
and regulations.
9.
Renesas Electronics products and technology may not be used for or incorporated into any products or systems whose
manufacture, use, or sale is prohibited under any applicable domestic or foreign laws or regulations. You should not use
Renesas Electronics products or technology described in this document for any purpose relating to military applications or use
by the military, including but not limited to the development of weapons of mass destruction. When exporting the Renesas
Electronics products or technology described in this document, you should comply with the applicable export control laws and
regulations and follow the procedures required by such laws and regulations.
10. It is the responsibility of the buyer or distributor of Renesas Electronics products, who distributes, disposes of, or otherwise
places the product with a third party, to notify such third party in advance of the contents and conditions set forth in this
document, Renesas Electronics assumes no responsibility for any losses incurred by you or third parties as a result of
unauthorized use of Renesas Electronics products.
11. This document may not be reproduced or duplicated in any form, in whole or in part, without prior written consent of Renesas
Electronics.
12. Please contact a Renesas Electronics sales office if you have any questions regarding the information contained in this document
or Renesas Electronics products, or if you have any other inquiries.
(Note 1) “Renesas Electronics” as used in this document means Renesas Electronics Corporation and also includes its majorityowned subsidiaries.
(Note 2) “Renesas Electronics product(s)” means any product developed or manufactured by or for Renesas Electronics.
(2012.4)
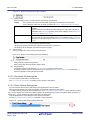
How to Use This Manual
This manual describes the role of the CS+ integrated development environment for developing applications and systems for RH850 family, and provides an outline of its features.
CS+ is an integrated development environment (IDE) for RH850 family, integrating the necessary tools for the development phase of software (e.g. design, implementation, and debugging) into a single platform.
By providing an integrated environment, it is possible to perform all development using just this product, without the
need to use many different tools separately.
Readers
This manual is intended for users who wish to understand the functions of the CS+ and
design software and hardware application systems.
Purpose
This manual is intended to give users an understanding of the functions of the CS+ to use
for reference in developing the hardware or software of systems using these devices.
Organization
This manual can be broadly divided into the following units.
1.GENERAL
2.FUNCTIONS
A.WINDOW REFERENCE
How to Read This Manual
It is assumed that the readers of this manual have general knowledge of electricity, logic
circuits, and microcontrollers.
Conventions
Data significance:
Active low representation:
Note:
Caution:
Remarks:
Numeric representation:
Higher digits on the left and lower digits on the right
XXX (overscore over pin or signal name)
Footnote for item marked with Note in the text
Information requiring particular attention
Supplementary information
Decimal ... XXXX
Hexadecimal ... 0xXXXX
All trademarks or registered trademarks in this document are the property of their respective owners.
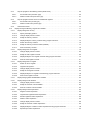
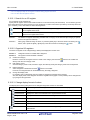
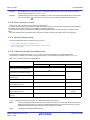
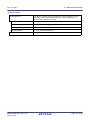
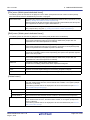
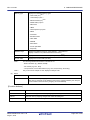
TABLE OF CONTENTS
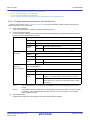
1.
GENERAL . . . . . . . . . . . . . . . . . . . . . . . . . . . . . . . . . . . . . . . . . . . . . . . . . . . . . . . . 9
1.1
Summary . . . . . . . . . . . . . . . . . . . . . . . . . . . . . . . . . . . . . . . . . . . . . . . . . . . . . . . . . . . . . . . . . . . . . . . . . . . . . . 9
1.2
Features. . . . . . . . . . . . . . . . . . . . . . . . . . . . . . . . . . . . . . . . . . . . . . . . . . . . . . . . . . . . . . . . . . . . . . . . . . . . . . . 9
2.
FUNCTIONS. . . . . . . . . . . . . . . . . . . . . . . . . . . . . . . . . . . . . . . . . . . . . . . . . . . . . . 10
2.1
Overview . . . . . . . . . . . . . . . . . . . . . . . . . . . . . . . . . . . . . . . . . . . . . . . . . . . . . . . . . . . . . . . . . . . . . . . . . . . . . 10
2.2
Preparation before Debugging. . . . . . . . . . . . . . . . . . . . . . . . . . . . . . . . . . . . . . . . . . . . . . . . . . . . . . . . . . . . . 12
2.2.1
Confirm the connection to a host machine . . . . . . . . . . . . . . . . . . . . . . . . . . . . . . . . . . . . . . . . . . . . . . . . 12
2.2.1.1
[Full-spec emulator] . . . . . . . . . . . . . . . . . . . . . . . . . . . . . . . . . . . . . . . . . . . . . . . . . . . . . . . . . . . . . . 12
2.2.1.2
[E1] . . . . . . . . . . . . . . . . . . . . . . . . . . . . . . . . . . . . . . . . . . . . . . . . . . . . . . . . . . . . . . . . . . . . . . . . . . 12
2.2.1.3
[E20] . . . . . . . . . . . . . . . . . . . . . . . . . . . . . . . . . . . . . . . . . . . . . . . . . . . . . . . . . . . . . . . . . . . . . . . . . 12
2.2.1.4
[Simulator] . . . . . . . . . . . . . . . . . . . . . . . . . . . . . . . . . . . . . . . . . . . . . . . . . . . . . . . . . . . . . . . . . . . . . 13
2.3
Configuration of Operating Environment of the Debug Tool . . . . . . . . . . . . . . . . . . . . . . . . . . . . . . . . . . . . . . 14
2.3.1
Select the debug tool to use . . . . . . . . . . . . . . . . . . . . . . . . . . . . . . . . . . . . . . . . . . . . . . . . . . . . . . . . . . . 14
2.3.2
[Full-spec emulator] . . . . . . . . . . . . . . . . . . . . . . . . . . . . . . . . . . . . . . . . . . . . . . . . . . . . . . . . . . . . . . . . . 15
2.3.2.1
[Connect Settings] tab . . . . . . . . . . . . . . . . . . . . . . . . . . . . . . . . . . . . . . . . . . . . . . . . . . . . . . . . . . . . 15
2.3.2.2
[Debug Tool Settings] tab . . . . . . . . . . . . . . . . . . . . . . . . . . . . . . . . . . . . . . . . . . . . . . . . . . . . . . . . . 17
2.3.2.3
[Download File Settings] tab . . . . . . . . . . . . . . . . . . . . . . . . . . . . . . . . . . . . . . . . . . . . . . . . . . . . . . . 19
2.3.2.4
[Flash Options Settings] tab . . . . . . . . . . . . . . . . . . . . . . . . . . . . . . . . . . . . . . . . . . . . . . . . . . . . . . . 19
2.3.2.5
[Hook Transaction Settings] tab. . . . . . . . . . . . . . . . . . . . . . . . . . . . . . . . . . . . . . . . . . . . . . . . . . . . . 20
2.3.3
[E1] . . . . . . . . . . . . . . . . . . . . . . . . . . . . . . . . . . . . . . . . . . . . . . . . . . . . . . . . . . . . . . . . . . . . . . . . . . . . . . 21
2.3.3.1
[Connect Settings] tab . . . . . . . . . . . . . . . . . . . . . . . . . . . . . . . . . . . . . . . . . . . . . . . . . . . . . . . . . . . . 21
2.3.3.2
[Debug Tool Settings] tab . . . . . . . . . . . . . . . . . . . . . . . . . . . . . . . . . . . . . . . . . . . . . . . . . . . . . . . . . 24
2.3.3.3
[Download File Settings] tab . . . . . . . . . . . . . . . . . . . . . . . . . . . . . . . . . . . . . . . . . . . . . . . . . . . . . . . 26
2.3.3.4
[Flash Options Settings] tab . . . . . . . . . . . . . . . . . . . . . . . . . . . . . . . . . . . . . . . . . . . . . . . . . . . . . . . 26
2.3.3.5
[Hook Transaction Settings] tab. . . . . . . . . . . . . . . . . . . . . . . . . . . . . . . . . . . . . . . . . . . . . . . . . . . . . 27
2.3.4
[E20] . . . . . . . . . . . . . . . . . . . . . . . . . . . . . . . . . . . . . . . . . . . . . . . . . . . . . . . . . . . . . . . . . . . . . . . . . . . . . 28
2.3.4.1
[Connect Settings] tab . . . . . . . . . . . . . . . . . . . . . . . . . . . . . . . . . . . . . . . . . . . . . . . . . . . . . . . . . . . . 28
2.3.4.2
[Debug Tool Settings] tab . . . . . . . . . . . . . . . . . . . . . . . . . . . . . . . . . . . . . . . . . . . . . . . . . . . . . . . . . 31
2.3.4.3
[Download File Settings] tab . . . . . . . . . . . . . . . . . . . . . . . . . . . . . . . . . . . . . . . . . . . . . . . . . . . . . . . 33
2.3.4.4
[Flash Options Settings] tab . . . . . . . . . . . . . . . . . . . . . . . . . . . . . . . . . . . . . . . . . . . . . . . . . . . . . . . 33
2.3.4.5
[Hook Transaction Settings] tab. . . . . . . . . . . . . . . . . . . . . . . . . . . . . . . . . . . . . . . . . . . . . . . . . . . . . 34
2.3.5
[Simulator]. . . . . . . . . . . . . . . . . . . . . . . . . . . . . . . . . . . . . . . . . . . . . . . . . . . . . . . . . . . . . . . . . . . . . . . . . 35
2.3.5.1
[Connect Settings] tab . . . . . . . . . . . . . . . . . . . . . . . . . . . . . . . . . . . . . . . . . . . . . . . . . . . . . . . . . . . . 35
2.3.5.2
[Debug Tool Settings] tab . . . . . . . . . . . . . . . . . . . . . . . . . . . . . . . . . . . . . . . . . . . . . . . . . . . . . . . . . 36
2.3.5.3
[Download File Settings] tab . . . . . . . . . . . . . . . . . . . . . . . . . . . . . . . . . . . . . . . . . . . . . . . . . . . . . . . 38
2.3.5.4
[Flash Options Settings] tab . . . . . . . . . . . . . . . . . . . . . . . . . . . . . . . . . . . . . . . . . . . . . . . . . . . . . . . 38
2.3.5.5
[Hook Transaction Settings] tab. . . . . . . . . . . . . . . . . . . . . . . . . . . . . . . . . . . . . . . . . . . . . . . . . . . . . 38
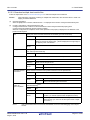
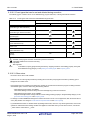
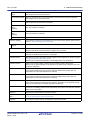
2.4
Connect to/Disconnect from the Debug Tool . . . . . . . . . . . . . . . . . . . . . . . . . . . . . . . . . . . . . . . . . . . . . . . . . . 39
2.4.1
Connect to the debug tool. . . . . . . . . . . . . . . . . . . . . . . . . . . . . . . . . . . . . . . . . . . . . . . . . . . . . . . . . . . . . 39
2.4.2
Disconnect from the debug tool . . . . . . . . . . . . . . . . . . . . . . . . . . . . . . . . . . . . . . . . . . . . . . . . . . . . . . . . 39
2.4.3
Connect to the debug tool using hot plug-in [E1][E20] . . . . . . . . . . . . . . . . . . . . . . . . . . . . . . . . . . . . . 39
2.5
Download/Upload Programs . . . . . . . . . . . . . . . . . . . . . . . . . . . . . . . . . . . . . . . . . . . . . . . . . . . . . . . . . . . . . . 41
2.5.1
Execute downloading . . . . . . . . . . . . . . . . . . . . . . . . . . . . . . . . . . . . . . . . . . . . . . . . . . . . . . . . . . . . . . . . 41
2.5.2
Advanced downloading. . . . . . . . . . . . . . . . . . . . . . . . . . . . . . . . . . . . . . . . . . . . . . . . . . . . . . . . . . . . . . . 43
2.5.2.1
Change download conditions for load module files . . . . . . . . . . . . . . . . . . . . . . . . . . . . . . . . . . . . . . 45
2.5.2.2
Add download files (*.hex/*mot/*.bin) . . . . . . . . . . . . . . . . . . . . . . . . . . . . . . . . . . . . . . . . . . . . . . . . 46
2.5.2.3
Download multiple load module files . . . . . . . . . . . . . . . . . . . . . . . . . . . . . . . . . . . . . . . . . . . . . . . . . 47
2.5.2.4
Perform source level debugging with files other than the load module file format . . . . . . . . . . . . . . 48
2.5.3
2.6
Execute uploading . . . . . . . . . . . . . . . . . . . . . . . . . . . . . . . . . . . . . . . . . . . . . . . . . . . . . . . . . . . . . . . . . . 49
Display/Change Programs . . . . . . . . . . . . . . . . . . . . . . . . . . . . . . . . . . . . . . . . . . . . . . . . . . . . . . . . . . . . . . . . 50
2.6.1
Display source files. . . . . . . . . . . . . . . . . . . . . . . . . . . . . . . . . . . . . . . . . . . . . . . . . . . . . . . . . . . . . . . . . . 50
2.6.2
Display the result of disassembling . . . . . . . . . . . . . . . . . . . . . . . . . . . . . . . . . . . . . . . . . . . . . . . . . . . . . 50
2.6.2.1
Change display mode . . . . . . . . . . . . . . . . . . . . . . . . . . . . . . . . . . . . . . . . . . . . . . . . . . . . . . . . . . . . 51
2.6.2.2
Change display format. . . . . . . . . . . . . . . . . . . . . . . . . . . . . . . . . . . . . . . . . . . . . . . . . . . . . . . . . . . . 52
2.6.2.3
Move to the specified address. . . . . . . . . . . . . . . . . . . . . . . . . . . . . . . . . . . . . . . . . . . . . . . . . . . . . . 52
2.6.2.4
Move to the symbol defined location . . . . . . . . . . . . . . . . . . . . . . . . . . . . . . . . . . . . . . . . . . . . . . . . . 52
2.6.2.5
Save the disassembled text contents . . . . . . . . . . . . . . . . . . . . . . . . . . . . . . . . . . . . . . . . . . . . . . . . 53
2.6.3
Run a build in parallel with other operations. . . . . . . . . . . . . . . . . . . . . . . . . . . . . . . . . . . . . . . . . . . . . . . 54
2.6.4
Perform line assembly . . . . . . . . . . . . . . . . . . . . . . . . . . . . . . . . . . . . . . . . . . . . . . . . . . . . . . . . . . . . . . . 54
2.6.4.1
Edit instructions . . . . . . . . . . . . . . . . . . . . . . . . . . . . . . . . . . . . . . . . . . . . . . . . . . . . . . . . . . . . . . . . . 54
2.6.4.2
Edit code . . . . . . . . . . . . . . . . . . . . . . . . . . . . . . . . . . . . . . . . . . . . . . . . . . . . . . . . . . . . . . . . . . . . . . 56
2.7
Select a Core (PE) . . . . . . . . . . . . . . . . . . . . . . . . . . . . . . . . . . . . . . . . . . . . . . . . . . . . . . . . . . . . . . . . . . . . . . 57
2.7.1
2.8
Switching between cores (PEs) . . . . . . . . . . . . . . . . . . . . . . . . . . . . . . . . . . . . . . . . . . . . . . . . . . . . . . . . 58
Execute Programs . . . . . . . . . . . . . . . . . . . . . . . . . . . . . . . . . . . . . . . . . . . . . . . . . . . . . . . . . . . . . . . . . . . . . . 59
2.8.1
Reset microcontroller (CPU). . . . . . . . . . . . . . . . . . . . . . . . . . . . . . . . . . . . . . . . . . . . . . . . . . . . . . . . . . . 59
2.8.2
Execute programs. . . . . . . . . . . . . . . . . . . . . . . . . . . . . . . . . . . . . . . . . . . . . . . . . . . . . . . . . . . . . . . . . . . 59
2.8.2.1
Execute after resetting microcontroller (CPU) . . . . . . . . . . . . . . . . . . . . . . . . . . . . . . . . . . . . . . . . . . 60
2.8.2.2
Execute from the current address . . . . . . . . . . . . . . . . . . . . . . . . . . . . . . . . . . . . . . . . . . . . . . . . . . . 60
2.8.2.3
Execute after changing PC value . . . . . . . . . . . . . . . . . . . . . . . . . . . . . . . . . . . . . . . . . . . . . . . . . . . 61
2.8.3
Execute programs in steps . . . . . . . . . . . . . . . . . . . . . . . . . . . . . . . . . . . . . . . . . . . . . . . . . . . . . . . . . . . . 61
2.8.3.1
Step in function (Step in execution) . . . . . . . . . . . . . . . . . . . . . . . . . . . . . . . . . . . . . . . . . . . . . . . . . . 61
2.8.3.2
Step over function (Step over execution). . . . . . . . . . . . . . . . . . . . . . . . . . . . . . . . . . . . . . . . . . . . . . 62
2.8.3.3
Execute until return is completed (Return out execution) . . . . . . . . . . . . . . . . . . . . . . . . . . . . . . . . . 62
2.9
Stop Programs (Break) . . . . . . . . . . . . . . . . . . . . . . . . . . . . . . . . . . . . . . . . . . . . . . . . . . . . . . . . . . . . . . . . . . 63
2.9.1
Configure the break function [Full-spec emulator][E1][E20] . . . . . . . . . . . . . . . . . . . . . . . . . . . . . . . . . . . 63
2.9.2
Stop the program manually. . . . . . . . . . . . . . . . . . . . . . . . . . . . . . . . . . . . . . . . . . . . . . . . . . . . . . . . . . . . 64
2.9.3
Stop the program at the arbitrary position (breakpoint) . . . . . . . . . . . . . . . . . . . . . . . . . . . . . . . . . . . . . . 64
2.9.3.1
Set a breakpoint . . . . . . . . . . . . . . . . . . . . . . . . . . . . . . . . . . . . . . . . . . . . . . . . . . . . . . . . . . . . . . . . 64
2.9.3.2
Delete a breakpoint . . . . . . . . . . . . . . . . . . . . . . . . . . . . . . . . . . . . . . . . . . . . . . . . . . . . . . . . . . . . . . 66
2.9.4
Stop the program at the arbitrary position (break event) . . . . . . . . . . . . . . . . . . . . . . . . . . . . . . . . . . . . . 66
2.9.4.1
Set a break event (execution type) . . . . . . . . . . . . . . . . . . . . . . . . . . . . . . . . . . . . . . . . . . . . . . . . . . 66
2.9.4.2
Delete a break event (execution type). . . . . . . . . . . . . . . . . . . . . . . . . . . . . . . . . . . . . . . . . . . . . . . . 67
2.9.5
Stop the program with the access to variables/I/O registers. . . . . . . . . . . . . . . . . . . . . . . . . . . . . . . . . . . 67
2.9.5.1
Set a break event (access type) . . . . . . . . . . . . . . . . . . . . . . . . . . . . . . . . . . . . . . . . . . . . . . . . . . . . 67
2.9.5.2
Delete a break event (access type) . . . . . . . . . . . . . . . . . . . . . . . . . . . . . . . . . . . . . . . . . . . . . . . . . . 70
2.9.6
2.10
Other break causes . . . . . . . . . . . . . . . . . . . . . . . . . . . . . . . . . . . . . . . . . . . . . . . . . . . . . . . . . . . . . . . . . 70
Display/Change the Memory, Register and Variable . . . . . . . . . . . . . . . . . . . . . . . . . . . . . . . . . . . . . . . . . . . . 71
2.10.1
Display/change the memory . . . . . . . . . . . . . . . . . . . . . . . . . . . . . . . . . . . . . . . . . . . . . . . . . . . . . . . . . . . 71
2.10.1.1
Specify the display position . . . . . . . . . . . . . . . . . . . . . . . . . . . . . . . . . . . . . . . . . . . . . . . . . . . . . . . . 71
2.10.1.2
Change display format of values . . . . . . . . . . . . . . . . . . . . . . . . . . . . . . . . . . . . . . . . . . . . . . . . . . . . 72
2.10.1.3
Modify the memory contents . . . . . . . . . . . . . . . . . . . . . . . . . . . . . . . . . . . . . . . . . . . . . . . . . . . . . . . 73
2.10.1.4
Display/modify the memory contents during program execution. . . . . . . . . . . . . . . . . . . . . . . . . . . . 74
2.10.1.5
Search the memory contents. . . . . . . . . . . . . . . . . . . . . . . . . . . . . . . . . . . . . . . . . . . . . . . . . . . . . . . 76
2.10.1.6
Modify the memory contents in batch (initialize) . . . . . . . . . . . . . . . . . . . . . . . . . . . . . . . . . . . . . . . . 77
2.10.1.7
Save the memory contents . . . . . . . . . . . . . . . . . . . . . . . . . . . . . . . . . . . . . . . . . . . . . . . . . . . . . . . . 78
2.10.2
Display/change the CPU register . . . . . . . . . . . . . . . . . . . . . . . . . . . . . . . . . . . . . . . . . . . . . . . . . . . . . . . 79
2.10.2.1
Change display format of values . . . . . . . . . . . . . . . . . . . . . . . . . . . . . . . . . . . . . . . . . . . . . . . . . . . . 80
2.10.2.2
Modify the CPU register contents . . . . . . . . . . . . . . . . . . . . . . . . . . . . . . . . . . . . . . . . . . . . . . . . . . . 80
2.10.2.3
Display/modify the CPU register contents during program execution . . . . . . . . . . . . . . . . . . . . . . . . 81
2.10.2.4
Save the CPU register contents . . . . . . . . . . . . . . . . . . . . . . . . . . . . . . . . . . . . . . . . . . . . . . . . . . . . 81
2.10.3
Display/change the I/O register . . . . . . . . . . . . . . . . . . . . . . . . . . . . . . . . . . . . . . . . . . . . . . . . . . . . . . . . 81
2.10.3.1
Search for an I/O register . . . . . . . . . . . . . . . . . . . . . . . . . . . . . . . . . . . . . . . . . . . . . . . . . . . . . . . . . 82
2.10.3.2
Organize I/O registers . . . . . . . . . . . . . . . . . . . . . . . . . . . . . . . . . . . . . . . . . . . . . . . . . . . . . . . . . . . . 82
2.10.3.3
Change display format of values . . . . . . . . . . . . . . . . . . . . . . . . . . . . . . . . . . . . . . . . . . . . . . . . . . . . 82
2.10.3.4
Modify the I/O register contents. . . . . . . . . . . . . . . . . . . . . . . . . . . . . . . . . . . . . . . . . . . . . . . . . . . . . 83
2.10.3.5
Display/modify the I/O register contents during program execution . . . . . . . . . . . . . . . . . . . . . . . . . 83
2.10.3.6
Save the I/O register contents . . . . . . . . . . . . . . . . . . . . . . . . . . . . . . . . . . . . . . . . . . . . . . . . . . . . . . 83
2.10.4
Display/change global variables/static variables . . . . . . . . . . . . . . . . . . . . . . . . . . . . . . . . . . . . . . . . . . . 83
2.10.5
Display/change local variables . . . . . . . . . . . . . . . . . . . . . . . . . . . . . . . . . . . . . . . . . . . . . . . . . . . . . . . . . 83
2.10.5.1
Change display format of values . . . . . . . . . . . . . . . . . . . . . . . . . . . . . . . . . . . . . . . . . . . . . . . . . . . . 84
2.10.5.2
Modify the contents of local variables . . . . . . . . . . . . . . . . . . . . . . . . . . . . . . . . . . . . . . . . . . . . . . . . 85
2.10.5.3
Save the contents of local variables . . . . . . . . . . . . . . . . . . . . . . . . . . . . . . . . . . . . . . . . . . . . . . . . . 85
2.10.6
Display/change watch-expressions . . . . . . . . . . . . . . . . . . . . . . . . . . . . . . . . . . . . . . . . . . . . . . . . . . . . . 86
2.10.6.1
Register a watch-expression . . . . . . . . . . . . . . . . . . . . . . . . . . . . . . . . . . . . . . . . . . . . . . . . . . . . . . . 86
2.10.6.2
Organize the registered watch-expressions . . . . . . . . . . . . . . . . . . . . . . . . . . . . . . . . . . . . . . . . . . . 88
2.10.6.3
Edit the registered watch-expressions. . . . . . . . . . . . . . . . . . . . . . . . . . . . . . . . . . . . . . . . . . . . . . . . 88
2.10.6.4
Delete a watch-expression . . . . . . . . . . . . . . . . . . . . . . . . . . . . . . . . . . . . . . . . . . . . . . . . . . . . . . . . 88
2.10.6.5
Change display format of values . . . . . . . . . . . . . . . . . . . . . . . . . . . . . . . . . . . . . . . . . . . . . . . . . . . . 88
2.10.6.6
Modify the contents of watch-expressions. . . . . . . . . . . . . . . . . . . . . . . . . . . . . . . . . . . . . . . . . . . . . 89
2.10.6.7
Display/modify the contents of watch-expressions during program execution . . . . . . . . . . . . . . . . . 89
2.10.6.8
Export/import watch-expressions . . . . . . . . . . . . . . . . . . . . . . . . . . . . . . . . . . . . . . . . . . . . . . . . . . . 90
2.10.6.9
2.11
Save the contents of watch-expressions . . . . . . . . . . . . . . . . . . . . . . . . . . . . . . . . . . . . . . . . . . . . . . 91
Display Information on Function Call from Stack . . . . . . . . . . . . . . . . . . . . . . . . . . . . . . . . . . . . . . . . . . . . . . . 92
2.11.1
Display call stack information . . . . . . . . . . . . . . . . . . . . . . . . . . . . . . . . . . . . . . . . . . . . . . . . . . . . . . . . . . 92
2.11.1.1
Change display format of values . . . . . . . . . . . . . . . . . . . . . . . . . . . . . . . . . . . . . . . . . . . . . . . . . . . . 92
2.11.1.2
Jump to the source line . . . . . . . . . . . . . . . . . . . . . . . . . . . . . . . . . . . . . . . . . . . . . . . . . . . . . . . . . . . 93
2.11.1.3
Display local variables . . . . . . . . . . . . . . . . . . . . . . . . . . . . . . . . . . . . . . . . . . . . . . . . . . . . . . . . . . . . 93
2.11.1.4
Save the contents of call stack information . . . . . . . . . . . . . . . . . . . . . . . . . . . . . . . . . . . . . . . . . . . . 93
2.12
Collect Execution History of Programs . . . . . . . . . . . . . . . . . . . . . . . . . . . . . . . . . . . . . . . . . . . . . . . . . . . . . . 94
2.12.1
Configure the trace operation . . . . . . . . . . . . . . . . . . . . . . . . . . . . . . . . . . . . . . . . . . . . . . . . . . . . . . . . . . 94
2.12.1.1
[Full-spec emulator] . . . . . . . . . . . . . . . . . . . . . . . . . . . . . . . . . . . . . . . . . . . . . . . . . . . . . . . . . . . . . . 94
2.12.1.2
[E1]/[E20]. . . . . . . . . . . . . . . . . . . . . . . . . . . . . . . . . . . . . . . . . . . . . . . . . . . . . . . . . . . . . . . . . . . . . . 96
2.12.1.3
[Simulator] . . . . . . . . . . . . . . . . . . . . . . . . . . . . . . . . . . . . . . . . . . . . . . . . . . . . . . . . . . . . . . . . . . . . . 98
2.12.2
Collect execution history until stop of the execution . . . . . . . . . . . . . . . . . . . . . . . . . . . . . . . . . . . . . . . . . 99
2.12.3
Collect execution history in the arbitrary section . . . . . . . . . . . . . . . . . . . . . . . . . . . . . . . . . . . . . . . . . . . 99
2.12.3.1
Set a Trace event . . . . . . . . . . . . . . . . . . . . . . . . . . . . . . . . . . . . . . . . . . . . . . . . . . . . . . . . . . . . . . . 99
2.12.3.2
Execute the program . . . . . . . . . . . . . . . . . . . . . . . . . . . . . . . . . . . . . . . . . . . . . . . . . . . . . . . . . . . . 102
2.12.3.3
Delete a Trace event . . . . . . . . . . . . . . . . . . . . . . . . . . . . . . . . . . . . . . . . . . . . . . . . . . . . . . . . . . . . 102
2.12.4
Collect execution history only when the condition is met . . . . . . . . . . . . . . . . . . . . . . . . . . . . . . . . . . . . 102
2.12.4.1
Set a Point Trace event . . . . . . . . . . . . . . . . . . . . . . . . . . . . . . . . . . . . . . . . . . . . . . . . . . . . . . . . . . 102
2.12.4.2
Execute the program . . . . . . . . . . . . . . . . . . . . . . . . . . . . . . . . . . . . . . . . . . . . . . . . . . . . . . . . . . . . 103
2.12.4.3
Edit a Point Trace event [Full-spec emulator][E1][E20] . . . . . . . . . . . . . . . . . . . . . . . . . . . . . . . . . . 104
2.12.4.4
Delete a Point Trace event . . . . . . . . . . . . . . . . . . . . . . . . . . . . . . . . . . . . . . . . . . . . . . . . . . . . . . . 104
2.12.5
Stop/restart collection of execution history . . . . . . . . . . . . . . . . . . . . . . . . . . . . . . . . . . . . . . . . . . . . . . . 104
2.12.5.1
Stop collection of execution history temporarily. . . . . . . . . . . . . . . . . . . . . . . . . . . . . . . . . . . . . . . . 104
2.12.5.2
Restart collection of execution history . . . . . . . . . . . . . . . . . . . . . . . . . . . . . . . . . . . . . . . . . . . . . . . 104
2.12.6
Display the collected execution history. . . . . . . . . . . . . . . . . . . . . . . . . . . . . . . . . . . . . . . . . . . . . . . . . . 104
2.12.6.1
Change display mode . . . . . . . . . . . . . . . . . . . . . . . . . . . . . . . . . . . . . . . . . . . . . . . . . . . . . . . . . . . 105
2.12.6.2
Change display format of values . . . . . . . . . . . . . . . . . . . . . . . . . . . . . . . . . . . . . . . . . . . . . . . . . . . 106
2.12.6.3
Link with other panels . . . . . . . . . . . . . . . . . . . . . . . . . . . . . . . . . . . . . . . . . . . . . . . . . . . . . . . . . . . 106
2.12.7
Clear the trace memory . . . . . . . . . . . . . . . . . . . . . . . . . . . . . . . . . . . . . . . . . . . . . . . . . . . . . . . . . . . . . 106
2.12.8
Search the trace data . . . . . . . . . . . . . . . . . . . . . . . . . . . . . . . . . . . . . . . . . . . . . . . . . . . . . . . . . . . . . . . 107
2.12.8.1
Search in the instruction level . . . . . . . . . . . . . . . . . . . . . . . . . . . . . . . . . . . . . . . . . . . . . . . . . . . . . 107
2.12.8.2
Search in the source level . . . . . . . . . . . . . . . . . . . . . . . . . . . . . . . . . . . . . . . . . . . . . . . . . . . . . . . . 109
2.12.9
2.13
Save the contents of execution history . . . . . . . . . . . . . . . . . . . . . . . . . . . . . . . . . . . . . . . . . . . . . . . . . . 111
Measure Execution Time of Programs. . . . . . . . . . . . . . . . . . . . . . . . . . . . . . . . . . . . . . . . . . . . . . . . . . . . . . 113
2.13.1
Measure execution time until stop of the execution . . . . . . . . . . . . . . . . . . . . . . . . . . . . . . . . . . . . . . . . 113
2.13.2
Measure execution time in the arbitrary section . . . . . . . . . . . . . . . . . . . . . . . . . . . . . . . . . . . . . . . . . . . 113
2.13.2.1
Set a Timer Result event . . . . . . . . . . . . . . . . . . . . . . . . . . . . . . . . . . . . . . . . . . . . . . . . . . . . . . . . . 114
2.13.2.2
Execute the program . . . . . . . . . . . . . . . . . . . . . . . . . . . . . . . . . . . . . . . . . . . . . . . . . . . . . . . . . . . . 115
2.13.2.3
Edit a Timer Result event [Full-spec emulator][E1][E20] . . . . . . . . . . . . . . . . . . . . . . . . . . . . . . . . . 116
2.13.2.4
Delete a Timer Result event . . . . . . . . . . . . . . . . . . . . . . . . . . . . . . . . . . . . . . . . . . . . . . . . . . . . . . 117
2.13.3
Measurable time ranges . . . . . . . . . . . . . . . . . . . . . . . . . . . . . . . . . . . . . . . . . . . . . . . . . . . . . . . . . . . . . 117
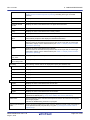
2.14
Measure Coverage [Simulator] . . . . . . . . . . . . . . . . . . . . . . . . . . . . . . . . . . . . . . . . . . . . . . . . . . . . . . . . . . . 118
2.14.1
Configure the coverage measurement . . . . . . . . . . . . . . . . . . . . . . . . . . . . . . . . . . . . . . . . . . . . . . . . . . 118
2.14.2
Display the coverage measurement result . . . . . . . . . . . . . . . . . . . . . . . . . . . . . . . . . . . . . . . . . . . . . . . 118
2.15
Set an Action into Programs . . . . . . . . . . . . . . . . . . . . . . . . . . . . . . . . . . . . . . . . . . . . . . . . . . . . . . . . . . . . . 121
2.15.1
2.16
Inset printf . . . . . . . . . . . . . . . . . . . . . . . . . . . . . . . . . . . . . . . . . . . . . . . . . . . . . . . . . . . . . . . . . . . . . . . . 121
Manage Events . . . . . . . . . . . . . . . . . . . . . . . . . . . . . . . . . . . . . . . . . . . . . . . . . . . . . . . . . . . . . . . . . . . . . . . 123
2.16.1
Change the state of set events (valid/invalid) . . . . . . . . . . . . . . . . . . . . . . . . . . . . . . . . . . . . . . . . . . . . . 123
2.16.2
Display only particular event types . . . . . . . . . . . . . . . . . . . . . . . . . . . . . . . . . . . . . . . . . . . . . . . . . . . . . 124
2.16.3
Jump to the event address . . . . . . . . . . . . . . . . . . . . . . . . . . . . . . . . . . . . . . . . . . . . . . . . . . . . . . . . . . . 124
2.16.4
Delete events . . . . . . . . . . . . . . . . . . . . . . . . . . . . . . . . . . . . . . . . . . . . . . . . . . . . . . . . . . . . . . . . . . . . . 124
2.16.5
Write comment to events . . . . . . . . . . . . . . . . . . . . . . . . . . . . . . . . . . . . . . . . . . . . . . . . . . . . . . . . . . . . 125
2.16.6
Notes for setting events . . . . . . . . . . . . . . . . . . . . . . . . . . . . . . . . . . . . . . . . . . . . . . . . . . . . . . . . . . . . . 125
2.16.6.1
Maximum number of enabled events . . . . . . . . . . . . . . . . . . . . . . . . . . . . . . . . . . . . . . . . . . . . . . . 125
2.16.6.2
Event types that can be set and deleted during execution . . . . . . . . . . . . . . . . . . . . . . . . . . . . . . . 126
2.16.6.3
Other notes . . . . . . . . . . . . . . . . . . . . . . . . . . . . . . . . . . . . . . . . . . . . . . . . . . . . . . . . . . . . . . . . . . . 126
2.17
Use Hook Function . . . . . . . . . . . . . . . . . . . . . . . . . . . . . . . . . . . . . . . . . . . . . . . . . . . . . . . . . . . . . . . . . . . . 127
2.18
About Input Value. . . . . . . . . . . . . . . . . . . . . . . . . . . . . . . . . . . . . . . . . . . . . . . . . . . . . . . . . . . . . . . . . . . . . . 130
2.18.1
Input rule. . . . . . . . . . . . . . . . . . . . . . . . . . . . . . . . . . . . . . . . . . . . . . . . . . . . . . . . . . . . . . . . . . . . . . . . . 130
2.18.2
Symbol name completion function . . . . . . . . . . . . . . . . . . . . . . . . . . . . . . . . . . . . . . . . . . . . . . . . . . . . . 133
2.18.3
Icons for invalid input . . . . . . . . . . . . . . . . . . . . . . . . . . . . . . . . . . . . . . . . . . . . . . . . . . . . . . . . . . . . . . . 134
A.
A.1
WINDOW REFERENCE. . . . . . . . . . . . . . . . . . . . . . . . . . . . . . . . . . . . . . . . . . . . 135
Description . . . . . . . . . . . . . . . . . . . . . . . . . . . . . . . . . . . . . . . . . . . . . . . . . . . . . . . . . . . . . . . . . . . . . . . . . . . 135
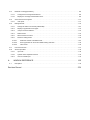
Revision Record . . . . . . . . . . . . . . . . . . . . . . . . . . . . . . . . . . . . . . . . . . . . . . . . . . . . . . . 278
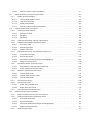
CS+ V3.02.00
1. GENERAL
1. GENERAL
CS+ is a platform of an integrated developing environment for RH850 family, RX family, V850 family, RL78 family,
78K0R microcontrollers, 78K0 microcontrollers.
CS+ can run all the operations needed for developing the programs such as designing, cording, building, debugging,
and flash programming.
In this manual, the debugging is explained out of those operations needed for the program development.
In this chapter, an overview of debugging products that CS+ provides is explained.
1.1 Summary
You can effectively debug/simulate the program developed for the RH850 family, using the debugger which CS+
provides.
1.2 Features
The following are the features of the debugger provided by CS+.
- Synchronous execution and synchronous break in a microcontroller that supports multi-core
Synchronous execution and synchronous break are available when the target microcontroller supports multi-core.
Information regarding a desired core is displayed on the panel by switching the core selection.
- Connecting to the various debug tools
A pleasant debugging environment for target systems is provided by connecting to the full-spec emulator (Full-spec
emulator), the on-chip debugging emulator (E1/E20) and Simulator.
- C source text and disassembled text are shown mixed
The C source text and the disassembled text are shown mixed on the same panel.
- Source level debugging and instruction level debugging
The source level debugging and the instruction level debugging for a C source program can be done.
- Support of flash self programming emulation (Code flash)
The code flash can be rewrote by using the flash self library of the flash self programming function.
- Real-time display update function
The contents of memory, registers and variables are automatically updated not only when the program execution is
stopped, but also in execution.
- Save/restore the debugging environment
The debugging environment such as breakpoints, event configuration information, file download information, display
condition/position of the panel, etc. can be saved.
R20UT3456EJ0100 Rev.1.00
Aug 01, 2015
Page 9 of 281
CS+ V3.02.00
2. FUNCTIONS
2. FUNCTIONS
This chapter describes a debugging process of CS+ and main functions for debugging.
2.1 Overview
The basic debugging sequence for programs using CS+ is as follows:
(1)
Start CS+
Launch CS+ from the [Start] menu of Windows.
Remark
(2)
Set a project
Create a new project, or load an existing one.
Remark
(3)
For details on "Start CS+", see "CS+ Integrated Development Environment User's Manual: Project
Operation".
For details on "Set a project", see "CS+ Integrated Development Environment User's Manual: Project Operation".
Create a load module
Create a load module by running a build after setting of the active project and the build tool to be used.
Remark
For details on "Create a load module" with CC-RH, see "CS+ Integrated Development Environment
User's Manual: RH850 Build".
(4)
Confirm the connection to a host machine
Connect the debug tool (Full-spec emulator, E1, E20, or Simulator) to be used to a host machine.
(5)
Select the debug tool to use
Select the debug tool to be used in a project.
Remark
(6)
The selectable debug tool differs depending on the microcontroller type to be used in a project.
Configure the operating environment of the debug tool
Configure the operating environment of the debug tool selected in steps (5).
- [Full-spec emulator]
- [E1]
- [E20]
- [Simulator]
(7)
Connect to the debug tool
Connect the debug tool to CS+ to start communication.
(8)
Execute downloading
Download the load module created in steps (3) to the debug tool.
(9)
Display source files
Display the contents of the downloaded load module (source files) on the Editor panel or Disassemble panel.
(10) Execute programs
Execute the program by using the operation method corresponding to a purpose.
If you wish to stop the program at the arbitrary position, set a breakpoint/break eventNote before executing the program (see "2.9.3 Stop the program at the arbitrary position (breakpoint)", "2.9.4 Stop the program at the arbitrary
position (break event)", or "2.9.5 Stop the program with the access to variables/I/O registers").
Note
These functions are implemented by setting events to the debug tool used.
See "2.16.6 Notes for setting events", when you use events.
Remark
When the selected microcontroller version supports multi-core, select a core (PE: Processer Element) to be debugged before executing the program (see "2.7 Select a Core (PE)").
(11) Stop the program manually
Stop the program currently being executed.
Note that if a breakpoint/break event has been set in steps (10), the program execution will be stopped automatically when the set break condition is met.
(12) Check the result of the program execution
Check the following information that the debug tool acquired by the program execution.
R20UT3456EJ0100 Rev.1.00
Aug 01, 2015
Page 10 of 281
CS+ V3.02.00
2. FUNCTIONS
- Display/Change the Memory, Register and Variable
- Display Information on Function Call from Stack
- Collect Execution History of ProgramsNote
- Measure Execution Time of ProgramsNote
- Measure Coverage [Simulator]
Note
These functions are implemented by setting events to the debug tool used.
See "2.16.6 Notes for setting events", when you use events.
Debug the program, repeating steps (9) to (12) as required.
Note that if the program is modified during debugging, steps (3) and (8) also should be repeated.
Remark 1.
Other than the above, you can also check the result of the program execution by using the following
functions.
- Set an Action into Programs
- Use Hook Function
Remark 2.
The acquired information can be saved to a file.
- Save the disassembled text contents
- Save the memory contents
- Save the CPU register contents
- Save the I/O register contents
- Save the contents of local variables
- Save the contents of watch-expressions
- Save the contents of call stack information
- Save the contents of execution history
(13) Execute uploading
Save the program (the memory contents) to a file in the arbitrary format (e.g. Intel HEX file, Motorola S-record file,
binary file, and etc.), as required.
(14) Disconnect from the debug tool
Disconnect the debug tool from CS+ to terminate communication.
(15) Save the project file
Save the setting information of the project to the project file.
Remark
For details on "Save the project file", see "CS+ Integrated Development Environment User's Manual: Project Operation".
R20UT3456EJ0100 Rev.1.00
Aug 01, 2015
Page 11 of 281
CS+ V3.02.00
2. FUNCTIONS
2.2 Preparation before Debugging
This section describes the preparation to start debugging the created program.
2.2.1 Confirm the connection to a host machine
Connection examples for each debug tool are shown.
2.2.1.1
2.2.1.2
2.2.1.3
2.2.1.4
[Full-spec emulator]
[E1]
[E20]
[Simulator]
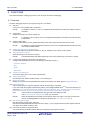
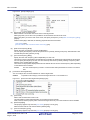
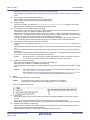
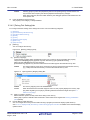
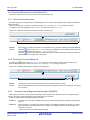
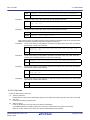
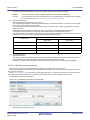
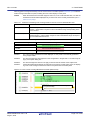
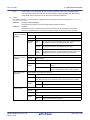
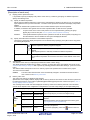
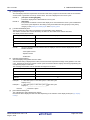
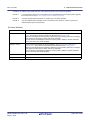
2.2.1.1 [Full-spec emulator]
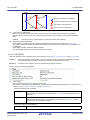
Connect a host machine and Full-spec emulator. If required, connect a target board, too.
For details on the connection method, see the user's manual for Full-spec emulator.
Figure 2.1
Connection Example [Full-spec emulator]
Pod
USB interface cable
Target board
Host machine
CS+
Full-spec emulator
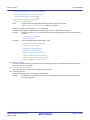
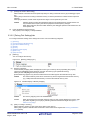
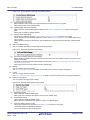
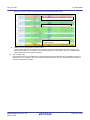
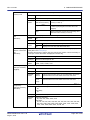
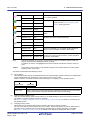
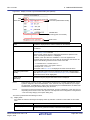
2.2.1.2 [E1]
Connect a host machine and E1. If required, connect a target board, too.
For details on the connection method, see the user's manual for E1.
Figure 2.2
Connection Example [E1]
Dedicated probe
USB interface cable
E1
Host machine
CS+
Target board
Caution 1.
Only the Low Pin Debug interface (hereafter referred to as LPD communications) is supported for communication with the target board.
Caution 2.
For details on the connection using a debug MCU board, see the user's manual for debug MCU board.
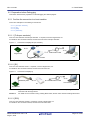
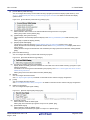
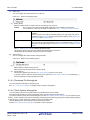
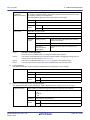
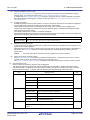
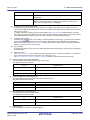
2.2.1.3 [E20]
Connect a host machine and E20. If required, connect a target board, too.
For details on the connection method, see the user's manual for E20.
R20UT3456EJ0100 Rev.1.00
Aug 01, 2015
Page 12 of 281
CS+ V3.02.00
Figure 2.3
2. FUNCTIONS
Connection Example [E20]
Dedicated probe
USB interface cable
E20
Host machine
CS+
Target board
Caution 1.
Only the Low Pin Debug interface (hereafter referred to as LPD communications) is supported for communication with the target board.
Caution 2.
For details on the connection using a debug MCU board, see the user's manual for debug MCU board.
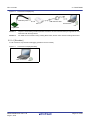
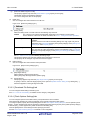
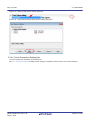
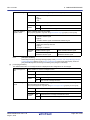
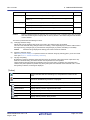
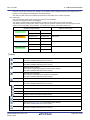
2.2.1.4 [Simulator]
A host machine is only needed for debugging (emulators are not needed).
Figure 2.4
Connection Example [Simulator]
Host machine
CS+
R20UT3456EJ0100 Rev.1.00
Aug 01, 2015
Page 13 of 281
CS+ V3.02.00
2. FUNCTIONS
2.3 Configuration of Operating Environment of the Debug Tool
This section describes the configuration of the operating environment for each debug tool.
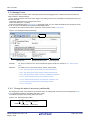
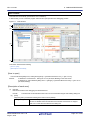
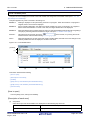
2.3.1 Select the debug tool to use
You can configure the operating environment in the Property panel corresponding to the debug tool to use.
Therefore, first, select the debug tool to be used in a project (the debug tool to be used can be specified in the individual
main projects/subprojects).
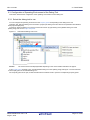
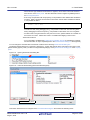
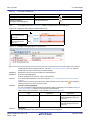
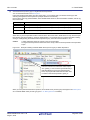
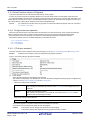
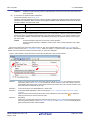
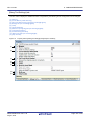
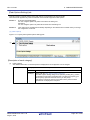
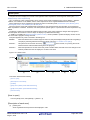
To select or switch the debug tool, use the context menu shown by right clicking on the [RH850 Debug tool name
(Debug Tool)] node on the Project Tree panel.
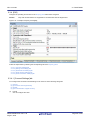
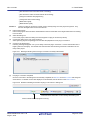
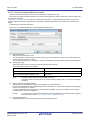
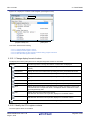
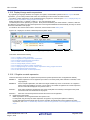
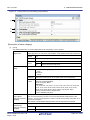
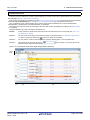
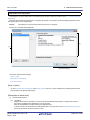
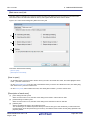
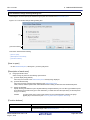
Figure 2.5
Caution
Select/Switch Debug Tool to Use
The context menu items displayed differ depending on the microcontroller selected in the project.
If the Property panel is already open, click the [RH850 Debug tool name (Debug Tool)] node again. The view switches
to the Property panel of the selected debug tool.
If the Property panel is not open, double-click the above mentioned node to open the corresponding Property panel.
R20UT3456EJ0100 Rev.1.00
Aug 01, 2015
Page 14 of 281
CS+ V3.02.00
2. FUNCTIONS
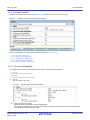
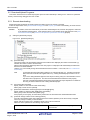
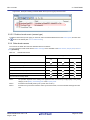
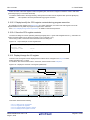
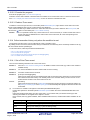
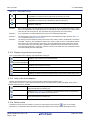
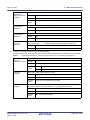
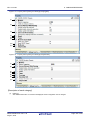
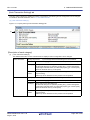
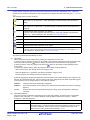
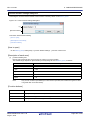
2.3.2 [Full-spec emulator]
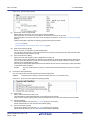
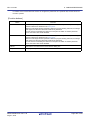
Configure the operating environment on the Property panel below when using Full-spec emulator.
Figure 2.6
Example of Property Panel [Full-spec emulator]
Follow the steps below by selecting the corresponding tab on the Property panel.
2.3.2.1
2.3.2.2
2.3.2.3
2.3.2.4
2.3.2.5
[Connect Settings] tab
[Debug Tool Settings] tab
[Download File Settings] tab
[Flash Options Settings] tab
[Hook Transaction Settings] tab
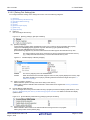
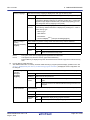
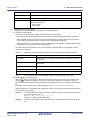
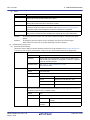
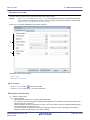
2.3.2.1 [Connect Settings] tab
You configure the connection with the debug tool for each one of the following categories.
(1)
(2)
(3)
(4)
(1)
[Clock]
[Connection with Target Board]
[Flash]
[CPU virtualization support function]
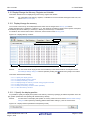
[Clock]
You can configure the clock.
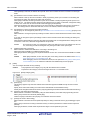
Figure 2.7
(a)
[Clock] Category [Full-spec emulator]
[Main clock frequency [MHz]]
Specify the main clock frequency (before multiplication).
You can specify the frequency from the drop-down list or by directly entering a frequency value between 0.001
and 999.999 (unit: MHz) (default: [10.00]).
R20UT3456EJ0100 Rev.1.00
Aug 01, 2015
Page 15 of 281
CS+ V3.02.00
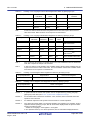
(b)
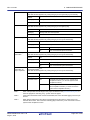
[CPU clock frequency [MHz]]
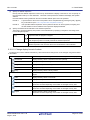
Specify the CPU clock frequency (after multiplication) for each core.
The names of cores incorporated in the selected microcontroller are displayed as subproperties of this property.
You can specify the frequency for each core from the drop-down list or by directly entering a frequency value
between 0.001 and 999.999 (unit: MHz).
The number of subproperties displayed here and the default value of the CPU clock frequency differ depending
on the selected microcontroller.
Remark
(2)
2. FUNCTIONS
The CPU clock frequency is used to convert the time stamp information for a trace to an actual
time.
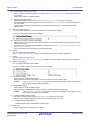
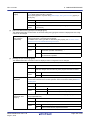
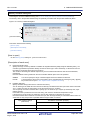
[Connection with Target Board]
You can configure the connection between Full-spec emulator and the target board.
Caution
Figure 2.8
Properties in this category cannot be changed when CS+ is connected to Full-spec emulator.
[Connection with Target Board] Category [Full-spec emulator]
(a)
[Connecting with target board]
Select whether the target board is connected to Full-spec emulator or not.
Select [Yes] when the target board is connected to Full-spec emulator (default: [No]).
(b)
[Initialize RAM when connecting]
Select whether to initialize the RAM when connecting to the debug tool.
Select [No] when the RAM is not initialized (default: [Yes]).
When [No] is selected, debugging can be performed when an ECC error occurs because the RAM is not initialized.
Caution
(3)
When [No] is selected, an ECC error may also occur during access to the RAM from the Memory
panel, Watch panel, Local Variables panel, etc.
When debugging an ECC error that has occurred, do not open the Memory panel, Watch panel,
Local Variables panel, etc. before the RAM has been initialized by the user program.
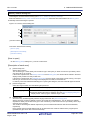
[Flash]
You can configure the flash self programming function.
Note that this category appears only when the selected microcontroller supports the flash self programming function.
Caution
Figure 2.9
Properties in this category cannot be changed when CS+ is connected to Full-spec emulator.
[Flash] Category
(a)
[Using the code flash self programming]
Select whether to rewrite the code flash by using the flash self library of the flash self programming function.
Select [Yes] to rewrite the code flash (default: [No]).
Note that if [Yes] is selected in this property, the code flash will not be cashed.
(b)
[Change the clock to flash writing]
Select whether to increase the clock speed temporarily for writing to the flash memory by the debugger operation.
Select [Yes] to overclock for writing to the flash memory so that the performance of flash rewrite is improved
(default).
When [No] is selected, a flash rewrite is performed using the clock speed set by the user.
Caution
(4)
Selecting [Yes] may affect the peripheral system that is operating during a break because not
only the CPU clock frequency but also the peripheral clock frequency changes.
When [No] is selected, the time of flash rewrite by the debugger operation will increase if the set
clock speed is low.
[CPU virtualization support function]
The property in this category is always disabled.
R20UT3456EJ0100 Rev.1.00
Aug 01, 2015
Page 16 of 281
CS+ V3.02.00
2. FUNCTIONS
2.3.2.2 [Debug Tool Settings] tab
You configure the basic settings of the debug tool for each one of the following categories.
(1)
(2)
(3)
(4)
(5)
(6)
(7)
(8)
(1)
[Memory]
[Access Memory While Running]
[Set Event While Running]
[Break]
[Trace]
[Mask for Input Signal]
[Multi core]
[Step function]
[Memory]
You can configure the memory.
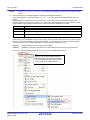
Figure 2.10 [Memory] Category [Full-spec emulator]
(a)
[Memory mappings]
Current memory mapping status is displayed for each type of memory area by expanding this property.
The [Access width[bits]] property appears only when the memory type is [External Memory].
Select [Access width[bits]] from the drop-down list.
[External Memory] appears only when the selected microcontroller supports the external memory area.
Caution
Figure 2.11
(b)
(2)
The external memory area can be accessed only when a target board mounted with memory
(e.g., RAM) other than flash memory is used for the external memory area.
Detailed Display of Memory Mapping
Caution
The memory mapping cannot be added/deleted.
Remark
When the selected microcontroller supports multi-core, this property displays the memory mapping status regarding a core (PE) by switching selection between the target cores (see "2.7
Select a Core (PE)").
[Verify on writing to memory]
Select whether to perform a verify check when writing to the memory.
Select [Yes] to perform verification after download or when values are changed in the Memory panel/Watch
panel (default).
[Access Memory While Running]
You can configure the memory access while executing a program (the real-time display update function). See
"2.10.1.4 Display/modify the memory contents during program execution" for details on the real-time display
update function.
Figure 2.12 [Access Memory While Running] Category [Full-spec emulator]
(a)
[Access during the execution]
Select whether to allow access to the internal RAM area during execution of a program.
Select [Yes] to allow access (default: [No]).
R20UT3456EJ0100 Rev.1.00
Aug 01, 2015
Page 17 of 281
CS+ V3.02.00
2. FUNCTIONS
(b)
[Update display during the execution]
Select whether to automatically update the contents in the Memory panel/Watch panel display during execution
of a program.
Select [Yes] to update the display (default).
(c)
[Display update interval[ms]]
This property appears only when the [Update display during the execution] property is set to [Yes].
Specify the interval to automatically update the contents in the Memory panel/Watch panel display during execution of a program.
Directly specify the Integer number between 100 and 65500 (rounding up the fractions less than 100ms)
(default: [500]).
(3)
[Set Event While Running]
You can configure the setting of events while executing a program in this category.
Figure 2.13 [Set Event While Running] Category
(a)
[Set event by stopping execution momentarily]
Select whether to forcibly pause the execution for events that cannot be set while executing a program or operating the tracer/timer.
For details on the event types that are affected by this property, see "2.16.6.2 Event types that can be set and
deleted during execution".
Select [Yes] to set events above while execution (default: [No]).
(4)
[Break]
You can configure the break function.
See "2.9 Stop Programs (Break)" for details on the break function and this category configuration.
(5)
[Trace]
You can configure the trace function.
See "2.12 Collect Execution History of Programs" for details on the trace function and this category configuration.
(6)
[Mask for Input Signal]
You can configure the input signal masking.
Figure 2.14 [Mask for Input Signal] Category [Full-spec emulator]
(a)
[Mask WAIT signal]
Select whether to mask the WAIT signal.
Select [Yes] so that the WAIT pin signal is not input to Full-spec emulator (default: [No]).
Caution
(b)
[Mask RESET signal]
Select whether to mask the RESET signal.
Select [Yes] so that the RESET pin signal is not input to Full-spec emulator (default: [No]).
Caution
(c)
If the [Connecting with target board] property in the [Connect Setting] tab is set to [No], this property is fixed to [Yes] (changes not allowed).
If the [Connecting with target board] property in the [Connect Setting] tab is set to [No], this property is fixed to [Yes] (changes not allowed).
[Select the RESET signal to mask]
This property appears only when the [Mask RESET signal] property is set to [Yes].
Select the type of RESET signal to be masked, from the following drop-down list.
- TARGET RESET signal (default)
- TARGET RESET signal and INTERNAL RESET signal
(7)
[Multi core]
You can configure the control method of a multi-core.
R20UT3456EJ0100 Rev.1.00
Aug 01, 2015
Page 18 of 281
CS+ V3.02.00
2. FUNCTIONS
Figure 2.15 [Multi core] Category [Full-spec emulator]
(a)
[Debug mode]
Select the debug mode of a multi-core from the following drop-down list.
Caution
The cores that can collect trace data differ depending on the selection of this property.
For the selection of the cores to collect trace data, see "2.12.1 Configure the trace operation".
Sync debug mode
Synchronizes execution and stop of all cores mounted in the microcontroller
(default).
For the cores that can collect trace data, [Debug core only] or [All core] can be
selected by the [Trace target] property in the [Trace] category on the [Debug Tool
Settings] tab of the Property panel.
Async debug mode
Controls execution and stop of only the core that is selected to be debugged.
The core that can collect trace data is only the core selected by the [Trace target]
property in the [Trace] category on the [Debug Tool Settings] tab of the Property
panel.
See "2.7 Select a Core (PE)" for selecting the debug target.
This property appears only when the selected microcontroller is a multi-core.
This property can be changed only while all cores are stopped.
(8)
[Step function]
You can configure the control method of step execution.
Figure 2.16 [Step function] Category [Full-spec emulator]
(a)
[Skip target section]
Select whether to skip the target section.
Select [Yes] to skip the target section (default: [No]).
(b)
[Target section]
This property appears only when the [Skip target section] property is set to [Yes].
To specify a section, select the target property, then open the Specified Section dialog box by clicking the [...]
button that appears on the right edge of the field.
2.3.2.3 [Download File Settings] tab
You can configure downloading to the debug tool.
See "2.5.1 Execute downloading" for details on each category configuration.
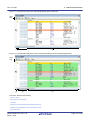
2.3.2.4 [Flash Options Settings] tab
You can configure options for the flash memory incorporated in the microcontroller.
Note that this tab appears only when the selected microcontroller supports the flash options.
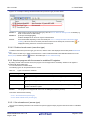
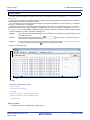
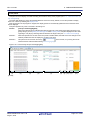
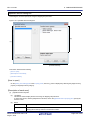
To configure options, specify the corresponding items on the Flash Options Setting dialog box, that is opened by clicking
the [...] button appears at the right of the field by selecting the [Flash options] property in the [Flash Options] category on
this tab (the [...] button appears only while connected to the debug tool).
Click the [Write] button on this dialog box after specifying each item.
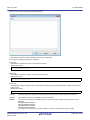
See the Flash Options Setting dialog box for details on the configuration.
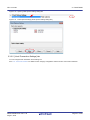
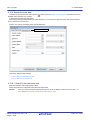
Figure 2.17 Opening Flash Options Setting Dialog Box
R20UT3456EJ0100 Rev.1.00
Aug 01, 2015
Page 19 of 281
CS+ V3.02.00
2. FUNCTIONS
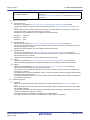
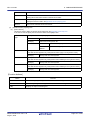
Figure 2.18 Flash Options Settings (Flash Options Setting Dialog Box)
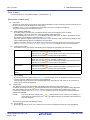
2.3.2.5 [Hook Transaction Settings] tab
You can configure hook transaction for the debug tool.
See "2.17 Use Hook Function" for details on each category configuration and the function of the hook transaction.
R20UT3456EJ0100 Rev.1.00
Aug 01, 2015
Page 20 of 281
CS+ V3.02.00
2. FUNCTIONS
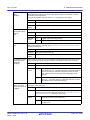
2.3.3 [E1]
Configure the operating environment on the Property panel below when using E1.
Caution
Only LPD communications are supported for communication with the target board.
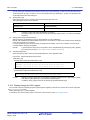
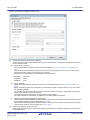
Figure 2.19 Example of Property Panel [E1]
Follow the steps below by selecting the corresponding tab on the Property panel.
2.3.3.1
2.3.3.2
2.3.3.3
2.3.3.4
2.3.3.5
[Connect Settings] tab
[Debug Tool Settings] tab
[Download File Settings] tab
[Flash Options Settings] tab
[Hook Transaction Settings] tab
2.3.3.1 [Connect Settings] tab
You configure the connection with the debug tool for each one of the following categories.
(1)
(2)
(3)
(4)
(1)
[Clock]
[Connection with Target Board]
[Flash]
[CPU virtualization support function]
[Clock]
You can configure the clock.
R20UT3456EJ0100 Rev.1.00
Aug 01, 2015
Page 21 of 281
CS+ V3.02.00
2. FUNCTIONS
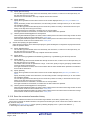
Figure 2.20 [Clock] Category [E1]
(a)
[Mount main clock on target board]
Select whether to mount the main clock circuit on the target board.
Select [No] when you use the on-chip oscillation circuit instead of the main clock circuit.
Select [Yes] when you use the main clock circuit, and specify its frequency in the [Main clock frequency [MHz]]
property.
Note that when [No] is selected, the following properties become fixed values.
[LPD mode]: [4pin]
[Set OPJTAG in LPD connection before connecting]: [No]
(b)
[Main clock frequency [MHz]]
Specify the main clock frequency (before multiplication).
You can specify the frequency from the drop-down list or by directly entering a frequency value between 0.001
and 999.999 (unit: MHz) (default: [10.00]).
(c)
[CPU clock frequency [MHz]]
Specify the CPU clock frequency (after multiplication) for each core.
The names of cores incorporated in the selected microcontroller are displayed as subproperties of this property.
You can specify the frequency for each core from the drop-down list or by directly entering a frequency value
between 0.001 and 999.999 (unit: MHz).
The number of subproperties displayed here and the default value of the CPU clock frequency differ depending
on the selected microcontroller.
Remark
(2)
The CPU clock frequency is used to convert the time stamp information for a trace to an actual
time.
[Connection with Target Board]
You can configure the connection between E1 and the target board.
Caution
Properties in this category cannot be changed when CS+ is connected to E1.
Figure 2.21 [Connection with Target Board] Category [E1]
(a)
[LPD mode]
Select LPD communication mode to use.
The selectable pin values differ depending on the selected microcontroller.
Note, however, that this property value cannot be changed when only one communication mode is available.
(b)
[Baud rate [Kbps]]
This property appears only when the [LPD mode] property is set to [1pin].
Select the baud rate for LPD communication (default: [500]).
(c)
[LPD clock frequency [kHz]]
This property appears only when the [LPD mode] property is set to [4pin].
R20UT3456EJ0100 Rev.1.00
Aug 01, 2015
Page 22 of 281
CS+ V3.02.00
2. FUNCTIONS
Select the clock frequency for the LPD communication (default: [Default]).
When [Default] is selected, the default value specific to the microcontroller is used in connection to the target
board.
(d)
[Power target from the emulator (MAX 200mA)]
Specify whether power is supplied from E1 to the target system.
Select [Yes] to supply power to the target board (default: [No]).
(e)
[Supply voltage]
This property appears only when the [Power target from the emulator (MAX 200mA)] property is set to [Yes].
Select the power voltage supplied to the target board (default: [3.3V]).
(f)
[Set OPJTAG in LPD connection before connecting]
Select whether to start up the microcontroller in serial programming mode upon connection to the debug tool
and change the option byte settings to select LPD connection.
When [Yes] is selected, the debug tool starts up the microcontroller in serial programming mode upon its connection to CS+. The debug tool then checks the OPJTAG byte and, if LPD is not selected, changes the setting
to select LPD. After that, the microcontroller enters debugging mode (default).
When [No] is selected, the debug tool starts up the microcontroller in debugging mode upon its connection to
CS+. The debug tool then checks OPJTAG and, if LPD is not selected, shows a message dialog box.
(g)
[Set OPJTAG in JTAG connection before disconnecting]
This property can be changed only when the [Set OPJTAG in LPD connection before connecting] property is set
to [Yes].
Select whether to change the option byte settings to select JTAG connection before disconnection of the debug
tool.
If you wish to change the option byte settings to select JTAG connection before disconnecting the debug tool,
select [Yes].
When [No] (the default setting) is selected, the option byte settings are not changed before the debug tool is disconnected. In this case, LPD mode is applicable as the pin mode.
Remark
(h)
[Initialize RAM when connecting]
Select whether to initialize the RAM when connecting to the debug tool.
Select [No] when the RAM is not initialized (default: [Yes]).
When [No] is selected, debugging can be performed when an ECC error occurs because the RAM is not initialized.
Caution
(3)
On connection to E1, CS+ changes the option byte settings if LPD is not selected. For this reason, connecting and disconnecting E1 may change the value of the option bytes.
When [No] is selected, an ECC error may also occur during access to the RAM from the Memory
panel, Watch panel, Local Variables panel, etc.
When debugging an ECC error that has occurred, do not open the Memory panel, Watch panel,
Local Variables panel, etc. before the RAM has been initialized by the user program.
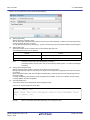
[Flash]
You can configure the flash memory rewriting.
Caution
The properties in this category may vary with the selected microcontroller.
Properties in this category cannot be changed when CS+ is connected to E1.
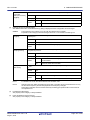
Figure 2.22 [Flash] Category [E1]
(a)
[Security ID]
This property appears only when the selected microcontroller supports the ROM security function for flash
memory.
Specify the ID code when reading the code from the internal ROM or internal flash memory.
Directly enter 32 digits hexadecimal number (16 bytes) (default: [FFFFFFFFFFFFFFFFFFFFFFFFFFFFFFFF]).
(b)
[Using the code flash self programming]
Select whether to rewrite the code flash by using the flash self library of the flash self programming function.
Select [Yes] to rewrite the code flash (default: [No]).
Note that if [Yes] is selected in this property, the code flash will not be cashed.
R20UT3456EJ0100 Rev.1.00
Aug 01, 2015
Page 23 of 281
CS+ V3.02.00
(c)
[Change the clock to flash writing]
Select whether to increase the clock speed temporarily for writing to the flash memory by the debugger operation.
Select [Yes] to overclock for writing to the flash memory so that the performance of flash rewrite is improved
(default).
When [No] is selected, a flash rewrite is performed using the clock speed set by the user.
Caution
(4)
2. FUNCTIONS
Selecting [Yes] may affect the peripheral system that is operating during a break because not
only the CPU clock frequency but also the peripheral clock frequency changes.
When [No] is selected, the time of flash rewrite by the debugger operation will increase if the set
clock speed is low.
[CPU virtualization support function]
The property in this category is always disabled.
2.3.3.2 [Debug Tool Settings] tab
You configure the basic settings of the debug tool for each one of the following categories.
(1)
(2)
(3)
(4)
(5)
(6)
(7)
(8)
(1)
[Memory]
[Access Memory While Running]
[Set Event While Running]
[Break]
[Trace]
[Mask for Input Signal]
[Multi core]
[Step function]
[Memory]
You can configure the memory.
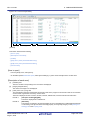
Figure 2.23 [Memory] Category [E1]
(a)
[Memory mappings]
Current memory mapping status is displayed for each type of memory area by expanding this property.
The [Access width[bits]] property appears only when the memory type is [External Memory].
Select [Access width[bits]] from the drop-down list.
[External Memory] appears only when the selected microcontroller supports the external memory area.
Caution
The external memory area can be accessed only when a target board mounted with memory
(e.g., RAM) other than flash memory is used for the external memory area.
Figure 2.24 Detailed Display of Memory Mapping
(b)
Caution
The memory mapping cannot be added/deleted.
Remark
When the selected microcontroller supports multi-core, this property displays the memory mapping status regarding a core (PE) by switching selection between the target cores (see "2.7
Select a Core (PE)").
[Verify on writing to memory]
Select whether to perform a verify check when writing to the memory.
Select [Yes] to perform verification after download or when values are changed in the Memory panel/Watch
panel (default).
R20UT3456EJ0100 Rev.1.00
Aug 01, 2015
Page 24 of 281
CS+ V3.02.00
(2)
2. FUNCTIONS
[Access Memory While Running]
You can configure the memory access while executing a program (the real-time display update function). See
"2.10.1.4 Display/modify the memory contents during program execution" for details on the real-time display
update function.
Figure 2.25 [Access Memory While Running] Category [E1]
(a)
[Access during the execution]
Select whether to allow access to the internal RAM area during execution of a program.
Select [Yes] to allow access (default: [No]).
(b)
[Update display during the execution]
Select whether to automatically update the display in the Memory panel/Watch panel while executing a program.
Select [Yes] to update the display (default).
(c)
[Display update interval[ms]]
This property is valid only when the [Update display during the execution] property is set to [Yes].
Specify the interval to automatically update the contents in the Memory panel/Watch panel display while executing a program.
Directly enter the Integer number between 100 and 65500 (rounding up the fractions less than 100ms) (default:
[500]).
(3)
[Set Event While Running]
You can configure the setting of events while executing a program.
Figure 2.26 [Set Event While Running] Category
(a)
[Set event by stopping execution momentarily]
Specify whether to forcibly pause the execution for events that cannot be set while executing a program or operating the tracer/timer.
For details on the event types that are affected by this property, see "2.16.6.2 Event types that can be set and
deleted during execution".
Select [Yes] to set events above while execution (default: [No]).
(4)
[Break]
You can configure the break function.
See "2.9 Stop Programs (Break)" for details on the break function and this category configuration.
(5)
[Trace]
You can configure the trace function.
See "2.12 Collect Execution History of Programs" for details on the trace function and this category configuration.
(6)
[Mask for Input Signal]
You can configure the input signal masking.
Figure 2.27 [Mask for Input Signal] Category [E1]
(a)
[Mask WAIT signal]
Select whether to mask the WAIT signal.
Select [Yes] so that the WAIT pin signal is not input to E1 (default: [No]).
(b)
[Mask RESET signal]
Select whether to mask the RESET signal.
Select [Yes] so that the RESET pin signal is not input to E1 (default: [No]).
R20UT3456EJ0100 Rev.1.00
Aug 01, 2015
Page 25 of 281
CS+ V3.02.00
(c)
(7)
2. FUNCTIONS
[Select the RESET signal to mask]
This property appears only when the [Mask RESET signal] property is set to [Yes].
The RESET signal to be masked is displayed.
You cannot change the value of this property.
[Multi core]
You can configure the control method of a multi-core.
Figure 2.28 [Multi core] Category [E1]
(a)
[Debug mode]
Select the debug mode of a multi-core from the following drop-down list.
Caution
The cores that can collect trace data differ depending on the selection of this property.
For the selection of the cores to collect trace data, see "2.12.1 Configure the trace operation".
Sync debug mode
Synchronizes execution and stop of all cores mounted in the microcontroller
(default).
For the cores that can collect trace data, [Debug core only] or [All core] can be
selected by the [Trace target] property in the [Trace] category on the [Debug Tool
Settings] tab of the Property panel.
Async debug mode
Controls execution and stop of only the core that is selected to be debugged.
The core that can collect trace data is only the core selected by the [Trace target]
property in the [Trace] category on the [Debug Tool Settings] tab of the Property
panel.
See "2.7 Select a Core (PE)" for selecting the debug target.
This property appears only when the selected microcontroller is a multi-core.
This property can be changed only while all cores are stopped.
(8)
[Step function]
You can configure the control method of step execution.
Figure 2.29 [Step function] Category [E1]
(a)
[Skip target section]
Select whether to skip the target section.
Select [Yes] to skip the target section (default: [No]).
(b)
[Target section]
This property appears only when the [Skip target section] property is set to [Yes].
To specify a section, select the target property, then open the Specified Section dialog box by clicking the [...]
button that appears on the right edge of the field.
2.3.3.3 [Download File Settings] tab
You can configure downloading to the debug tool.
See "2.5.1 Execute downloading" for details on each category configuration.
2.3.3.4 [Flash Options Settings] tab
You can configure options for the flash memory incorporated in the microcontroller.
Note that this tab appears only when the selected microcontroller supports the flash options.
To configure options, specify the corresponding items via the Flash Options Setting dialog box, that is opened by clicking the [...] button appears at the right of the field by selecting the [Flash options] property in the [Flash Options] category
on this tab (the [...] button appears only while connected to the debug tool).
Click the [Write] button on this dialog box after specifying each item.
See the Flash Options Setting dialog box for details on the configuration.
R20UT3456EJ0100 Rev.1.00
Aug 01, 2015
Page 26 of 281
CS+ V3.02.00
2. FUNCTIONS
Figure 2.30 Opening Flash Options Setting Dialog Box
Figure 2.31 Flash Options Settings (Flash Options Setting Dialog Box)
2.3.3.5 [Hook Transaction Settings] tab
You can configure hook transaction for the debug tool.
See "2.17 Use Hook Function" for details on each category configuration and the function of the hook transaction.
R20UT3456EJ0100 Rev.1.00
Aug 01, 2015
Page 27 of 281
CS+ V3.02.00
2. FUNCTIONS
2.3.4 [E20]
Configure the operating environment on the Property panel below when using E20.
Caution
Only LPD communications are supported for communication with the target board.
Figure 2.32 Example of Property Panel [E20]
Follow the steps below by selecting the corresponding tab on the Property panel.
2.3.4.1
2.3.4.2
2.3.4.3
2.3.4.4
2.3.4.5
[Connect Settings] tab
[Debug Tool Settings] tab
[Download File Settings] tab
[Flash Options Settings] tab
[Hook Transaction Settings] tab
2.3.4.1 [Connect Settings] tab
You configure the connection with the debug tool for each one of the following categories.
(1)
(2)
(3)
(4)
(1)
[Clock]
[Connection with Target Board]
[Flash]
[CPU virtualization support function]
[Clock]
You can configure the clock.
R20UT3456EJ0100 Rev.1.00
Aug 01, 2015
Page 28 of 281
CS+ V3.02.00
2. FUNCTIONS
Figure 2.33 [Clock] Category [E20]
(a)
[Mount main clock on target board]
Select whether to mount the main clock circuit on the target board.
Select [No] when you use the on-chip oscillation circuit instead of the main clock circuit.
Select [Yes] when you use the main clock circuit, and specify its frequency in the [Main clock frequency [MHz]]
property.
Note that when [No] is selected, the following properties become fixed values.
[LPD mode]: [4pin]
[Set OPJTAG in LPD connection before connecting]: [No]
(b)
[Main clock frequency [MHz]]
Specify the main clock frequency (before multiplication).
You can specify the frequency from the drop-down list or by directly entering a frequency value between 0.001
and 999.999 (unit: MHz) (default: [10.00]).
(c)
[CPU clock frequency [MHz]]
Specify the CPU clock frequency (after multiplication) for each core.
The names of cores incorporated in the selected microcontroller are displayed as subproperties of this property.
You can specify the frequency for each core from the drop-down list or by directly entering a frequency value
between 0.001 and 999.999 (unit: MHz).
The number of subproperties displayed here and the default value of the CPU clock frequency differ depending
on the selected microcontroller.
Remark
(2)
The CPU clock frequency is used to convert the time stamp information for a trace to an actual
time.
[Connection with Target Board]
You can configure the connection between E20 and the target board.
Caution
Properties in this category cannot be changed when CS+ is connected to E20.
Figure 2.34 [Connection with Target Board] Category [E20]
(a)
[LPD mode]
Select LPD communication mode to use.
The selectable pin values differ depending on the selected microcontroller.
Note, however, that this property value cannot be changed when only one communication mode is available.
(b)
[Baud rate [Kbps]]
This property appears only when the [LPD mode] property is set to [1pin].
Specify the baud rate for LPD communication (default: [500]).
(c)
[LPD clock frequency [kHz]]
This property appears only when the [LPD mode] property is set to [4pin].
Specify the clock frequency for the LPD communication (default: [Default]).
R20UT3456EJ0100 Rev.1.00
Aug 01, 2015
Page 29 of 281
CS+ V3.02.00
2. FUNCTIONS
When [Default] is selected, the default value specific to the microcontroller is used in connection to the target
board.
(d)
[Set OPJTAG in LPD connection before connecting]
Select whether to start up the microcontroller in serial programming mode upon connection to the debug tool
and change the option byte settings to select LPD connection.
When [Yes] is selected, the debug tool starts up the microcontroller in serial programming mode upon its connection to CS+. The debug tool then checks the OPJTAG byte and, if LPD is not selected, changes the setting
to select LPD. After that, the microcontroller enters debugging mode (default).
When [No] is selected, the debug tool starts up the microcontroller in debugging mode upon its connection to
CS+. The debug tool then checks OPJTAG and, if LPD is not selected, shows a message dialog box.
(e)
[Set OPJTAG in JTAG connection before disconnecting]
This property can be changed only when the [Set OPJTAG in LPD connection before connecting] property is set
to [Yes].
Select whether to change the option byte settings to select JTAG connection before disconnection of the debug
tool.
If you wish to change the option byte settings to select JTAG connection before disconnecting the debug tool,
select [Yes].
When [No] (the default setting) is selected, the option byte settings are not changed before the debug tool is disconnected. In this case, LPD mode is applicable as the pin mode.
Remark
(f)
[Initialize RAM when connecting]
Select whether to initialize the RAM when connecting to the debug tool.
Select [No] when the RAM is not initialized (default: [Yes]).
When [No] is selected, debugging can be performed when an ECC error occurs because the RAM is not initialized.
Caution
(3)
On connection to E20, CS+ changes the option byte settings if LPD is not selected. For this reason, connecting and disconnecting E20 may change the value of the option bytes.
When [No] is selected, an ECC error may also occur during access to the RAM from the Memory
panel, Watch panel, Local Variables panel, etc.
When debugging an ECC error that has occurred, do not open the Memory panel, Watch panel,
Local Variables panel, etc. before the RAM has been initialized by the user program.
[Flash]
You can configure the flash memory rewriting.
Caution
The properties in this category may vary with the selected microcontroller.
Properties in this category cannot be changed when CS+ is connected to E20.
Figure 2.35 [Flash] Category [E20]
(a)
[Security ID]
This property appears only when the selected microcontroller supports the ROM security function for flash
memory.
Specify the ID code when reading the code from the internal ROM or internal flash memory.
Directly enter 32 digits hexadecimal number (16 bytes) (default: [FFFFFFFFFFFFFFFFFFFFFFFFFFFFFFFF]).
(b)
[Using the code flash self programming]
Select whether to rewrite the code flash by using the flash self library of the flash self programming function.
Select [Yes] to rewrite the code flash (default: [No]).
Note that if [Yes] is selected in this property, the code flash will not be cashed.
(c)
[Change the clock to flash writing]
Select whether to increase the clock speed temporarily for writing to the flash memory by the debugger operation.
Select [Yes] to overclock for writing to the flash memory so that the performance of flash rewrite is improved
(default).
When [No] is selected, a flash rewrite is performed using the clock speed set by the user.
R20UT3456EJ0100 Rev.1.00
Aug 01, 2015
Page 30 of 281
CS+ V3.02.00
Caution
(4)
2. FUNCTIONS
Selecting [Yes] may affect the peripheral system that is operating during a break because not
only the CPU clock frequency but also the peripheral clock frequency changes.
When [No] is selected, the time of flash rewrite by the debugger operation will increase if the set
clock speed is low.
[CPU virtualization support function]
The property in this category is always disabled.
2.3.4.2 [Debug Tool Settings] tab
You configure the basic settings of the debug tool for each one of the following categories.
(1)
(2)
(3)
(4)
(5)
(6)
(7)
(8)
(1)
[Memory]
[Access Memory While Running]
[Set Event While Running]
[Break]
[Trace]
[Mask for Input Signal]
[Multi core]
[Step function]
[Memory]
You can configure the memory.
Figure 2.36 [Memory] Category [E20]
(a)
[Memory mappings]
Current memory mapping status is displayed for each type of memory area by expanding this property.
The [Access width[bits]] property appears only when the memory type is [External Memory].
Select [Access width[bits]] from the drop-down list.
[External Memory] appears only when the selected microcontroller supports the external memory area.
Caution
The external memory area can be accessed only when a target board mounted with memory
(e.g., RAM) other than flash memory is used for the external memory area.
Figure 2.37 Opening Memory Mapping Dialog Box
(b)
(2)
Caution
The memory mapping cannot be added/deleted.
Remark
When the selected microcontroller supports multi-core, this property displays the memory mapping status regarding a core (PE) by switching selection between the target cores (see "2.7
Select a Core (PE)").
[Verify on writing to memory]
Select whether to perform a verify check when writing to the memory.
Select [Yes] to perform verification after download or when values are changed in the Memory panel/Watch
panel (default).
[Access Memory While Running]
You can configure the memory access while executing a program (the real-time display update function).
See "2.10.1.4 Display/modify the memory contents during program execution" for details on the real-time display
update function.
R20UT3456EJ0100 Rev.1.00
Aug 01, 2015
Page 31 of 281
CS+ V3.02.00
2. FUNCTIONS
Figure 2.38 [Access Memory While Running] Category [E20]
(a)
[Access during the execution]
Select whether to allow access to the internal RAM area during execution of a program.
Select [Yes] to allow access (default: [No]).
(b)
[Update display during the execution]
Select whether to automatically update the display in the Memory panel/Watch panel while executing a program.
Select [Yes] to update the display (default).
(c)
[Display update interval[ms]]
This property is valid only when the [Update display during the execution] property is set to [Yes].
Specify the interval to automatically update the contents in the Memory panel/Watch panel display while executing a program.
Directly enter the Integer number between 100 and 65500 (rounding up the fractions less than 100ms) (default:
[500]).
(3)
[Set Event While Running]
You can configure the setting of events while executing a program.
Figure 2.39 [Set Event While Running] Category
(a)
[Set event by stopping execution momentarily]
Specify whether to forcibly pause the execution for events that cannot be set while executing a program or operating the tracer/timer.
For details on the event types that are affected by this property, see "2.16.6.2 Event types that can be set and
deleted during execution".
Select [Yes] to set events above while execution (default: [No]).
(4)
[Break]
You can configure the break function.
See "2.9 Stop Programs (Break)" for details on the break function and this category configuration.
(5)
[Trace]
You can configure the trace function.
See "2.12 Collect Execution History of Programs" for details on the trace function and this category configuration.
(6)
[Mask for Input Signal]
You can configure the input signal masking.
Figure 2.40 [Mask for Input Signal] Category [E20]
(a)
[Mask WAIT signal]
Select whether to mask the WAIT signal.
Select [Yes] so that the WAIT pin signal is not input to E1 (default: [No]).
(b)
[Mask RESET signal]
Select whether to mask the RESET signal.
Select [Yes] so that the RESET pin signal is not input to E1 (default: [No]).
(c)
[Select the RESET signal to mask]
This property appears only when the [Mask RESET signal] property is set to [Yes].
The RESET signal to be masked is displayed.
You cannot change the value of this property.
R20UT3456EJ0100 Rev.1.00
Aug 01, 2015
Page 32 of 281
CS+ V3.02.00
(7)
2. FUNCTIONS
[Multi core]
You can configure the control method of a multi-core.
Figure 2.41 [Multi core] Category [E20]
(a)
[Debug mode]
Select the debug mode of a multi-core from the following drop-down list.
Caution
The cores that can collect trace data differ depending on the selection of this property.
For the selection of the cores to collect trace data, see "2.12.1 Configure the trace operation".
Sync debug mode
Synchronizes execution and stop of all cores mounted in the microcontroller
(default).
For the cores that can collect trace data, [Debug core only] or [All core] can be
selected by the [Trace target] property in the [Trace] category on the [Debug Tool
Settings] tab of the Property panel.
Async debug mode
Controls execution and stop of only the core that is selected to be debugged.
The core that can collect trace data is only the core selected by the [Trace target]
property in the [Trace] category on the [Debug Tool Settings] tab of the Property
panel.
See "2.7 Select a Core (PE)" for selecting the debug target.
This property appears only when the selected microcontroller is a multi-core.
This property can be changed only while all cores are stopped.
(8)
[Step function]
You can configure the control method of step execution.
Figure 2.42 [Step function] Category [E20]
(a)
[Skip target section]
Select whether to skip the target section.
Select [Yes] to skip the target section (default: [No]).
(b)
[Target section]
This property appears only when the [Skip target section] property is set to [Yes].
To specify a section, select the target property, then open the Specified Section dialog box by clicking the [...]
button that appears on the right edge of the field.
2.3.4.3 [Download File Settings] tab
You can configure downloading to the debug tool.
See "2.5.1 Execute downloading" for details on each category configuration.
2.3.4.4 [Flash Options Settings] tab
You can configure options for the flash memory incorporated in the microcontroller.
Note that this tab appears only when the selected microcontroller supports the flash options.
To configure options, specify the corresponding items via the Flash Options Setting dialog box, that is opened by clicking the [...] button appears at the right of the field by selecting the [Flash options] property in the [Flash Options] category
on this tab (the [...] button appears only while connected to the debug tool).
Click the [Write] button on this dialog box after specifying each item.
See the Flash Options Setting dialog box for details on the configuration.
R20UT3456EJ0100 Rev.1.00
Aug 01, 2015
Page 33 of 281
CS+ V3.02.00
2. FUNCTIONS
Figure 2.43 Opening Flash Options Setting Dialog Box
Figure 2.44 Flash Options Settings (Flash Options Setting Dialog Box)
2.3.4.5 [Hook Transaction Settings] tab
You can configure hook transaction for the debug tool.
See "2.17 Use Hook Function" for details on each category configuration and the function of the hook transaction.
R20UT3456EJ0100 Rev.1.00
Aug 01, 2015
Page 34 of 281
CS+ V3.02.00
2. FUNCTIONS
2.3.5 [Simulator]
Configure the operating environment on the Property panel below when using Simulator.
Figure 2.45 Example of Property Panel [Simulator]
Follow the steps below by selecting the corresponding tab on the Property panel.
2.3.5.1
2.3.5.2
2.3.5.3
2.3.5.5
[Connect Settings] tab
[Debug Tool Settings] tab
[Download File Settings] tab
[Hook Transaction Settings] tab
2.3.5.1 [Connect Settings] tab
You configure the connection with the debug tool for each one of the following categories.
(1) [Clock]
(2) [Configuration]
(3) [CPU virtualization support function]
(1)
[Clock]
You can configure the clock.
Figure 2.46 [Clock] Category [Simulator]
(a)
[Main clock frequency [MHz]]
Specify the main clock frequency.
You can specify the frequency from the drop-down list or by directly entering a frequency value between 0.001
and 999.999 (unit: MHz) (default: [320.00]).
Caution
When the instruction simulator for RH850 is used, the CPU clock frequency will always be the
same as the value of the main clock frequency set in this property.
(b)
[Select Timer/Trace clock frequency]
The clock frequency for using timer/trace function is displayed.
You cannot change the value of this property.
(c)
[Unit of Timer/Trace clock frequency]
The unit of the clock frequency for using timer/trace function is displayed.
You cannot change the value of this property.
R20UT3456EJ0100 Rev.1.00
Aug 01, 2015
Page 35 of 281
CS+ V3.02.00
(d)
2. FUNCTIONS
[Timer/Trace clock frequency]
The value of the clock frequency for using timer/trace function is displayed.
Note, however, that "---_---" is displayed while disconnected from the debug tool.
You cannot change the value of this property.
(2)
[Configuration]
The property in this category is always disabled.
(3)
[CPU virtualization support function]
The property in this category is always disabled.
2.3.5.2 [Debug Tool Settings] tab
You configure the basic settings of the debug tool for each one of the following categories.
(1)
(2)
(3)
(4)
(5)
(6)
(7)
(1)
[Memory]
[Access Memory While Running]
[Trace]
[Timer]
[Coverage]
[Simulator GUI]
[Step function]
[Memory]
You can configure the memory.
Figure 2.47 [Memory] Category [Simulator]
(a)
[Memory mappings]
Current memory mapping status is displayed for each type of memory area.
Figure 2.48 Detailed Display of Memory Mapping
Note that you cannot change the mapping value on this panel. To add the memory mapping, select the [Memory mappings] property, then open the Memory Mapping dialog box by clicking the [...] button that appears on
the right edge of the field.
For details on how to configure it, see the section for the Memory Mapping dialog box.
Remark
(2)
When the selected microcontroller supports multi-core, this property displays the memory mapping status regarding a core (PE) by switching selection between the target cores (see "2.7
Select a Core (PE)").
[Access Memory While Running]
You can configure the memory access while executing a program (the real-time display update function). See
"2.10.1.4 Display/modify the memory contents during program execution" for details on the real-time display
update function.
Figure 2.49 [Access Memory While Running] Category [Simulator]
R20UT3456EJ0100 Rev.1.00
Aug 01, 2015
Page 36 of 281
CS+ V3.02.00
2. FUNCTIONS
(a)
[Update display during the execution]
Select whether to automatically update the display in the Memory panel/Watch panel during a program execution.
Select [Yes] to update the display (default).
(b)
[Display update interval[ms]]
This property is valid only when the [Update display during the execution] property is set to [Yes].
Specify the interval to automatically update the contents in the Memory panel/Watch panel display while executing a program.
Directly enter the Integer number between 100 and 65500 (rounding up the fractions less than 100ms) (default:
[500]).
(3)
[Trace]
You can configure the trace function.
See "2.12 Collect Execution History of Programs" for details on the trace function and this category configuration.
(4)
[Timer]
You can configure the timer function.
See "2.13 Measure Execution Time of Programs" for details on the timer function.
Figure 2.50 [Timer] Category
(a)
[Use timer function]
Select whether to use the timer function.
Select [Yes] to use the timer function (default: [No]).
(5)
[Coverage]
You can configure the coverage function.
See "2.14 Measure Coverage [Simulator]" for details on the coverage function and this category configuration.
(6)
[Simulator GUI]
You can configure the Simulator GUI function.
Caution
If a microcontroller whose Simulator does not support peripheral function simulations (instruction
simulation version) is selected, all properties in this category become invalid.
Figure 2.51 [Simulator GUI] Category
(a)
[Display Simulator GUI]
Select whether to display the Simulator GUI window.
Select [Yes] to use the Simulator GUI function (default).
When you do not need to use the Simulator GUI, select [No] to close the Simulator GUI window.
(b)
[Display Simulator GUI on top of other windows]
This property appears only when the [Display Simulator GUI] property is set to [Yes].
Select whether to display the Simulator GUI window in the forefront when program execution starts. Select [Yes]
to display it in the forefront (default).
(7)
[Step function]
You can configure the control method of step execution.
Figure 2.52 [Step function] Category [Simulator]
(a)
[Skip target section]
Select whether to skip the target section.
Select [Yes] to skip the target section (default: [No]).
(b)
[Target section]
This property appears only when the [Skip target section] property is set to [Yes].
R20UT3456EJ0100 Rev.1.00
Aug 01, 2015
Page 37 of 281
CS+ V3.02.00
2. FUNCTIONS
To specify a section, select the target property, then open the Specified Section dialog box by clicking the [...]
button that appears on the right edge of the field.
2.3.5.3 [Download File Settings] tab
You can configure downloading to the debug tool.
See "2.5.1 Execute downloading" for details on each category configuration.
2.3.5.4 [Flash Options Settings] tab
You can configure options for the flash memory incorporated in the microcontroller.
Note that this tab appears only when the selected microcontroller supports the flash options.
To configure options, specify the corresponding items via the Flash Options Setting dialog box, that is opened by clicking the [...] button appears at the right of the field by selecting the [Flash options] property in the [Flash Options] category
on this tab (the [...] button appears only while connected to the debug tool).
See the Flash Options Setting dialog box for details on the configuration.
Figure 2.53 Opening Flash Options Setting Dialog Box
Figure 2.54 Flash Options Settings (Flash Options Setting Dialog Box)
2.3.5.5 [Hook Transaction Settings] tab
You can configure hook transaction for the debug tool.
See "2.17 Use Hook Function" for details on each category configuration and the function of the hook transaction.
R20UT3456EJ0100 Rev.1.00
Aug 01, 2015
Page 38 of 281
CS+ V3.02.00
2. FUNCTIONS
2.4 Connect to/Disconnect from the Debug Tool
This section describes how to connect to/disconnect from the debug tool.
2.4.1 Connect to the debug tool
By selecting [Connect to Debug Tool] from the [Debug] menu, CS+ starts communicating with the debug tool selected in
the active project.
After succeeding in the connection to the debug tool, the Statusbar of the Main window changes as follows:
For details on each item displayed on the Statusbar, see the section of the Main window.
Figure 2.55 Statusbar Indicating Successful Connection to Debug Tool
The information of the debug tool appears at this area.
Caution
If the version of compiler being used is not supported by CS+, [Connect to Debug Tool] will be disabled.
Remark
When the
button on the Debug toolbar is clicked, the specified file is downloaded automatically after
connecting to the debug tool (see "2.5.1 Execute downloading").
When the
button on this toolbar is clicked, the project is built automatically, and then the built file is
downloaded after connecting to the debug tool.
2.4.2 Disconnect from the debug tool
By clicking the
button on the Debug toolbar, CS+ cuts off the communication with the connected debug tool.
After disconnecting from the debug tool, the Statusbar of the Main window changes as follows:
Figure 2.56 Statusbar Indicating Disconnection from Debug Tool
This area is left blank.
"DISCONNECT" is displayed.
Caution
The debug tool cannot be disconnected from CS+ while the program is running.
Remark
Disconnecting the debug tool will close all the panels and dialog boxes that can be displayed only during
the connection.
2.4.3
Connect to the debug tool using hot plug-in [E1][E20]
With hot plug-in function, you can connect the debug tool to the target board during execution of a program (without
having to turn off the system) and debug the program while it is in execution.
Follow the steps below to establish hot plug-in connection.
Caution 1.
The hot plug-in connection is enabled only when the selected microcontroller incorporates the hot plug-in
function.
Caution 2.
When a hot plug-in connection is made, the settings of the following properties are ignored (i.e. the program operates as if the specification for them is [No]). The settings of them become valid again after
reconnection with CS+.
- [Power target from the emulator (MAX 200mA)]
R20UT3456EJ0100 Rev.1.00
Aug 01, 2015
Page 39 of 281
CS+ V3.02.00
2. FUNCTIONS
- [Set OPJTAG in LPD connection before connecting]
- [Set OPJTAG in JTAG connection before disconnecting]
- [Using the code flash self programming
- [Change the clock to flash writing]
- [Mask WAIT signal]
- [Mask RESET signal]
Caution 3.
When a hot plug-in connection is made, events currently being set in the project are ignored. They
become valid again after reconnection with CS+.
(1)
Execute the program
Execute the program which has been downloaded onto the microcontroller on the target board without connecting
to the emulator.
(2)
Select the debug tool
In the active project, select the debug tool which supports hot plug-in connection (E1/E20).
(3)
Connect the debug tool to CS+ using hot plug-in
Select [Hot Plug-in] from the [Debug] menu to initiate the preparation for hot plug-in connection.
(4)
Connect to the target board
Following message will appear once you are ready to start hot plug-in connection. Connect the emulator to the
target system and click [OK]. This will start the communication with the debug tool which is selected in the currently active project.
Figure 2.57 Message Indicating that Hot Plug-in Connection Is Ready to Be Started
(5)
Hot plug-in connection completed
Once the connection to the debug tool is successfully completed, the Statusbar on the Main window will change as
shown below. For details on each item displayed on the statusbar, see the section of the "Main window".
Figure 2.58 Statusbar Indicating Successful Hot plug-in Connection to Debug Tool
This area shows information on the currently active debug tool.
"RUN" indicates that the program is running.
R20UT3456EJ0100 Rev.1.00
Aug 01, 2015
Page 40 of 281
CS+ V3.02.00
2. FUNCTIONS
2.5 Download/Upload Programs
This section describes how to download programs (such as load module files) to debug to CS+ and how to upload the
memory contents being debugged from CS+ to files.
2.5.1 Execute downloading
Download the load module file to be debugged to the debug tool that is currently connected.
Follow the steps below on the [Download File Settings] tab in the Property panel for the downloading, and then execute
the downloading.
Caution
(1)
By default, CPU reset automatically occurs after downloading the file, and then the program is executed
to the specified symbol position. If this operation above is not needed, specify [No] with both of the [CPU
Reset after download] and [Execute to the specified symbol after CPU Reset] property.
Setting the [Download] category
Figure 2.59 [Download] Category
(a)
[Download files]
The names of files to be downloaded and download conditions are displayed (the number enclosed with "[ ]"
indicates the number of files to be download).
Files that are specified as build target files in the main project or subprojects will automatically be selected as
the files to be downloadedNote.
However, you can manually change the download files and the condition. In this case, see "2.5.2 Advanced
downloading".
Note
To download the load module files created by an external build tool (e.g., compilers and assemblers other than the build tools supplied with CS+), a debug-dedicated project needs to be created.
If you use a debug-dedicated project as the subject to debug, add your a download file to Download files node on project tree. The file to be downloaded will be reflected in this property.
See "CS+ Integrated Development Environment User's Manual: Project Operation" for details on
the using an external build tool and a debug-dedicated project.
(b)
[CPU Reset after download]
Specify whether to reset the CPU after downloading.
Select [Yes] to reset the CPU (default).
(c)
[Erase flash ROM before download] [Full-spec emulator][E1][E20]
Specify whether to erase the flash ROM before downloading.
Select [Yes] to erase the flash ROM (default: [No]).
If this property is set to [Yes], an erase will be performed in the area where the downloaded data exists.
(d)
[Automatic change method of event setting position]
If the file is downloaded again during debugging then the location (address) set for the currently configured
event may change to midway in the instruction.
Specify with this property how to handle the target event in this circumstance.
Select one of the options from the following drop-down list.
Move to the head of instruction
R20UT3456EJ0100 Rev.1.00
Aug 01, 2015
Resets the subject event at the beginning address of
the instruction.
Page 41 of 281
CS+ V3.02.00
2. FUNCTIONS
Suspend event
Leaves the subject event pending (default).
Note, however, that this property setting only applies to the location setting of events without debugging information. The location setting of events with debug information is always moved to the beginning of the source
text line.
(2)
Setting the [Debug Information]
Figure 2.60 [Debug information] Category
(a)
[Execute to the specified symbol after CPU Reset]
Specify whether to execute the program to the specified symbol position after CPU reset or downloading (for
only when the [CPU Reset after download] property is set to [Yes]).
Select [Yes] to execute the program to the specified symbol position after CPU reset (default).
Remark
When the [CPU Reset after download] property is set to [Yes], the operation after downloading is
as follows:
- If [Yes] is selected for this property, the Editor panel will open automatically with displaying
source text of the position specified with the [Specified symbol] property after downloading.
- If [No] is selected for this property, the Editor panel will open with displaying source text of the
reset address (when if the source text has not been allocated to the reset address, the contents of the reset address is displayed in the Disassemble panel).
(b)
[Specified symbol]
This property appears only when the [Execute to the specified symbol after CPU Reset] property is set to [Yes].
Specify the position at which the program is stop after CPU reset.
Directly enter an address expression between 0 and "last address in address space" (default: [_main]).
Note, however, that the program will not be executed if the specified address expression cannot be converted
into an address.
Remark
(c)
[The upper limit size of the memory usage [Mbytes]]
Specify the upper limit on the amount of memory to be used in reading the debug information.
When the amount of memory being used exceeds the upper limit specified here, memory is made available by
discarding debug information that has been read until the amount of memory in use is reduced to half of this
upper limit (lowering the upper limit might improve the situation when shortages of memory are arising).
Directly enter a decimal number between 100 and 1000 (unit: Mbyte) (default: [500]).
Caution
(3)
In some cases, lowering the upper limit may lead to poorer responsiveness since it leads to more
frequent discarding and re-reading of debug information.
Executing a download
Click the
button on the Debug toolbar.
If this operation is performed while disconnecting from the debug tool, the application automatically connects to
the debug tool, and then performs the download.
Remark
(4)
Normally, specify the following.
For assembly source: Start label corresponding to main function
For C source: Symbol assigned to the start of the main function name
When a program that has been modified during debugging is re-downloaded, you can easily build
and download it by selecting [Build & Download] from the [Debug] menu on the Main window.
Canceling a download
To cancel a download, click the [Cancel] button on the Progress Status dialog box, which displays the progress of
downloading, or press the [Esc] key.
If the load module file is successfully downloaded, the Editor panel opens automatically, and the contents of the downloaded file's source text are displayed.
Remark
You can automatically overwrite the value of I/O register/CPU register with the specified values before
and after performing the download (see "2.17 Use Hook Function" for details).
R20UT3456EJ0100 Rev.1.00
Aug 01, 2015
Page 42 of 281
CS+ V3.02.00
2. FUNCTIONS
2.5.2 Advanced downloading
You can change the download files and the condition to download.
With CS+, the following file types can be downloaded.
Table 2.1
Downloadable File Formats
Downloadable File
Extension
File Format
Load module file
.abs
Load module file format
Intel HEX file
.hex
Intel HEX file format
Motorola S-record file
.mot
Motorola S-record file format
- (S0, S1, S9-16 bits)
- (S0, S2, S8-24 bits)
- (S0, S3, S7-32 bits)
Binary file
Note
.bin
Binary file format
Notes on using GHS compiler (Green Hills Software, Inc., USA)
- Supported version
- MULTI (Ver.6.1.4 or higher), and GHS compiler (Ver.2012.5.5 or higher)
- Supported options
Debug option: -G, -dual_debug, -cpu=rh850/-cpu=v850e3
[Caution] In GHS compiler (Ver.2013.1.5), the rh850 option changed as follows:
rh850g3m, rh850g3k, rh850g3h
For details, see the release notes of GHS products.
Optimization option:-Odebug, -O, -Ospeed, -Onone
Other than above:-prepare_dispose, -callt
- Non-supported options
Linker optimization option:-shorten_loads, -code_factor, -delete
(NOTE: Linker changes execution code. However, the changes are not reflected on the debug
information.)
- Notes on debugging
- Add the created load module file to a debug-dedicated project.
- Select [Green Hills Software] in the [Compiler Vendor] property in the Download Files dialog box
to add the load module file.
- The followings are not supported:
- C++
- Programs with C99 own type or modifier
- Programs with gnu c extensional specs
- Step or Execution related functions
Executing return out functions from the following function may fail. And call history on the Call
Stack panel is not shown incorrect.
- Functions is called by callt
- Interrupt Functions
- Reference function of variables using expressions
- When long long type or double type variables are located to register, only lower 4 bit register
name is shown in address column in the Watch panel. CS+ gets upper 4 bit value from next to
lower 4 bit register.
For example, if R4 is shown in the address column, then CS+ will get the upper 4 bit value from
R5.
R20UT3456EJ0100 Rev.1.00
Aug 01, 2015
Page 43 of 281
CS+ V3.02.00
2. FUNCTIONS
- When structure type variables are located to a registers, correct value of structure members
aren't shown on the Watch panel. See the value that is show in register of [address] area on
the CPU Register panel.
- Even using an expression with scope specify, it is impossible to refer defined static variables in
functions. When a program counter exists in the function that the static variables are defined
in, it is possible to refer it.
func(){
static
}
sta = 100;
In the above case, during debugging func(), it is possible to refer both "sta" and "func()#sta".
During debugging functions except func(), it is possible to refer neither "sta" nor "func()#sta".
- As stack frame is not generated at a start point of a function, passed address of a variable via
the stack is not correct. Please refer value of a variable after stepping in the function.
- Other than the above
- It is not possible to invalidate the Symbol name completion function (a specification of [Generate the information for input completion] item in the Download Files dialog box will be ignored).
You can change the download files or download conditions in the following Download Files dialog box.
The Download Files dialog box is opened by clicking the [...] button that appears at the right edge in the column of the
[Download files] property when you select it in the [Download] category on the [Download File Settings] tab of the Property
panel.
Figure 2.61 Opening Download Files Dialog Box
Figure 2.62 Advanced Downloading (Download Files Dialog Box)
[Download file property] area
[Download file list] area
This section describes how to configure on the Download Files dialog box above when the following cases.
R20UT3456EJ0100 Rev.1.00
Aug 01, 2015
Page 44 of 281
CS+ V3.02.00
2.5.2.1
2.5.2.2
2.5.2.3
2.5.2.4
2. FUNCTIONS
Change download conditions for load module files
Add download files (*.hex/*mot/*.bin)
Download multiple load module files
Perform source level debugging with files other than the load module file format
2.5.2.1 Change download conditions for load module files
Follow the steps below in the Download Files dialog box to change the download conditions (object information and
symbol information) for load module files.
(1)
Select a load module file
Select a load module file to download in the [Download file list] area.
(2)
Change download conditions
Current download conditions for the selected load module file are displayed in the [Download file property] area.
Change each items displayed in the property.
Download object
Download symbol
information
Generate the information for
input completion
(3)
Select whether to download the object information from the specified file.
Default
Yes
Modifying
Select from the drop-down list.
Available
values
Yes
Downloads object information.
No
Does not download object information.
Select whether to download the symbol information from the specified fileNote 1.
Default
Yes
Modifying
Select from the drop-down list.
Available
values
Yes
Downloads symbol information.
No
Does not download symbol information.
Select whether to generate the information for the Symbol name completion function
when downloadingNote 2.
Default
Yes
Modifying
Select from the drop-down list.
Available
values
Yes
Generates the information for the symbol name completion
function. (i.e. uses the symbol name completion function.)
No
Does not generate the information for the symbol name completion function. (i.e. does not use the symbol name completion function.)
Note 1.
If the symbol information have not been downloaded, the source level debugging cannot be performed.
Note 2.
When [Yes] is selected, the time taken for downloading and the memory usage on the host machine
will increase. We recommend selecting [No] in this item if you do not intend to use the symbol
name completion function.
Click the [OK] button
Enable all the configuration in this dialog box and change the download conditions.
R20UT3456EJ0100 Rev.1.00
Aug 01, 2015
Page 45 of 281
CS+ V3.02.00
2. FUNCTIONS
2.5.2.2 Add download files (*.hex/*mot/*.bin)
Follow the steps below to add download files other than the load module file format (Intel HEX file (*.hex), Motorola Srecord file (*.mot), or binary file (*.bin)) in the Download Files dialog box.
(1)
Click the [Add] button
When the [Add] button is clicked, a blank list item "-" is displayed in the last line of the [Download file list] area.
(2)
Property configuration of the download files to add
Configure the download conditions for the download file to add in the [Download file property] area.
Configure each item displayed with the following condition. When the configuration is completed, the file name
specified in this property is displayed in the blank list of the [Download file list] area.
File
File type
Offset
Start address
Remark
Specify the download file (Intel HEX file (*.hex), Motorola S-record file (*.mot), or binary
file (*.bin)) to download (up to 259 characters).
Default
Blank
Modifying
Directly enter from the keyboard, or specify with the Select Download File
dialog box opened by clicking the [...] button.
Available
values
See "Table 2.1 Downloadable File Formats".
Select the type of the file to download.
Here, select a item other than [Load module file].
Default
Load module file
Modifying
Select from the drop-down list.
Available
values
Load module file
Specifies a load module file (*.abs).
Hex file
Specifies an Intel HEX file (*.hex).
S record file
Specifies a Motorola S-record file (*.mot).
Binary data file
Specifies an binary file (*.bin).
Specify the offset from the address at which the file's download is to start.
Note that this item appears only when [File type] is set to [Hex file] or [S record file].
Default
0
Modifying
Directly enter from the keyboard.
Available
values
0x0 to 0xFFFFFFFFFF in hexadecimal number
Specify the address at which to start the file's download.
Note that this item appears only when [File type] is set to [Binary file].
Default
0
Modifying
Directly enter from the keyboard.
Available
values
0x0 to 0xFFFFFFFFFF in hexadecimal number
The settings of whether to download the object information or symbol information can be made only
when the type of the file to download is load module files.
(3)
Check the order of download
The order of the download is the display order of the files displayed in the [Download file list] area.
If you want to change the order, use the [Up]/[Down] button.
(4)
Click the [OK] button
Enable all the configuration in this dialog box and add a download file (the file name is displayed in the [Download]
category on the [Download File Settings] tab of the Property panel).
R20UT3456EJ0100 Rev.1.00
Aug 01, 2015
Page 46 of 281
CS+ V3.02.00
2. FUNCTIONS
2.5.2.3 Download multiple load module files
Follow the steps below on the Download Files dialog box to download multiple load module files.
Caution
When debugging a program consisting of multiple load module files, care should be taken to avoid overlapping of location addresses.
(1)
Click the [Add] button
When the [Add] button is clicked, a blank list item "-" is displayed in the last line of the [Download file list] area.
(2)
Property configuration of the download files to add
Configure the download conditions for the download file to add in the [Download file property] area.
Configure each item displayed with the following condition.
When the configuration is completed, the file name specified in this property is displayed in the blank list of the
[Download file list] area.
File
Specify the name of the load module file to be added (up to 259 characters).
File type
Default
Blank
Modifying
Directly enter from the keyboard, or specify with the Select Download File
dialog box opened by clicking the [...] button displayed at the right edge of
this property when it is selected.
Available
values
See "Table 2.1 Downloadable File Formats".
Specify the type of the file to download.
Here, select [Load module file].
Default
Download object
Download symbol
information
Generate the information for
input completion
Note 1.
Load module file
Select whether to download the object information from the specified file.
Default
Yes
Modifying
Select from the drop-down list.
Available
values
Yes
Downloads object information.
No
Does not download object information.
Select whether to download the symbol information from the specified fileNote 1.
Default
Yes
Modifying
Select from the drop-down list.
Available
values
Yes
Downloads symbol information.
No
Does not download symbol information.
Select whether to generate the information for the Symbol name completion function
when downloadingNote 2.
Default
Yes
Modifying
Select from the drop-down list.
Available
values
Yes
Generates the information for the symbol name completion
function. (i.e. uses the symbol name completion function.)
No
Does not generate the information for the symbol name completion function. (i.e. does not use the symbol name completion function.)
If the symbol information have not been downloaded, the source level debugging cannot be performed.
R20UT3456EJ0100 Rev.1.00
Aug 01, 2015
Page 47 of 281
CS+ V3.02.00
2. FUNCTIONS
Note 2.
When [Yes] is selected, the time taken for downloading and the memory usage on the host machine
will increase. We recommend selecting [No] in this item if you do not intend to use the symbol
name completion function.
Remark
You can decrease the memory usage by selecting [No] for the [Download symbol information] item
if the symbol information is not required for the module (in this case, however, the source level
debugging can not be performed for the file).
(3)
Check the order of download
The order of the download is the display order of the files displayed in the [Download file list] area.
If you want to change the order, use the [Up]/[Down] button.
(4)
Click the [OK] button
Enable all the configuration in this dialog and add the specified load module file (the specified file name is displayed in the [Download] category on the [Download File Settings] tab of the Property panel).
2.5.2.4 Perform source level debugging with files other than the load module file format
Even when an Intel HEX file (*.hex), Motorola S-record file (*.mot), or binary file (*.bin) is specified to be the subject file
to download, it is possible to do source level debugging by downloading symbol information for the load module file from
which the subject file was created, along with the subject file that you download.
To do so, follow the steps below on the Download Files dialog box.
(1)
Click the [Add] button
When the [Add] button is clicked, a blank list item "-" is displayed in the last line of the [Download file list] area.
(2)
Property configuration of the load module file to add
Configure each item displayed with the following condition in the [Download file property] area.
File
Specify a load module file from which the Intel HEX file (*.hex), Motorola S-record file
(*.mot), or binary file (*.bin) that you want to download was created.
Directly enter from the keyboard, or specify with the Select Download File dialog box
opened by clicking the [...] button that appears at right by selecting this property.
File type
Select [Load module file] (default).
Download object
Select [No].
Download symbol
information
Select [Yes] (default).
Generate the information for
input completion
Select whether to generate the information for the Symbol name completion function
when downloadingNote.
Note
(3)
Default
Yes
Modifying
Select from the drop-down list.
Available
values
Yes
Generates the information for the symbol name completion
function. (i.e. uses the symbol name completion function.)
No
Does not generate the information for the symbol name completion function. (i.e. does not use the symbol name completion function.)
When [Yes] is selected, the time taken for downloading and the memory usage on the host machine
will increase. We recommend selecting [No] in this item if you do not intend to use the symbol
name completion function.
Click the [OK] button
Enable all the configuration in this dialog box and add the specified load module file (Only the symbol information
included in the load module file will be downloaded).
R20UT3456EJ0100 Rev.1.00
Aug 01, 2015
Page 48 of 281
CS+ V3.02.00
2. FUNCTIONS
2.5.3 Execute uploading
The contents of the memory of the debug tool currently connected can be saved (uploaded) in an arbitrary file.
You can upload the data in the Data Save dialog box that is opened by selecting the [Debug] menu >> [Upload...].
In this dialog box, follow the steps below.
Figure 2.63 Execute Uploading (Data Save Dialog Box)
(1)
Specify [File Name]
Specify the name of the file to save.
You can either type a filename directly into the text box (up to 259 characters), or select one from the input history
via the drop-down list (up to 10 items). You can also specify the file by clicking the [...] button, and selecting a file
via the Select Data Save File dialog box.
(2)
Specify [File Type]
Select the format in which to save the file from the following drop-down list.
The following file formats can be selected.
Table 2.2
Uploadable File Formats
List Display
(3)
Intel Hex format (*.hex)
Intel HEX file format
(The expanded linear address record is always used)
Motorola S-record (*.mot)
Motorola S-record file format
Binary data (*.bin)
Binary file format
Specify [Save Range Address/Symbol]
Specify the range of addresses to save via "start address" and "end addresses".
Directly enter hexadecimal number/address expression in each text box or select from the input history displayed
in the drop-down list (up to 10 items).
Remark
(4)
File Format
A symbol name at the current caret position can be complemented by pressing the [Ctrl] + [Space]
key in each text box (see "2.18.2 Symbol name completion function").
Click the [Save] button
Save the contents of the memory in the specified file in specified format as upload data.
R20UT3456EJ0100 Rev.1.00
Aug 01, 2015
Page 49 of 281
CS+ V3.02.00
2. FUNCTIONS
2.6 Display/Change Programs
This section describes how to display and change programs when a load module file with the debug information is
downloaded to a debug tool.
Downloaded programs can be displayed in the following panels.
- Editor panel
The source file is displayed and can be edited.
Furthermore, the source level debugging/instruction level debugging (see "2.8.3 Execute programs in steps") and the
display of the code coverage measurement result [Simulator] (see "2.14 Measure Coverage [Simulator]") can be
performed in this panel.
- Disassemble panel
The result of disassembling the downloaded program (the memory contents) is displayed and can be edited (line
assemble).
Furthermore, the instruction level debugging (see "2.8.3 Execute programs in steps") and the display of the code coverage measurement result [Simulator] (see "2.14 Measure Coverage [Simulator]") can be performed in this panel.
In this panel, the disassemble results can be displayed with the corresponding source text (default).
Remark
It is normally necessary to download a load module file with debugging information in order to perform
the source level debugging, but it is also possible to do so by downloading an Intel HEX file (*.hex),
Motorola S-record file (*.mot), or binary file (*.bin) (see "2.5.2.4 Perform source level debugging with files
other than the load module file format").
2.6.1 Display source files
The source file is displayed in the Editor panel below. The Editor panel automatically opens with displaying source text
of the specified position (see "2.5.1 Execute downloading") when a load module file is successfully downloaded.
If you want to open the Editor panel manually, double-click on the source file in the Project Tree panel.
For details on the contents and function in each area, see the section for the Editor panel.
Figure 2.64 Display Source File (Editor Panel)
2.6.2 Display the result of disassembling
The result of disassembling the downloaded program (disassembled text) is displayed in the Disassemble panel below.
Select [View] menu >> [Disassemble] >> [Disassemble1 - 4].
The maximum of 4 Disassemble panels can be opened. Each panel is identified by the names "Disassemble1",
"Disassemble2", "Disassemble3" and "Disassemble4" on the titlebar.
For details on the contents and function in each area, see the section for the Disassemble panel.
R20UT3456EJ0100 Rev.1.00
Aug 01, 2015
Page 50 of 281
CS+ V3.02.00
2. FUNCTIONS
Figure 2.65 Display Result of Disassembling (Disassemble Panel)
Toolbar
Event area
Address area
Disassemble area
Remark
You can set the scroll range of the vertical scroll bar on this panel via the Scroll Range Settings dialog
box which is opened by clicking the
button from [View] on the toolbar.
This section describes the following.
2.6.2.1
2.6.2.2
2.6.2.3
2.6.2.4
2.6.2.5
Change display mode
Change display format
Move to the specified address
Move to the symbol defined location
Save the disassembled text contents
2.6.2.1 Change display mode
You can change the display mode of the Disassemble panel by clicking the
button (toggle) on the toolbar.
- Mixed display mode
In this display mode (default), the disassembled text is displayed combined with the source text.
Figure 2.66 Mixed Display Mode (Disassemble Panel)
Source text
Disassembled text
- Dissassemble display mode
In this display mode, the source text is hidden and only the disassembled text is displayed.
R20UT3456EJ0100 Rev.1.00
Aug 01, 2015
Page 51 of 281
CS+ V3.02.00
2. FUNCTIONS
Figure 2.67 Disassemble Display Mode (Disassemble Panel)
Disassembled text
2.6.2.2 Change display format
The display format of the disassemble area can be changed using buttons below on the toolbar.
View
The following buttons to change the display format are displayed.
Show Offset
Displays the offset value of the label. The offset value from the nearest label is displayed when a label is defined for the address.
Show Symbol
Displays the address value as the result of disassembling in the format "symbol +
offset value" (default).
Note that when a symbol has been defined as the address value, only the symbol is
displayed.
Show Function Name
Displays the name of the register by its function name (default).
Show Absolute Name
Displays the name of the register by its absolute name.
2.6.2.3 Move to the specified address
You can move to the specified address in the disassembled text in the Go to the Location dialog box which opens when
selecting [Go to...] from the context menu.
In this dialog box, follow the steps below.
Figure 2.68 Move to Specified Address in Disassembled Text (Go to the Location Dialog Box)
(1)
Specify [Address/Symbol]
Specify the address you want to move the caret to.
You can either type an address expression directly into the text box (up to 1024 characters), or select them from
the input history via the drop-down list (up to 10 items).
Remark
(2)
A symbol name at the current caret position can be complemented by pressing the [Ctrl] + [Space]
key in this text box (see "2.18.2 Symbol name completion function").
Click the [OK] button
Caret is moved to the specified address.
2.6.2.4 Move to the symbol defined location
You can move the caret to the address where the symbol is defined.
Click the
button on the toolbar after moving the caret to the instruction which refers to the symbol.
Furthermore, click the
button on the toolbar following the previous operation returns the caret to the instruction
which refers to the symbol at previous caret is defined.
R20UT3456EJ0100 Rev.1.00
Aug 01, 2015
Page 52 of 281
CS+ V3.02.00
2. FUNCTIONS
2.6.2.5 Save the disassembled text contents
Contents of the disassembled text can be saved in text files (*.txt)/CSV files (*.csv).
When saving to the file, the latest information is acquired from the debug tool, and it is saved in accordance with the display format on this panel.
The Data Save dialog box can be opened by selecting the [File] menu >> [Save Disassemble Data As...] (when this
operation takes place with the range selected on the panel, the disassembled data can be saved only for the selected
range).
In this dialog box, follow the steps below.
Figure 2.69 Save Disassembled Text Contents (Data Save Dialog Box)
(1)
Specify [File Name]
Specify the name of the file to save.
You can either type a filename directly into the text box (up to 259 characters), or select one from the input history
via the drop-down list (up to 10 items).
You can also specify the file by clicking the [...] button, and selecting a file via the Select Data Save File dialog box.
(2)
Specify [File Type]
Select the format in which to save the file from the following drop-down list.
The following file formats can be selected.
List Item
Text files (*.txt)
Text format (default)
CSV (Comma-Separated Variables)(*.csv)
CSV formatNote
Note
(3)
The data is saved with entries separated by commas (,).
If the data contains commas, each entry is surrounded by double quotes "" in order to avoid illegal
formatting.
Specify [Save Range Address/Symbol]
Specify the range of addresses to save via "start address" and "end addresses".
Directly enter hexadecimal number/address expression in each text box or select from the input history displayed
in the drop-down list (up to 10 items).
If a range is selected in the panel, that range is specified as the default. If there is no selection, then the range
currently visible in the panel is specified.
Remark
(4)
Format
A symbol name at the current caret position can be complemented by pressing the [Ctrl] + [Space]
key in each text box (see "2.18.2 Symbol name completion function").
Click the [Save] button
Disassembling data is saved in the specified file with the specified format.
R20UT3456EJ0100 Rev.1.00
Aug 01, 2015
Page 53 of 281
CS+ V3.02.00
2. FUNCTIONS
Figure 2.70 Output Example of Disassembling Data
-------------------------------------------------------Label (symbol name)
:
File name
Line number C language source text
:
:
:
Address Offset Code
Result of Disassembling
:
:
:
:
Label (symbol) line
Source text line
Disassembling line
Remark 1.
When the contents of the panel are overwritten and saved by selecting the [File] menu >>[Save Disassemble Data], the Disassemble panels (Disassemble1-4) are handled individually for these respectively.
In addition, saving range is same as the previously specified address range.
Remark 2.
You can print the current screen image of this panel by selecting the [File] menu >> [Print...].
2.6.3 Run a build in parallel with other operations
CS+ can automatically start a build when one of the following events occurs (rapid build function).
- For other than the debug-only project
- When any one of the following files that are added to the project is updated:
(C source file, assembly source file, header file, link directive file, symbol information file, object module file, or
library file)
- When a build target file has been added to or removed from the project
- When the link order of object module files and library files is changed
- When the property of the build tool or the build target file is changed
- For the debug-only project
- When you have edited and saved the C source file, assembly source file and header file that are added to the
debug-dedicated project
- When a C source file, assembly source file, or header file has been added to or removed from the debug-dedicated project
- When the property of the debug-dedicated project is changed
If a rapid build is enabled, it is possible to perform a build in parallel with the above operations.
To enable/disable a rapid build, select [Rapid Build] from the [Build] menu. A rapid build is enabled by default.
Caution
When an external text editor is used, check the [Observe registered files changing] check box on the
[General - Build/Debug] category in the Option dialog box to enable this function.
Remark 1.
After editing source files, it is recommend to save frequently by pressing the [Ctrl] + [S] key.
Remark 2.
Enable/Disable setting of the rapid build applies to the entire project (main project and subprojects).
Remark 3.
If you disable a rapid build while it is running, it will be stopped at that time.
2.6.4 Perform line assembly
Instructions and code displayed in the Disassemble panel can be edited (line assembly).
This section describes the following.
2.6.4.1 Edit instructions
2.6.4.2 Edit code
2.6.4.1 Edit instructions
Follow the steps below to edit instructions.
(1)
Switch to edit mode
R20UT3456EJ0100 Rev.1.00
Aug 01, 2015
Page 54 of 281
CS+ V3.02.00
2. FUNCTIONS
Double-click the instruction to edit or select [Edit Disassemble] from the context menu after moving the caret to the
instruction to edit.
(2)
Edit instructions
Use keyboard to directly edit the instructions.
(3)
Write to memory
Press the [Enter] key to line assemble the edited instructions after editing. The code is automatically written to the
memory.
If the edited instruction is invalid, the instruction is shown in red and will not be written to the memory.
If there is a space because of overwriting the displayed result of disassembling by another instruction, its byte number is
automatically compensated with nop instruction as follows:
Example 1.
Example 2.
Caution
Overwriting the prepare instruction (8-byte instruction) with the jarl instruction (4-byte instruction)
Before editing
0432
1d38
8f071b0effff0000
0132
mov
mov
prepare
mov
0x4,
r29,
r20,
0x1,
After editing
0432
1d38
bfffe265
0000
0000
0132
mov
mov
jarl
nop
nop
mov
0x4, r6
r29, r7
0x100, lp
r6
r7
r21, r22, 0x1c, 0x0000ffff
r6
0x1, r6
Overwriting the mov instruction (2-byte instruction) with the jarl instruction (4-byte instruction)
Before editing
0432
1d38
8f071b0effff0000
0132
mov
mov
prepare
mov
0x4,
r29,
r20,
0x1,
After editing
0432
bfffe265
0000
0000
0000
0132
mov
jarl
nop
nop
nop
mov
0x4, r6
0x100, lp
r6
r7
r21, r22, 0x1c, 0x0000ffff
r6
0x1, r6
Handling the prepare instruction and dispose instruction
The following table shows the instruction formats of the prepare instruction and dispose instruction. The
operand "list12" comprises 12-bit value where a different register is assigned to each bit.
Instruction format of the prepare instruction
Instruction format of the dispose instruction
prepare
list12, imm5
prepare
list12, imm5, sp/imm
dispose
imm5, list12
dispose
imm5, list12, [reg1]
When displaying the results of disassembling the prepare instruction and dispose instruction in the Disassemble panel, the corresponding register names for the operand "list12" are displayed instead of its values as shown in the following examples.
Example 1.
Example 2.
When the code is "0xbf, 0x07, 0xe1, 0xff" (4-byte prepare instruction)
View
prepare
r20, r21, r22, r23, r24, r25, r26, r27,r28, r29,
r30, r31, 0x20
Syntax
prepare
0xfff, 0x20
When the code is "0x90, 0x07, 0xbb, 0xaa 0xff, 0xff, 0xff, 0xff" (8-byte prepare instruction)
R20UT3456EJ0100 Rev.1.00
Aug 01, 2015
Page 55 of 281
CS+ V3.02.00
2. FUNCTIONS
Example 3.
Example 4.
View
prepare
r20, r22, r24, r26, r28, r31, 0x20, 0x7fffffff
Syntax
prepare
0x555, 0x20, 0x7fffffff
When the code is "0x51, 0x06, 0xe0, 0xff" (4-byte dispose instruction)
View
dispose
0x20, r20, r21, r22, r23, r24, r25, r26, r27, r28,
r29, r30, r31
Syntax
dispose
0x20, 0xfff
When the code is "0x50, 0x06, 0xaa, 0xaa" (4-byte dispose instruction)
View
dispose
0x20, r20, r22, r24, r26, r28, r31, [r10]
Syntax
dispose
0x20, 0x555, [r10]
Note, however, that it is possible to specify both the value and the register name for the operand "list12"
when line assembling the prepare instruction and dispose instruction.
Example 5.
Example 6.
Example 7.
Example 8.
In both of the cases (1) and (2) below, the same set of values "0x91, 0x07, 0xe1, 0xff" will be
generated as a result of line assembly.
(1)
prepare
r20, r21, r22, r23, r24, r25, r26, r27,r28, r29,
r30, r31, 0x20
(2)
prepare
0xfff, 0x20
In both of the cases (1) and (2) below, the same set of values "0xbe, 0x07, 0xbb, 0xaa 0xff,
0xff, 0xff, 0x7f" will be generated as a result of line assembly.
(1)
prepare
r20, r22, r24, r26, r28, r31, 0x20, 0x7fffffff
(2)
prepare
0x555, 0x20, 0x7fffffff
In both of the cases (1) and (2) below, the same set of values "0x51, 0x06, 0xe0, 0xff" will be
generated as a result of line assembly.
(1)
dispose
0x20, r20, r21, r22, r23, r24, r25, r26, r27, r28,
r29, r30, r31
(2)
dispose
0x20, 0xfff
In both of the cases (1) and (2) below, the same set of values "0x50, 0x06, 0xaa, 0xaa" will be
generated as a result of line assembly.
(1)
dispose
0x20, r20, r22, r24, r26, r28, [r10]
(2)
dispose
0x20, 0x555, [r10]
2.6.4.2 Edit code
Follow the steps below to edit code.
(1)
Switch to edit mode
Double-click the code to edit or select [Edit Code] from the context menu after moving the caret to the code to edit.
(2)
Edit code
Use keyboard to directly edit the code.
(3)
Write to memory
Press the [Enter] key to write the code to the memory after editing.
If the edited instruction is invalid, the instruction is shown in red and will not be written to the memory.
When the code is written to the memory, the result of disassembling is also updated.
R20UT3456EJ0100 Rev.1.00
Aug 01, 2015
Page 56 of 281
CS+ V3.02.00
2. FUNCTIONS
2.7 Select a Core (PE)
This section describes how to select the target core (PE: Processer Element) to be debugged when the selected microcontroller supports multi-core.
CS+ displays information regarding a core (PE) by switching selection between the target cores to be debugged (see
"2.7.1 Switching between cores (PEs)"). Multiple panels are not provided to display each PE in a single dedicated panel.
The following shows the behavior of each CS+ function for a microcontroller that supports multi-core.
(1)
(a)
Program execution control
[Full-spec emulator][E1][E20]
The control method differs depending on the mode selected by the [Debug mode] property in the [Multi core]
category on the [Debug Tool Settings] tab of the Property panel.
- When [Sync debug mode] is selected:
Synchronous execution and synchronous break are available in all PEs in principle.
In step execution, one instruction each is executed in units of instructions.
- When [Async debug mode] is selected:
Only the PE selected to be debugged is executed and a break is generated.
Caution
(b)
Step execution is available only in the currently selected PE.
Step execution in source level units, however, may also proceed on other PEs (PE).
[Simulator]
Synchronous execution and synchronous break are available in all PEs in principle.
Step execution is performed in synchronization with the operating frequency.
(2)
Event occurrence
All events excluding software break events are set in only the PE selected to be debugged.
The Events panel displays a list of events set in all PEs.
Other panels display only events set in the PE selected to be debugged.
(3)
Information of the memory, registers, or variables
(a)
Memory mappings
Memory mappings may differ depending on the currently selected PE.
In this case, switching to another PE displays the corresponding memory mappings in the [Memory] category on
the [Debug Tool Settings] tab of the Property panel or the Memory Mapping dialog box.
(b)
Range and values of memory
The same value is displayed or set regardless of which PE is currently selected.
In the Local RAM self area, note that the value in the currently selected PE is acquired and displayed or set.
(c)
Register values (including IOR/PC)
The value in the currently selected PE is acquired and displayed or set.
(d)
Symbols (including watch-expressions/variable names)
The address and value are determined based on the PC value in the currently selected PE (for example, even
when a symbol is valid only in a certain PE, its address and value are determined based on the PC value in the
currently selected PE).
(e)
Call stack information
The value in the currently selected PE is acquired and displayed or set.
(4)
(a)
Other functions
Collection of execution history of programs
- [Full-spec emulator][E1][E20]
The operation differs depending on the specification of the [Trace target] property in the [trace] category on the
[Debug Tool Settings] tab of the Property panel.
- When [Debug core only] is selected:
Trace data regarding the currently selected PE is collected.
Therefore, to collect desired trace data, select the target PE before executing the program (if PE is switched
after collecting trace data, the display in the Trace panel will not be updated).
- When [All core] is selected:
Trace data is collected in all PEs.
After collecting trace data, switching to another PE displays the corresponding trace data in the Trace panel.
R20UT3456EJ0100 Rev.1.00
Aug 01, 2015
Page 57 of 281
CS+ V3.02.00
2. FUNCTIONS
- When core name is selected:
Trace data for the selected core name is collected.
- [Simulator]
Trace data regarding the currently selected PE is collected.
Therefore, to collect desired trace data, select the target PE before executing the program (if PE is switched
after collecting trace data, the display in the Trace panel will not be updated).
(b)
Measurement of execution time of programs
The execution time is measured in all PEs.
After measurement, switching to another PE displays the corresponding measurement time.
(c)
Coverage measurements
The coverage is measured for access in all PEs.
In the Local RAM self area, note that the measurement results will be displayed only for the access in the currently selected PE.
2.7.1 Switching between cores (PEs)
The core (PE) to be debugged can be selected in either of the following two ways.
(1)
Switching through the statusbar
Select a desired PE from the drop-down list (shown below) on the statusbar in the Main window.
Figure 2.71 Statusbar on Main Window
(2)
Switching through the Debug Manager panel
Select a desired PE on the Debug Manager panel that are opened by selecting [Debug Manager] from the [View]
menu.
Figure 2.72 Debug Manager Panel
R20UT3456EJ0100 Rev.1.00
Aug 01, 2015
Page 58 of 281
CS+ V3.02.00
2. FUNCTIONS
2.8 Execute Programs
This section describes how to execute programs.
Main operations in this section are taken place from the debug toolbar or the [Debug] menu in the Main window, where
commands to control the execution of programs are included.
Caution
Items of the debug toolbar and the [Debug] menu are valid only while connected to the debug tool.
Remark
For "program execution control" for a microcontroller that supports multi-core, see also to "2.7 Select a
Core (PE)".
Figure 2.73 Debug Toolbar (Floating State)
Figure 2.74 [Debug] Menu
2.8.1 Reset microcontroller (CPU)
To reset CPU, click the
button on the debug toolbar.
When CPU is reset, the current PC value is set to the reset address.
Remark
You can automatically overwrite the value of I/O register/CPU register with the specified values after CPU
reset under breaking (see "2.17 Use Hook Function" for details).
2.8.2 Execute programs
The following types of CS+ execution functions are provided.
Select any of the following operations according to the purpose of debugging.
See "2.9 Stop Programs (Break)" for details on how to stop the program in execution.
2.8.2.1 Execute after resetting microcontroller (CPU)
2.8.2.2 Execute from the current address
2.8.2.3 Execute after changing PC value
R20UT3456EJ0100 Rev.1.00
Aug 01, 2015
Page 59 of 281
CS+ V3.02.00
Remark
2. FUNCTIONS
You can automatically overwrite the value of I/O register/CPU register with the specified values before
starting program execution (see "2.17 Use Hook Function" for details).
2.8.2.1 Execute after resetting microcontroller (CPU)
Click the
button on the debug toolbar.
Reset CPU and start execution of the program from the reset address.
When this operation is performed, the program continues to be executed until either of the following occurs:
- The
button has been clicked (see "2.9.2 Stop the program manually").
- The PC has reached a breakpoint (see "2.9.3 Stop the program at the arbitrary position (breakpoint)").
- A break event condition has been met (see "2.9.4 Stop the program at the arbitrary position (break event)" or "2.9.5
Stop the program with the access to variables/I/O registers").
- Other break causes have occurred.
Remark
This operation is the same as when the
button is clicked after clicking the
button.
2.8.2.2 Execute from the current address
Perform any of the following operations to start executing the program from the address at the current PC value.
(1)
Normal execution
Click the
button on the debug toolbar.
When this operation is performed, the program continues to be executed until either of the following occurs:
- The
button has been clicked (see "2.9.2 Stop the program manually").
- The PC has reached a breakpoint (see "2.9.3 Stop the program at the arbitrary position (breakpoint)").
- A break event condition has been met (see "2.9.4 Stop the program at the arbitrary position (break event)" or
"2.9.5 Stop the program with the access to variables/I/O registers").
- Other break causes have occurred.
(2)
Execution ignoring break-related events
Click the
button on the debug toolbar.
When this operation is performed, the program continues to be executed until either of the following occurs:
- The
button has been clicked (see "2.9.2 Stop the program manually").
- Other break causes have occurred.
Remark
(3)
If you have started the execution with this operation, the occurrence of Action event will also be
ignored.
Execution to the caret position
To start this operation, move the caret to the line/instruction to stop the program in the Editor panel/Disassemble
panel, then select [Go to Here] from the context menu.
When this operation is performed, the program continues to be executed until either of the following occurs:
- The PC has reached the address of the caret position.
- The
button has been clicked (see "2.9.2 Stop the program manually").
- Other break causes have occurred.
Caution
When the corresponding address of the line at the caret position does not exist, the program is executed to the corresponding address of the lower valid line (if the corresponding address does not
exist, an error message will appear).
Remark
If you have started the execution with this operation, the occurrence of Action event will also be
ignored.
R20UT3456EJ0100 Rev.1.00
Aug 01, 2015
Page 60 of 281
CS+ V3.02.00
2. FUNCTIONS
2.8.2.3 Execute after changing PC value
The program is executed after forcibly changing the current PC value to an arbitrary address.
To start this operation, move the caret to the line/instruction to start the program in the Editor panel/Disassemble panel,
then select [Set PC to Here] from the context menu (the current PC value is set to the address of the line/instruction where
the caret currently exists).
Then execute either one of the execution method described in "2.8.2.2 Execute from the current address".
2.8.3 Execute programs in steps
When either of the following operation has occurred, the program will stop automatically after conducting step execution
in the source level (1 line of source text) or in the instruction level (1 instruction).
Once the program is stopped, the contents of each panel will be updated automatically. As such, step execution is
suited for debugging the program execution in transition either in source or instruction level.
The unit in which the program is step-executed depends on the setting as follows:
- When the
button on the Editor panel’s toolbar is invalid (default):
Step execution is conducted in source level.
Note, however, that when the focus is in the Disassemble panel or the line information does not exist in the address
specified by the current PC value, the step execution is conducted in instruction level.
- When the
button on the Editor panel’s toolbar is valid:
Step execution is conducted in instruction level.
Caution
The
button is only enabled if the Mixed display mode is selected on the Editor panel.
Step execution is divided into the following types:
2.8.3.1 Step in function (Step in execution)
2.8.3.2 Step over function (Step over execution)
2.8.3.3 Execute until return is completed (Return out execution)
Caution 1.
Breakpoints, break events, and action events that have been set do not occur during step execution.
Caution 2.
An error message will appear while processing a function prologue or epilogue if the return address cannot be acquired.
Caution 3.
[Full-spec emulator][E1][E20]
- Interrupts are not acknowledged during step execution.
- It will not go into standby mode during step execution.
Caution 4.
[Simulator]
You may jump to an interrupt handler during step execution.
2.8.3.1 Step in function (Step in execution)
When the function is called, the program is stopped at the top of the called function.
Click the
button on the debug toolbar to perform Step in execution.
Caution 1.
Step in execution for a function without the debug information is not possible.
Caution 2.
If Step in execution is performed for the longjmp function, program execution may not complete and may
wait for a time-out.
Caution 3.
The beginning of the function (prologue processing) is not skipped. To skip prologue processing, perform
Step in execution again.
R20UT3456EJ0100 Rev.1.00
Aug 01, 2015
Page 61 of 281
CS+ V3.02.00
2. FUNCTIONS
2.8.3.2 Step over function (Step over execution)
In the case of a function call by the jarl instruction, all the source lines/instructions in the function are treated as one step
and executed until the position where execution returns from the function (step execution will continue until the same nest
is formed as when the jarl instruction has been executed).
Click the
button on the debug toolbar to perform Step over execution.
In the case of an instruction other than jarl, operation is the same as when the
button is clicked.
Caution
If Step over execution is performed for the longjmp function, program execution may not complete and
may wait for a time-out.
2.8.3.3 Execute until return is completed (Return out execution)
Step-execute the program so that the program will stop when it returns from the current function to the caller function.
When the execution of source line/instruction that require checking has been completed, you can perform step execution
using this instruction so that you can make the program return to the caller function without step executing the remaining
instructions inside the function.
Click the
button on the debug toolbar to perform Return out execution.
Caution 1.
If Return out execution is performed in the main function, the program is stopped in the startup routine.
Caution 2.
Return out execution cannot be performed immediately after stepping in a function.
Caution 3.
Return out execution cannot be performed while processing a function prologue or epilogue.
Caution 4.
If Return out execution is performed in a function that called the longjmp function, breaks may not occur.
Caution 5.
If Return out execution is performed in a recursive function, the program will be executed in free-run
mode.
R20UT3456EJ0100 Rev.1.00
Aug 01, 2015
Page 62 of 281
CS+ V3.02.00
2. FUNCTIONS
2.9 Stop Programs (Break)
This section describes how to stop the program in execution.
CS+ can stop the program in execution at the arbitrary position by using the following functions.
(1)
Forced break function
Stops the program forcibly.
(2)
Hardware break function
The debug tool consecutively checks the break condition while the program is in execution and stops the program
when the condition is met. This function is implemented using the debug tool resources.
There are two types of Hardware Break event: "execution type" which stops the program at the arbitrary position;
and "access type" which stops the program when an arbitrary variable and so on is accessed with the specified
type.
If a Hardware Break event (execution type) is set, the program will break before executing instruction at the specified address ("before execution" break).
Remark
When a Hardware Break event (access-type) is used (see "2.9.5.1 Set a break event (access
type)"), "after execution" break will only follow the cases listed below.
- When the data condition is specified after selecting [Break Settings] >> [Set Read Break to] / [Set
R/W Break to] from the context menu
- When a write access of the read-modify-write instruction is detected, after selecting [Break Settings] >> [Set Write Break to] / [Set R/W Break to] from the context menu
(3)
Software break function [Full-spec emulator][E1][E20]
Temporarily replaces the instruction code for a specified address with a break instruction and stops the program
when this instruction is executed.
If a Software Break event is set, the program will break before executing instruction at the specified address
("before execution" break).
Caution
Since an instruction code is replaced by the break instruction, setting or deleting a software break
event is followed by programming of the flash memory at the timing described below.
- When the program execution is started (including the start of execution via [Ignore break and go]
from the [Debug] menu)
- When the debug tool is disconnected from CS+
Caution 1.
If a forced break is performed while in standby mode (HALT/STOP/IDLE), the current PC position will
indicate the address of the next instruction after the standby mode instruction.
This behavior differs depending on the debug tool used.
- [Full-spec emulator][E1][E20]
The forced break will release standby mode.
- [Simulator]
The forced break will not release standby mode.
It will appear that standby mode has been released. Check the CPU status on the Main window's statusbar to see if standby mode has been released.
Caution 2.
[Full-spec emulator][E1][E20]
Do not decrease the voltage of the target system during a break. A reset that is generated by the lowvoltage detector (LVI) or by power-on-clear (POC) during a break causes an incorrect operation of CS+
or communication errors.
A break during emulation of power supply off also causes communication errors.
Remark 1.
For "program execution control" or "event occurrence" for a microcontroller that supports multi-core, see
also to "Select a Core (PE)".
Remark 2.
When the program in execution is stopped, a statement of the cause of the break appears on the
Statusbar in the Main window.
2.9.1 Configure the break function [Full-spec emulator][E1][E20]
Before the break function can be used, it is necessary to make settings relating to the operation of a break.
This break operation can be configured in the [Break] category on the [Debug Tool Settings] tab of the Property panel.
R20UT3456EJ0100 Rev.1.00
Aug 01, 2015
Page 63 of 281
CS+ V3.02.00
Remark
2. FUNCTIONS
[Simulator]
The settings relating to the operation of a break are not necessary.
Figure 2.75 [Break] Category [Full-spec emulator][E1][E20]
(1)
(2)
[Use software break]
Select whether to use the Software break function [Full-spec emulator][E1][E20].
Select [Yes] to use the software break function (default: [No]).
Caution 1.
If this property is set to [No] after you have used the software break function, all software break
events and Printf events that have been set will be disabled. Selecting [Yes] in this state does not
automatically restore the events, so you will need to manually enable them.
Caution 2.
This property cannot be changed during program execution.
[First using type of breakpoint]
This property appears only when the [Use software break] property is set to [Yes].
Select from the following drop-down list the type of a breakpoint to use with priority when setting it with a one click
operation of the mouse in the Editor panel/Disassemble panel.
Hardware break
Sets hardware breakpoint with priority, by using the Hardware break function (default).
Once set, it is treated as a Hardware Break event (execution system).
Software break
Sets software breakpoint with priority, by using the Software break function [Full-spec
emulator][E1][E20].
Once set, it is treated as a Software Break event.
Caution
(3)
If the number of the set breakpoints of the specified type exceeds the limit settable (see "2.16.6.1
Maximum number of enabled events"), a breakpoint of another type will be used.
[Stop emulation of peripherals when stopping]
Select whether to terminate the peripheral emulation while stopping the program execution (Peripheral Break).
Select [Yes] to terminate (default: [No]).
2.9.2 Stop the program manually
The program in execution is forcibly stopped by clicking the
button on the debug toolbar (Forced break function).
2.9.3 Stop the program at the arbitrary position (breakpoint)
A breakpoint is one of the break events that can be set by one-clicking with the mouse.
The program in execution can be stopped at the arbitrary position easily by setting a breakpoint.
This section describes the following operations.
2.9.3.1 Set a breakpoint
2.9.3.2 Delete a breakpoint
2.9.3.1 Set a breakpoint
Breakpoints can be set via the Editor panel/Disassemble panel in which the source text/disassembled text is displayed.
Within the Main area (Editor panel) or Event area (Disassemble panel) in which a valid address is displayed, click on the
location where you want to set a breakpoint. A breakpoint whose type is being selected in the [First using type of breakpoint] property is set to the instruction at the start address corresponding to the clicked line.
When a breakpoint is set, the following event mark appears at the breakpoint location, and the source text line/
disassembled text line is highlighted.
It is interpreted as if a break event (Hardware Break or Software Break) has been set at the target address, and it is
managed in the Events panel (see "2.16 Manage Events" for details).
R20UT3456EJ0100 Rev.1.00
Aug 01, 2015
Page 64 of 281
CS+ V3.02.00
Table 2.3
2. FUNCTIONS
Event Marks of Breakpoint
Type of Breakpoint
Event Type
Hardware breakpoint
Hardware Break eventNote
Software breakpoint
[Full-spec emulator][E1][E20]
Software Break eventNote
Note
Event Mark
In the [Name] area of the Events panel, "Break" is displayed as the event type name.
Figure 2.76 Breakpoint Setting Example (Disassemble Panel)
Event area
Indicates that a software breakpoint has
been set.
Indicates that a hardware breakpoint has
been set.
Figure 2.77 Example of Setting Breakpoint in Events Panel
Caution 1.
Since a breakpoint is set as a break event and managed as a event, restrictions apply to the number of
breakpoints that can be simultaneously set. Also see "2.16.6 Notes for setting events" for details on
breakpoints (e.g. limits on the number of enabled events).
Caution 2.
Breakpoints can only be set at lines that have valid addresses.
Caution 3.
[Full-spec emulator][E1][E20]
Software breakpoints can be set in only the code flash area.
Remark 1.
Event marks differ depending on the event state (see "2.16.1 Change the state of set events (valid/
invalid)").
When an event is set at the point where other event is already set, the event mark (
) is displayed
meaning more than one event is set at the point.
Remark 2.
[Full-spec emulator][E1][E20]
You can set hardware breakpoints/software breakpoints without depending on the selection of the [First
using type of breakpoint] property by the operation described below.
Note, however, that "Operation1" is only available in the Disassemble panel.
Type
Remark 3.
Operation1
Operation2
Hardware breakpoint
[Ctrl] + mouse click
Select [Break Settings] >> [Set
Hardware Break] from the context menu.
Software breakpoint
[Shift] + mouse click
Select [Break Settings] >> [Set
Software Break] from the context menu.
[Simulator]
The type of breakpoint that can be set is locked to hardware breakpoints.
R20UT3456EJ0100 Rev.1.00
Aug 01, 2015
Page 65 of 281
CS+ V3.02.00
2. FUNCTIONS
2.9.3.2 Delete a breakpoint
Click event marks displayed in the Editor panel/Disassemble panel to delete set breakpoints (the event mark will
be erased).
2.9.4 Stop the program at the arbitrary position (break event)
The program in execution can be stopped at the arbitrary position by setting a break event (execution type).
This section describes the following operations.
2.9.4.1 Set a break event (execution type)
2.9.4.2 Delete a break event (execution type)
2.9.4.1 Set a break event (execution type)
Perform this operation in the Editor panel/Disassemble panel in which the source text/disassembled text is displayed.
Follow the operation listed below from the context menu, in accordance with your desired event type, after moving the
caret to the target line that has a valid address.
Event Type
Operation
Description
Hardware Break
Select [Break Settings] >>
[Set Hardware Break]
Sets a Hardware Break event by using the Hardware
break function.
Software Break
[Full-spec emulator]
[E1][E20]
Select [Break Settings] >>
[Set Software Break]
Sets a Software Break event by using the Software
break function [Full-spec emulator][E1][E20].
A break event is set to the instruction at the start address corresponding to the line of the caret position.
When a break event (execution type) is set, the following event mark is displayed in the event area of the line that an
event is set., and the source text line or disassembled text line will be highlighted.
When you have performed this operation, the set break event is managed in the Events panel as a Hardware Break
event (execution type)/Software Break event (execution type) (see "2.16 Manage Events" for details).
Table 2.4
Event Marks of Break Event (Execution Type)
Event Type
Event Mark
Hardware Break
Software Break
[Full-spec emulator][E1][E20]
Figure 2.78 Break Event (Execution Type) Setting Example (Disassemble Panel)
Event area
Indicates that a Software Break event has
been set.
Indicates that a
Hardware Break event
has been set.
R20UT3456EJ0100 Rev.1.00
Aug 01, 2015
Page 66 of 281
CS+ V3.02.00
2. FUNCTIONS
Figure 2.79 Example of Setting Hardware Break Event (Execution Type) in Events Panel
Caution 1.
When setting a break event (execution type), also see "2.16.6 Notes for setting events" for details (e.g.
limits on the number of valid events).
Caution 2.
[Full-spec emulator][E1][E20]
Software breakpoints can be set in only the code flash area.
Remark
Event marks differ depending on the event state (see "2.16.1 Change the state of set events (valid/
invalid)"). When an event is set at the point where other event is already set, the event mark (
) is
displayed meaning more than one event is set at the point.
2.9.4.2 Delete a break event (execution type)
To delete a break event (execution type) you have set, click the event mark displayed in the Editor panel/Disassemble
panel.
Also, there is another way to delete a set break event. Select a Software Break event/Hardware Break event in the
Events panel, and then click the
button in the toolbar (see "2.16.4 Delete events").
2.9.5 Stop the program with the access to variables/I/O registers
By setting a break event with the access, the program can be stopped when an arbitrary variable or I/O register is
accessed with the specified type.
You can also limit the accessed value.
The following types can be specified with the access.
Table 2.5
Types of Accesses to Variables
Access Type
Description
Read
The program is stopped with the read access to (after reading) the specified variable/I/O register.
Write
The program is stopped with the write access to (after writing) the specified variable/I/O register.
Read/Write
The program is stopped with the read access/write access to (after reading or writing) the
specified variable/I/O register.
Caution
The program is not stopped with the access via DMA (Direct Memory Access).
This section describes the following.
2.9.5.1 Set a break event (access type)
2.9.5.2 Delete a break event (access type)
2.9.5.1 Set a break event (access type)
Use one of the following methods to set a break event (access type) that stops programs with the access to a variable/I/
O register.
R20UT3456EJ0100 Rev.1.00
Aug 01, 2015
Page 67 of 281
CS+ V3.02.00
Caution
(1)
2. FUNCTIONS
Also see "2.16.6 Notes for setting events" for details on breakpoints (e.g. limits on the number of enabled
events).
Set a break event to a variable/I/O register in the Editor panel/Disassemble panel
Perform this operation in the Editor panel/Disassemble panel in which the source text/disassembled text is displayed.
Follow the operation listed below from the context menu, in accordance with your desired access type, after
selecting an arbitrary variable or I/O register on the source text or the disassembled text. Note, however, that only
global variables, static variables inside functions, and file-internal static variables can be used.
Access Type
Operation
Read
Select [Break Settings] >> [Set Read Break to], and then press the [Enter] key.
Write
Select [Break Settings] >> [Set Write Break to], and then press the [Enter] key.
Read/Write
Select [Break Settings] >> [Set R/W Break to], and then press the [Enter] key.
At this time, if you have specified a value in the text box in the context menu, break will occur only when the specified value is used for the reading, writing or reading/writing. On the other hand, if no value is specified, reading.,
writing or reading/writing the selected variable by any value will cause the break to occur.
Caution 1.
Variables within the current scope can be specified.
Caution 2.
Variables or I/O register at lines that have no valid addresses cannot be used for break events.
Figure 2.80 Example of Setting Break Event (Access Type) on Variable in Editor Panel
From the context menu above the variable
global_a, enter a value in [Break Settings] >>
[Set Writ Break to], then press the [Enter] key.
Here, the program will break when the value
"0xb" is written to the variable global_a.
R20UT3456EJ0100 Rev.1.00
Aug 01, 2015
Page 68 of 281
CS+ V3.02.00
(2)
2. FUNCTIONS
Set a break event (access type) to a registered watch-expression
You can set break events in the Watch panel.
Follow the operation listed below from the context menu, in accordance with your desired access type, after
selecting the registered watch-expression (multiple selections not allowed).
Note, however, that only global variables, static variables inside functions, file-internal static variables, and I/O register can be used.
Access Type
Operation
Read
Select [Access Break] >> [Set Read Break to], and then press the [Enter] key.
Write
Select [Access Break] >> [Set Write Break to], and then press the [Enter] key.
Read/Write
Select [Access Break] >> [Set R/W Break to], and then press the [Enter] key.
At this time, if you have specified a value in the text box in the context menu, break will occur only when the specified value is used for the reading., writing or reading/writing. On the other hand, if no value is specified, reading.,
writing or reading/writing the selected watch-expression by any value will cause the break to occur.
Caution
A watch-expression within the current scope can be specified.
To target a watch-expression outside the current scope, select a watch-expression with a specified
scope.
Figure 2.81 Example of Setting Hardware Break Event (Access Type) on Watch-Expression
From the context menu above the watch-expression "global_a", enter a value in [Access Break] >>
[Set Write Break to], then press the [Enter] key.
Here, the program will break when the value "0xb"
is written to the watch-expression "global_a".
When you have performed the above operation, the set break event (access type) is managed in the Events panel
as a Hardware Break event (access type) (see "2.16 Manage Events" for details).
R20UT3456EJ0100 Rev.1.00
Aug 01, 2015
Page 69 of 281
CS+ V3.02.00
2. FUNCTIONS
Figure 2.82 Example of Setting Hardware Break Event (Access Type) in Events Panel
2.9.5.2 Delete a break event (access type)
To delete a break event (access type) you have set, select a Hardware Break event in the Events panel, and then click
the
button in the toolbar (see "2.16.4 Delete events").
2.9.6 Other break causes
The cause of the break other than the described above is as follows:
You can confirm the break cause with the Status message on the statusbar in the Main window, Output panel, or Trace
panel [Simulator].
Table 2.6
Other Break Causes
Break Cause
Debug Tool
Full-spec emulator
E1/E20
An access to non-mapped area
-
-
A writing to write-protected area
-
-
Simulator
Full of the trace memoryNote 1
An occurrence of Temporary BreakNote 2
Step execution count-over
An occurrence of Relay BreakNote 3
Note 1.
The operation depends on the setting of the [Operation after trace memory is full] property in the [Trace]
category on the [Debug Tool Settings] tab of the Property panel.
Note 2.
A break that is internally used by CS+ (Users cannot use it.)
Note 3.
A break for a synchronous execution and a synchronous break, in a microcontroller that supports multicore
R20UT3456EJ0100 Rev.1.00
Aug 01, 2015
Page 70 of 281
CS+ V3.02.00
2. FUNCTIONS
2.10 Display/Change the Memory, Register and Variable
This section describes how to display/change the memory, register and variable.
Remark
For "Information of the memory, registers, or variables" for a microcontroller that supports multi-core, see
also to "Select a Core (PE)".
2.10.1 Display/change the memory
The contents of the memory can be displayed and its values can be changed in the Memory panel below.
Select the [View] menu >> [Memory] >> [Memory1 - 4]. The maximum of 4 Memory panels can be opened. Each panel
is identified by the names "Memory1", "Memory2", "Memory3" and "Memory4" on the titlebar.
For details on the contents and function in each area, see the section for the Memory panel.
Figure 2.83 Display Memory Contents
Toolbar
Display position specification area
Address area
Remark
Memory value area
Character strings area
You can set the scroll range (as start and end address) of the vertical scroll bar on this panel via the
Scroll Range Settings dialog box which is opened by clicking the
button from [View] on the toolbar.
This section describes the following.
2.10.1.1
2.10.1.2
2.10.1.3
2.10.1.4
2.10.1.5
2.10.1.6
2.10.1.7
Specify the display position
Change display format of values
Modify the memory contents
Display/modify the memory contents during program execution
Search the memory contents
Modify the memory contents in batch (initialize)
Save the memory contents
2.10.1.1 Specify the display position
It is possible to specify the display start position of the memory contents by specifying an address expression in the display position specification area (starting with address 0x0 by default).
Remark
An offset value of the display start position of memory values can be set via the Address Offset Settings
dialog box that is opened by selecting [Address Offset Value Settings...] from the context menu.
Figure 2.84 Display Position Specification Area (Memory Panel)
R20UT3456EJ0100 Rev.1.00
Aug 01, 2015
Page 71 of 281
CS+ V3.02.00
(1)
(2)
2. FUNCTIONS
Specify an address expression
Directly enter the address expression of the memory value address to display in the text box. You can specify an
input expression with up to 1024 characters. The result of the expression is treated as the display start position
address.
Note that address values greater than the microcontroller address space cannot be specified.
Remark 1.
A symbol name at the current caret position can be complemented by pressing the [Ctrl] + [Space]
key in this text box (see "2.18.2 Symbol name completion function").
Remark 2.
If the specified address expression is the symbol and its size can be recognized, everything from
the start address to the end address of that symbol is displayed selected.
Specify automatic/manual evaluation of the address expression
The timing to change the display start position can be determined by specifying in the [Move when Stop] check
box and the [Move] button.
[Move when
Stop]
The caret is moved to the address which is automatically calculated from the address
expression after the program is stopped.
The address expression is not automatically evaluated after the program is stopped.
Click the [Move] button to manually evaluate the address expression.
[Move]
When the [Move when Stop] check box is not checked, click this button to evaluate the
address expression and move the caret to the result address of the evaluation.
2.10.1.2 Change display format of values
The display format of the address area/memory value area/character strings area can be changed using buttons below
on the toolbar.
Notation
The following buttons to change the notation of memory values are displayed.
Hexadecimal
Displays memory values in hexadecimal number (default).
Signed Decimal
Displays memory values in signed decimal number.
Unsigned Decimal
Displays memory values in unsigned decimal number.
Octal
Displays memory values in octal number.
Binary
Displays memory values in binary number.
Size Notation
The following buttons to change the notation of sizes of memory values are displayed.
4 Bits
Displays memory values in 4-bit width.
1 Byte
Displays memory values in 8-bit width (default).
2 Bytes
Displays memory values in 16-bit width.
Values are converted depending on the endian of the target memory area.
4 Bytes
Displays memory values in 32-bit width.
Values are converted depending on the endian of the target memory area.
8 Bytes
Displays memory values in 64-bit width.
Values are converted depending on the endian of the target memory area.
R20UT3456EJ0100 Rev.1.00
Aug 01, 2015
Page 72 of 281
CS+ V3.02.00
2. FUNCTIONS
Encoding
The following buttons to change the encoding of character strings are displayed.
ASCII
Displays character strings in ASCII code (default).
Shift_JIS
Displays character strings in Shift-JIS code.
EUC-JP
Displays character strings in EUC-JP code.
UTF-8
Displays character strings in UTF-8 code.
UTF-16
Displays character strings in UTF-16 code.
Float
Displays character strings as a single-precision floating-point valueNote.
Double
Displays character strings as a double-precision floating-point valueNote.
Float Complex
Displays character strings as a complex number of single-precision floatingpointNote.
Double Complex
Displays character strings as a complex number of double-precision floatingpointNote.
Float Imaginary
Displays character strings as an imaginary number of single-precision floatingpointNote.
Double Imaginary
Displays character strings as an imaginary number of double-precision floatingpointNote.
View
The following buttons to change the display format are displayed.
Settings Scroll Range...
Opens the Scroll Range Settings dialog box to set the scroll range for this
panel.
Column Number Settings...
Opens the Column Number Settings dialog box to set the number of view columns in the memory value area.
Address Offset Value Settings...
Opens the Address Offset Settings dialog box to set an offset value for
addresses displayed in the address area.
Note
For details on the display of a floating-point value, see the section for the Memory panel.
2.10.1.3 Modify the memory contents
The memory values can be edited.
Directly edit from the keyboard after moving the caret to the line to modify in memory value area/characters area.
The color of the memory value changes when it is in editing. Press the [Enter] key to write the edited value to the target
memory (if the [Esc] key is pressed before the [Enter] key is pressed, the editing is cancelled).
However, the character string that can be inputted during the editing is limited to that character string that can be handled by the display notation that has been currently specified. In the character strings area, modification can only be made
with "ASCII" character code.
This operation can be taken place while the program is in execution. See "2.10.1.4 Display/modify the memory contents during program execution" for details on how to operate it.
When you modify the values, be aware of the following examples.
Example 1.
The value exceeds the upper limit of the display bit wide
If you edit the display value "105" as "1" to "3" in the decimal 8-bit display, the value will be changed to
the upper limit of "127".
Example 2.
The symbol, "-" is entered between numbers
If you edit the display value "32768" as "32-68" with signed decimal 16-bit display, "3" and "2" are
changed to the blank and the value is changed to "-68".
Example 3.
The blank symbol (space) is entered between numbers
If you edit the display value "32767" as "32 67", "3" and "2" are changed to the blank and the value is
changed to "67".
R20UT3456EJ0100 Rev.1.00
Aug 01, 2015
Page 73 of 281
CS+ V3.02.00
Example 4.
2. FUNCTIONS
The same value is entered
Even if the same value as the current memory value is specified, the specified value is written to the
memory.
2.10.1.4 Display/modify the memory contents during program execution
The Memory panel/Watch panel has the real-time display update function that can update/modify the display contents of
the memory/watch-expression in real-time while executing the program.
Using the real-time display update function allows you to display/modify the value of memory/watch-expression not only
while the program is stopped, but also in execution.
The real-time display update function is realized by the CPU's/debug tool's RRM function (reading) [Simulator], RAM
monitor function (reading) [Full-spec emulator][E1][E20] and DMM function (modifying). Each function has a different area
that can be used for reading and writing.
Enable the real-time display update function by making the basic settings below on the [Debug Tool Settings] tab of the
Property panel.
Table 2.7
Basic Settings for Real-time Display Update Function
Category
Property
Set Value
[Access memory while running]
[Update display during the execution]
[Yes] (default)
[Display update interval[ms]]
[Integer number between 100 and 65500]
Caution 1.
Local variables are not subject to the real-time display update function.
Caution 2.
When a 2-, 4-, or 8-byte variable is to be read through the RRM or RAM monitor function, the process of
assigning a value to the variable may be divided into two steps.
If reading of the variable takes place between the two steps, an incorrect value may be read out because
the assignment is not completed.
Caution 3.
The contents of memory or watch expressions can be read for access in all PEs when the selected
microcontroller supports multi-core. In the Local RAM self area, note that they can be read only for the
access in the currently selected PE.
Remark
See "2.10.1.3 Modify the memory contents" or "2.10.6.6 Modify the contents of watch-expressions" for
details on how to modify values in the Memory panel/Watch panel.
(1)
RRM function (reading) [Simulator]
This function is used to read the contents of memory or of watch-expressions in real-time during execution of a
program.
The following area can be read by the RRM function. Memory and watch-expressions allocated to this area can
always be displayed in real-time.
Table 2.8
Target Area of RMM Function
Area
Simulator
Internal ROM
Internal RAM
Peripheral I/O area
-
Data flash
-
Emulation memory
-
Target memory
Note
CPU register
I/O register
(except read-protected I/O registers)
Note
Impossible during tracer/timer execution
R20UT3456EJ0100 Rev.1.00
Aug 01, 2015
Page 74 of 281
CS+ V3.02.00
(2)
2. FUNCTIONS
RAM monitor function (reading) [Full-spec emulator][E1][E20]
This function is used to read the contents of memory or a watch-expression via the CPU's RAM monitor function.
The following area can be read by the RAM monitor function.
Caution
Table 2.9
If CPU status shifts to the standby mode (HALT/STOP/IDLE) mode, a monitor time-out error will
occur.
Target Area of RAM Monitor Function
Area
Full-spec emulator
E1/E20
-
-
Peripheral I/O area
-
-
Data flash (except ID tag)
-
-
Target memory
-
-
CPU register
-
-
I/O register
-
-
Internal ROM
Internal RAM
Note that to enable the RAM monitor function, the setting below is required in addition to the Basic Settings for
Real-time Display Update Function.
Debug Tool
Category
Full-spec emulator
E1/E20
(3)
Property
[Access memory while running]
[Access during the execution]
Set Value
[Yes]
DMM function (modifying)
This function is used to write to the memory or watch-expressions in real-time during execution of a program.
The following area can be modified by the DMM function.
Caution 1.
If a value is written through the DMM function, the atomicity cannot be guaranteed.
Caution 2.
If CPU status shifts to the standby mode (HALT/STOP/IDLE) mode, a monitor time-out error will
occur.
Table 2.10
Target Area of DMM Function
Area
Full-spec emulator
E1/E20
-
-
Peripheral I/O area
-
-
-
Emulation memory
-
-
-
Target memory
-
-
-
CPU register
-
-
I/O register
(except read-protected I/O registers)
-
-
Internal ROM
Simulator
Internal RAM
Note
Note
Impossible during tracer/timer execution
To enable the DMM function, the setting below is required in addition to the Basic Settings for Real-time Display
Update Function.
R20UT3456EJ0100 Rev.1.00
Aug 01, 2015
Page 75 of 281
CS+ V3.02.00
2. FUNCTIONS
Debug Tool
Category
Full-spec emulator
E1/E20
[Access memory while running]
Simulator
No setting is required.
Property
[Access during the execution]
Set Value
[Yes]
The memory values/watch-expressions updated by the real-time display update function are highlighted in pink on the
Memory panel/Watch panel.
Figure 2.85 Example of Memory Display by Real-time Display Update Function
2.10.1.5 Search the memory contents
Values of memory can be searched in the Memory Search dialog box that is opened by selecting [Find...] from the context menu. The search is operated either in the memory value area or character strings area, in which the caret exists. In
this dialog box, follow the steps below.
Figure 2.86 Search Memory Contents (Memory Search Dialog Box)
Caution 1.
The contents of the memory cannot be searched during execution of a program.
Caution 2.
Character strings displayed as floating-point values cannot be searched.
(1)
Specify [Search Data]
Specify data to search.
You can either type a value directly into the text box (up to 256 bytes), or select one from the input history via the
drop-down list (up to 10 items).
If the search is performed in the memory value area, the value must be entered in the same display format (notation and size) as that area.
R20UT3456EJ0100 Rev.1.00
Aug 01, 2015
Page 76 of 281
CS+ V3.02.00
2. FUNCTIONS
If the search is performed in the character strings area, then the target of the search must be a string. The specified string is converted into the encoding format displayed in that area, and searched for.
If a memory value was selected immediately prior to opening this dialog box, then that value will appear as default.
(2)
(3)
(4)
Specify [Search Range]
Select the range to search from the following drop-down list.
Specify address range
Searches in the address range specified in the [Address] area.
Memory mapping
Searches within the selected memory mapping range.
This list item displays individual memory mapping configured in the Memory Mapping dialog box.
Display format: <memory type> <address range> <size>
Specify [Address]
This item is only enabled if [Specify address range] is selected in the (2) Specify [Search Range].
Specify the range of memory address to search via the start and end addresses. You can either type address
expressions directly into the text boxes (up to 1024 characters), or select them from the input history via the dropdown list (up to 10 items).
The results of calculating the address expressions you have entered are treated as start and end addresses,
respectively.
Note, however, that the largest address that can be searched is the maximum address of the program space
(0x03FFFFFF) (the mirror area cannot be searched).
An address value greater than the value expressed within 32 bits cannot be specified.
Remark 1.
A symbol name at the current caret position can be complemented by pressing the [Ctrl] + [Space]
key in each text box (see "2.18.2 Symbol name completion function").
Remark 2.
If the start address field is left blank, it is treated as if "0x0" were specified.
Remark 3.
If the end address field is left blank, then it is treated as if the maximum value in the microcontroller's address space were specified.
Click the [Search Backward]/[Search Forward] button
When the [Search Backward] button is clicked, search will start in the order from the large address number to
small and the search results are displayed selected in the Memory panel.
When the [Search Forward] button is clicked, search will start in the order from the small address number to small
and the search results are displayed selected in the Memory panel.
2.10.1.6 Modify the memory contents in batch (initialize)
Contents of the memory can be modified in batch (initialize).
When [Fill...] from the context menu is selected, the Memory Initialize dialog box opens to modify the memory value of
the specified address range in batch.
In this dialog box, follow the steps below.
Figure 2.87 Modify Memory Contents in Batch (Memory Initialize Dialog Box)
(1)
Specify [Start address/symbol] and [End address/symbol]
Specify the range of memory address to initialize via the [Start address/symbol] and [End address/symbol]. You
can either type address expressions directly into the text boxes (up to 1024 characters), or select them from the
input history via the drop-down list (up to 10 items).
The results of calculating the address expressions you have entered are treated as start and end addresses,
respectively.
R20UT3456EJ0100 Rev.1.00
Aug 01, 2015
Page 77 of 281
CS+ V3.02.00
2. FUNCTIONS
Note that address values greater than the microcontroller address space cannot be specified.
(2)
Caution
You cannot specify the range of address aligned across the different endian area.
Remark
A symbol name at the current caret position can be complemented by pressing the [Ctrl] + [Space]
key in each text box (see "2.18.2 Symbol name completion function").
Specify [Initialize data]
Specify the initializing data to write to the memory.
You can either type the initial value into the text box directly in hexadecimal number, or select one from the input
history via the drop-down list (up to10 items).
You can specify more than one initial value. Specify up to 16 values of up to 4 bytes (8 characters) each, separated by spaces.
Each initial value is parsed from the end of the string, with each two characters interpreted as a byte.
If the string has an odd number of characters, then the first character is interpreted as one byte.
Note that if a initial value consists of more than one byte, then the target memory is overwritten with the value converted into an array of bytes of the specified address range's endian, as follows:
Input Character Strings
(Initial Value)
(3)
How Data is Overwritten (in Bytes)
Little Endian
Big Endian
1
01
01
0 12
00 12
00 12
00 012 345
00 12 00 45 03
00 00 12 03 45
000 12 000345
00 00 12 45 03 00
00 00 12 00 03 45
Click the [OK] button
Click the [OK] button.
The memory area in the specified address range is repeatedly overwritten with the specified initial data pattern. If
the end address is reached in the middle of the pattern, then writing ends at that point.
Note that if an illegal value is specified, a message will appear, and the memory value will not be initialized.
2.10.1.7 Save the memory contents
Contents of the memory can be saved with range selection in text files (*.txt)/CSV files (*.csv).
When saving to the file, the latest information is acquired from the debug tool, and it is saved in accordance with the display format on this panel.
The Data Save dialog box can be opened by selecting the [File] menu >> [Save Memory Data As...] (when this operation is taken place with range selection on the panel, the memory data only in the selected range is saved).
In this dialog box, follow the steps below.
Figure 2.88 Save Memory Data (Data Save Dialog Box)
(1)
Specify [File Name]
Specify the name of the file to save.
R20UT3456EJ0100 Rev.1.00
Aug 01, 2015
Page 78 of 281
CS+ V3.02.00
2. FUNCTIONS
You can either type a filename directly into the text box (up to 259 characters), or select one from the input history
via the drop-down list (up to 10 items). You can also specify the file by clicking the [...] button, and selecting a file
via the Select Data Save File dialog box.
(2)
Specify [File Type]
Select the format in which to save the file from the following drop-down list.
The following file formats can be selected.
List Item
Text files (*.txt)
Text format (default)
CSV (Comma-Separated Variables)(*.csv)
CSV formatNote
Note
(3)
The data is saved with entries separated by commas (,).
If the data contains commas, each entry is surrounded by double quotes "" in order to avoid illegal
formatting.
Specify [Save Range Address/Symbol]
Specify the range of addresses to save via "start address" and "end addresses".
Directly enter hexadecimal number/address expression in each text box or select from the input history displayed
in the drop-down list (up to 10 items).
If a range is selected in the panel, that range is specified as the default. If there is no selection, then the range
currently visible in the panel is specified.
Remark
(4)
Format
A symbol name at the current caret position can be complemented by pressing the [Ctrl] + [Space]
key in each text box (see "2.18.2 Symbol name completion function").
Click the [Save] button
Saves the memory data to a file with the specified filename, in the specified format.
Figure 2.89 Output Example of Memory Data
[Text files (*.txt)]
(Hexadecimal notation/8-bit width/ASCII code)
+0 +1 +2 +3 +4 +5 +6 +7 +8 +9 +a +b +c +d +e +f
00000000 | 00 00 00 00 00 00 00 00 00 00 00 00 00 00 00 00 |
00000010 | 11 11 11 11 11 11 11 11 11 11 11 11 11 11 11 11 |
[CSV files (*.csv)]
(Hexadecimal notation/8-bit width/ASCII code)
00000000,00,00,00,00,00,00,00,00,00,00,00,00,00,00,00,00,
00000010,11,11,11,11,11,11,11,11,11,11,11,11,11,11,11,11,
Remark
When the contents of the panel are overwritten by selecting the [File] menu>> [Save Memory Data],
each Memory panel (Memory1-4) is treated as a different panel.
In addition, saving range is same as the previously specified address range.
2.10.2 Display/change the CPU register
The contents of the CPU register (program registers/system registers) can be shown and the value can be changed in
the CPU Register panel below.
Select the [View] menu >> [CPU Register].
For details on the contents and function in each area, see the section for the CPU Register panel.
R20UT3456EJ0100 Rev.1.00
Aug 01, 2015
Page 79 of 281
CS+ V3.02.00
2. FUNCTIONS
Figure 2.90 Display the Contents of CPU Register (CPU Register Panel)
Toolbar
[Register Name] area
[Value] area
This section describes the following.
2.10.2.1
2.10.2.2
2.10.2.3
2.10.2.4
Change display format of values
Modify the CPU register contents
Display/modify the CPU register contents during program execution
Save the CPU register contents
2.10.2.1 Change display format of values
The display format of the [value] area can be changed using buttons below on the toolbar.
Notation
The following buttons to change the notation of a data value are displayed.
AutoSelect
Displays the value of the selected item (including sub-items) in the default notation
(default).
Hexadecimal
Displays the value of the selected item (including sub-items) in hexadecimal number.
Signed Decimal
Displays the value of the selected item (including sub-items) in signed decimal number.
Unsigned Decimal
Displays the value of the selected item (including sub-items) in unsigned decimal number.
Octal
Displays the value of the selected item (including sub-items) in octal number.
Binary
Displays the value of the selected item (including sub-items) in binary number.
ASCII
Displays the character strings of the selected item (including sub-items) in ASCII code.
If the character size is 2 bytes and above, it is displayed with the characters for each 1
byte arranged side-by-side.
Float
Displays the value of the selected item in float.
Note that when the value is not 4-byte data, displays it in the default notation.
Double
Displays the value of the selected item in double.
Note that when the value is not 8-byte data, displays it in the default notation.
Adds the value in hexadecimal number enclosing with "()" at the end of the value.
2.10.2.2 Modify the CPU register contents
The CPU register values can be edited.
R20UT3456EJ0100 Rev.1.00
Aug 01, 2015
Page 80 of 281
CS+ V3.02.00
2. FUNCTIONS
Select the value of the CPU register to edit in the [Value] area, then click on it again to switch the value to edit mode
(press the [Esc] key to cancel the edit mode).
To write the edited value to the target memory, directly enter the value from the keyboard then press the [Enter] key.
Caution
This operation cannot be performed during program execution.
2.10.2.3 Display/modify the CPU register contents during program execution
By registering a CPU register to the Watch panel as a watch-expression, the value of the CPU register can be displayed/modified not only while the program is stopped, but in execution.
See "2.10.6 Display/change watch-expressions" for details on the watch-expression.
2.10.2.4 Save the CPU register contents
The Save As dialog box can be opened by selecting the [File] menu >> [Save CPU Register Data As...], and all the contents in the CPU register can be saved to a text file (*.txt) or CSV file (*.csv).
When saving to files, retrieve the latest information from the debug tool.
Figure 2.91 Output Example of CPU Register Data
Register name
Value
---------------------------------------------------------------------Category name
-Register name
Value
:
:
2.10.3 Display/change the I/O register
Contents of the I/O register can be displayed and its values can be changed in the IOR panel below.
Select the [View] menu >> [IOR].
For details on the contents and function in each area, see the section for the IOR panel.
Figure 2.92 Display the Contents of I/O register (IOR Panel)
Toolbar
Search area
[IOR] area
[Value] area
[Type (Byte Size)] area
[Address] area
This section describes the following.
2.10.3.1
2.10.3.2
2.10.3.3
2.10.3.4
Search for an I/O register
Organize I/O registers
Change display format of values
Modify the I/O register contents
R20UT3456EJ0100 Rev.1.00
Aug 01, 2015
Page 81 of 281
CS+ V3.02.00
2. FUNCTIONS
2.10.3.5 Display/modify the I/O register contents during program execution
2.10.3.6 Save the I/O register contents
2.10.3.1 Search for an I/O register
An I/O register can be searched for.
Specify the I/O register name to search with the text box in the search area (case-insensitive). You can either type character strings directly from the key board (up to 512 characters), or select one from the input history via the drop-down list
(up to 10 items). Then, click either one of the following button.
Searches up for the I/O register name containing the string specified in the text box, and selects
the I/O register that is found.
Searches down for the I/O register name containing the string specified in the text box, and
selects the I/O register that is found.
Remark 1.
The hidden I/O register name being classified with a category can be searched (the category is opened
and the I/O register is selected).
Remark 2.
After typing character strings to search, to press the [Enter] key is the same function as clicking the
button, and to press the [Shift] + [Enter] key is the same function as clicking the
button.
2.10.3.2 Organize I/O registers
The each I/O register can be categorized (by folders) and displayed in the tree view.
Caution 1.
Categories cannot be created within categories.
Caution 2.
I/O registers cannot be added or deleted.
(1)
Create new category
Move the caret to the I/O register name to create a new category then click the
directly enter the new category name.
button in the toolbar and
(2)
Edit category name
Click the category name to edit, and click it again, then directly modify the category name from the keyboard.
(3)
Delete categories
Select categories to delete then click the
button in the toolbar.
However, the categories that can be deleted are only the empty categories.
(4)
Change the display order
I/O register name is categorized when I/O register is dragged and dropped in the category.
Also, the display order of the categories and the I/O register names (upper or lower position) can be changed easily by drag and drop operation.
2.10.3.3 Change display format of values
The display format of the [value] area can be changed using buttons below on the toolbar.
Notation
The following buttons to change the notation of a data value are displayed.
Hexadecimal
Displays the value of the selected item in hexadecimal number (default).
Signed Decimal
Displays the value of the selected item in signed decimal number.
Unsigned Decimal
Displays the value of the selected item in unsigned decimal number.
Octal
Displays the value of the selected item in octal number.
Binary
Displays the value of the selected item in binary number.
ASCII
Displays the value of the selected item in ASCII code.
Adds the value in hexadecimal number enclosing with "()" at the end of the value of the
selected item.
R20UT3456EJ0100 Rev.1.00
Aug 01, 2015
Page 82 of 281
CS+ V3.02.00
2. FUNCTIONS
2.10.3.4 Modify the I/O register contents
The I/O register values can be edited.
Select the value of the I/O register to edit in the [Value] area, then click on it again to switch the value to edit mode
(press the [Esc] key to cancel the edit mode).
To write the edited value to the target memory, directly enter the value from the keyboard then press the [Enter] key.
Caution 1.
This operation cannot be performed during program execution.
Caution 2.
The value of the read-only I/O register cannot be edited.
Remark 1.
If a number with fewer digits than the size of the I/O register is entered, the higher-order digits will be padded with zeroes.
Remark 2.
If a number with more digits than the size of the I/O register is entered, the higher-order digits will be
masked.
Remark 3.
ASCII characters can be entered to the I/O register value.
- When the numeric "0x41" is written to the I/O register "OSTMnXX"
>> "0x41" is written in the port "OSTMnXX".
- When the ASCII character "'A'" is written to the I/O register "OSTMnXX"
>> "0x41" is written in the port "OSTMnXX".
2.10.3.5 Display/modify the I/O register contents during program execution
By registering an I/O register to the Watch panel as a watch-expression, the value of the I/O register can be displayed/
modified not only while the program is stopped, but in execution.
See "2.10.6 Display/change watch-expressions" for details on the watch-expression.
2.10.3.6 Save the I/O register contents
The Save As dialog box can be opened by selecting the [File] menu >> [Save IOR Data As...], and all the contents of the
I/O register can be saved in a text file (*.txt) or CSV file (*.csv). At this time, the values of all I/O registers become targets
irrespective of the setting of display/non-display on this panel. When saving the contents to the file, the values of the I/O
register are reacquired and save the latest values acquired.
Note that the values of read-protected I/O register are not re-read. If you want to save the latest values of those, select
[Force Read Value] from the context menu then save the file.
Figure 2.93 Output Example of I/O register
IOR name
Value
Type (Byte Size)
Address
------------------------------------------------------------Category name
-IOR name
Value
Type (Byte Size)
Address
:
:
:
:
2.10.4 Display/change global variables/static variables
Global variables or static variables are displayed and its values can be changed in the Watch panel.
Register the variables to display/modify their values to the Watch panel as the watch-expressions.
For details, see "2.10.6 Display/change watch-expressions".
2.10.5 Display/change local variables
Contents of local variables can be displayed and its values can be changed in the Local Variables panel below.
Select the [View] menu >> [Local Variable].
Specify the scope in the scope area to display the contents of the target local variable.
In the Local Variables panel, the name of local variables and functions are displayed. The argument of the function is
also displayed as the local variable.
For details on the contents and function in each area, see the section for the Local Variables panel.
R20UT3456EJ0100 Rev.1.00
Aug 01, 2015
Page 83 of 281
CS+ V3.02.00
2. FUNCTIONS
Figure 2.94 Display the Contents of Local Variables (Local Variables Panel)
Toolbar
Scope area
[Name] area
Caution
[Value] area
[Type (Byte Size)] area
[Address] area
Nothing is displayed on this panel during execution of a program.
When the program is stopped, items in each area are displayed.
This section describes the following.
2.10.5.1 Change display format of values
2.10.5.2 Modify the contents of local variables
2.10.5.3 Save the contents of local variables
2.10.5.1 Change display format of values
The display format of the [value] area can be changed using buttons below on the toolbar.
Notation
The following buttons to change the notation of a data value are displayed.
AutoSelect
Displays values on this panel in the default notation according to the
type of variable (default).
Hexadecimal
Displays values on this panel in hexadecimal number.
Decimal
Displays values on this panel in decimal number.
Octal
Displays values on this panel in octal number.
Binary
Displays values on this panel in binary number.
Decimal Notation for Array Index
Displays array indexes on this panel in decimal number (default).
Hexadecimal Notation for Array Index
Displays array indexes on this panel in hexadecimal number.
Float
Displays values on this panel in float.
Note that when the value is not 4-byte data, or has the type information, displays it in the default notation.
Double
Displays values on this panel in double.
Note that when the value is not 4-byte data, or has the type information, displays it in the default notation.
Adds the value in hexadecimal number enclosing with "()" at the end
of the value.
Encoding
R20UT3456EJ0100 Rev.1.00
Aug 01, 2015
The following buttons to change the encoding of character variables
are displayed.
Page 84 of 281
CS+ V3.02.00
2. FUNCTIONS
ASCII
Displays character variables in ASCII code (default).
Shift_JIS
Displays character variables in Shift-JIS code.
EUC-JP
Displays character variables in EUC-JP code.
UTF-8
Displays character variables in UTF-8 code.
UTF-16
Displays character variables in UTF-16 code.
2.10.5.2 Modify the contents of local variables
Values and arguments of local variables can be edited.
Select the value of the local variables/arguments to edit in the [Value] area, then click on it again to switch the value to
edit mode (press the [Esc] key to cancel the edit mode).
To write the edited value to the target memory, directly enter the value from the keyboard then press the [Enter] key. At
this time, the edited value is checked and if it is incompatible with the type, the editing is invalidated.
Caution
This operation cannot be performed during program execution.
Remark 1.
If a number with fewer digits than the size of the variable is entered, the higher-order digits will be padded
with zeroes.
Remark 2.
If a number with more digits than the size of the variable is entered, the higher-order digits will be
masked.
Remark 3.
If the display format of a character array (type char or unsigned char) is set to ASCII, then the value can
also be entered as a string (ASCII/Shift-JIS/EUC-JP/Unicode (UTF-8/UTF-16)).
Remark 4.
ASCII characters can be entered to values of local variables.
- Entering via an ASCII character
In the [Value] area for the variable "ch", enter "'A'"
>> "0x41" will be written to the memory area allocated to "ch"
- Entering via a numeric value
In the [Value] area for the variable "ch", enter "0x41"
>> "0x41" will be written to the memory area allocated to "ch"
- Entering via an ASCII string
Set the display format of character array "str" to ASCII, and in the [Value] area, enter ""ABC""
>> "0x41, 0x42, 0x43, 0x00" will be written to the memory area allocated to "str"
2.10.5.3 Save the contents of local variables
The Save As dialog box can be opened by selecting the [File] menu >> [Save Local Variables Data As...], and all the
contents in the local variables can be saved in a text file (*.txt) or CSV file (*.csv).
When saving to files, retrieve the latest information from the debug tool. If arrays, pointer type variables, structures/
unions, and CPU registers (only those with the part name) are displayed expanded, the value of each expanded element
is also saved. When they are not expanded, "+" mark is added on the top of the item and the value becomes blank.
Figure 2.95 Output Example of Local Variables
Scope : Current scope
[V]Variable [P]Parameter [F]Function
Name
Value
Type (Byte Size)
Address
-------------------------------------------------------[V]Variable name[1]
Value
Type
Address
- [V]Variable name[0]
Value
Type
Address
:
:
:
:
R20UT3456EJ0100 Rev.1.00
Aug 01, 2015
Page 85 of 281
CS+ V3.02.00
2. FUNCTIONS
2.10.6 Display/change watch-expressions
By registering C language variables, CPU register, I/O register, and assembler symbols to the Watch panel as watchexpressions, you can always retrieve their values from the debug tool and monitor the values in batch.
The values of watch-expressions can be updated during the program is in execution (see "2.10.6.7 Display/modify the
contents of watch-expressions during program execution").
Select the [View] menu >> [Watch] >> [Watch1 - 4] to open the Watch panel.
The Watch panel can be opened up to 4 panels. Each panel is identified by the names "Watch1", "Watch2", "Watch3"
and "Watch4" on the titlebar, and the watch-expressions can be registered/deleted/moved individually, and they are saved
as the user information of the project.
For details on the contents and function in each area, see the section for the Watch panel.
Figure 2.96 Display the Contents of Watch-Expression (Watch Panel)
Toolbar
[Watch] area
[Value] area
[Type (Byte Size)] area
[Address] area
[Memo] area
This section describes the following.
2.10.6.1
2.10.6.2
2.10.6.3
2.10.6.4
2.10.6.5
2.10.6.6
2.10.6.7
2.10.6.8
2.10.6.9
Register a watch-expression
Organize the registered watch-expressions
Edit the registered watch-expressions
Delete a watch-expression
Change display format of values
Modify the contents of watch-expressions
Display/modify the contents of watch-expressions during program execution
Export/import watch-expressions
Save the contents of watch-expressions
2.10.6.1 Register a watch-expression
There are three ways as follows to register watch-expressions (watch-expressions are not registered as default).
Caution 1.
Watch-expressions can be registered up to 3000 in one watch panel (if this restriction is violated, a message appears).
Caution 2.
Due to compiler optimization, the data for the target variable may not be on the stack or in a register in
blocks where that variable is not used. In such cases, if the variable is registered as a watch-expression,
then the value will be displayed as a question mark "?".
Remark 1.
Each watch-expression registered in each watch panel (Watch1 to Watch4) is managed in each panel
and saved as the user information of the project.
Remark 2.
More than one watch-expression with the same name can be registered.
(1)
Register from other panels
Watch-expressions can be registered from other panel in CS+.
In other panel, drag and drop the watch-expression to register in any watch panel (Watch1 to Watch4).
For the relationship between panels that can use this operation and targets that can be registered as watchexpressions, see "Table A.2 Relationship between Panels and Targets That Can be Registered as Watch-Expressions".
R20UT3456EJ0100 Rev.1.00
Aug 01, 2015
Page 86 of 281
CS+ V3.02.00
2. FUNCTIONS
Figure 2.97 Registering Watch-Expressions from Other Panels
Here, the variable "global_val01++" in the Disassemble panel will be registered as a watch-expression.
drag and drop on the Watch panel after selecting the
variable "global_val01++" in the Disassemble panel.
Remark
(2)
You can also add a watch-expression by doing the following. First, select the target for which you
wish to register a watch-expression, or move the caret to one of the target strings (the target is
determined automatically). Next, from the context menu, select [Register Watch1] (but this is limited
to the Watch panel (Watch 1)).
Directly register in the Watch panel
Click the
button in the toolbar in any the Watch panel (Watch1 to Watch4) to display the following entry box in
the [Watch] area.
Figure 2.98 Entry Box of Watch-Expression
Directly enter a watch-expression in this area.
Directly input a watch-expression from the keyboard in the entry box then press the [Enter] key.
For the input forms of watch-expressions entered this way, see the tables listed below.
- "Table 2.26 Basic Input Format of Watch-expressions"
- "Table A.3 Handling of a C Language Function When Registered in Watch by Specifying Scope"
- "Table A.5 Handling of a CPU Register When Registered in Watch by Specifying Scope"
- "Table A.6 Handling of an I/O Register when Registered in Watch by Specifying Scope"
Remark
(3)
A symbol name at the current caret position can be complemented by pressing the [Ctrl] + [Space]
key in this area (see "2.18.2 Symbol name completion function").
Register from other application
Select the character strings of C language variables/CPU registers/I/O register/assembler symbols from an external editor and drag and drop it in the Watch panel (Watch 1 to Watch 4).
The dropped character strings are registered as a watch-expression.
R20UT3456EJ0100 Rev.1.00
Aug 01, 2015
Page 87 of 281
CS+ V3.02.00
2. FUNCTIONS
2.10.6.2 Organize the registered watch-expressions
Registered watch-expressions can be organized in categories (folders) and displayed in tree view (there is no category
as default).
Caution 1.
Categories cannot be created within categories.
Caution 2.
Up to 1500 categories can be created in one watch panel (if this restriction is violated, a message
appears).
(1)
Create new category
Move the caret to the position to create a new category then click the
the new category name.
button in the toolbar and directly enter
(2)
Edit category name
Click the category name to edit, and click it again, then directly modify the category name from the keyboard.
(3)
Delete categories
Select categories to delete then click the
(4)
button in the toolbar.
Change the display order
Registered watch-expressions are categorized when they are dragged and dropped in the category.
Also, the display order of the categories and the watch-expressions (upper or lower position) can be changed easily by drag and drop operation.
Remark
Drag and drop the watch-expressions/categories in other watch panel (Watch1 to Watch4) to copy
them.
2.10.6.3 Edit the registered watch-expressions
Registered watch-expressions can be edited.
Double-click the watch-expression to edit to switch the watch-expression to edit mode (press the [Esc] key to cancel the
edit mode).
Directly edit from the keyboard and then press the [Enter] key.
2.10.6.4 Delete a watch-expression
To delete watch-expressions, select the one you want to delete in the Watch panel then click the
bar.
button in the tool-
2.10.6.5 Change display format of values
The display format of the [value] area can be changed using buttons below on the toolbar.
Notation
The following buttons to change the notation of a data value are displayed.
R20UT3456EJ0100 Rev.1.00
Aug 01, 2015
Page 88 of 281
CS+ V3.02.00
2. FUNCTIONS
AutoSelect
Displays the value of the selected watch-expression in the default notation (see "Table
A.7 Display Format of Watch-Expressions (Default)") according the type of variable
(default).
Hexadecimal
Displays the value of the selected item in hexadecimal number.
Signed Decimal
Displays the value of the selected item in signed decimal number.
Unsigned Decimal
Displays the value of the selected item in unsigned decimal number.
Octal
Displays the value of the selected item in octal number.
Binary
Displays the value of the selected item in binary number.
ASCII
Displays the value of the selected item in ASCII code.
Float
Displays the value of the selected item in float.
Note that this item becomes valid only when the selected watch-expression value is 4byte data.
Double
Displays the value of the selected item in double.
Note that this item becomes valid only when the selected watch-expression value is 8byte data.
Adds the value in hexadecimal number enclosing with "()" at the end of the value of the
selected item (except the item displayed in hexadecimal number).
2.10.6.6 Modify the contents of watch-expressions
The values of watch-expressions can be edited.
Double-click the value of the watch-expression to edit in the [Value] area to switch the value to edit mode (press the
[Esc] key to cancel the edit mode).
To write the edited value to the target memory, directly enter the value from the keyboard then press the [Enter] key.
Note that only those values that correspond one by one to variables of C language, CPU registers, I/O register or
assembler symbols can be edited. In addition, read-only I/O register values cannot be edited.
This operation can be taken place while the program is in execution. See "2.10.1.4 Display/modify the memory contents during program execution" for details on how to operate it.
Remark 1.
If a number with fewer digits than the size of the variable is entered, the higher-order digits will be padded
with zeroes.
Remark 2.
If a number with more digits than the size of the variable is entered, the higher-order digits will be
masked.
Remark 3.
If the display format of a character array (type char or unsigned char) is set to ASCII, then the value can
also be entered as a string (ASCII/Shift-JIS/EUC-JP/Unicode (UTF-8/UTF-16)).
Remark 4.
ASCII characters can be entered to values of watch-expressions.
- Entering via an ASCII character
In the [Value] area for the variable "ch", enter "'A'"
>> "0x41" will be written to the memory area allocated to "ch"
- Entering via a numeric value
In the [Value] area for the variable "ch", enter "0x41"
>> "0x41" will be written to the memory area allocated to "ch"
- Entering via an ASCII string
Set the display format of character array "str" to ASCII, and in the [Value] area, enter ""ABC""
>> "0x41, 0x42, 0x43, 0x00" will be written to the memory area allocated to "str"
2.10.6.7 Display/modify the contents of watch-expressions during program execution
The Memory panel/Watch panel has the real-time display update function that can update/modify the display contents of
the memory/watch-expression in real-time while executing the program.
Using the real-time display update function allows you to display/modify the value of memory/watch-expression not only
while the program is stopped, but also in execution.
R20UT3456EJ0100 Rev.1.00
Aug 01, 2015
Page 89 of 281
CS+ V3.02.00
2. FUNCTIONS
See "2.10.1.4 Display/modify the memory contents during program execution" for details on how to operate it.
2.10.6.8 Export/import watch-expressions
This feature is for the export of currently registered watch-expressions to a file and the importing of such files, enabling
the re-registration of watch-expressions.
To do this, follow the procedure described below.
(1)
Export watch-expressions
Save watch-expressions currently being registered (including categories) in a file format that is possible to import.
With the Watch panel in focus, select [Save Watch Data As...] from the [File] menu.
On the Save As dialog box that is automatically opened, specify the following items, and then click the [Save] button.
[File name]: Specify the name of a file to be saved (the file extension must be "csv").
[Save as type]:Select "Importable CSV (Comma-Separated Variables)(*.csv)"
Caution
Neither values nor the type information of watch-expressions can be saved.
Items that are expanded after analyzing watch-expressions (i.e. an array, structure, and so on) cannot be saved.
Figure 2.99 Export of Watch-Expressions
(2)
Import watch-expressions
Import the file that exported in (1) to the Watch panel.
On the Watch panel to which you want to import watch-expressions, select [Import Watch Expression] from the
context menu.
On the Open Watch Expression Data File dialog box that is automatically opened, specify the file that exported
previously, and then click the [Open] button.
Remark
If watch-expressions have been already registered, then imported watch-expressions will be registered at the bottom of them.
R20UT3456EJ0100 Rev.1.00
Aug 01, 2015
Page 90 of 281
CS+ V3.02.00
2. FUNCTIONS
Figure 2.100 Import of Watch-Expressions
2.10.6.9 Save the contents of watch-expressions
By selecting the [File] menu >> [Save Watch Data As...] or selecting [Save Expanded Watch Data…] from the context
menu, the Save As dialog box can be opened, and all the contents of the watch-expression and its value can be saved in
a text file (*.txt) or CSV file (*.csv).
When saving the contents to the file, all the values of the watch-expression are reacquired and save the latest values
acquired.
Note that the values of read-protected I/O register are not re-read. If you want to save the latest values of those, select
[Force Read Value] from the context menu then save the file.
Note that for watch-expressions that can be displayed expanded, such as arrays, pointer type variables, structures/
unions, and CPU registers (only those with the part name), the behavior differs depending on whether the watch-expression is saved with [Save Watch Data As...] or [Save Expanded Watch Data…].
- When saved with [Save Watch Data As...]
If arrays, pointer type variables, structures/unions, and CPU registers (only those with the part name) are displayed
expanded, the value of each expanded element is also saved. When they are not expanded, "+" mark is added on
the top of the item and the value becomes blank.
- When saved with [Save Expanded Watch Data…]
The watch-expression is expanded up to the maximum 255 nests regardless of the expanded state, and the value of
each expanded element is also saved.
Figure 2.101 Output Example of Watch Data
Watch-expression
Value
Type(Byte Size)
Address
Memo
-----------------------------------------------------------------Watch-expression
Value
Type(Byte Size)
Address
Memo
-Category name
Watch-expression Value
Type(Byte Size)
Address
Memo
:
:
:
:
:
Remark
When the contents of the panel are overwritten by selecting the [File] menu >> [Save Watch Data], each
watch panel (Watch1 to Watch4) is treated as a different panel.
R20UT3456EJ0100 Rev.1.00
Aug 01, 2015
Page 91 of 281
CS+ V3.02.00
2. FUNCTIONS
2.11 Display Information on Function Call from Stack
This section describes how to show the information on function call from the stack.
The CS+ compiler (CC-RH) pushes function-call information onto the stack, in accordance with the ANSI standard. It is
thus possible to learn the function call depth, the location of the caller, parameters, and other information by analyzing the
function-call information.
This "function-call information" is called the call stack information; this term will be used in the rest of this document.
Remark
For "call stack information" for a microcontroller that supports multi-core, see also to "Select a Core
(PE)".
2.11.1 Display call stack information
Call stack information is displayed in the Call Stack panel below.
Select the [View] menu >> [Call Stack].
For details on the contents and function in each area, see the section for the Call Stack panel.
Caution
Nothing is displayed on this panel during execution of a program.
When the program is stopped, items in each area are displayed.
Figure 2.102 Display Call Stack Information (Call Stack Panel)
Toolbar
[Depth] area
[Call Stack] area
This section describes the following.
2.11.1.1
2.11.1.2
2.11.1.3
2.11.1.4
Change display format of values
Jump to the source line
Display local variables
Save the contents of call stack information
2.11.1.1 Change display format of values
The display format of this panel can be changed using buttons below on the toolbar.
Notation
The following buttons to change the notation of a data value are displayed.
AutoSelect
Displays values on this panel in the default notation according to the type of variable (default).
Hexadecimal
Displays values on this panel in hexadecimal number.
Decimal
Displays values on this panel in decimal number.
Octal
Displays values on this panel in octal number.
Binary
Displays values on this panel in binary number.
R20UT3456EJ0100 Rev.1.00
Aug 01, 2015
Page 92 of 281
CS+ V3.02.00
2. FUNCTIONS
Encoding
The following buttons to change the encoding of character variables are displayed.
ASCII
Displays character variables in ASCII code (default).
Shift_JIS
Displays character variables in Shift-JIS code.
EUC-JP
Displays character variables in EUC-JP code.
UTF-8
Displays character variables in UTF-8 code.
UTF-16
Displays character variables in UTF-16 code.
2.11.1.2 Jump to the source line
Double-clicking on the line will open the Editor panel with the caret moved to the source line of the calling function indicated by the selected line (If the panel is already open, the screen will jump to the editor panel).
Remark
Selecting [Jump to Disassemble] from the context menu will open the Disassemble panel (Disassemble
1) with the caret moved to address of the calling function indicated by the selected line (If the panel is
already open, the screen will jump to the Disassemble panel (Disassemble 1)).
2.11.1.3 Display local variables
Selecting [Jump to Local Variable at This Time] from the context menu will open the Local Variables panel that displays
the local variables indicated by the currently selected line.
2.11.1.4 Save the contents of call stack information
By selecting the [File] menu >> [Save Call Stack Data As...], the Save As dialog box can be opened, and all the contents
in the call stack information can be saved in a text file (*.txt) or CSV file (*.csv).
When saving to files, retrieve the latest information from the debug tool.
Figure 2.103 Output Example of Call Stack Information
Depth
Call stack
---------------------------------------------------------------------0
Call stack information
1
Call stack information
:
:
R20UT3456EJ0100 Rev.1.00
Aug 01, 2015
Page 93 of 281
CS+ V3.02.00
2. FUNCTIONS
2.12 Collect Execution History of Programs
This section describes how to collect the execution history of the program.
A history of program execution is generally called a trace; this term will be used in the remainder of this document.
It is nearly impossible to find the cause of runaway program execution from the memory contents, stack information, and
the like after the runaway has occurred. The collected trace data, however, can be used to trace program execution up to
the runaway directly, making this an effective tool for discovering hidden bugs.
Remark
For "collection of execution history of programs" for a microcontroller that supports multi-core, see also to
"2.7 Select a Core (PE)".
2.12.1 Configure the trace operation
When the trace function starts, trace data which has recorded in it an execution history of the currently executed program is collected in trace memory (when program execution stops, the trace function also automatically stops).
Before the trace function can be used, it is necessary to make settings relating to the operation of a trace.
Note that the method on how to set differs depending on the debug tool used.
2.12.1.1 [Full-spec emulator]
2.12.1.2 [E1]/[E20]
2.12.1.3 [Simulator]
2.12.1.1 [Full-spec emulator]
This trace operation can be configured in the [Trace] category on the [Debug Tool Settings] tab in the Property panel.
Caution
Properties in this category cannot be changed during program execution.
Figure 2.104 [Trace] Category [Full-spec emulator]
(1)
[Trace target]
Select the trace target from the following drop-down list.
The choices of this property vary depending on the mode selected by the [Debug mode] property in the [Multi core]
category on the [Debug Tool Settings] tab of the Property panel.
- When Sync debug mode is selected:
Debug core only
Collects the trace data regarding the currently selected PE (default).
After collecting the trace data, the contents of the Trace panel is not changed even if you
switch PE.
All core
Collects the trace data for all PEs.
After collecting the trace data, if you switch PE, the contents of the Trace panel will be
updated to the corresponding trace data.
- When Async debug mode is selected:
core name
Collects the trace data for the selected core name.
This property appears only when the selected microcontroller is a multi-core.
This property can be changed only while all cores are stopped.
Caution
This property can be changed only while all cores are stopped.
This property setting takes effect before user program execution is started.
R20UT3456EJ0100 Rev.1.00
Aug 01, 2015
Page 94 of 281
CS+ V3.02.00
(2)
[Select trace data]
Select the type of trace data to be collected from the following drop-down list.
Branch PC
PC values for source/destination instructions of branching during program execution are collected as trace data.
Data Access
Data information on access-related events that occurred during program execution are collected as trace data.
Branch PC +
Data Access
PC values for source/destination instructions of branching during program execution, as well
as data information on access-related events that occurred are collected as trace data
(default).
Caution
(3)
Speed priority
Traces giving priority to the real-time performance (default).
Data priority
Traces after stopping the execution pipeline of the CPU temporarily so that no data is
missed.
You can forcibly clear the trace memory when clicking the
panel.
button in the toolbar in the Trace
[Operation after trace memory is full]
Select the operation after the trace memory is full with the collected trace data from the following drop-down list.
Non stop and overwrite
to trace memory
Continues overwriting the older trace data after the trace memory is full (default).
When the [Clear trace memory before running] property is set to [Yes], at the time of
a resumption, trace data is collected after clearing the trace memory.
Stop trace
When the trace memory is full, CS+ stops writing trace data (the program does not
stop execution).
Note, however, that this item is not displayed when the [Trace priority] property is set
to [Data priority].
Stop
When the trace memory is full, CS+ stops writing trace data and the program stops
execution.
Caution
(6)
The trace memory is cleared when you change the setting of this property.
[Clear trace memory before running]
Select whether to clear (initialize) the trace memory before tracing starts.
Select [Yes] to clear the memory (default).
Remark
(5)
The trace memory is cleared when you change the setting of this property.
[Trace priority]
Select which item should be given priority when using the trace function from the following drop-down list.
Caution
(4)
2. FUNCTIONS
The trace memory is cleared when you change the setting of this property.
[Trace range setting]
Select the range of trace data to be collected from the following drop-down list.
Note, however, that this property can be changed only when connected to the debug tool.
Traces section
Collects the execution history as trace data within the section specified with a trace start
event and a trace end event (default).
Traces out of
range
Collects the execution history as trace data outside the range specified with a trace start
event and a trace end event.
Caution
If this property is changed, then all trace start and trace end events currently being set will become
invalid.
Remark
When [Traces out of range] is selected, the range of trace data to be collected will be determined by
a lower-limit address and an upper-limit address that are specified with a trace start event and a
trace end event.
R20UT3456EJ0100 Rev.1.00
Aug 01, 2015
Page 95 of 281
CS+ V3.02.00
2. FUNCTIONS
main()
xxx()
wait()
S
jarl or Interrupt
jarl wait
: Range of trace data to be collected
: Range of trace data not to be collected
S : Trace start event (lower-limit)
jmp[lp]
(7)
Return
E : Trace end event (upper-limit)
[Trace memory size[frames]]
Specify from the drop-down list the size of trace memory (i.e. the number of trace frames) in this property.
The trace frame is a unit of trace data. One trace frame is used for each operation in fetch/write/read (default:
[8K]).
Caution
(8)
E
The trace memory is cleared when you change the setting of this property.
[Enable trace data complement]
Select whether to enable complement display when displaying the collected trace data in the Trace panel.
By enabling complement display, instructions between branch instructions that cannot be traced by hardware can
be displayed.
Select [Yes] to enable complement display (default).
This setting will be applied from the next acquisition of trace data.
2.12.1.2 [E1]/[E20]
This trace operation can be configured in the [Trace] category on the [Debug Tool Settings] tab of the Property panel.
Caution 1.
If the trace function is not mounted on the microcontroller used, all properties in this category become
unchangeable after connecting to the debug tool (the trace function cannot be used).
Caution 2.
Properties in this category cannot be changed during program execution.
Figure 2.105 [Trace] Category [E1][E20]
(1)
[Trace target]
Select the trace target from the following drop-down list.
The choices of this property vary depending on the mode selected by the [Debug mode] property in the [Multi core]
category on the [Debug Tool Settings] tab of the Property panel.
- When Sync debug mode is selected:
Debug core only
Collects the trace data regarding the currently selected PE (default).
After collecting the trace data, the contents of the Trace panel is not changed even if you
switch PE.
All core
Collects the trace data for all PEs.
After collecting the trace data, if you switch PE, the contents of the Trace panel will be
updated to the corresponding trace data.
- When Async debug mode is selected:
core name
Collects the trace data for the selected core name.
R20UT3456EJ0100 Rev.1.00
Aug 01, 2015
Page 96 of 281
CS+ V3.02.00
2. FUNCTIONS
This property appears only when the selected microcontroller is a multi-core.
This property can be changed only while all cores are stopped.
Caution
(2)
[Select trace data]
Select the type of trace data to be collected from the following drop-down list.
Branch PC
PC values for source/destination instructions of branching during program execution are collected as trace data.
Data Access
Data information on access-related events that occurred during program execution are collected as trace data.
Branch PC +
Data Access
PC values for source/destination instructions of branching during program execution, as well
as data information on access-related events that occurred are collected as trace data
(default).
Caution
(3)
Speed priority
Traces giving priority to the real-time performance (default).
Data priority
Traces after stopping the execution pipeline of the CPU temporarily so that no data is
missed.
You can forcibly clear the trace memory when clicking the
panel.
button in the toolbar in the Trace
[Operation after trace memory is full]
Select the operation after the trace memory is full with the collected trace data from the following drop-down list.
Non stop and overwrite
to trace memory
Continues overwriting the older trace data after the trace memory is full (default).
When the [Clear trace memory before running] property is set to [Yes], at the time of
a resumption, trace data is collected after clearing the trace memory.
Stop trace
When the trace memory is full, CS+ stops writing trace data (the program does not
stop execution).
Stop
When the trace memory is full, CS+ stops writing trace data and the program stops
execution.
Caution
(6)
The trace memory is cleared when you change the setting of this property.
[Clear trace memory before running]
Select whether to clear (initialize) the trace memory before tracing starts.
Select [Yes] to clear the memory (default).
Remark
(5)
The trace memory is cleared when you change the setting of this property.
[Trace priority]
Select which item should be given priority when using the trace function from the following drop-down list.
Caution
(4)
This property can be changed only while all cores are stopped.
This property setting takes effect before user program execution is started.
The trace memory is cleared when you change the setting of this property.
[Trace range setting]
Select the range of trace data to be collected from the following drop-down list.
Note, however, that this property can be changed only when connected to the debug tool.
Traces section
Collects the execution history as trace data within the section specified with a trace start
event and a trace end event (default).
Traces out of range
Collects the execution history as trace data outside the range specified with a trace start
event and a trace end event.
Caution
If this property is changed, then all trace start and trace end events currently being set will become
invalid.
Remark
When [Traces out of range] is selected, the range of trace data to be collected will be determined by
a lower-limit address and an upper-limit address that are specified with a trace start event and a
trace end event.
R20UT3456EJ0100 Rev.1.00
Aug 01, 2015
Page 97 of 281
CS+ V3.02.00
2. FUNCTIONS
main()
xxx()
wait()
S
jarl wait
jarl or Interrupt
: Range of trace data to be collected
: Range of trace data not to be collected
S : Trace start event (lower-limit)
jmp[lp]
E
Return
E : Trace end event (upper-limit)
2.12.1.3 [Simulator]
This trace operation can be configured in the [Trace] category on the [Debug Tool Settings] tab of the Property panel.
Figure 2.106 [Trace] Category [Simulator]
(1)
[Use trace function]
Select whether to use trace function.
Select [Yes] to use the trace function (default: [No]).
(2)
[Trace target]
Select the trace target from the following drop-down list.
(3)
Debug core only
Collects the trace data regarding the currently selected PE (default).
After collecting the trace data, the contents of the Trace panel is not changed even if you
switch PE.
All core
Collects the trace data for all PEs.
After collecting the trace data, if you switch PE, the contents of the Trace panel will be
updated to the corresponding trace data.
[Clear trace memory before running]
Select whether to clear (initialize) the trace memory before tracing starts.
Select [Yes] to clear the memory (default).
Remark
(4)
You can forcibly clear the trace memory when clicking the
panel.
button in the toolbar in the Trace
[Operation after trace memory is full]
Select the operation after the trace memory is full with the collected trace data from the following drop-down list.
Non stop and overwrite
to trace memory
Continues overwriting the older trace data after the trace memory is full (default).
When the [Clear trace memory before running] property is set to [Yes], at the time of
a resumption, the trace data is collected after clearing the trace memory.
Stop trace
When the trace memory is full, CS+ stops writing trace data (the program does not
stop execution).
Stop
When the trace memory is full, CS+ stops writing trace data and the program stops
execution.
R20UT3456EJ0100 Rev.1.00
Aug 01, 2015
Page 98 of 281
CS+ V3.02.00
2. FUNCTIONS
(5)
[Accumulate trace time]
Select whether to display the trace time with accumulated time.
Select [Yes] to display trace time with accumulated time. Select [No] to display the trace time with differential time
(default).
(6)
[Trace memory size[frames]]
Select the trace memory size (trace frame number).
The trace frame is a unit of trace data. One trace frame is used for each operation in fetch/write/read.
Drop down list includes the following trace frame numbers.
4K (default), 8K, 12K, 16K, 20K, 24K, 28K, 32K, 36K, 40K, 44K, 48K, 52K, 56K, 60K, 64K, 128K 192K, 256K,
320K, 384K, 448K, 512K, 576K, 640K, 704K, 768K, 832K, 896K, 960K, 1M, 2M, 3M
(7)
[Rate of frequency division of trace time tag]
Select the frequency division ratio of the counter to be used for time tag display (the [Time] item in the Trace
panel) (default: [1/1]).
2.12.2 Collect execution history until stop of the execution
In the debug tool, there is a function to collect the execution history from the start of program execution to the stop.
Therefore, the trace data collection is automatically started when the program starts executing and stopped when the
program stops.
See "2.12.6 Display the collected execution history" for how to check the collected trace data.
Remark
This function is actuated by an Unconditional Trace event, one of the built-in events that are set in the
debug tool by default.
Consequently, if the Unconditional Trace event is set to Invalid state by clearing the check box in the
Events panel, trace data linked to the start of program execution will not be collected (the Unconditional
Trace event is set to Valid state by default).
Note that Unconditional Trace event and Trace event described later (see "2.12.3 Collect execution history in the arbitrary section") are used exclusively of each other. Therefore, if Trace event with Valid state
is set, Unconditional Trace event is automatically set to Invalid state.
2.12.3 Collect execution history in the arbitrary section
The execution history is collected as trace data only for the arbitrary section while the program is in execution by setting
a Trace event.
This Trace event consists of a trace start event and a trace end event.
To use this function, follow the procedure described below.
2.12.3.1 Set a Trace event
2.12.3.2 Execute the program
2.12.3.3 Delete a Trace event
Caution 1.
Also see "2.16.6 Notes for setting events" for details on Trace events (e.g. limits on the number of
enabled events).
Caution 2.
[Simulator]
Trace start events and trace stop events cannot be set/deleted while a tracer is running.
2.12.3.1 Set a Trace event
To set a Trace event, set a trace start event and a trace end event that starts/stops collecting the trace data.
Use one of the following methods to set a trace start event and a trace end event.
(1)
For execution-related events
By setting execution-related events for a trace start event and a trace end event, it is possible to start and stop the
collection of trace data at any place.
Perform this operation in the Editor panel/Disassemble panel in which the source text/disassembled text is displayed.
Follow the operation listed below from the context menu, in accordance with your desired event type, after moving
the caret to the target line that has a valid address.
R20UT3456EJ0100 Rev.1.00
Aug 01, 2015
Page 99 of 281
CS+ V3.02.00
2. FUNCTIONS
Event Type
Operation
Trace start
Select [Trace Settings] >> [Start Tracing]
Trace end
Select [Trace Settings] >> [Stop Tracing]
Caution
[Simulator]
Simulator will not display a trace end event as the results of a trace. For this reason, set a trace
end event to one line below the range that you wish to display as the trace data.
A trace start event or a trace end event is set to the instruction at the start address corresponding to the line of the
caret position. Once a trace start event or a trace end event is set, the following event mark is displayed in the
event area of the line/address that an event is set.
Table 2.11
Event Marks of Trace Start Event and Trace End Events
Event Type
Event Mark
Trace start
Trace end
Figure 2.107 Trace Start and Trace End Events Setting Example (Disassemble Panel)
Event area
Indicates that a trace start
event has been set.
Indicates that a trace end
event has been set.
Remark
(2)
For access-related events [Full-spec emulator][E1][E20]
By setting access-related events for a trace start event and a trace end event, it is possible to start and stop the
collection of trace data when a specified access is made to any variable or IOR.
Caution
(a)
[Full-spec emulator][E1][E20]
By specifying [Traces out of range] in the [Trace range setting] property in the [Trace] category on
the [Debug Tool Settings] tab of the Property panel, you can collect the execution history as trace
data outside the specified range.
The types of access that can be set by using methods described here are only a read/write (see
"Table 2.5 Types of Accesses to Variables").
To set events for variables or IOR in the Editor panel/Disassemble panel
Perform this operation in the Editor panel/Disassemble panel in which the source text/disassembly text is displayed.
Follow the operation listed below from the context menu, in accordance with your desired event type, after
selecting an arbitrary variable or IOR on the source text/disassembled text.
Note, however, that only global variables, static variables inside functions, and file-internal static variables can
be used.
Event Type
Operation
Trace start
Select [Trace Settings] >> [Record Start R/W Value], and then press the [Enter] key.
Trace end
Select [Trace Settings] >> [Record End R/W Value], and then press the [Enter] key.
At this time, if you have specified a value in the text box in the context menu, collection of trace data is started or
finished only when a read/write is performed with a specified value. If no value is specified, collection of trace
data is started or finished when a read/write is performed to the selected variable or IOR, regardless of the
value.
Caution 1.
Variables within the current scope can be specified.
R20UT3456EJ0100 Rev.1.00
Aug 01, 2015
Page 100 of 281
CS+ V3.02.00
2. FUNCTIONS
Caution 2.
(b)
Variables or SFR at lines that have no valid addresses cannot be used for trace start events and
trace end events.
To set events for registered watch-expressions
Perform this operation in the Watch panel.
Follow the operation listed below from the context menu after selecting the registered watch-expression (multiple selections not allowed). Note, however, that only global variables, static variables inside functions, file-internal static variables, and IOR can be used.
Event Type
Operation
Trace start
Select [Trace Output] >> [Record Start R/W Value], and then press the [Enter] key.
Trace end
Select [Trace Output] >> [Record End R/W Value], and then press the [Enter] key.
At this time, if you have specified a value in the text box in the context menu, collection of trace data is started or
finished only when a read/write is performed with a specified watch-expression. If no value is specified, collection of trace data is started or finished when a read/write is performed to the selected variable or IOR, regardless of the value.
Caution
A watch-expression within the current scope can be specified.
To target a watch-expression outside the current scope, select a watch-expression with a specified scope.
When a trace start event and a trace end event are set, they are managed collectively on the Events panel as one
instance of a Trace event (see "2.16 Manage Events"). When you click the "+" mark at a Trace event item, detailed information on the trace start event and the trace end event you have set is displayed.
Figure 2.108 Example of Trace Start and Trace End Events (Execution Type) in Events Panel
Remark 1.
If either one of a trace start event and a trace end event is set as Valid state, the check box of Unconditional Trace event in the Events panel is automatically cleared, therefore, trace data collection does not
automatically start with the start of the program execution (the tracer will not run until the condition of the
trace start event that has been set is met).
Remark 2.
A trace end event is not indispensable for a Trace event.
Remark 3.
Event marks differ depending on the event state (see "2.16.1 Change the state of set events (valid/
invalid)").
When an event is set at the point which other event is already set, the event mark (
) is displayed
meaning more than one event is set at the point.
Remark 4.
[Simulator]
If either one of a trace start event and a trace end event is set to Valid state, the [Use trace function] property in the [Trace] category on the [Debug Tool Settings] tab of the Property panel is automatically set to
[Yes] and the trace function will be enabled.
R20UT3456EJ0100 Rev.1.00
Aug 01, 2015
Page 101 of 281
CS+ V3.02.00
2. FUNCTIONS
2.12.3.2 Execute the program
Execute the program (see "2.8 Execute Programs").
Collection of trace data is started or finished when the condition set for a trace start event or a trace end event is met.
See "2.12.6 Display the collected execution history" for how to check the collected trace data.
2.12.3.3 Delete a Trace event
To delete a Trace event you have set, on the Editor panel/Disassemble panel, right-click the event mark in the event
area and select [Delete Event] from the context menu that is displayed.
Also, there is another way to delete a set event. Select the Trace event you want to delete on the Events panel, and
then click the
button in the toolbar (see "2.16.4 Delete events").
Caution
It is not possible to delete only a trace start event or a trace end event (i.e. if either a trace start event or
a trace end event is deleted from the event marks on the event area, all of the corresponding event
marks are deleted).
2.12.4 Collect execution history only when the condition is met
The program execution history can be collected only when a condition is met.
By setting a Point Trace event, the execution history is collected as trace data only when an arbitrary variable or I/O register is accessed with the specified type.
To use this function, follow the procedure described below.
2.12.4.1
2.12.4.2
2.12.4.3
2.12.4.4
Set a Point Trace event
Execute the program
Edit a Point Trace event [Full-spec emulator][E1][E20]
Delete a Point Trace event
2.12.4.1 Set a Point Trace event
Use one of the following methods to set a Point Trace event.
Caution 1.
Also see "2.16.6 Notes for setting events" for details on Point Trace events (e.g. limits on the number of
enabled events).
Caution 2.
You cannot set/delete Point Trace events while a tracer is running.
Caution 3.
Accesses via DMA cannot be traced.
Caution 4.
[Full-spec emulator][E1][E20]
When a Point Trace event is used simultaneously with a trace event (trace start event or trace end event)
that collects the execution history of an arbitrary section, the execution history of Point Trace is not collected until the condition of the trace start event is met.
Remark
[Simulator]
When a Point Trace event is set to Valid state, the [Use trace function] property in the [Trace] category on
the [Debug Tool Settings] tab of the Property panel is automatically set to [Yes] and the trace function will
be enabled.
(1)
For access to a variable or I/O register on the Editor panel/Disassemble panel
Perform this operation in the Editor panel/Disassemble panel in which the source text/disassembled text is displayed.
Follow the operation listed below from the context menu, in accordance with your desired access type, after
selecting the variable or I/O register as the subject to access.
Note, however, that only global variables, static variables inside functions, and file-internal static variables can be
used.
Access Type
Operation
Read
Select [Trace Settings] >> [Record Reading Value].
Write
Select [Trace Settings] >> [Record Writing Value].
Read/Write
Select [Trace Settings] >> [Record R/W Value].
R20UT3456EJ0100 Rev.1.00
Aug 01, 2015
Page 102 of 281
CS+ V3.02.00
Caution
(2)
2. FUNCTIONS
Variables within the current scope can be specified.
For access to a registered watch-expression
Perform this operation in the Watch panel.
Select the watch-expression as the subject to access and perform the following operation from the context menu
(see "2.10.6 Display/change watch-expressions").
Note, however, that only global variables, static variables inside functions, file-internal static variables, and I/O register can be used.
Access Type
Operation
Read
Select [Trace Output] >> [Record Reading Value].
Write
Select [Trace Output] >> [Record Writing Value].
Read/Write
Select [Trace Output] >> [Record R/W Value].
Caution
A watch-expression within the current scope can be specified.
To target a watch-expression outside the current scope, select a watch-expression with a specified
scope.
By performing the above operation, it is interpreted as if a Point Trace event has been set at the target variable/I/O register/watch-expression, and it is managed in the Events panel (see "2.16 Manage Events" for details).
Figure 2.109 Example of Setting Point Trace Event in Events Panel
2.12.4.2 Execute the program
Execute the program (see "2.8 Execute Programs").
If the conditions for a Point Trace event that you have set are met while the program is executing, that information is collected as trace data.
See "2.12.6 Display the collected execution history" for details on checking trace data.
Figure 2.110 Example of Point Trace Event Results View
Example of the result of the Pint Trace
event with read-access to the variable
"gc_pe1".
R20UT3456EJ0100 Rev.1.00
Aug 01, 2015
Page 103 of 281
CS+ V3.02.00
2. FUNCTIONS
2.12.4.3 Edit a Point Trace event [Full-spec emulator][E1][E20]
Detailed information on a Point Trace event is edited in the Detailed Settings of Point Trace dialog box [Full-spec emulator][E1][E20]. This dialog box is opened by selecting the Point Trace event you desire to edit on the Events panel then
selecting [Edit Condition...] from the context menu.
(1)
When editing an address condition
The start address and end address can be specified as an address condition in the Detailed Settings of Point
Trace dialog box [Full-spec emulator][E1][E20].
(2)
When editing an event target
The following can be specified as an event target in the Detailed Settings of Point Trace dialog box [Full-spec
emulator][E1][E20].
Event Target
Function
CPU
Access to the CPU is the target of the point trace.
Global RAM
Access to the Global RAM is the target of the point trace.
2.12.4.4 Delete a Point Trace event
To delete a Point Trace event you have set, select the Point Trace event you want to delete on the Events panel, and
then click the
button in the toolbar (see "2.16.4 Delete events").
2.12.5 Stop/restart collection of execution history
It is possible to temporarily stop or restart the collection of execution history during program execution.
2.12.5.1 Stop collection of execution history temporarily
2.12.5.2 Restart collection of execution history
2.12.5.1 Stop collection of execution history temporarily
By clicking the
button on the toolbar in the Trace panel during program execution, it is possible to temporarily stop
collection of trace data without stopping program execution.
Use this function when you want to stop only the trace function without halting the program and check the trace data that
has been collected until you stop it.
2.12.5.2 Restart collection of execution history
If you have halted the trace function during program execution, you can start collection of trace data again by clicking
the
button on the toolbar in the Trace panel.
Note that the trace data that has been collected before you restart is cleared once.
2.12.6 Display the collected execution history
The collected trace data is displayed in the Trace panel below.
Select the [View] menu >> [Trace].
The trace data displays by mixing the disassembled text and source text by default, but it is also possible to display
either one of these by selecting the Display mode.
For details on the contents and function in each area, see the section for the Trace panel.
R20UT3456EJ0100 Rev.1.00
Aug 01, 2015
Page 104 of 281
CS+ V3.02.00
2. FUNCTIONS
Figure 2.111 Display Trace Data (Trace Panel [Full-spec emulator][E1][E20])
Toolbar
[Time (h:min:s,ms,s,ns)] area
[Line number/Address] area
[Factor] area [ID] area
[Data] area
[Number] area
[Time (clock)] area
[Source/Disassemble] area [Area] area [Address] area
Figure 2.112 Display Trace Data (Trace Panel [Simulator])
Toolbar
[Time (clock)] area
[Pipeline] area
[Target] area
[Address] area
[Data] area
[Number] area [Time (h:min:s,ms,s,ns)] area
[Source/Disassemble] area
[Line number/Address] area
This section describes the following.
2.12.6.1 Change display mode
2.12.6.2 Change display format of values
2.12.6.3 Link with other panels
2.12.6.1 Change display mode
Display mode can be changed to the purpose when clicking the buttons below in the toolbar.
Note that these buttons are disabled while the tracer is running.
R20UT3456EJ0100 Rev.1.00
Aug 01, 2015
Page 105 of 281
CS+ V3.02.00
2. FUNCTIONS
Table 2.12
Display Modes of Trace Panel
Button
Display Mode
Displayed Content
Mixed display mode
Displays the instruction (disassemble results), labels, source text (corresponding source line), point trace results, and break causes (default).
Disassemble display mode
Displays the instruction (disassemble results), labels, point trace results,
and break causes.
Source display mode
Displays the source text (corresponding source line), and break causes.
However, when a place where no debugging information is present is executed, "<No Debug Information>" is displayed.
Figure 2.113 Example of Source Display Mode View (Trace Panel)
2.12.6.2 Change display format of values
The display format of the [Line Number/Address], [Address] and [Data] area can be changed using buttons below on the
toolbar.
Note that these buttons are disabled while the tracer is running.
Notation
The following buttons to change the notation of a data value are displayed.
Hexadecimal
Displays values on this panel in hexadecimal number (default).
Decimal
Displays values on this panel in decimal number.
Octal
Displays values on this panel in octal number.
Binary
Displays values on this panel in binary number.
2.12.6.3 Link with other panels
Items in the trace panel can be linked to other panels using the currently selected line address as a pointer (window
focus will not move).
Click the
button on the toolbar to start linking to the Editor panel. Click the
button on the toolbar to start linking
to the Disassemble panel.
If the button is clicked again, the link is disconnected.
Remark
The Editor panel/Disassemble panel opens when selecting the [Jump to Source]/[Jump to Disassemble]
from the context menu with moving the caret to the source line/address corresponding to the address of
the currently selected line (focus is moved).
2.12.7 Clear the trace memory
To clear the collected trace data contents, click the
button on the toolbar.
Note that this button is disabled while a tracer is running.
Remark
When [Yes] is selected in the [Clear trace memory before running] property in the [Trace] category on the
[Debug Tool Settings] tab of the Property panel, the trace memory is cleared each time a program is executed.
R20UT3456EJ0100 Rev.1.00
Aug 01, 2015
Page 106 of 281
CS+ V3.02.00
2. FUNCTIONS
2.12.8 Search the trace data
To search for the collected trace data, click the
button to open the Trace Search dialog box (note that the search is
disabled during execution of a program).
In this dialog box, follow the steps below.
Note that by selecting the appropriate tab in this dialog box, you can choose to search for trace data at the instruction
level or search at the source level.
Figure 2.114 Search Trace Data (Trace Search Dialog Box)
Tab selection area
This section describes the following.
2.12.8.1 Search in the instruction level
2.12.8.2 Search in the source level
2.12.8.1 Search in the instruction level
Search for the trace data at the instruction level.
Select the [Instruction Level] tab and then follow the steps below.
Caution
When you search for the trace data at the instruction level, the display mode must be set in the Trace
panel to the Mixed display mode or Disassemble display mode.
R20UT3456EJ0100 Rev.1.00
Aug 01, 2015
Page 107 of 281
CS+ V3.02.00
2. FUNCTIONS
Figure 2.115 Search Trace Data in Instruction Level
(1)
Specify [Fetch Address]
Specify the fetch address if it is a required search parameter.
You can either type address expressions directly into the text boxes, or select it from the input history via the dropdown list (up to 10 items).
The fetch address can also be specified as a range. In this case, specify a range by specifying address expressions in both the left and right text boxes.
If the right-hand text box is blank or contains the text [(Input when range is specified)], then the fixed address
specified in the left-hand text box will be searched.
Note that if an address value greater than the microcontroller address space is specified, the upper address value
is masked.
An address value greater than the value expressed within 32 bits cannot be specified.
(2)
Specify [Mnemonic]
Specify the mnemonic if it is a required search parameter.
The specified character strings in this area is searched within the [Source/Disassemble] area of the Trace panel.
You can either type a mnemonic directly into the text boxes, or select one from the input history via the drop-down
list (up to 10 items).
Searches are case-insensitive, and partial matches are also allowed.
(3)
Specify [Access Address]
Specify the access address if it is a required search parameter.
You can either type the address value directly into the text boxes (in hexadecimal number), or select it from the
input history via the drop-down list (up to 10 items).
The access address can also be specified as a range. In this case, specify a range by specifying address expressions in both the left and right text boxes.
If the right-hand text box is blank or contains the text [(Input when range is specified)], then the fixed address
specified in the left-hand text box will be searched.
Note that if an address value greater than the microcontroller address space is specified, the upper address value
is masked.
An address value greater than the value expressed within 32 bits cannot be specified.
(4)
Specify [Access Status]
This item is only enable if a value for Specify [Access Address] is specified.
Select the access type (Read/Write, Read, Write, Vector Read and DMA) from drop-down list.
R20UT3456EJ0100 Rev.1.00
Aug 01, 2015
Page 108 of 281
CS+ V3.02.00
2. FUNCTIONS
Select [(No Specification)] if you do not wish to limit access types.
(5)
Specify [Data]
This item is only enable if a value for Specify [Access Address] is specified.
Specify the access data.
You can either type the data directly into the text boxes (in hexadecimal number), or select it from the input history
via the drop-down list (up to 10 items).
The data can also be specified as a range. In this case, specify a range by specifying data in both the left and right
text boxes.
If the right-hand text box is blank or contains the text [(Input when range is specified)], then the fixed data specified
in the left-hand text box will be searched.
(6)
Specify [Number]
Specify the range within the trace data to search via the number displayed in the [Number] area of the Trace
panel.
Specify the starting number in the left text box, and the ending number in the right text box ("0" to "last number" are
specified by default).
You can either type the numbers directly into the text boxes (in base-10 format), or select them from the input history via the drop-down list (up to 10 items).
If the left-hand text box is left blank, it is treated as if "0" were specified.
If the right-hand text box is left blank, it is treated as if the last number were specified.
(7)
Click the [Search Backward]/[Search Forward] button
When the [Search Backward] button is clicked, search is taken place in the order from the large number to small
and the search results are shown selected in the Trace panel.
When the [Search Backward] button is clicked, search is taken place in the order from the small number to large
and the search results are shown selected in the Trace panel.
2.12.8.2 Search in the source level
Search for the trace data at the source level.
Select the [Source Level] tab.
Caution
When you search for the trace data at the source level, the display mode must be set in the Trace panel
to the Mixed display mode or Source display mode.
R20UT3456EJ0100 Rev.1.00
Aug 01, 2015
Page 109 of 281
CS+ V3.02.00
2. FUNCTIONS
Figure 2.116 Search Trace Data in Source Level
(1)
(a)
Search with specifying the source line (default)
Select the [The execution part is retrieved specifying the source line] item in the [Search object] area and then follow the operation below.
Specify [Source and Line]
The specified character strings in this area is searched within the [Line Number/Address] area of the Trace
panel.
You can either type the character strings of the source line to be find directly into the text box, or select them
from the input history via the drop-down list (up to 10 items).
Searches are case-insensitive, and partial matches are also allowed.
Example 1.
main.c#40
Example 2.
main.c
Example 3.
main
(b)
Specify [Number]
Specify the range within the trace data to search via the number displayed in the [Number] area of the Trace
panel.
Specify the starting number in the left text box, and the ending number in the right text box ("0" to "last number"
are specified by default).
You can either type the numbers directly into the text boxes (in base-10 format), or select them from the input
history via the drop-down list (up to 10 items).
If the left-hand text box is left blank, it is treated as if "0" were specified.
If the right-hand text box is left blank, it is treated as if the last number were specified.
(c)
Click the [Search Backward]/[Search Forward] button
When the [Search Backward] button is clicked, search is taken place in the order from the large number to small
and the search results are shown selected in the Trace panel.
When the [Search Backward] button is clicked, search is taken place in the order from the small number to large
and the search results are shown selected in the Trace panel.
(2)
Search with specifying the function name
Select the [The execution part is retrieved specifying the function] item in the [Search object] area and then follow
the operation below.
R20UT3456EJ0100 Rev.1.00
Aug 01, 2015
Page 110 of 281
CS+ V3.02.00
2. FUNCTIONS
(a)
Specify [Function Name]
You can either type the function name to be find directly into the text box, or select it from the input history via
the drop-down list (up to 10 items).
Searches are case-insensitive, and only complete matches are retrieved.
(b)
Specify [Number]
Specify the range within the trace data to search via the number displayed in the [Number] area of the Trace
panel.
Specify the starting number in the left text box, and the ending number in the right text box ("0" to "last number"
are specified by default).
You can either type the numbers directly into the text boxes (in base-10 format), or select them from the input
history via the drop-down list (up to 10 items).
If the left-hand text box is left blank, it is treated as if "0" were specified.
If the right-hand text box is left blank, it is treated as if the last number were specified.
(c)
Click the [Search Backward]/[Search Forward] button
When the [Search Backward] button is clicked, search is taken place in the order from the large number to small
and the search results are shown selected in the Trace panel.
When the [Search Backward] button is clicked, search is taken place in the order from the small number to large
and the search results are shown selected in the Trace panel.
(3)
Search with specifying the global variable
Select the [The execution part is retrieved specifying the global variable] item in the [Search object] area and then
follow the operation below.
(a)
Specify [Variable Name]
You can either type the variable name to be find directly into the text box, or select it from the input history via
the drop-down list (up to 10 items).
Searches are case-insensitive, and only complete matches are retrieved.
(b)
Specify [Kind]
Select the access type ([Reference/Substitution], [Reference], or [Substitution]) from the drop-down list.
(c)
Specify [Value]
You can either type the accessed variable value directly into the text box, or select one from the input history via
the drop-down list (up to 10 items).
The variable value can also be specified as a range. In this case, specify a range by specifying variable values
in both the left and right text boxes.
If the right-hand text box is blank, then access locations with the fixed variable values specified in the left-hand
text box will be searched for.
(d)
Specify [Number]
Specify the range within the trace data to search via the number displayed in the [Number] area of the Trace
panel.
Specify the starting number in the left text box, and the ending number in the right text box ("0" to "last number"
are specified by default).
You can either type the numbers directly into the text boxes (in base-10 format), or select them from the input
history via the drop-down list (up to 10 items).
If the left-hand text box is left blank, it is treated as if "0" were specified.
If the right-hand text box is left blank, it is treated as if the last number were specified.
(e)
Click the [Search Backward]/[Search Forward] button
When the [Search Backward] button is clicked, search is taken place in the order from the large number to small
and the search results are shown selected in the Trace panel.
When the [Search Backward] button is clicked, search is taken place in the order from the small number to large
and the search results are shown selected in the Trace panel.
2.12.9 Save the contents of execution history
Contents of the collected trace data can be saved with range selection in text files (*.txt)/CSV files (*.csv).
When saving to the file, the latest information is acquired from the debug tool, and it is saved in accordance with the display format on this panel.
The following Data Save dialog box can be opened by selecting the [File] menu >> [Save Trace Data As...].
In this dialog box, follow the steps below.
R20UT3456EJ0100 Rev.1.00
Aug 01, 2015
Page 111 of 281
CS+ V3.02.00
2. FUNCTIONS
Figure 2.117 Save Execution History (Data Save Dialog Box)
(1)
Specify [File Name]
Specify the name of the file to save.
You can either type a filename directly into the text box (up to 259 characters), or select one from the input history
via the drop-down list (up to 10 items).
You can also specify the file by clicking the [...] button, and selecting a file via the Select Data Save File dialog box.
(2)
Specify [File Type]
Select the format in which to save the file from the following drop-down list.
The following file formats can be selected.
List Item
Format
Text files (*.txt)
Text format (default)
CSV (Comma-Separated Variables)(*.csv)
CSV formatNote
Note
The data is saved with entries separated by commas (,).
If the data contains commas, each entry is surrounded by double quotes "" in order to avoid illegal
formatting.
(3)
Specify [Save Range Number]
Specify the range of the number to save via "start number" and "end number".
Directly enter decimal number in each text box or select from the input history displayed in the drop-down list (up
to 10 items).
When saving all the trace data, select the [All Trace Data] item in the drop-down list at the left (the right text box
becomes invalid).
If a range is selected in the panel, that range is specified as the default. If there is no selection, then the range
currently visible in the panel is specified.
(4)
Click the [Save] button
Trace data is saved in the specified file with the specified format.
Figure 2.118 Output Example of Trace Data
Number Target Time Clock Line/Address Pipeline Source/Disassemble Factor
Area ID Address Data
-------------------------------------------------------------------------------Number Target Time Clock Line/Address Pipeline Source/Disassemble Factor
Area ID Address Data
:
:
:
:
:
:
:
:
:
:
:
:
Remark
Items of trace data output differ depending on the debug tool used.
R20UT3456EJ0100 Rev.1.00
Aug 01, 2015
Page 112 of 281
CS+ V3.02.00
2. FUNCTIONS
2.13 Measure Execution Time of Programs
This section describes how to measure the execution time of the program.
Remark
For "measurement of execution time of programs" for a microcontroller that supports multi-core, see also
to "2.7 Select a Core (PE)".
2.13.1 Measure execution time until stop of the execution
In the debug tool, there is a function to measure the program execution time (Run-Break time) from the start to the stop.
Therefore, when the program starts its execution, the execution time is automatically measured.
You can check the result of the measurement by either one of the following.
Caution 1.
The Run-Break time for a step execution cannot be measured.
Caution 2.
[Simulator]
To measure the Run-Break time, [Yes] must be specified with the [Use timer function] property in the
[Timer] category on the [Debug Tool Settings] tab of the Property panel.
Remark
This function is operated by a Run-Break Timer event, which is one of the built-in events set by default in
the debug tool.
(1)
Check in the status bar
After the program is stopped, the result of the measurement is displayed in the status bar on the Main window
(when measurements have not been performed yet, "Not measured" is displayed).
Figure 2.119 Example of Result of Run-Break Timer Event (Status Bar)
The result of the measurement
(2)
Check on the Events panel
After the program is stopped, the result of the measurement is displayed in the Events panel opened by selecting
the [View] menu >> [Event], in event type as "Run-Break Timer".
Figure 2.120 Example of Result of Run-Break Timer Event (Events Panel)
2.13.2 Measure execution time in the arbitrary section
In the program execution process, the execution time in the arbitrary section can be measured by setting Timer Result
event.
To use this function, follow the procedure described below.
2.13.2.1
2.13.2.2
2.13.2.3
2.13.2.4
Set a Timer Result event
Execute the program
Edit a Timer Result event [Full-spec emulator][E1][E20]
Delete a Timer Result event
R20UT3456EJ0100 Rev.1.00
Aug 01, 2015
Page 113 of 281
CS+ V3.02.00
2. FUNCTIONS
Caution 1.
Also see "2.16.6 Notes for setting events" for details on Timer Result events (e.g. limits on the number of
enabled events).
Caution 2.
To use this function, [Yes] must be specified with the [Use timer function] property in the [Timer] category
on the [Debug Tool Settings] tab of the Property panel.
2.13.2.1 Set a Timer Result event
To set a Timer Result event, set a timer start event and a timer end event that starts/stops a timer measurement.
Use one of the following methods to set a timer start event and a timer end event.
(1)
For execution-related events
Perform this operation in the Editor panel/Disassemble panel in which the source text/disassembled text is displayed.
Follow the operation listed below from the context menu, in accordance with your desired event type, after moving
the caret to the target line that has a valid address.
Event Type
Operation
Timer start
Select [Timer Settings] >> [Start Timer] >> [Set Timer nNote]
Timer end
Select [Timer Settings] >> [Stop Timer] >> [Set Timer nNote]
Note
[Simulator]
Select the channel number (n: 1 to 8) in which a Timer Result event is set.
[Full-spec emulator][E1][E20]
Select the channel number (n: 1 to 3) in which a Timer Result event is set for each core.
Caution
The time for a timer end event will not included in the measurement results. For this reason, set a
timer end event to one line below the range for which you wish to measure the run time.
A timer start event or a timer end event is set to the instruction at the start address corresponding to the line of the
caret position.
Once a timer start event or a timer end event is set, the following event mark is displayed in the event area of the
line/address that an event is set.
Table 2.13
Event Marks of Timer Start Event/Timer End Event
Event Type
Event Mark
Timer start
Timer end
Figure 2.121 Timer Start and Timer End Events Setting Example (Disassemble Panel)
Event area
Indicates that a timer
start event has been set.
Indicates that a timer
start event has been set.
(2)
For access-related events
In this product version, this function is not supported.
When a timer start event and a timer end event are set, they are managed collectively on the Events panel as one
instance of a Timer Result event (see "2.16 Manage Events"). When you click the "+" mark at a Timer Result event item,
detailed information on the timer start event and the timer end event you have set is displayed.
R20UT3456EJ0100 Rev.1.00
Aug 01, 2015
Page 114 of 281
CS+ V3.02.00
2. FUNCTIONS
Figure 2.122 Example of Timer Start and Timer End Events (Execution Type) in Events Panel [Simulator]
Figure 2.123 Example of Timer Start and Timer End Events (Execution Type) in Events Panel [Full-spec
emulator][E1][E20]
Remark
Event marks differ depending on the event state (see "2.16.1 Change the state of set events (valid/
invalid)").
When an event is set at the point which other event is already set, the event mark (
) is displayed
meaning more than one event is set at the point.
Caution 1.
[Full-spec emulator][E1][E20]
Timer measurement can be performed with even only one setting: a timer start event or a timer end
event. When only a timer start event is set, timer measurement is terminated when program execution
stops. When only a timer end event is set, timer measurement is started when program execution starts.
Caution 2.
[Simulator]
Timer measurement is enabled when both a timer start event and a timer end event have been set.
Therefore, timer measurement cannot be performed with only one setting: a timer start event or a timer
end event.
2.13.2.2 Execute the program
Execute the program (see "2.8 Execute Programs").
When an instruction for which a timer start event or a timer end event has been set is executed, a timer measurement is
started or finished.
After the program is stopped, the result of the measurement is displayed in the Events panel opened by selecting the
[View] menu >> [Event], in event type as "Timer Result".
R20UT3456EJ0100 Rev.1.00
Aug 01, 2015
Page 115 of 281
CS+ V3.02.00
2. FUNCTIONS
This Timer Result is a particular type of event that is displayed on only the Events panel when either a timer start event
or a timer end event has been set.
Figure 2.124 Example of Result of Timer Result Event (Timer Start Event/Timer End Event) [Simulator]
Figure 2.125 Example of Result of Timer Result Event (Timer Start Event/Timer End Event) [Full-spec
emulator][E1][E20]
2.13.2.3 Edit a Timer Result event [Full-spec emulator][E1][E20]
Detailed information on a Timer Result event is edited in the Detailed Settings of Timer Measurement dialog box [Fullspec emulator][E1][E20]. This dialog box is opened by selecting the Timer Result event you desire to edit on the Events
panel then selecting [Edit Condition...] from the context menu.
In the Detailed Settings of Timer Measurement dialog box [Full-spec emulator][E1][E20], the following can be specified
as measurement items.
Only a single item can be measured, and the measurement result for only the selected item is displayed on the Events
panel.
Measurement Item
Function
Total Count
Measures the total execution time of the specified section.
Max Count
Measures the maximum execution time of the specified section.
Min Count
Measures the minimum execution time of the specified section.
R20UT3456EJ0100 Rev.1.00
Aug 01, 2015
Page 116 of 281
CS+ V3.02.00
2. FUNCTIONS
Measurement Item
Pass Count
Function
Measures the pass count of the specified section.
This cannot be measured when an end condition has not been set.
2.13.2.4 Delete a Timer Result event
To delete a Timer Result event you have set, on the Editor panel/Disassemble panel, right-click the event mark in the
event area and select [Delete Event] from the context menu that is displayed.
Also, there is another way to delete a set event. Select the Timer Result event you want to delete on the Events panel,
and then click the
button in the toolbar (see "2.16.4 Delete events").
Caution
[Simulator]
If either a timer start or timer end event is deleted from the event marks on the event area, all of the corresponding event marks are deleted.
2.13.3 Measurable time ranges
The scope of time that can be measured via timers using Run-Break Timer events (see "2.13.1 Measure execution time
until stop of the execution" for details) or Timer Result events (see "2.13.2 Measure execution time in the arbitrary section" for details) is shown below.
Table 2.14
Measurable Time Ranges
Debug Tool
Run-Break Timer Event
Timer Result Event
Full-spec
emulator
Min.
Approx. 50 ns
Approx. 50 ns
Max.
Approx. 3 min. 30 s
Overflow detection included
Approx. 3 min. 30 s
Overflow detection included
E1/E20
Min.
Approx. 60 ns
Approx. 60 ns
Max.
Approx. 4 min. 20 s (LPD: 4-pin)
Overflow detection included
Approx. 4 min. 20 s (LPD: 4-pin)
Overflow detection included
Simulator
Depends on the clock frequency for timer/trace
R20UT3456EJ0100 Rev.1.00
Aug 01, 2015
Depends on the clock frequency for timer/trace
Page 117 of 281
CS+ V3.02.00
2. FUNCTIONS
2.14 Measure Coverage [Simulator]
This section describes coverage measurements that are conducted using the coverage function.
There are several kinds of coverage measurement methods. Of these, CS+ performs, in areas designated below, a
code coverage measurement of fetch-related operations on source lines and functions (C0 coverage) and a data coverage measurement of access-related operations on variables.
The areas in which CS+ performs coverage measurements are as follows:
- 1 MByte space of addresses 0x000000 to 0x0FFFFF in the internal ROM area(fixed measurement area)
- Any 1 MByte space other than the fixed measurement area above (see "2.14.1 Configure the coverage measurement")
Remark 1.
C0 coverage: Instruction coverage (statement coverage)
For example, if all instructions (statements) in code are executed at least once, then C0 = 100%.
Remark 2.
For "coverage measurements" for a microcontroller that supports multi-core, see also to "2.7 Select a
Core (PE)".
2.14.1 Configure the coverage measurement
You need to configure the code coverage measurement before using the coverage function.
You can configure the coverage measurement function in the [Coverage] category on the [Debug Tool Settings] tab of
the Property panel as follows:
Figure 2.126 [Coverage] Category
(1)
[Use coverage function]
Select whether to use the coverage function.
Select [Yes] to use the coverage function (default: [No]).
(2)
[Reuse coverage result]
This property appears only when the [Use coverage function] property is set to [Yes].
The currently obtained results of code coverage measurements are automatically saved when CS+ is disconnected from the debug tool. The next time it is connected to the debug tool, specify whether or not you want to
reproduce the contents of saved measurement results.
Select [Yes] to reproduce the contents of previously obtained code coverage measurement results (default: [No]).
Caution
(3)
This function applies to only the internal ROM area.
[Coverage area of measurement(1MBytes)]
This property appears only when the [Use coverage function] property is set to [Yes].
Specify the code coverage measurement area.
Directly enter the start address of any 1 Mbyte space other than the internal ROM area (0x000000 - 0x0FFFFF) in
hexadecimal number (default: [100000]).
2.14.2 Display the coverage measurement result
When the program starts running, a coverage measurement is automatically begun, and when the program stops running, the coverage measurement is terminated at the same time.
(1)
(a)
Code coverage rates
Display of code coverage rates for source text lines and disassembled text lines
The code coverage rates are indicated on the Editor panel/Disassemble panel that is displaying the target program.
On each panel, the target source text lines and disassembled result lines are shown in color-coded background
(see "Table 2.16") according to their code coverage rate that was calculated based on the formula described in
"Table 2.15".
Note that the results are not shown when disconnected from the debug tool or during the program execution.
R20UT3456EJ0100 Rev.1.00
Aug 01, 2015
Page 118 of 281
CS+ V3.02.00
2. FUNCTIONS
Selecting [Clear coverage information] from the context menu in the Editor panel/Disassemble panel will reset
all the coverage information acquired, including the color-coded display on each panel.
Caution
When the selected microcontroller supports multi-core, in the Local RAM self area, note that the
measurement results will be displayed only for the access in the currently selected PE (see "2.7
Select a Core (PE)").
Table 2.15
Method for Calculating Code Coverage Rates for Source Lines and Disassemble Lines
Panel
Calculation Method
Editor panel
"Number of bytes of code executed in the address range corresponding to the source
text line" / "Total number of bytes of code in the address range corresponding to the
source text line"
Disassemble panel
"Number of bytes of code executed in the address range corresponding to the disassembled text line" / "Total number of bytes of code in the address range corresponding to the disassembled text line"
Table 2.16
View of Code Coverage Measurement Result (Default)
Code Coverage
Background Color
100%
Source text/disassembled text
1 to 99%
Source text/disassembled text
0% (not yet executed)
Source text/disassembled text
Remark 1.
The code coverage measurement result displayed on each panel is automatically updated at
every program break.
Remark 2.
The above background colors depend on the configuration in the [General - Font and Color] category of the Option dialog box.
Remark 3.
The above background colors do not apply to the lines that are outside of the subject area.
Remark 4.
If the downloaded lode module file is older than the source file currently being open, the displaying of the code coverage measurement result is not performed in the Editor panel.
Figure 2.127 View of Code Coverage Measurement Result (Editor Panel)
Code on this line has been executed by 100%
Code on this line has been executed by 0%
(not yet executed)
R20UT3456EJ0100 Rev.1.00
Aug 01, 2015
Page 119 of 281
CS+ V3.02.00
2. FUNCTIONS
Figure 2.128 View of Code Coverage Measurement Result (Disassemble Panel)
Code on this line has been executed by 1 to 99%
Code on this line has been executed by 100%
Code on this line has been executed by 0%
(not yet executed)
(b)
(2)
Display of code coverage rates for each function
Code coverage rates of each function can be checked via the [Code Coverage[%]] item in the Function List
panel of the analyze tool. For details on "the code coverage rates of the function", see "CS+ Integrated Development Environment User's Manual: Analysis".
Data coverage rates
Data coverage rates of each variable can be checked via the [Data Coverage[%]] item in the Variable List panel of
the analyze tool. For details on "the data coverage rates of the variable", see "CS+ Integrated Development Environment User's Manual: Analysis".
R20UT3456EJ0100 Rev.1.00
Aug 01, 2015
Page 120 of 281
CS+ V3.02.00
2. FUNCTIONS
2.15 Set an Action into Programs
This section describes how to set the specified action into the program.
2.15.1 Inset printf
By setting a Printf event that is one of "action events", the value of the specified variable expression can be output to the
Output panel by executing a printf command after temporarily stopping the program in execution at an arbitrary position.
To use this function, follow the steps below.
Caution 1.
[Full-spec emulator][E1][E20]
Printf event is implemented using the Software break function [Full-spec emulator][E1][E20]. Therefore,
you need to select [Yes] in the [Use software break] property in the [Break] category on the [Debug Tool
Settings] tab of the Property panel before setting a Printf event.
Caution 2.
Also see "2.16.6 Notes for setting events" for details on a Printf event (e.g. limits on the number of
enabled events).
Caution 3.
No action events occur during step execution (
related events (
).
(1)
/
/
) or program execution ignoring break-
Set a Printf event
Set a Printf event to the position where you want to execute the printf command in the Editor panel/Disassemble
panel.
On each panel, select [Register Action Event...] from the context menu after moving the caret to the line that has a
valid address to open the Action Events dialog box below.
In this dialog box, follow the steps below.
Figure 2.129 Set Printf Event (Action Events Dialog Box: [Printf event] tab)
(a)
Specify [Output string]
Directly enter from the keyboard the characters to add when output to the Output panel.
Characters must be in one line (spaces allowed).
(b)
Specify [Variable expression]
Specify the variable expression for the Printf event to take place.
Type a variable expression directly into the text box (up to 1024 characters).
R20UT3456EJ0100 Rev.1.00
Aug 01, 2015
Page 121 of 281
CS+ V3.02.00
2. FUNCTIONS
You can specify up to 10 variable expressions for a single Printf event by separating them with commas ",".
If this dialog box opens with a variable expression selected in the Editor panel/Disassemble panel, the selected
variable expression appears as the default.
For the basic input format that can be specified as variable expressions and the values output by Printf event,
see "Table A.12 Relationship between Variable Expressions and Output Value (Printf Event)".
Remark
(c)
Specify [Address]
Specify the address at which to set the Printf event.
The address of the location currently being specified is displayed by default.
If you want to edit this area, you can either type an address expression directly into the text box (up to 1024
characters), or select them from the input history via the drop-down list (up to 10 items).
Remark
(d)
A symbol name at the current caret position can be complemented by pressing the [Ctrl] +
[Space] key in this text box (see "2.18.2 Symbol name completion function").
A symbol name at the current caret position can be complemented by pressing the [Ctrl] +
[Space] key in this text box (see "2.18.2 Symbol name completion function").
Click the [OK] button
Set the Printf event to the line/address at the caret position in the Editor panel/Disassemble panel.
When the Printf event is set, the
mark is displayed in the event area on the Editor panel/Disassemble
panel, and the set Printf event is managed in the Events panel (see "2.16 Manage Events").
(2)
Execute the program
Execute the program (see "2.8 Execute Programs").
By executing the program, the program momentarily stops immediately before executing the instruction at the
location where this event is set, and the value of the variable expression specified in this dialog box is output to the
Output panel.
(3)
Check the output result
The output result format from the Printf event in the [Debug Tool] tab of the Output panel are as follows (see "Figure A.38 Output Result Format of Printf Event"):
Figure 2.130 Example of Output Result of Printf Event
The result of the specification below.
[Output string]:Sample=
[Variable expression]: global_a
(4)
Edit the Printf event
You can edit the Print event that has been set once.
To do this, on the Events panel, select [Edit Condition...] from the context menu after selecting the Printf event to
be edited. On the Action Events dialog box opened automatically, edit the items, and then click the [OK] button.
R20UT3456EJ0100 Rev.1.00
Aug 01, 2015
Page 122 of 281
CS+ V3.02.00
2. FUNCTIONS
2.16 Manage Events
An event represents a certain status of the target system when debugging such as "Address 0x1000 is fetched" and
"Data is written to address 0x2000".
In CS+, these events are used as the action trigger of the debug function such as breakpoint, start/stop the tracing, and
start/stop the timer.
This section describes how to manage those events.
Select the [View] menu >> [Event].
Events are all managed in the Events panel. In the Events panel, you can confirm the details of the currently set events
in a list, and they can be deleted and changed enable/disable status.
For details on the contents and function in each area, see the section for the Events panel.
Figure 2.131 Manage Events (Events Panel)
Toolbar
[Name] area
[Detail Information] area
[Comment] area
Remark 1.
For "event occurrence" for a microcontroller that supports multi-core, see also to "2.7 Select a Core
(PE)".
Remark 2.
For details on how to set various events, see the section below:
- "2.9.3 Stop the program at the arbitrary position (breakpoint)"
- "2.9.4 Stop the program at the arbitrary position (break event)"
- "2.9.5 Stop the program with the access to variables/I/O registers"
- "2.12.3 Collect execution history in the arbitrary section"
- "2.12.4 Collect execution history only when the condition is met"
- "2.13.2 Measure execution time in the arbitrary section"
- "2.15.1 Inset printf"
2.16.1 Change the state of set events (valid/invalid)
By changing the check on the check box of the event name, the setting state of the event can be changed (the Event
mark is changed depending on the setting state of the event).
The following are types of the setting state of the event.
Figure 2.132 Event Name Check Box
Check box Event mark
R20UT3456EJ0100 Rev.1.00
Aug 01, 2015
Event name
Page 123 of 281
CS+ V3.02.00
Table 2.17
2. FUNCTIONS
Setting State of Event
Valid state
Event occurs when the specified condition is met.
It is possible to set the event to an invalid state by removing the check.
Invalid state
Event does not occur when the specified condition is met.
It is possible to set the event to a valid state by removing the check.
Suspended State
A specified condition cannot be set in the program to be debugged. It is not possible to
operate the check box.
Remark 1.
Both of the timer start event and the timer end event is must be set for the Timer Result event. Therefore, it is not possible to set a particular event to a valid state by only the setting of one of these (at the
same time as both events are set, they are treated as grouped events as a Timer Result).
Remark 2.
It is not possible to set the Run-Break Timer event to an invalid/suspended state.
Remark 3.
The setting state of the event can be changed from the menu displayed by right clicking on the Event
mark in the Editor panel/Disassemble panel.
Remark 4.
The setting of the Unconditional Trace event and the Trace event to valid or invalid state is exclusively
controlled. Therefore, the Unconditional Trace event, which is a built-in event, is valid state by default,
but if either a trace start event/trace end event is set, it automatically becomes invalid state, and the
Trace event, which is a event name that is collectively called with a trace start event and a trace end
event, becomes valid state. Conversely, if the set Trace event is invalid state, the Unconditional Trace
event automatically becomes valid state.
2.16.2 Display only particular event types
Click on the toolbar button to display only the particular event type.
Displays events related to the Hardware Break.
Displays events related to the Software Break.
[Full-spec emulator][E1][E20]
Displays events related to the trace.
Displays events related to the timer.
Displays events related to the action event (Printf event).
Displays the built-in events (Unconditional Trace event and Run-Break Timer event).
2.16.3 Jump to the event address
Clicking the following buttons jumps to each panel which selected events address exist.
Note however, that when a Trace event/Timer Result event/ Unconditional Trace event/ Run-Break Timer event is
selected, these buttons are disabled.
Opens the Editor panel and jumps to the source line corresponding to the address
where the selected event is being set.
Opens the Disassemble panel and jumps to the disassemble results corresponding to
the address where the selected event is being set.
Opens the Memory panel and jumps to the source line corresponding to the address
where the selected event is being set.
2.16.4 Delete events
To delete any event and event condition you have set, select the event and click the
button on the toolbar.
Note that it is not possible to delete the built-in events (Unconditional Trace event and Run-Break Timer event).
R20UT3456EJ0100 Rev.1.00
Aug 01, 2015
Page 124 of 281
CS+ V3.02.00
2. FUNCTIONS
Remark 1.
For the Break event of execution type, it is possible to delete the set event to click the event mark displayed in the Editor panel/Disassemble panel.
Remark 2.
To delete all of the events and event conditions you have set at a time, select [Select All] from the context
menu, then click the
button (note, however, that it is not possible to delete the built-in events).
2.16.5 Write comment to events
The user can write comments for each event that has been set.
To input comments, click the [Comment] area after selecting the event to input comments, then input directly the desired
text from the keyboard (the edit mode is cancelled by pressing the [Esc] key).
After editing the comments, complete the editing by pressing the [Enter] key or moving the focus to outside the edit
region.
Up to 256 characters can be inputted for the comments, and this is saved as the settings of the user during use.
2.16.6 Notes for setting events
This section describes notes for setting each type of event.
2.16.6.1 Maximum number of enabled events
2.16.6.2 Event types that can be set and deleted during execution
2.16.6.3 Other notes
2.16.6.1 Maximum number of enabled events
The number of events that can be set to Valid state at the same time are subject to the following limitations.
Consequently, if enabling a new event would exceed the limit, you must first set some other event to Invalid state.
Table 2.18
Maximum Number of Enabled Events
Event Type
Debug Tool
Full-spec emulator
Hardware Break
(execution type: after execution)
E1/E20
Simulator
-
-
Hardware Break
(execution type: before execution)
12Note 1
64
Hardware Break
(access type)
4Note 1
Software Break
2000 (only for the code flash)
-
8+7
64
8
64
3 (for each core)
8 (common for all
cores)
100
64Note 2
Trace
(trace start/trace end)
Point Trace
Timer Result
(timer start/timer end)
Action
(Printf)
"x + y": "Hardware Break (execution type): x" + "Hardware Break (access type): y"
Note 1.
Among Hardware Break (execution type: before execution) events, four events are shared with Hardware
Break (access type) events (e.g. when four Hardware Break (access type) events are used, only eight
hardware break (execution type: before execution) events can be used).
Note 2.
Combination with Hardware Break events
R20UT3456EJ0100 Rev.1.00
Aug 01, 2015
Page 125 of 281
CS+ V3.02.00
2. FUNCTIONS
2.16.6.2 Event types that can be set and deleted during execution
The following types of events can be set or deleted during program execution, or during tracer/timer execution.
Table 2.19
Event Types That Can be Set and Deleted during Execution
Event Type
Debug Tool
Full-spec emulator
Hardware Break
(execution type: after execution)
E1/E20
Simulator
-
-
NG
-
Hardware Break
(execution type: before execution)
Hardware Break
(access type)
Software Break
Trace
(trace start/trace end)
Point Trace
-
Timer Result
(timer start/timer end)
-
Action
(Printf)
NG
NG
: Possible, if the program execution is allowed to pause for eventsNote
: Impossible while tracer or timer is executing
NG : Impossible
: Not supported
Note
To enable this, specify [Yes] with the [Set event by stopping execution momentarily] property in the [Set
Event While Running] category on the [Debug Tool Settings] tab of the Property panel.
2.16.6.3 Other notes
- No events can be set to local variables.
- Events do not occur during step execution (including return execution) and program execution by selecting [Go to
Here] from the context menu.
- If the location set for an existing event changes to midway in an instruction because the program to debug has been
downloaded again, re-set the event using the following method:
- When debugging information is available:
The location setting of events is always moved to the beginning of the source text line.
- When debugging information is not available:
Depends on the [Automatic change method of event setting position] property in the [Download] category on the
[Download File Settings] tab of the Property panel.
- If a change to internal ROM/RAM changes the location the event is set to a non-mapped area, then set events will not
occur (they will also not change to Invalid state /Suspended State on the Events panel).
- If you differentiate function or variable names by leading underscores, then CS+ may misrecognize them, and convert
symbols or make break event settings invalid. This applies for cases like when you have two functions, one named
"_reset" and the other named "__reset".
R20UT3456EJ0100 Rev.1.00
Aug 01, 2015
Page 126 of 281
CS+ V3.02.00
2. FUNCTIONS
2.17 Use Hook Function
This section describes how to set hooks in the debug tool by using the hook function.
By setting a hook transaction, you can automatically change the values of the I/O register/CPU register before and after
downloading a load module or after resetting the CPU.
Configure the hook transaction in the [Hook Transaction Settings] category on the [Hook Transaction Settings] tab of the
Property panel.
Remark
By setting a I/O register by using the [Before download] property, for example, downloading can be executed at high speeds. Downloading to the external RAM is also facilitated by using this function.
Figure 2.133 [Hook Transaction Settings] Category
Table 2.20
Properties in [Hook Transaction Settings] Category
Property
Description
Before download
Perform the specified process immediately before downloading the load module
file.
After download
Perform the specified process immediately after downloading the load module file.
After CPU reset under breaking
Perform the specified process immediately after resetting the CPU under breaking.
Before running
Perform the specified process immediately before starting program execution.
After breaking
Perform the specified process immediately after breaking program execution.
The properties in the [Hook Transaction Settings] category indicate the timing with which the hook process will be performed. "[]" indicates the current number of specified processes (no hook processes are configured by default).
Specify the target process in the property for which you want the hook process to be performed.
To specify a process, select the target property, then open the Text Edit dialog box by clicking the [...] button that
appears on the right edge of the field.
Figure 2.134 Opening Text Edit Dialog Box
R20UT3456EJ0100 Rev.1.00
Aug 01, 2015
Page 127 of 281
CS+ V3.02.00
2. FUNCTIONS
Figure 2.135 Use Hook Function (Text Edit Dialog Box)
In this dialog box, directly enter the desired process from the key board.
The format for specifying processes is as follows:
[Process 1]:
Automatically overwrites the value of I/O register with Value.
Specification format:
I/O-register-name Value
[Process 2]:
Automatically overwrites the value of CPU register with Value.
Specification format:
CPU-register-name Value
[Process 3]:
Automatically executes a script file which is specified with Python script path (absolute path or relative path from the
project folder).
Specification format:
Source Python-script-path
Remark 1.
When specifying hook processes, lines starting with a hash mark "#" will be treated as comments.
Remark 2.
A tab character can be used instead of the space character.
Caution
You can use the following commands when you execute the Python script in the Hook process of the
debugger.
debugger.Register.GetValue
debugger.Register.SetValue
debugger.Memory.GetValue
debugger.Memory.SetValue
If you want to use other Python command, please use Hook command in the Python console.
R20UT3456EJ0100 Rev.1.00
Aug 01, 2015
Page 128 of 281
CS+ V3.02.00
2. FUNCTIONS
Up to 64 characters for one process, and up to 128 processes for each property can be set (one line in the [Text] area in
the Text Edit dialog box is equivalent to one processing).
After the specification of the process is complete, click the [OK] button to set the process to the Property panel.
Figure 2.136 Example of Hook Transaction
R20UT3456EJ0100 Rev.1.00
Aug 01, 2015
Page 129 of 281
CS+ V3.02.00
2. FUNCTIONS
2.18 About Input Value
This section describes consideration to take when inputting values in each panel and dialog box.
2.18.1 Input rule
Following is the rules for input to each panel/dialog box.
(1)
Character set
Character sets that are allowed to input are as follows:
Table 2.21
List of Character Set
Character Set
(2)
ASCII
1- byte alphabets, numbers, symbols
Shift-JIS
2-byte alphabet, number, symbol, Hiragana, Katakana, Kanji and 1-byte
Katakana.
EUC-JP
2-byte alphabet, number, symbol, Hiragana, Katakana, Kanji and 1-byte
Katakana.
UTF-8
2-byte alphabet, number, symbol, Hiragana, Katakana, Kanji (include Chinese
characters) and 1-byte Katakana.
UTF-16
2-byte alphabet, number, symbol, Hiragana, Katakana, Kanji (include Chinese
characters) and 1-byte Katakana.
Escape sequence
Escape sequences that are allowed to input are as follows:
Table 2.22
Escape Sequence List
Escape
Sequence
(3)
Outline
Value
Outline
\0
0x00
null character
\a
0x07
Alert
\b
0x08
Backspace
\t
0x09
Horizontal tab
\n
0x0A
New line
\v
0x0B
Vertical tab
\f
0x0C
Form feed
\r
0x0D
Carriage return
\"
0x22
Double-quotation mark
\'
0x27
Single-quotation mark
\?
0x3F
Question mark handled as a question mark if ? is entered.
\\
0x5C
Backslash
Number
Notations allowed when entering numbers are as follows:
R20UT3456EJ0100 Rev.1.00
Aug 01, 2015
Page 130 of 281
CS+ V3.02.00
2. FUNCTIONS
Table 2.23
Notation List
Notation
(4)
(a)
Outline
Binary number
Start with 0b and continues with the numbers from 0 to 1.
(Case insensitive for alphabets)
Octal number
Start with 0 and continues with the numbers from 0 to 7.
Decimal
Start without 0 and continues with the numbers from 0 to 9.
Hexadecimal number
Start with 0x and continues with the numbers from 0 to 9 and alphabets a to f.
(Case insensitive for alphabets)
In the input area with the
mark, prefix 0x is not needed.
Expression and operator
Expression represents constants, CPU register name, I/O register name and symbols and those connected with
operators.
An expression comes in two types: an address expression and a watch-expression. The expression that requires
the address of a symbol is referred to as an address expression, and the one that requires the value of a symbol is
referred to as a watch-expression.
An address expression and operators
With an address expression, the address of a symbol is used to perform operations. Only when a CPU register
name is written, the value of the symbol is used to perform operations.
The basic input formats of address expressions are as follows:
Table 2.24
Basic Input Format of Address Expressions
Expression
Name of a C language variable
Description
Note 1
Address of a C language variable
Expression [ExpressionNote 2]
Address of an array
Expression.Member name
Address of a structure/union/class member
Expression->Member name
Address of a structure/union/class member that is pointed to
Name of a CPU register
Value of the CPU register
Name of an I/O register
Address of the I/O register
Label nameNote 3, EQU symbol nameNote 3
and [immediate value]
Address of a label, a value of an EQU symbol, and an immediate address
Integer constant
Address
Note 1.
If the register is assigned the value of a C variable, an error results.
Note 2.
The expression that is input as an index to an array is parsed as a watch-expression.
Note 3.
If the label name or EQU symbol name includes a "$", be sure to enclose the name in "{ }" (e.g.
{$Label}).
When you specify the CPU register name "I", add ":REG" (e.g. I:REG) to distinguish it from the
keyword "I" that indicates an imaginary number.
From "Table 2.24 Basic Input Format of Address Expressions", the following expressions with operator can be
constructed.
Table 2.25
Construction of Expressions with Operators
Expression
Description
(Expression)
Value of the parenthetical watch-expression
! Expression
Inverts symbol
- Expression
Logical negation
R20UT3456EJ0100 Rev.1.00
Aug 01, 2015
Page 131 of 281
CS+ V3.02.00
2. FUNCTIONS
Expression
~ Expression
Bit inversion
Note
Expression * Expression
Multiplication
Expression / ExpressionNote
Division
Expression % ExpressionNote
Remainder calculation
Expression + ExpressionNote
Addition
Expression .
ExpressionNote
Subtraction
Expression & ExpressionNote
Logical multiplication by bits
Expression ^ ExpressionNote
Exclusive disjunction by bits
Expression | ExpressionNote
Logical sum by bits
Note
Variables and functions can be combined by an operator only with variables, functions and integer constants.
Example
(b)
Description
C variable name + I/O register name
Watch-expression and operator
With watch-expression, the value of a symbol is used to perform operations. Only when the value does not
exist, the address of the symbol is used to perform operations (e.g. main( ) + 1).
The basic input formats of watch-expressions are as follows:
Table 2.26
Basic Input Format of Watch-expressions
Expression
Description
Name of a C language variable
Address of a C language variable
Expression [Expression
Element of an array
Expression.Member name
Value of a structure/union/class member
Expression->Member name
Value of a structure/union/class member that is pointed to
*Expression
Value of pointer variable
&Expression
Location address
Name of a CPU register
Value of the CPU register
Name of an I/O register
Value of the I/O register
Label nameNote, EQU symbol nameNote and
and [immediate value]
Values of a label, a value of an EQU symbol, and an immediate address
Integer constant
Integer constant value
Floating constant
Floating point constant value
Character constant
Character constant value
Note
If the label name or EQU symbol name includes a "$", be sure to enclose the name in "{ }" (e.g.
{$Label}).
Any imaginary number must be multiplied by an uppercase "I" (e.g. 1.0 + 2.0*I). When you specify the CPU register name "I", add ":REG" (e.g. I:REG) to distinguish it from the keyword "I" that
indicates an imaginary number.
From "Table 2.26 Basic Input Format of Watch-expressions", the following watch-expressions with operator can
be constructed. For the operators listed in the table below, the expression is parsed according to C language
specifications.
R20UT3456EJ0100 Rev.1.00
Aug 01, 2015
Page 132 of 281
CS+ V3.02.00
2. FUNCTIONS
Table 2.27
Construction of Expressions with Operators
Expression
Description
(Expression)
Specifies the order in which operations are performed
! Expression
Inverts symbol
- Expression
Logical negation
Expression * ExpressionNote
Multiplication
Expression / ExpressionNote
Division
Expression %
ExpressionNote
Remainder calculation
Expression + ExpressionNote
Addition
Expression . ExpressionNote
Subtraction
Expression & ExpressionNote
Logical multiplication by bits
ExpressionNote
Exclusive disjunction by bits
Expression ^
Expression | ExpressionNote
Note
Logical sum by bits
Variables and functions can be combined by an operator only with variables, functions and integer constants.
C variable name + I/O register name
2.18.2 Symbol name completion function
This function helps users input data by selecting one of the listed symbol names that exist in the program, when specifying an address expression and so on.
The list of symbol names appears by pressing the [Ctrl] + [Space] keys when a part of the target symbol name is being
input in the text box that supports this function. In this list, double-click the target symbol name (or press the [Space]/
[Enter] key after selecting it by using the [Up]/[Down] key) to complement the symbol name currently being input.
At this time, if a key other than the [Space]/[Enter] key is pressed or the focus moves to outside the panel/dialog box currently being operated, then the list of symbol names will disappear (the symbol name completion will not be performed).
Caution 1.
If there are no character strings in the text box or there are no candidates of the symbol, then the list of
symbol names will not appear.
Caution 2.
Since the information for use by the symbol name completion function is generated while symbols are
being downloaded, the time taken for downloading and the memory usage on the host machine will
increase when this function is enabled. Therefore, if you do not intend to use the symbol name completion function, we recommend invalidating this function by selecting [No] in the [Generate the information
for input completion] item in the Download Files dialog box ([Yes] is selected by default).
Note, however, that if GHS compiler is used, it is not possible to invalidate this function (a specification of
the [Generate the information for input completion] item will be ignored).
Remark
See the explanation of the corresponding panel/dialog box as to whether this function can be used or not
when inputting a symbol name.
R20UT3456EJ0100 Rev.1.00
Aug 01, 2015
Page 133 of 281
CS+ V3.02.00
2. FUNCTIONS
Figure 2.137 Symbol Name Completion Function
Press the [Ctrl] + [Space] keys.
Select the target symbol name from this list displayed.
2.18.3 Icons for invalid input
In some of the dialog boxes in CS+, the
ing sign.
Remark
Placing the cursor over the
entered.
R20UT3456EJ0100 Rev.1.00
Aug 01, 2015
icon will appear at a point where incorrect characters are entered as a warnicon will pop up the information that indicates the characters to be
Page 134 of 281
CS+ V3.02.00
A. WINDOW REFERENCE
A. WINDOW REFERENCE
Appendix A provides detailed explanations of windows/panels/dialog boxes used for debugging with CS+.
A.1 Description
Windows/panels/dialog boxes for debugging are listed below.
Table A.1
Window/Panel/Dialog Box List
Window/Panel/Dialog Box Name
Description
Main window
Controls the program execution. Various windows, panels and dialog
boxes can be opened from this window.
Debug Manager panel
Selects a core (PE) to be debugged and displays the core status.
Project Tree panel
Selects the debug tool to use.
Property panel
Displays detailed information on the debug tool currently selected in
the Project Tree panel, and enables the settings of the tool to be
changed.
Memory panel
Displays and modifies memory values.
Disassemble panel
Displays the results of memory value disassemble and is used to execute line assemble and instruction level debug.
CPU Register panel
Displays the contents of CPU registers, and modifies register values.
IOR panel
Displays and modifies I/O register values.
Local Variables panel
Displays and modifies local variables.
Watch panel
Displays and modifies registered watch-expression values.
Call Stack panel
Displays call stack information on function calls.
Trace panel
Displays trace data acquired from the debug tool.
Events panel
Displays detailed information on set events, switches the events
between enabled and disabled, or deletes them.
Output panel
Displays messages output from the build tool/debug tool/plug-ins, or
the results of batch searches carried out using the Find and Replace
dialog box.
Memory Mapping dialog box
Displays the memory mapping.
Download Files dialog box
Selects files to be downloaded and sets the download conditions.
Flash Options Setting dialog box
Configures options for the flash memory.
Select Priority Boot Loader Project dialog
box
Selects the one that you wish to take precedence over other projects in
stand-along debugging.
Action Events dialog box
Sets action events.
Column Number Settings dialog box
Specifies the number of view columns of memory values on the Memory panel.
Address Offset Settings dialog box
Specifies an offset value for the address display on the Memory panel.
Memory Initialize dialog box
Initializes memory.
Memory Search dialog box
Searches memory.
Print Address Range Settings dialog box
Sets the address range to print the contents of the Disassemble panel.
R20UT3456EJ0100 Rev.1.00
Aug 01, 2015
Page 135 of 281
CS+ V3.02.00
A. WINDOW REFERENCE
Window/Panel/Dialog Box Name
Description
Trace Search dialog box
Searches trace data.
Detailed Settings of Point Trace dialog box
[Full-spec emulator][E1][E20]
Displays and modifies the detailed information on the point trace
event.
Detailed Settings of Timer Measurement
dialog box [Full-spec emulator][E1][E20]
Displays and modifies the detailed information on the timer event.
Scroll Range Settings dialog box
Sets the scroll range for the Memory panel/Disassemble panel.
Go to the Location dialog box
Moves the caret to the specified position.
Data Save dialog box
Saves the settings and other data displayed in the respective windows/
panels/dialog boxes or saves upload data.
Specified Section dialog box
Specifies the range for skipping step execution.
R20UT3456EJ0100 Rev.1.00
Aug 01, 2015
Page 136 of 281
CS+ V3.02.00
A. WINDOW REFERENCE
Main window
This window is automatically opened when CS+ is started up.
In this window, you can control the program execution and open panels for the debugging process.
Figure A.1
Main Window
(1)
(2)
(3)
(4)
This section describes the following.
- [How to open]
- [Description of each area]
[How to open]
- From the Windows [Start] menu, select [All Programs] >> [Renesas Electronics CS+] >> [CS+ for CC].
Remark
In Windows 8 or Windows 8.1, select [CS+ for CC (RL78,RX,RH850)] on the start screen.
In Windows 10, select Windows [Start] menu >> [All apps] >> [Renesas Electronics CS+] >> [CS+ for CC
(RL78,RX,RH850)].
[Description of each area]
(1)
Menubar
Menu items related to the debugging are described below.
Remark
(a)
The items that can be selected in each menu can be customized using the User Setting dialog box.
[View]
The [View] menu provides the following items and functions (default).
Debug Manager
R20UT3456EJ0100 Rev.1.00
Aug 01, 2015
Opens the Debug Manager panel
This item is disabled when the selected microcontroller version does not support
multi-core or when disconnected from the debug tool.
Page 137 of 281
CS+ V3.02.00
Watch
(b)
A. WINDOW REFERENCE
The following cascade menus are displayed to open the Watch panel.
These items are disabled when disconnected from the debug tool.
Watch1
Opens the Watch panel (Watch1).
Watch2
Opens the Watch panel (Watch2).
Watch3
Opens the Watch panel (Watch3).
Watch4
Opens the Watch panel (Watch4).
Local Variable
Opens the Local Variables panel.
Call Stack
Opens the Call Stack panel.
Memory
The following cascade menus are displayed to open the Memory panel.
These items are disabled when disconnected from the debug tool.
Memory1
Opens the Memory panel (Memory1).
Memory2
Opens the Memory panel (Memory2).
Memory3
Opens the Memory panel (Memory3).
Memory4
Opens the Memory panel (Memory4).
IOR
Opens the IOR panel.
This item is disabled when disconnected from the debug tool.
CPU Register
Opens the CPU Register panel.
This item is disabled when disconnected from the debug tool.
Trace
Opens the Trace panel.
This item is disabled when disconnected from the debug tool.
Disassemble
The following cascade menus are displayed to open the Disassemble panel.
These items are disabled when disconnected from the debug tool.
Disassemble1
Opens the Disassemble panel (Disassemble1).
Disassemble2
Opens the Disassemble panel (Disassemble2).
Disassemble3
Opens the Disassemble panel (Disassemble3).
Disassemble4
Opens the Disassemble panel (Disassemble4).
Event
Opens the Events panel.
This item is disabled when disconnected from the debug tool.
Show Current PC
Location
Displays the current PC position in the Editor panel.
This item is disabled when disconnected from the debug tool.
Back to Last Cursor
Position
Goes back to the position before jumping (see "2.6.2.4 Move to the symbol defined
location") to the defined location.
This item is disabled when disconnected from the debug tool.
Forward to Next Cursor Position
Forwards to the position before operating [Back to Last Cursor Position].
Tag Jump
Jumps to the corresponding line/column in the corresponding file if the information of
a file name/line number/column number exists in the line at the caret position on the
Editor panel/Output panel.
[Debug]
The [Debug] menu provides the following items and functions (default).
R20UT3456EJ0100 Rev.1.00
Aug 01, 2015
Page 138 of 281
CS+ V3.02.00
A. WINDOW REFERENCE
Download
Downloads the specified file(s) into the debug tool currently selected in the active
project.
If CS+ is disconnected from the debug tool at this time, it is automatically connected
to the debug tool before a download is executed.
This item is disabled during program execution/build (not including rapid build) execution.
Build & Download
Builds a project and executes a download to the debug tool currently selected in the
active project after the build is complete. If CS+ is disconnected from the debug tool
at this time, it is automatically connected to the debug tool before a download is executed.
This item is disabled during program execution/build (not including rapid build) execution.
When the build has failed, download will not be executed.
Rebuild & Download
Rebuilds a project and executes a download to the debug tool currently selected in
the active project after the rebuild is complete. If CS+ is disconnected from the
debug tool at this time, it is automatically connected to the debug tool before a download is executed.
This item is disabled during program execution/build (not including rapid build) execution.
When the rebuild has failed, download will not be executed.
Connect to Debug
Tool
Connects to the debug tool currently selected in the active project.
This item is disabled while connected to the debug tool, during build (not including
rapid build) execution or if the version of compiler being used is not supported by
CS+.
Upload...
Opens the Data Save dialog box to save the memory contents.
This item is disabled during program execution/build (not including rapid build) execution or when disconnected from the debug tool.
Disconnect from
Debug Tool
Disconnects from the currently connected debug tool.
This item is disabled during program execution/build (not including rapid build) execution or when disconnected from the debug tool.
Using Debug Tool
The following cascade menus are displayed to select the debug tool to use.
Note that the debug tools displayed in this menu differ depending on the microcontroller selected in the project.
RH850 Full-spec
emulator
Uses Full-spec emulator as the debug tool.
RH850 E1(LPD)
Uses E1 in LPD communication mode as the debug tool.
RH850 E20(LPD)
Uses E20 in LPD communication mode as the debug tool.
RH850 Simulator
Uses Simulator as the debug tool.
Stop
Forcibly stops the program currently being executed.
This item is disabled when the program is already halted or disconnected from the
debug tool.
Go
Executes the program from the current PC position.
Execution of the program will be stopped when the condition of a set break event is
met.
This item is disabled during program execution/build (not including rapid build) execution or when disconnected from the debug tool.
Ignore break and go
Executes the program from the current PC position.
Execution of the program continues, ignoring set break events and action events.
This item is disabled during program execution/build (not including rapid build) execution or when disconnected from the debug tool.
R20UT3456EJ0100 Rev.1.00
Aug 01, 2015
Page 139 of 281
CS+ V3.02.00
Step In
Executes the program step by stepNote from the current PC position (Step in execution).
However, in the case of a function call, the program is stopped at the beginning of
the function having been called.
This item is disabled during program execution/build (not including rapid build) execution or when disconnected from the debug tool.
Step Over
Executes the program step by stepNote from the current PC position (Step over execution).
In the case of a function call by the jarl instruction, all the source lines/instructions in
the function are treated as one step and executed until the position where execution
returns from the function (step-by-step execution will continue until the same nest is
formed as when the jarl instruction has been executed).
In the case of an instruction other than jarl, operation is the same as when [Step In] is
selected.
This item is disabled during program execution/build (not including rapid build) execution or when disconnected from the debug tool.
Return Out
Executes the program until execution returns from the current function (or returns to
the calling function)Note(Return out execution).
This item is disabled during program execution/build (not including rapid build) execution or when disconnected from the debug tool.
CPU Reset
Resets the CPU (does not execute a program)
This item is disabled during build (not including rapid build) execution or when disconnected from the debug tool.
Restart
Resets the CPU and then executes the program from the reset address.
This item is disabled during build (not including rapid build) execution or when disconnected from the debug tool.
Rewind debug tool
state
Rewinds the debug tool to the last state that was automatically saved.
Note that the data to be rewound is limited to memory and register values that can be
read or written.
To use this debugging function, it has to be set so in the Option dialog box.
Save debug tool state
The following menus are relevant to saving and restoring of the state of the debug
tool.
Note that the data to be saved is limited to memory and register values that can be
read or written.
Restore debug tool
state n
Restores the state of the debug tool from the n-th data file.
Save debug tool
state n
Saves the current state of the debug tool in a file as the n-th data.
Note
(2)
A. WINDOW REFERENCE
Step execution can be carried out either in units of source lines or in units of instructions.
For details, see "2.8.3 Execute programs in steps".
Debug toolbar
The debug toolbar includes the buttons that control the execution of programs.
The debug toolbar provides the following buttons and functions (default).
Remark 1.
The buttons on the toolbar can be customized using the User Setting dialog box. Furthermore, a
new toolbar can be created using the same dialog box.
Remark 2.
A Group of toolbar displayed can be selected with the context menu that is displayed by rightclicking on the toolbar.
Executes the build of a project and downloads the file into the debug tool currently selected in the
active project. If CS+ is disconnected from the debug tool at this time, it is automatically connected to the debug tool before a download is executed.
This item is disabled during program execution/build (not including rapid build) execution.
When the build has failed, download will not be executed.
The function of this item is the same as that of [Build & Download] in the [Debug] menu.
R20UT3456EJ0100 Rev.1.00
Aug 01, 2015
Page 140 of 281
CS+ V3.02.00
A. WINDOW REFERENCE
Downloads the specified file(s) into the debug tool currently selected in the active project.
If CS+ is disconnected from the debug tool at this time, it is automatically connected to the debug
tool before a download is executed.
This item is disabled during program execution/build (not including rapid build) execution.
The function of this item is the same as that of [Download] in the [Debug] menu.
Resets the CPU (does not execute a program)
This item is disabled during build (not including rapid build) execution or when disconnected from
the debug tool.
The function of this item is the same as that of [CPU Reset] in the [Debug] menu.
Forcibly stops the program currently being executed.
This item is disabled when the program is already halted or disconnected from the debug tool.
The function of this item is the same as that of [Stop] in the [Debug] menu.
Executes the program from the current PC position.
Execution of the program will be stopped when the condition of a set break event is met.
This item is disabled during program execution/build (not including rapid build) execution or when
disconnected from the debug tool.
The function of this item is the same as that of [Go] in the [Debug] menu.
Executes the program from the current PC position.
Execution of the program continues, ignoring set break events and action events.
This item is disabled during program execution/build (not including rapid build) execution or when
disconnected from the debug tool.
The function of this item is the same as that of [Ignore break and go] in the [Debug] menu.
Resets the CPU and then executes the program from the reset address.
This item is disabled during build (not including rapid build) execution or when disconnected from
the debug tool.
The function of this item is the same as that of [Restart] in the [Debug] menu.
Executes the program step by stepNote from the current PC position (Step in execution).
However, in the case of a function call, the program is stopped at the beginning of the function
having been called.
This item is disabled during program execution/build (not including rapid build) execution or when
disconnected from the debug tool.
The function of this item is the same as that of [Step In] in the [Debug] menu.
Executes the program step by stepNote from the current PC position (Step over execution).
In the case of a function call by the jarl instruction, all the source lines/instructions in the function
are treated as one step and executed until the position where execution returns from the function
(step-by-step execution will continue until the same nest is formed as when the jarl instruction
has been executed).
In the case of an instruction other than jarl, operation is the same as when the
button is
clicked.
This item is disabled during program execution/build (not including rapid build) execution or when
disconnected from the debug tool.
The function of this item is the same as that of [Step Over] in the [Debug] menu.
Executes the program until execution returns from the current function (or returns to the calling
function)Note (Return out execution).
This item is disabled during program execution/build (not including rapid build) execution or when
disconnected from the debug tool.
The function of this item is the same as that of [Return Out] in the [Debug] menu.
Disconnects from the currently connected debug tool.
This item is disabled during program execution/build (not including rapid build) execution or when
disconnected from the debug tool.
The function of this item is the same as that of [Disconnect from Debug Tool] in the [Debug]
menu.
Note
Step execution can be carried out either in units of source lines or in units of instructions.
For details, see "2.8.3 Execute programs in steps".
R20UT3456EJ0100 Rev.1.00
Aug 01, 2015
Page 141 of 281
CS+ V3.02.00
A. WINDOW REFERENCE
(3)
Panel display area
This area displays the various panels.
For details on the display content, see the sections describing the individual panels.
(4)
Statusbar
Statusbar displays the following items of information.
Figure A.2
Statusbar
(a)
(a)
(b)
(c)
(d)
(e)
(f)
(g)
(h)
(i)
Status message
This area displays the following messages and other information.
- A brief explanation of the selected menu item
- A message reporting that an invalid value has been input in the panel/dialog
- A message reporting that the specified character string has not been found as a result of a search using the
Find and Replace dialog box
- A statement of the cause of the break when a break has occurred (see "2.9 Stop Programs (Break)")
(b)
Focus panel status information
This area displays status information on the panel currently having the focus.
Note that nothing is displayed here for a panel that has no status information.
(c)
Selection of debug target core
This area is used to select a core (PE) to be debugged (see "2.7 Select a Core (PE)").
Note that nothing is displayed here when the selected microcontroller version does not support multi-core or
when disconnected from the debug tool.
(d)
Running state
This area displays the state of the program with the following icons and character strings.
Note that nothing is displayed here when the debug tool is not connected.
State of Program
(e)
Displayed Content
Under execution
RUN
Now halted
BREAK
Step execution in progress
STEP
CPU status
This area displays the current CPU status of the debug tool. When there is the possibility that the CPU is in two
or more statuses, the corresponding display contents are displayed separated by "&".
Note that nothing is displayed here when the debug tool is not connected.
Debug Tool
Full-spec emulator
E1/E20
Simulator
R20UT3456EJ0100 Rev.1.00
Aug 01, 2015
Displayed Content
CPU Status
Halt
In HALT mode
Stop
In STOP mode
Reset
In reset state
Pow Off
Power not supplied to the target
Halt
In HALT mode
StopIdle
In STOP mode or IDLE mode
Reset
In reset state
Page 142 of 281
CS+ V3.02.00
(f)
(g)
A. WINDOW REFERENCE
Current PC position
This area displays the current PC position with a hexadecimal value. When this area is clicked, the caret moves
to the current PC position on the Editor panel.
In addition, when the mouse pointer is placed over this area, a pop-up window appears to display the following
information: "Current PC: 0x current PC value (source name#line countNote)".
Note that nothing is displayed here when the debug tool is not connected.
Note
"symbol name+offset value" is displayed when acquisition of information is impossible.
Remark
"Running" is displayed in this area during execution of a program.
Connection state
This area displays the current state of connection with the debug tool using the following icons and character
strings.
Connection State
(h)
Displayed Content
Connected
Debug tool name
Disconnected
DISCONNECTED
Run-Break Timer measurement result
This area displays the result of measurement by the Run-Break Timer event (the unit of value used differs
depending on the measurement amount). See "2.13.1 Measure execution time until stop of the execution".
Note that nothing is displayed here when the debug tool is not connected.
Condition
(i)
Displayed Content
Un-measuring
Not measured
Under measurement
Measuring
When a timer measurement overflow has
occurred
OVERFLOW
Debug tool state
This area displays the current state of debug tool's functions using the following icons and character strings.
Note that nothing is displayed here when the debug tool is not connected.
Function
Use
Being Executed
Not Use
Stopped
Trace
Timer
Coverage
Remark
[Simulator]
When the program is halted, clicking the appropriate icon enables the state to be switched
between "Use" and "Not use". The result of switching will be reflected in the setting of the [Use
trace function]/[Use timer function]/[Use coverage function] property in the [Trace]/[Timer]/[Coverage] category on the [Debug Tool Settings] tab of the Property panel.
R20UT3456EJ0100 Rev.1.00
Aug 01, 2015
Page 143 of 281
CS+ V3.02.00
A. WINDOW REFERENCE
Debug Manager panel
When the selected microcontroller is the multi-core product, this panel is used to select a core (PE: Processer Element)
to be debugged and display the core status (see "2.7 Select a Core (PE)").
This panel appears only when connected to the debug tool.
Caution
This panel cannot be opened when the selected microcontroller is the single-core product.
Figure A.3
Debug Manager Panel
[Toolbar]
(1)
(2)
This section describes the following.
- [How to open]
- [Description of each area]
- [Toolbar]
[How to open]
- From the [View] menu, select [Debug Manager].
[Description of each area]
(1)
[Selects debug target core] area
Select a core (PE) to be debugged with a option button.
Note that this area becomes invalid during execution of a program.
Remark
(2)
[Debug target core status] area
This area displays the status of the core currently being selected.
Remark
(a)
You can also select a core to be debugged on the statusbar in the Main window.
You can also confirm the information displayed in this area on the statusbar in the Main window.
[Running status]
Displays the current state of the program with the following icons and character strings.
State of Program
Displayed Content
Running
RUN
Stopped
BREAK
In step execution
STEP
R20UT3456EJ0100 Rev.1.00
Aug 01, 2015
Page 144 of 281
CS+ V3.02.00
(b)
A. WINDOW REFERENCE
[Core status]
Displays the current core statuses of the debug tool. When there is the possibility that the core is in two or more
statuses, the corresponding display contents are displayed separated by "&".
Debug Tool
Full-spec emulator
E1/E20
Simulator
(c)
Displayed Content
Core Status
Halt
In HALT mode
StopIdle
In Hardware STOP/Software STOP/IDLE mode
Hold
In bus hold
Wait
In wait state
Reset
In reset state
Pow Off
Power not supplied to the target
Halt
In HALT mode
StopIdle
In STOP/IDLE mode
Reset
In reset state
[Current PC]
Displays the current PC position with a hexadecimal value. When this button is clicked, the caret moves to the
current PC position on the Editor panel.
[Toolbar]
The function of this toolbar is the same as that of the Debug toolbar on the Main window. For details on the function of
each button, see "(2) Debug toolbar".
R20UT3456EJ0100 Rev.1.00
Aug 01, 2015
Page 145 of 281
CS+ V3.02.00
A. WINDOW REFERENCE
Project Tree panel
This panel is used to display the project components (Microcontroller, Build Tool, Debug Tool, etc.) in a tree structure.
On this panel, you can select or change the debug tool to use.
Figure A.4
Project Tree Panel
(1)
The following items are explained here.
- [How to open]
- [Description of each area]
- [Context menu]
[How to open]
- From the [View] menu, select [Project Tree].
[Description of each area]
(1)
Project tree area
Project components are displayed in tree view with the following given node.
Node
Microcontroller type Debug tool name (Debug
tool)
Description
- Microcontroller type:
The selected microcontroller type is displayed.
- Debug tool name:
The debug tool (Full-spec emulator, E1, E20, or Simulator)
currently being used in the project is displayedNote.
Simulator is selected when a new project is created.
Note
The selectable debug tools differ depending on the microcontroller selected in the project.
Select the debug tool node to configure with the Property panel. If the Property panel is not being opened, doubleclick the node to open the corresponding Property panel.
R20UT3456EJ0100 Rev.1.00
Aug 01, 2015
Page 146 of 281
CS+ V3.02.00
A. WINDOW REFERENCE
[Context menu]
Using Debug Tool
The following cascade menus are displayed to select the debug tool to use.
Note that the debug tools displayed in this menu differ depending on the
microcontroller selected in the project.
RH850 Full-spec emulator
Uses Full-spec emulator as the debug tool.
RH850 E1(LPD)
Uses E1 in LPD communication mode as the debug tool.
RH850 E20(LPD)
Uses E20 in LPD communication mode as the debug tool.
RH850 Simulator
Uses Simulator as the debug tool.
Property
R20UT3456EJ0100 Rev.1.00
Aug 01, 2015
Displays the selected category node's property in the Property panel.
Page 147 of 281
CS+ V3.02.00
A. WINDOW REFERENCE
Property panel
This panel is used to display and set the debug tool operation environment that is selected in the Project Tree panel.
Figure A.5
Property Panel (When E1 Is Selected)
(1)
(2)
This section describes the following.
- [How to open]
- [Description of each area]
- [[Edit] menu (Property panel-dedicated items)]
- [Context menu]
[How to open]
- On the Project Tree panel, select the [Microcontroller type Debug tool name (Debug Tool)] node to use, and then select
[Property] from the [View] menu or the context menu.
- On the Project Tree panel, double-click the [Microcontroller type Debug tool name (Debug Tool)] node to use.
Remark
If this panel has been opened, the detailed information on the debug tool is displayed by selecting the
[Microcontroller type Debug tool name (Debug Tool)] node on the Project Tree panel.
[Description of each area]
(1)
Detailed information display/change area
In this area, the detailed information on the debug tool that is selected in Project Tree panel is displayed by category in the list. Also, you can directly change its settings.
The
mark is indicates all the items in the category are expanded. The
mark indicates all the items are collapsed. You can expand/collapse the items by clicking these marks or double-clicking the category name.
Note that only the hexadecimal number is allowed in the text box if the
mark is displayed in the property
configuration area.
For details on the information/how to setup in the category and property items contained in it, see the section
explaining the corresponding tab.
R20UT3456EJ0100 Rev.1.00
Aug 01, 2015
Page 148 of 281
CS+ V3.02.00
(2)
A. WINDOW REFERENCE
Tab selection area
Categories for the display of the detailed information are changed when each tab is selected.
In this panel, following tabs are contained (see the section explaining each tab for details on the display/setting on
the tab).
- [Connect Settings] tab
- [Debug Tool Settings] tab
- [Download File Settings] tab
- [Flash Options Settings] tab
- [Hook Transaction Settings] tab
[[Edit] menu (Property panel-dedicated items)]
Undo
Undoes the latest property value editing being done.
Cut
Deletes the selected character string(s) and copies them to the clipboard while editing the
property value.
Copy
Copies the contents of the selected range to the clipboard as character string(s).
Paste
Pastes the contents of the clipboard to the property value while editing the property value.
Delete
Deletes the selected character string(s) while editing the property value.
Select All
Selects all the character strings in the selected property while editing the property value.
Find...
Opens the Find and Replace dialog box with selecting [Quick Find] tab.
[Context menu]
[While not editing the property value]
Reset to Default
Restores the selected setting of the property item to default value.
Reset All to Default
Restores all the selected settings of the property items on the tab to default value.
[While editing the property value]
Undo
Undoes the latest property value editing being done.
Cut
Deletes the selected character string(s) and copies them to the clipboard while editing the
property value.
Copy
Copies the contents of the selected range to the clipboard as character string(s).
Paste
Pastes the contents of the clipboard to the property value while editing the property value.
Delete
Deletes the selected character string(s) while editing the property value.
Select All
Selects all the character strings in the selected property while editing the property value.
R20UT3456EJ0100 Rev.1.00
Aug 01, 2015
Page 149 of 281
CS+ V3.02.00
A. WINDOW REFERENCE
[Connect Settings] tab
This tab is used to display the detailed information categorized by the following and the configuration can be changed.
(1)
(2)
(3)
(4)
(5)
[Clock]
[Connection with Target Board] [Full-spec emulator][E1][E20]
[Flash] [Full-spec emulator][E1][E20]
[Configuration] [Simulator]
[CPU virtualization support function]
Figure A.6
Property Panel: [Connect Settings] Tab [Full-spec emulator]
(1)
(2)
(3)
(5)
Figure A.7
Property Panel: [Connect Settings] Tab [E1][E20]
(1)
(2)
(3)
(5)
R20UT3456EJ0100 Rev.1.00
Aug 01, 2015
Page 150 of 281
CS+ V3.02.00
Figure A.8
A. WINDOW REFERENCE
Property Panel: [Connect Settings] Tab [Simulator]
(1)
(4)
(5)
[Description of each category]
(1)
[Clock]
The detailed information on clocks is displayed and its configuration can be changed.
Mount main clock on
target board
Main clock frequency
[MHz]
Select whether to mount the main clock on the target board.
Select [No] when you use the on-chip oscillation circuit instead of the main clock circuit.
Default
Yes
Modifying
Select from the drop-down list.
Available
values
Yes
Mounts the main clock.
No
Does not mount the main clock.
Specify the main clock frequency (before multiplication) in MHz unit.
Default
[Full-spec emulator][E1][E20]
10.00
[Simulator]
320.00
Modifying
Select from the drop-down list or directly enter from the keyboard.
Available
values
Either one of the following from the drop-down list
[Full-spec emulator][E1][E20]
10.00, 20.00 (unit: MHz)
[Simulator]
1.00, 2.00, 3.00, 3.57, 4.00, 4.19, 4.91, 5.00, 6.00, 7.20, 8.00, 8.38, 9.60,
10.00, 12.00, 16.00, 20.00, 25.00, 30.00, 32.00, 33.33, 34.00, 40.00,
48.00, 50.00, 64.00, 80.00, 160.00, 240.00, 320.00 (unit: MHz)
Directly enter the numbers ranged below
0.001 to 999.999 (unit: MHz)
CPU clock frequency[MHz]
[Full-spec emulator]
[E1][E20]
Specify the CPU clock frequency for each core.
The CPU clock frequency for each core can be specified with subproperties of this
property. The CPU clock frequency is used to convert the time stamp information for a
trace to an actual time.
The number of subproperties displayed differs with the selected microcontroller.
Core name
(Subproperty)
[Full-spec emulator]
[E1][E20]
Displays the name of the core incorporated in the selected microcontroller.
R20UT3456EJ0100 Rev.1.00
Aug 01, 2015
Default
Depends on the selected microcontroller
Modifying
Changes not allowed
Page 151 of 281
CS+ V3.02.00
A. WINDOW REFERENCE
CPU clock frequency
(Subproperty)
[Full-spec emulator]
[E1][E20]
Select Timer/Trace
clock frequency
[Simulator]
Unit of Timer/Trace
clock frequency
[Simulator]
Timer/Trace clock
frequency
[Simulator]
(2)
Specify the CPU clock frequency (after multiplication) of the core name.
Default
Depends on the selected microcontroller
Modifying
Select from the drop-down list or directly enter from the keyboard.
Available
values
0.001 to 999.999 (unit: MHz)
Displays the clock frequency for using timer/trace function.
Default
CPU clock frequency
Modifying
Changes not allowed
Displays the unit of the clock frequency for using timer/trace function.
Default
MHz
Modifying
Changes not allowed
Displays the value of the clock frequency for using timer/trace function.
Note, however, that "---_---" is displayed while disconnected from the debug tool.
Default
320.00
Modifying
Changes not allowed
[Connection with Target Board] [Full-spec emulator][E1][E20]
The detailed information on the connection to the target board is displayed and its configuration can be changed.
Caution
Properties in this category cannot be changed when CS+ is connected to the debug tool.
Connecting with target board
[Full-spec emulator]
LPD mode
[E1][E20]
Baud rate [kbps]
[E1][E20]
R20UT3456EJ0100 Rev.1.00
Aug 01, 2015
Select whether the target board is connected to Full-spec emulator.
Default
No
Modifying
Select from the drop-down list.
Available
values
Yes
Target board is connected.
No
Target board is not connected.
Select LPD communication mode to be used.
Default
Depends on the selected microcontroller.
Modifying
Select from the drop-down list.
Available
values
Depends on the selected microcontroller.
Select the baud rate for LPD communication.
This property appears only when the [LPD mode] property is set to [1pin].
Default
500
Modifying
Select from the drop-down list.
Available
values
500, 1000, 2000 (unit: Kbps)
Page 152 of 281
CS+ V3.02.00
LPD clock frequency
[kHz]
[E1][E20]
Power target from
the emulator (MAX
200mA)
[E1]
Supply voltage
[E1]
Set OPJTAG in LPD
connection before
connecting
[E1][E20]
Set OPJTAG in
JTAG connection
before disconnecting
[E1][E20]
R20UT3456EJ0100 Rev.1.00
Aug 01, 2015
A. WINDOW REFERENCE
Specify the clock frequency for LPD communication.
When [Default] is selected, the default value specific to the microcontroller is used in
connection to the target board.
This property appears only when the [LPD mode] property is set to [4pin].
Default
Blank
Modifying
Select from the drop-down list.
Available
values
Default, 5500, 11000 (unit: kHz)
Select whether to supply power to the target board from E1.
Default
No
Modifying
Select from the drop-down list.
Available
values
Yes
Supplies power to the target board.
No
Does not supply power to the target board.
Select the power voltage supplied to the target board.
This property appears only when the [Power target from the emulator (MAX 200mA)]
property is set to [Yes].
Default
3.3V
Modifying
Select from the drop-down list.
Available
values
3.3V, 5.0V
Select whether to start up the microcontroller in serial programming mode upon connection to the debug tool and change the option byte settings to select LPD connection.
Default
Yes
Modifying
Select from the drop-down list.
Available
values
Yes
Starts up the microcontroller in serial programming mode upon
its connection to CS+. The debug tool then checks the OPJTAG
byte and, if LPD is not selected, changes the setting to select
LPD. After that, the microcontroller enters debugging mode
(default).
No
Starts up the microcontroller in debugging mode upon its connection to CS+. The debug tool then checks OPJTAG and, if LPD is
not selected, shows a message dialog box.
Select whether to change the option byte settings to select JTAG connection before disconnection of the debug tool.
Default
No
Modifying
Select from the drop-down list.
Note that changes can be made only when the [Set OPJTAG in LPD connection before connecting] property is set to [Yes].
Available
values
Yes
Changes the option byte settings to select JTAG connection
before disconnection of the debug tool.
No
Does not change the option byte settings before disconnection of
the debug tool.
Page 153 of 281
CS+ V3.02.00
A. WINDOW REFERENCE
Initialize RAM when
connecting
[Full-spec emulator]
[E1][E20]
(3)
Select whether to initialize the RAM when connecting to the debug tool.
Default
Yes
Modifying
Select from the drop-down list.
Available
values
Yes
Initializes the RAM.
No
Does not initialize the RAM.
[Flash] [Full-spec emulator][E1][E20]
The detailed information on the flash memory writing is displayed and its configuration can be changed.
Caution
The properties in this category may vary with the selected microcontroller.
Properties in this category cannot be changed when CS+ is connected to the debug tool.
Security ID
[E1][E20]
Specify the ID code when reading the code from the internal ROM or internal flash
memoryNote 1.
Using the code flash
self programming
Change the clock to
flash writing
Default
FFFFFFFFFFFFFFFFFFFFFFFFFFFFFFFF
Modifying
Directly enter from the keyboard.
Available
values
32 digits hexadecimal number (16 bytes)
Select whether to rewrite the code flash by using the flash self library of the flash self
programming function.
Default
No
Modifying
Select from the drop-down list.
Available
values
Yes
Rewrites the code flash. If [Yes] is selected, the code flash will
not be cashed.
No
Does not rewrite the code flash.
Select whether to increase the clock speed temporarily for writing to the flash memoryNote 2.
Default
Yes
Modifying
Select from the drop-down list.
Available
values
Yes
Overclocks for writing to the flash memory.
No
Does not overclock for writing to the flash memory.
Note 1.
For details on ID code, see User's Manual of the emulator used.
Note 2.
Selecting [Yes] may affect the peripheral system that is operating during a break because not only
the CPU clock frequency but also the peripheral clock frequency changes.
When [No] is selected, the time of flash rewrite by the debugger operation will increase if the set
clock speed is low.
(4)
[Configuration] [Simulator]
The property in this category is always disabled.
(5)
[CPU virtualization support function]
The property in this category is always disabled.
R20UT3456EJ0100 Rev.1.00
Aug 01, 2015
Page 154 of 281
CS+ V3.02.00
A. WINDOW REFERENCE
[Debug Tool Settings] tab
This tab is used to display the detailed information categorized by the following and the configuration can be changed.
(1) [Memory]
(2) [Access Memory While Running]
(3) [Set Event While Running] [Full-spec emulator][E1][E20]
(4) [Break] [Full-spec emulator][E1][E20]
(5) [Trace]
(6) [Timer] [Simulator]
(7) [Mask for Input Signal] [Full-spec emulator][E1][E20]
(8) [Coverage] [Simulator]
(9) [Simulator GUI] [Simulator]
(10) [Multi core] [Full-spec emulator][E1][E20]
(11) [Step function]
Figure A.9
Property Panel: [Debug Tool Settings] Tab [Full-spec emulator]
(1)
(2)
(3)
(4)
(5)
(7)
(10)
(11)
R20UT3456EJ0100 Rev.1.00
Aug 01, 2015
Page 155 of 281
CS+ V3.02.00
A. WINDOW REFERENCE
Figure A.10 Property Panel: [Debug Tool Settings] Tab [E1][E20]
(1)
(2)
(3)
(4)
(5)
(7)
(10)
(11)
Figure A.11 Property Panel: [Debug Tool Settings] Tab [Simulator]
(1)
(2)
(5)
(6)
(8)
(9)
(11)
[Description of each category]
(1)
[Memory]
The detailed information on memories is displayed and its configuration can be changed.
R20UT3456EJ0100 Rev.1.00
Aug 01, 2015
Page 156 of 281
CS+ V3.02.00
A. WINDOW REFERENCE
Memory mappings
The state of memory mapping is displayed for each type of memory areaNote 1.
Default
[Sum total by microcontroller's inherent type of memory mapped area]
Modifying
Specify with the Memory Mapping dialog box.
The Memory Mapping dialog box is opened by clicking the [...] button that
appears at right edge of this field when you select this property (you cannot change the memory mapping on this panel).
Displayed
Content
Displays the memory mapping status for each type of memory area.
The following detailed information is displayed by clicking the "+" mark of
each memory type.
- Memory type
- Start address
- End address
- Access width[bits]Note 2 [Full-spec emulator][E1][E20]
Verify on writing to
memory
[Full-spec emulator]
[E1][E20]
(2)
Select whether to perform a verify check when the memory value is initialized.
Default
Yes
Modifying
Select from the drop-down list.
Available
values
Yes
Executes the verify check.
No
Does not execute the verify check.
Note 1.
The type is of the memory mapping area registered in the device file.
Note 2.
This appears only when the memory type is External Memory.
External Memory is displayed only when the selected microcontroller supports the external memory
area.
[Access Memory While Running]
The detailed information on memory accesses while executing a program (real-time display update function: see
"2.10.1.4 Display/modify the memory contents during program execution") is displayed and its configuration can
be changed.
Access during the
execution
[Full-spec
emulator]
[E1][E20]
Update display during the execution
R20UT3456EJ0100 Rev.1.00
Aug 01, 2015
Select whether to allow access to the internal RAM area during execution of a program.
Default
No
Modifying
Select from the drop-down list.
Available
values
Yes
Accesses to the internal RAM area during execution of a program.
No
Does not access to the internal RAM area during execution of a
program.
Select whether to update the display in the Memory panel/Watch panel during a program execution.
Default
Yes
Modifying
Select from the drop-down list.
Available
values
Yes
Updates the display during program execution.
No
Does not update the display during program execution.
Page 157 of 281
CS+ V3.02.00
Display update interval[ms]
(3)
Specify the interval in 100ms unit to update the contents in the Memory panel/Watch
panel display while executing a program.
This property appears only when the [Update display during the execution] property is
set to [Yes].
Default
500
Modifying
Directly enter from the keyboard.
Available
values
Integer number between 100 and 65500 (rounding up the fractions less
than 100 ms)
[Set Event While Running] [Full-spec emulator][E1][E20]
The detailed information on the function of the event setting during program execution is displayed and its configuration can be changed.
Set event by stopping execution
momentarily
(4)
A. WINDOW REFERENCE
Select whether to forcibly pause the execution for events that cannot be set while executing the program or operating the tracer/timer.
For details on the event types that are affected by this property, see "2.16.6.2 Event
types that can be set and deleted during execution".
Default
No
Modifying
Select from the drop-down list.
Available
values
Yes
Sets these events by stopping the program execution or the
tracer/timer operation momentarily.
No
Does not allow to set these events during program execution or
the tracer/timer operation.
[Break] [Full-spec emulator][E1][E20]
The detailed information on break functions is displayed and its configuration can be changed.
Use software break
First using type of
breakpoint
Stop emulation of
peripherals when
stopping
R20UT3456EJ0100 Rev.1.00
Aug 01, 2015
Select whether to use the Software break function [Full-spec emulator][E1][E20]Note.
Default
No
Modifying
Select from the drop-down list.
Note that changes can be made only when program execution is halted.
Available
values
Yes
Uses the software break function.
No
Does not use the software break function.
Select the type of the breakpoint to use with priority when setting it at the source line or
the execution address with a one click operation of the mouse in the Editor panel/Disassemble panel.
Default
Software break
Modifying
Select from the drop-down list.
Available
values
Software break
Sets software breakpoint with priority.
Hardware break
Sets hardware breakpoint with priority.
Select whether to terminate the peripheral emulation while stopping the program execution (Peripheral Break).
Default
No
Modifying
Select from the drop-down list.
Available
values
Yes
Terminates the peripheral emulation.
No
Does not terminate the peripheral emulation.
Page 158 of 281
CS+ V3.02.00
Note
(5)
A. WINDOW REFERENCE
If this property is set to [No] after you have used the software break function, all software break
events and Printf events that have been set will be disabled. Selecting [Yes] in this state does not
automatically restore the events, so you will need to manually enable them.
[Trace]
The detailed information on trace functions is displayed and its configuration can be changed (see "2.12.1 Configure the trace operation").
Caution 1.
[Full-spec emulator][E1][E20]
Properties in this category cannot be changed during program execution.
Caution 2.
[E1][E20]
If the trace function is not mounted on the microcontroller used, all properties in this category
become unchangeable after connecting to the debug tool (the trace function cannot be used).
Select trace data
[Full-spec emulator]
[E1][E20]
Trace priority
[Full-spec emulator]
[E1][E20]
Use trace function
[Simulator]
Clear trace memory
before running
R20UT3456EJ0100 Rev.1.00
Aug 01, 2015
Select the type of the trace data to be acquiredNote 1.
Default
Branch PC + Data Access
Modifying
Select from the drop-down list.
Available
values
Branch
PC
PC values for source/destination instructions of branching during program execution are collected as trace data.
Data
Access
Data information on access-related events that occurred during program execution are collected as trace data.
PC +
Data
Access
PC values for source/destination instructions of branching during program execution, as well as data information on accessrelated events that occurred are collected as trace data.
Select which item should be given priority when collecting the trace dataNote 1.
Default
Speed priority
Modifying
Select from the drop-down list.
Available
values
Speed priority
Traces giving priority to the real-time performance.
Data priority
Traces after stopping the execution pipeline of
the CPU temporarily so that no data is missed.
Select whether to use the trace functionNote 2.
Default
No
Modifying
Select from the drop-down list.
Note that changes can be made only when program execution is halted.
Available
values
Yes
Uses trace functions.
No
Does not use trace functions.
Select whether to clear the trace memory before executing.
Default
Yes
Modifying
Select from the drop-down list.
Available
values
Yes
Clears the trace memory.
No
Does not clear the trace memory.
Page 159 of 281
CS+ V3.02.00
Operation after trace
memory is full
Accumulate trace
time
[Simulator]
Rate of frequency
division of trace time
tag
[Simulator]
Trace range setting
[Full-spec emulator]
[E1][E20]
Trace memory
size[frames]
[Full-spec emulator]
[Simulator]
R20UT3456EJ0100 Rev.1.00
Aug 01, 2015
A. WINDOW REFERENCE
Select the operation after the trace memory is full with the collected trace dataNote 1.
Default
Non stop and overwrite to trace memory
Modifying
Select from the drop-down list.
Available
values
Non stop and overwrite to trace memory
Continues overwriting trace data even after trace
memory is used up.
Stop traceNote 3
Stops overwriting trace data when trace memory
is used up (the program execution will not be
stopped).
Stop
Stops running the program and overwriting trace
data when trace memory is used up.
Select whether to display the accumulated tracing time in the Trace panel.
Default
No
Modifying
Select from the drop-down list.
Available
values
Yes
Displays the accumulated tracing time.
No
Displays the trace time with differential value.
Select the frequency division ratio of the counter to be used for time tag display (the
[Time] item in the Trace panel).
Changing the frequency division ratio here changes the number of clocks necessary to
count up a counter value which is displayed in the time tag.
Default
1/1
Modifying
Select from the drop-down list.
Available
values
1/1, 1/2, 1/4, 1/8, 1/16, 1/32, 1/64, 1/128, 1/256, 1/512, 1/1K, 1/4K, 1/8K,
1/16K, 1/64K, 1/256K, 1/1M
Select the range of trace data to be collected.
Default
Traces section
Modifying
Select from the drop-down list.
Available
values
Traces
section
Collects the execution history as trace data within the section
specified with a trace start event and a trace end event.
Traces
out of
range
Collects the execution history as trace data outside the range
specified with a trace start event and a trace end event.
Select the memory size for storing the trace data by the trace frame numbersNote 1, 4.
Default
[Full-spec emulator]
8K
[Simulator]
4K
Modifying
Select from the drop-down list.
Available
values
[Full-spec emulator]
8K, 32K, 64K, 128K, 256K, 512K
[Simulator]
4K, 8K, 12K, 16K, 20K, 24K, 28K, 32K, 36K, 40K, 44K, 48K, 52K, 56K,
60K, 64K, 128K, 192K, 256K, 320K, 384K, 448K, 512K, 576K, 640K,
704K, 768K, 832K, 896K, 960K, 1M, 2M, 3M
Page 160 of 281
CS+ V3.02.00
A. WINDOW REFERENCE
Enable trace data
complement
[Full-spec emulator]
Trace target
(6)
Default
Yes
Modifying
Select from the drop-down list.
Available
values
Yes
Performs complementary display of trace data.
No
Does not perform complementary display of trace data.
Select the core to be traced.
Default
Debug core only
Modifying
Select from the drop-down list.
Available
values
Debug core only
Collects the trace data regarding the currently
selected PE (default).
All core
Collects the trace data for all PEs.
Core name
[Full-spec emulator][E1][E20]
Collects the trace data for the selected core
name.
Note 1.
[Full-spec emulator][E1][E20]
The trace memory is cleared when you change the setting of this property.
Note 2.
This property is automatically set to [Yes] when selecting [Start Tracing]/[Stop Tracing] from the
context menu in the Editor panel/Disassemble panel.
Note 3.
This item is not displayed when the [Trace priority] property is set to [Data priority].
Note 4.
The trace frame is a unit of trace data. Each fetch/write/read uses one trace frame.
[Timer] [Simulator]
The detailed information on timer functions is displayed and its configuration can be changed.
Use timer function
(7)
Select whether to enable complement display when displaying the collected trace data.
By enabling complement display, instructions between branch instructions that cannot
be traced by hardware can be displayed.
This setting will be applied from the next acquisition of trace data.
Select whether to use the timer function.
Default
No
Modifying
Select from the drop-down list.
Available
values
Yes
Uses timer functions.
No
Does not use timer functions.
[Mask for Input Signal] [Full-spec emulator][E1][E20]
The detailed information on the masking input signal is displayed and its configuration can be changed.
Mask WAIT signal
R20UT3456EJ0100 Rev.1.00
Aug 01, 2015
Select whether to mask WAIT signal to prevent the signal input to emulators.
Default
[Full-spec emulator]
No
[E1][E20]
Yes
Modifying
Select from the drop-down listNote.
Available
values
Yes
Masks WAIT signal.
No
Does not mask WAIT signal.
Page 161 of 281
CS+ V3.02.00
A. WINDOW REFERENCE
Mask RESET signal
Select the RESET
signal to mask
Note
(8)
Select whether to mask RESET signal to prevent the signal input to emulators.
Default
[Full-spec emulator]
No
[E1][E20]
Yes
Modifying
Select from the drop-down listNote.
Available
values
Yes
Masks RESET signal.
No
Does not mask RESET signal.
Select a RESET signal to be masked.
This property appears only when the [Mask RESET signal] property is set to [Yes].
Default
[Full-spec emulator]
TARGET RESET signal
[E1][E20]
TARGET RESET signal and INTERNAL RESET signal
Modifying
[Full-spec emulator]
Select from the drop-down list.
[E1][E20]
Changes not allowed
Available
values
TARGET RESET signal
Masks TARGET RESET signal.
TARGET RESET signal and
INTERNAL RESET signal
Masks TARGET RESET signal and
INTERNAL RESET signal.
[Full-spec emulator]
When the [Connecting with target board] property in the [Connection with Target Board] [Full-spec
emulator][E1][E20] category on the [Connect Settings] tab is set to [No], this property is fixed to
[Yes] automatically after connecting to the debug tool (changes not allowed).
[Coverage] [Simulator]
The detailed information on coverage functions is displayed and its configuration can be changed.
Use coverage function
Reuse coverage
result
R20UT3456EJ0100 Rev.1.00
Aug 01, 2015
Select whether to use the coverage function.
Default
No
Modifying
Select from the drop-down list.
Available
values
Yes
Uses coverage functions
No
Does not use coverage functions
Select whether to load/save the coverage measurement result when connecting to or
disconnecting from the debug tool.
This property appears only when the [Use coverage function] property is set to [Yes].
Default
No
Modifying
Select from the drop-down list.
Available
values
Yes
Loads/saves the coverage measurement result.
No
Does not load/save the coverage measurement result.
Page 162 of 281
CS+ V3.02.00
A. WINDOW REFERENCE
Coverage area of
measurement(1MBytes)
(9)
Specify the area that performs coverage measurement.
Specify the start address of any 1 Mbyte space other than the internal ROM area.
This property appears only when the [Use coverage function] property is set to [Yes].
Default
100000
Modifying
Directly enter from the keyboard.
Available
values
Address without the address range of the internal ROM area (symbols
cannot be used).
[Simulator GUI] [Simulator]
The detailed information on the Simulator GUI function is displayed and its configuration can be changed.
Caution
If a microcontroller whose Simulator does not support peripheral function simulations is selected
(i.e. the selected microcontroller supports only a instruction simulator), all properties in this category become invalid.
Display Simulator
GUI
Display Simulator
GUI on top of other
windows
Select whether to display the Simulator GUI window to use the Simulator GUI function.
Default
Yes
Modifying
Select from the drop-down list.
Note that changes can be made only when program execution is halted.
Available
values
Yes
Displays the Simulator GUI window.
No
Does not displays the Simulator GUI window.
Select whether to display the Simulator GUI window in the forefront when program execution starts.
This property appears only when the [Display Simulator GUI] property is set to [Yes].
Default
Yes
Modifying
Select from the drop-down list.
Available
values
Yes
Displays it in the forefront.
No
Does not display it in the forefront.
(10) [Multi core] [Full-spec emulator][E1][E20]
The detailed information on the control method of a multi-core is displayed and its configuration can be changed.
Debug mode
Select the control method of a multi-core.
Default
Sync debug mode
Modifying
Select from the drop-down list.
Available
values
Sync debug mode
Synchronizes execution and stop of all cores
mounted in the microcontroller.
Async debug mode
Controls execution and stop of only the core
that is selected to be debugged.
(11) [Step function]
The detailed information on the control method of step execution is displayed and its configuration can be
changed.
R20UT3456EJ0100 Rev.1.00
Aug 01, 2015
Page 163 of 281
CS+ V3.02.00
Skip target section
Target section
R20UT3456EJ0100 Rev.1.00
Aug 01, 2015
A. WINDOW REFERENCE
Select whether to skip the target section.
Default
No
Modifying
Select from the drop-down list.
Available
values
Yes
Skips the target section.
No
Does not skip the target section.
Specify the target section.
This property appears only when the [Skip target section] property is set to [Yes].
Default
[Number of sections to skip]
Modifying
Specify with the Specified Section dialog box.
The Specified Section dialog box is opened by clicking the [...] button that
appears at right edge of this field when you select this property (The sections to be skipped cannot be specified from this panel.).
Page 164 of 281
CS+ V3.02.00
A. WINDOW REFERENCE
[Download File Settings] tab
This tab is used to display the detailed information categorized by the following and the configuration can be changed.
For details on the download function, see "2.5 Download/Upload Programs".
(1) [Download]
(2) [Debug Information]
Figure A.12 Property Panel: [Download File Settings] Tab
(1)
(2)
[Description of each category]
(1)
[Download]
The detailed information on download is displayed and its configuration can be changed.
Download files
CPU Reset after
download
Erase flash ROM
before download
[Full-spec emulator]
[E1][E20]
R20UT3456EJ0100 Rev.1.00
Aug 01, 2015
Specify the file to downloadNote 1.
The names of files to be downloaded and the download conditions are listed in the
lower area.
Default
[Number of files to download]
Modifying
Specify with the Download Files dialog box.
The Download Files dialog box is opened by clicking the [...] button that
appears at right edge of this field when you select this property (you cannot
specify the file to download on this panel).
Select whether to reset the CPU after downloading.
Default
Yes
Modifying
Select from the drop-down list.
Available
values
Yes
Resets the CPU after downloading.
No
Does not reset the CPU after downloading.
Select whether to erase the flash ROM before downloading.
Default
No
Modifying
Select from the drop-down list.
Available
values
Yes
Erases the flash ROM before downloading.
No
Does not erase the flash ROM before downloading.
Page 165 of 281
CS+ V3.02.00
A. WINDOW REFERENCE
Automatic change
method of event setting position
(2)
Select how to perform the setting again if the file is downloaded again, and the location
(address) set for the currently set event changes to midway in the instructionNote 2.
Default
Suspend event
Modifying
Select from the drop-down list.
Available
values
Move to the head
of instruction
Sets the event to the top address of the instruction.
Suspend event
Disables the event (suspended state).
Note 1.
Files specified as build targets in a main project or sub-project cannot be deleted from the target
files to download (These files are automatically registered as download files by default).
See "Table 2.1 Downloadable File Formats" for downloadable file format.
Note 2.
This property setting works only for the location setting of events without the debug information.
The location setting of events with the debug information is always moved to the beginning of the
source text line.
[Debug Information]
The detailed information on debugging is displayed and its configuration can be changed.
Execute to the specified symbol after
CPU Reset
Specified symbol
The upper limit size
of the memory usage
[Mbytes]
Note
Select whether to execute the program to the specified symbol position after CPU reset.
Default
Yes
Modifying
Select from the drop-down list.
Available
values
Yes
Executes the program to the specified symbol position after CPU
reset.
No
Does not execute the program after CPU reset.
Specify the position at which the program is stop after CPU reset.
This property appears only when the [Execute to the specified symbol after CPU Reset]
property is set to [Yes].
Default
_main
Modifying
Directly enter from the keyboard.
Available
values
Address expression between 0 and the "end address of the address space"
Specify the memory size to be used for reading the debug informationNote.
Default
500
Modifying
Directly enter from the keyboard.
Available
values
Decimal number between 100 and 1000
In some cases, lowering the upper limit may lead to poorer responsiveness since it leads to more
frequent discarding and re-reading of debug information.
R20UT3456EJ0100 Rev.1.00
Aug 01, 2015
Page 166 of 281
CS+ V3.02.00
A. WINDOW REFERENCE
[Flash Options Settings] tab
This tab is used to configure options for the flash memory incorporated in the microcontroller.
Note that this tab appears only when the selected microcontroller supports the flash options.
Caution 1.
[Full-spec emulator][E1][E20]
You can configure options only while connected to the debug tool.
[Simulator]
You can configure options only while disconnected from the debug tool.
Caution 2.
CPU reset may be generated automatically depending on the selected microcontroller when you change
the configuration on this tab.
(1) [Flash Options]
Figure A.13 Property Panel: [Flash Options Settings] Tab
(1)
[Description of each category]
(1)
[Flash Options]
The detailed information on the flash options is displayed and its configuration can be changed.
Flash options
R20UT3456EJ0100 Rev.1.00
Aug 01, 2015
Specify options for the flash memory.
Default
Flash options
Modifying
Specify with the Flash Options Setting dialog box.
The Flash Options Setting dialog box is opened by clicking the [...] button
that appears at right edge of this field when you select this property (you
cannot specify options for the flash memory on this panel).
Note that the contents of options for the flash memory that have been
specified are not displayed on this panel.
Page 167 of 281
CS+ V3.02.00
A. WINDOW REFERENCE
[Hook Transaction Settings] tab
This tab is used to display the detailed information categorized by the following and the configuration can be changed.
For details on the hook transaction, see "2.17 Use Hook Function".
(1) [Hook Transaction Settings]
Figure A.14 Property Panel: [Hook Transaction Settings] Tab
(1)
[Description of each category]
(1)
[Hook Transaction Settings]
The detailed information on the hook transaction is displayed and its configuration can be changed.
Before download
After download
R20UT3456EJ0100 Rev.1.00
Aug 01, 2015
Specify the processNote to proceed right before downloading the load module file.
Default
Before download[0] ("[]" is the current number of specified processes.)
Modifying
Specify with the Text Edit dialog box.
The Text Edit dialog box is opened by clicking the [...] button that appears
at right edge of this field when you select this property (you cannot specify
options for the flash memory on this panel).
Available
values
Up to 128 processes (one line in the Text Edit dialog box is equivalent to
one processing)
Note that up to 64 characters for one process can be specified.
Specify the processNote to proceed right after downloading the load module file.
Default
Before download[0] ("[]" is the current number of specified processes.)
Modifying
Specify with the Text Edit dialog box.
The Text Edit dialog box is opened by clicking the [...] button that appears
at right edge of this field when you select this property (you cannot specify
options for the flash memory on this panel).
Available
values
Up to 128 processes (one line in the Text Edit dialog box is equivalent to
one processing)
Note that up to 64 characters for one process can be specified.
Page 168 of 281
CS+ V3.02.00
A. WINDOW REFERENCE
After CPU reset
under breaking
Before running
After breaking
Note
Specify the processNote to proceed right after CPU reset during break.
Default
Before download[0] ("[]" is the current number of specified processes.)
Modifying
Specify with the Text Edit dialog box.
The Text Edit dialog box is opened by clicking the [...] button that appears
at right edge of this field when you select this property (you cannot specify
options for the flash memory on this panel).
Available
values
Up to 128 processes (one line in the Text Edit dialog box is equivalent to
one processing)
Note that up to 64 characters for one process can be specified.
Specify the processNote to proceed right before the execution of the program.
Default
Before download[0] ("[]" is the current number of specified processes.)
Modifying
Specify with the Text Edit dialog box.
The Text Edit dialog box is opened by clicking the [...] button that appears
at right edge of this field when you select this property (you cannot specify
options for the flash memory on this panel).
Available
values
Up to 128 processes (one line in the Text Edit dialog box is equivalent to
one processing)
Note that up to 64 characters for one process can be specified.
Specify the processNote to proceed right after the program break.
Default
Before download[0] ("[]" is the current number of specified processes.)
Modifying
Specify with the Text Edit dialog box.
The Text Edit dialog box is opened by clicking the [...] button that appears
at right edge of this field when you select this property (you cannot specify
options for the flash memory on this panel).
Available
values
Up to 128 processes (one line in the Text Edit dialog box is equivalent to
one processing)
Note that up to 64 characters for one process can be specified.
From the following three processes, input the specification format of the desired process to the Text
Edit dialog box.
[Process 1]:
Automatically overwrites the value of I/O register with Value.
Specification format:
I/O-register-name Value
[Process 2]:
Automatically overwrites the value of CPU register with Value.
Specification format:
CPU-register-name Value
[Process 3]:
Automatically executes a script file which is specified with Python script path (absolute path or relative path
from the project folder).
Specification format:
Source Python-script-path
R20UT3456EJ0100 Rev.1.00
Aug 01, 2015
Page 169 of 281
CS+ V3.02.00
A. WINDOW REFERENCE
Memory panel
This panel is used to display the contents of the memory and change the memory value (see "2.10.1 Display/change
the memory").
Furthermore, the contents of data flash memory (including ID tag) can be displayed and changed when the selected
microcontroller incorporates the data flash memory.
Up to a maximum of four of these panels can be opened. Each panel is identified by the names "Memory1", "Memory2",
"Memory3", and "Memory4" on the titlebar.
The display contents are automatically updated when the value of the memory changes after a program is executed
(when the execution is done in steps, the display is updated after each step). In addition, by enabling the Real-time display update function, it is also possible to update the display contents in real-time even while a program is being executed.
This panel appears only when connected to the debug tool.
Caution
CPU reset may be generated depending on the selected microcontroller if you change the memory value
in the data flash area.
Remark 1.
This panel can be zoomed in and out by
in the tool bar, or by moving the mouse
wheel forward or backward while holding down the [Ctrl] key.
Remark 2.
You can set the scroll range of the vertical scroll bar on this panel via the Scroll Range Settings dialog
box which is opened by clicking the
button from [View] on the toolbar.
Figure A.15 Memory Panel
(1)
(2)
(3)
(4)
[Toolbar]
This section describes the following.
- [How to open]
- [Description of each area]
- [Toolbar]
- [[File] menu (Memory panel-dedicated items)]
- [[Edit] menu (Memory panel-dedicated items)]
- [Context menu]
[How to open]
- From the [View] menu, select [Memory] >> [Memory1-4].
R20UT3456EJ0100 Rev.1.00
Aug 01, 2015
Page 170 of 281
CS+ V3.02.00
A. WINDOW REFERENCE
[Description of each area]
(1)
(a)
(b)
Display position specification area
It is possible to specify the display start position of the memory contents by specifying an address expression.
Specify the following items.
Specify an address expression
Directly input the address expression of the memory value address to display in the text box. You can specify an
input expression with up to 1024 characters. The result of the expression is treated as the display start position
address.
Note that an address value greater than the microcontroller address space cannot be specified.
In addition, an address value greater than the value expressed within 32 bits cannot be specified.
Remark 1.
A symbol name at the current caret position can be complemented by pressing the [Ctrl] +
[Space] key in this text box (see "2.18.2 Symbol name completion function").
Remark 2.
If the specified address expression is the symbol and its size can be recognized, everything from
the start address to the end address of that symbol is displayed selected.
Specify automatic/manual evaluation of the address expression
The timing to change the display start position can be determined by specifying in the [Move when Stop] check
box and the [Move] button.
[Move when Stop]
The caret is moved to the address which is automatically calculated from the
address expression after the program is stopped.
The address expression is not automatically evaluated after the program is
stopped.
Click the [Move] button to manually evaluate the address expression.
[Move] button
(2)
Address area
The address of the memory is displayed (hexadecimal number notation fixing).
The display starts from address 0x0 by default. However, an offset value of the start address can be set via the
Address Offset Settings dialog box that is opened by selecting [Address Offset Value Settings...] from the context
menu.
The address width corresponds to the one in memory space of the specified microcontroller in the project.
This area cannot be edited.
Caution
(3)
When the [Move when Stop] check box is not checked, click this button to evaluate the address expression and move the caret to the result address of the evaluation.
The offset value that have been set is automatically changed in accordance with the number of
view columns in the Memory value area.
Memory value area
The value of the memory is displayed and changed.
Specification of the display notation, display width of memory values or the number of view columns is performed
by selecting the buttons on the toolbar or [Notation]/[Size Notation]/[View] from the context menu (see "2.10.1.2
Change display format of values").
The meanings of the marks and colors displayed as memory values are as follows (character colors and background colors depend on the configuration in the [General - Font and Color] category of the Option dialog box):
Display Example (Default)
(Under
line)
Character color
Blue
Background color
Standard color
Character color
Standard color
Background color
Standard color
Character color
Brown
Background color
Cream
R20UT3456EJ0100 Rev.1.00
Aug 01, 2015
Description
Memory value that the user is changing
Press the [Enter] key to write to the target memory.
Memory value of the address whose symbol has been
defined.
Watch-expressions can be registered to this memory (see
"(f) Registering watch-expressions").
Memory value that has been changed because of the execution of a programNote
To reset the highlighting, select the
button on the toolbar.
Page 171 of 281
CS+ V3.02.00
A. WINDOW REFERENCE
Display Example (Default)
**
Character color
Pink
Background color
Standard color
Character color
Standard color
Background color
Palegreen
Character color
Standard color
Background color
Orange
Character color
Standard color
Background color
Paleturquoise
Character color
Gray
Background color
Standard color
Character color
Gray
Background color
Standard color
Character color
Gray
Background color
Standard color
Character color
Standard color
Background color
Standard color
Description
Memory value for which the Real-time display update function is being operated
Read/Fetch
Current access condition of the memory
value when the Real-time display update
function is being operated
Write
Read and
Write
Memory value of the read-protected area
Areas not memory-mapped
Areas not rewritable (e.g. I/O register area/I/O protection
area) or when acquisition of memory values failed
When display is specified for other than the real-time display
update area during program execution or when acquisition
of memory values failed
Note
Just before execution of a program, only the memory value in the address range for which the
Memory panel had been displayed becomes the target.
In addition, the value is not highlighted if it is same for before and after the execution of the program.
Caution
The number of view columns is automatically changed in accordance with the set value of [Size
Notation] of the context menu.
This area is provided with the following functions.
(a)
Pop-up display
The following contents are pop-up displayed based on the nearest existing symbol forward from the address the
mouse is designating when hovering the mouse cursor over the memory value.
Note that if there is no symbol information (the underlining is non-display), no pop-up display is done.
variable
+
0x14
Symbol name
Offset value
Symbol name
Indicates the name of the symbol.
Offset value
When a symbol has not been defined for the addresses, the offset value from the nearest
symbol exists forward is displayed (hexadecimal number notation fixing).
(b)
Real-time display update function
Using the real-time display update function allows you to display/modify the value of the memory contents not
only while the program is stopped, but also in execution.
See "2.10.1.4 Display/modify the memory contents during program execution" for details on the real-time display update function.
(c)
Changing memory values
Directly edit from the keyboard after moving the caret to the memory value to be edited.
The color of the memory value changes when it is in editing. Press the [Enter] key to write the edited value to
the target memory (if the [Esc] key is pressed before the [Enter] key is pressed, the editing is cancelled).
See "2.10.1.3 Modify the memory contents" for details on the method for changing the memory value.
R20UT3456EJ0100 Rev.1.00
Aug 01, 2015
Page 172 of 281
CS+ V3.02.00
A. WINDOW REFERENCE
(d)
Searching/initializing memory value
The Memory Search dialog box is opened to search the memory contents in the specified address range by
selecting [Find...] from the context menu (see "2.10.1.5 Search the memory contents").
In addition, the Memory Initialize dialog box is opened to change the memory contents collectively in the specified address range by selecting [Fill...] from the context menu (see "2.10.1.6 Modify the memory contents in
batch (initialize)").
(e)
Copying and pasting
By selecting a range of memory values with the mouse, the contents of the range can be copied to the clipboard
as a character string, and these contents can be pasted to the caret position.
These operations are performed by selecting from the context menu or selecting from the [Edit] menu.
However, the paste operation is possible only when the character string to be pasted and the display notation
(radix and size) of the area match.
If the display notation does not match, a message is displayed.
The following table shows the character code and character strings that can be used in this area (a message will
appear when a character string other than those listed here is pasted).
(f)
Character code
ASCII
Character string
0, 1, 2, 3, 4, 5, 6, 7, 8, 9, a, b, c, d, e, f, A, B, C, D, E, F
Registering watch-expressions
A memory value with underline indicates that a symbol has been defined in the address, and its symbol can be
registered as a watch-expression.
After selecting the memory value or placing the caret on the memory value, the symbol name of the address is
registered in the Watch panel (Watch1) as a watch-expression by selecting [Register to Watch1] from the
context menu.
Caution
(g)
(4)
A memory value without underline cannot be registered as a watch-expression.
Saving the contents of memory values
The Data Save dialog box can be opened by selecting the [File] menu >> [Save Memory Data As...], and the
contents of this panel can be saved in a text file (*.txt) or CSV file (*.csv).
See "2.10.1.7 Save the memory contents" for details on the method for saving the contents of memory values.
Character strings area
Memory values converted into character code are displayed.
The character code can be specified by selecting [Encoding] from the toolbar or context menu (ASCII code is
selected by default). Furthermore, in this area, memory values converted into a floating-point value can be displayed as character strings. To do this, select the following item from [Encoding] of the context menu.
Item
Float
Double
Float Complex
Display Format
Single-precision floating-point value
Numeric value
<sign><mantissa>e<sign><exponent>
Infinite number
Inf, and -Inf
Not a number
NaN
Example
+ 1.234567e+123
Double-precision floating-point value
Numeric value
<sign><mantissa>e<sign><exponent>
Infinite number
Inf, and -Inf
Not a number
NaN
Example
+ 1.2345678901234e+123
Complex number of single-precision floating-point
Size
32-bit
64-bit
64-bit
<Single-precision floating-point value> <Single-precision floating-point
value> * I
R20UT3456EJ0100 Rev.1.00
Aug 01, 2015
Page 173 of 281
CS+ V3.02.00
A. WINDOW REFERENCE
Item
Display Format
Double Complex
Complex number of double-precision floating-point
Size
128-bit
<Double-precision floating-point value> <Double-precision floating-point
value> * I
Float Imaginary
Imaginary number of single-precision floating-point
32-bit
<Single-precision floating-point value> * I
Double Imaginary
Imaginary number of double-precision floating-point
64-bit
<Double-precision floating-point value> * I
Caution
Nothing is displayed when the minimum size of a character code or a floating-point value is greater
than "the number of bytes of display width of memory values" x "the number of bytes of the number
of view columns".
This area is provided with the following functions.
(a)
Changing character strings
Directly edit from the keyboard after moving the caret to the character string to be edited.
The color of the character string changes when it is in editing. Press the [Enter] key to write the edited value to
the target memory (if the [Esc] key is pressed before the [Enter] key is pressed, the editing is cancelled).
Caution
Character strings displayed as floating-point values cannot be searched.
(b)
Searching character strings
The Memory Search dialog box is opened to search for character strings by selecting [Find...] from the context
menu (see "2.10.1.5 Search the memory contents").
(c)
Copying and pasting
By selecting a range of character strings with the mouse, the contents of the range can be copied to the clipboard as a character string, and these contents can be pasted to the caret position.
These operations are performed by the selecting from the context menu or selecting from the [Edit] menu.
However, the paste operation is possible only when [ASCII] has been selected as the character code. If other
than [ASCII] is selected, a message is displayed.
[Toolbar]
Acquires the latest data from the debug tool, and updates the contents of this
panel.
Resets highlighting of values that have been changed by executing a program.
This item is disabled during execution of a program.
Notation
The following buttons to change the notation of memory values are displayed.
Hexadecimal
Displays memory values in hexadecimal number (default).
Signed Decimal
Displays memory values in signed decimal number.
Unsigned Decimal
Displays memory values in unsigned decimal number.
Octal
Displays memory values in octal number.
Binary
Displays memory values in binary number.
R20UT3456EJ0100 Rev.1.00
Aug 01, 2015
Page 174 of 281
CS+ V3.02.00
A. WINDOW REFERENCE
Size Notation
The following buttons to change the notation of sizes of memory values are displayed.
4 Bits
Displays memory values in 4-bit width.
1 Byte
Displays memory values in 8-bit width (default).
2 Bytes
Displays memory values in 16-bit width.
Values are converted depending on the endian of the target memory area.
4 Bytes
Displays memory values in 32-bit width.
Values are converted depending on the endian of the target memory area.
8 Bytes
Displays memory values in 64-bit width.
Values are converted depending on the endian of the target memory area.
Encoding
The following buttons to change the encoding of character strings are displayed.
ASCII
Displays character strings in ASCII code (default).
Shift_JIS
Displays character strings in Shift-JIS code.
EUC-JP
Displays character strings in EUC-JP code.
UTF-8
Displays character strings in UTF-8 code.
UTF-16
Displays character strings in UTF-16 code.
Float
Displays character strings as a single-precision floating-point value.
Double
Displays character strings as a double-precision floating-point value.
Float Complex
Displays character strings as a complex number of single-precision floating-point.
Double Complex
Displays character strings as a complex number of double-precision floating-point.
Float Imaginary
Displays character strings as an imaginary number of single-precision floatingpoint.
Double Imaginary
Displays character strings as an imaginary number of double-precision floatingpoint.
View
The following buttons to change the display format are displayed.
Settings Scroll Range...
Opens the Scroll Range Settings dialog box to set the scroll range for this panel.
Column Number Settings...
Opens the Column Number Settings dialog box to set the number of view columns
in the Memory value area.
Address Offset Value Settings...
Opens the Address Offset Settings dialog box to set an offset value for addresses
displayed in the Address area.
[[File] menu (Memory panel-dedicated items)]
The following items are exclusive for the [File] menu in the Memory panel (other items are common to all the panels).
Note that all these items are disabled during execution of a program.
Save Memory Data
Overwrites the contents of this panel to the previously saved text file (*.txt)/CSV file
(*.csv) (see "(g) Saving the contents of memory values").
Note that when the file has never been saved or the file is write disabled, the same operation is applied as the selection in [Save Memory Data As...].
Save Memory Data As...
Opens the Data Save dialog box to newly save the contents of this panel to the specified
text file (*.txt)/CSV file (*.csv) (see "(g) Saving the contents of memory values").
R20UT3456EJ0100 Rev.1.00
Aug 01, 2015
Page 175 of 281
CS+ V3.02.00
A. WINDOW REFERENCE
[[Edit] menu (Memory panel-dedicated items)]
The following items are exclusive for [Edit] menu in the Memory panel (all other items are disabled).
Note that all these items are disabled during execution of a program.
Copy
Copies the contents of the selected range to the clipboard as character string(s).
Paste
Pastes the character string(s) copied in the clipboard to the caret position.
To the memory value area: See "(e) Copying and pasting".
To the character strings area: See "(c) Copying and pasting".
Find...
Opens the Memory Search dialog box.
The search is operated either in the Memory value area or the Character strings area, in
which a caret is.
[Context menu]
Register to Watch1
Registers the symbol at the caret to the Watch panel (Watch1).
At this time, since it is registered as a variable name, the symbol name that is displayed changes depending on the scope.
Note that this item is disabled when no symbol has been defined in the address corresponding to the memory value at the caret position (see "(f) Registering watchexpressions").
Find...
Opens the Memory Search dialog box.
The search is operated either in the Memory value area or the Character strings area
(unless the floating-point value display is selected), in which a caret is.
This item is disabled during execution of a program.
Fill...
Opens the Memory Initialize dialog box.
Refresh
Acquires the latest data from the debug tool, and updates the contents of this panel.
Copy
Copies the contents of the selected range to the clipboard as character string(s).
This item is disabled during execution of a program.
Paste
Pasts the character string(s) copied in the clipboard to the caret position.
This item is disabled during execution of a program.
To the memory value area: See "(e) Copying and pasting".
To the character strings area: See "(c) Copying and pasting".
Notation
The following cascade menus are displayed to specify the notation of memory values.
Hexadecimal
Displays memory values in hexadecimal number (default).
Signed Decimal
Displays memory values in signed decimal number.
Unsigned Decimal
Displays memory values in unsigned decimal number.
Octal
Displays memory values in octal number.
Binary
Displays memory values in binary number.
R20UT3456EJ0100 Rev.1.00
Aug 01, 2015
Page 176 of 281
CS+ V3.02.00
Size Notation
A. WINDOW REFERENCE
The following cascade menus are displayed to specify the notation of sizes of memory values.
4 Bits
Displays memory values in 4-bit width.
1 Byte
Displays memory values in 8-bit width (default).
2 Bytes
Displays memory values in 16-bit width.
Values are converted depending on the endian of the target memory area.
4 Bytes
Displays memory values in 32-bit width.
Values are converted depending on the endian of the target memory area.
8 Bytes
Displays memory values in 64-bit width.
Values are converted depending on the endian of the target memory area.
Encoding
The following cascade menus are displayed to specify the display format in the character strings area.
ASCII
Displays character strings in ASCII code (default).
Shift_JIS
Displays character strings in Shift-JIS code.
EUC-JP
Displays character strings in EUC-JP code.
UTF-8
Displays character strings in UTF-8 code.
UTF-16
Displays character strings in UTF-16 code.
Float
Displays character strings as a single-precision floating-point value.
Double
Displays character strings as a double-precision floating-point value.
Float Complex
Displays character strings as a complex number of single-precision floating-point.
Double Complex
Displays character strings as a complex number of double-precision floating-point.
Float Imaginary
Displays character strings as an imaginary number of single-precision floating-point.
Double Imaginary
Displays character strings as an imaginary number of double-precision floating-point.
View
The following cascade menus are displayed to specify the display format.
Settings Scroll Range...
Opens the Scroll Range Settings dialog box to set the scroll range for this panel.
Column Number Settings...
Opens the Column Number Settings dialog box to set the number of view columns in
the Memory value area.
Address Offset Value
Settings...
Opens the Address Offset Settings dialog box to set an offset value for addresses
displayed in the Address area.
Highlight Accessed
Highlights memory values that have changed by execution of a program if this item is
checked (default).
This item is disabled during execution of a program.
Periodic Updating
The following cascade menus are displayed to set for the real-time display update
function (see "(b) Real-time display update function").
Periodic Updating Options
R20UT3456EJ0100 Rev.1.00
Aug 01, 2015
Opens the Property panel to set for the real-time display update function.
Page 177 of 281
CS+ V3.02.00
A. WINDOW REFERENCE
Disassemble panel
This panel is used to display the results of disassembling the contents of the memory (disassembled text), and execute
line assembly (see "2.6.4 Perform line assembly").
Furthermore, the instruction level debugging (see "2.8.3 Execute programs in steps") and the code coverage measurement result display [Simulator] (see "2.14 Measure Coverage [Simulator]") can be performed in this panel.
Up to a maximum of four of these panels can be opened. Each panel is identified by the names "Disassemble1",
"Disassemble2", "Disassemble3" and "Disassemble4" on the titlebar.
The source text in the source file corresponding to the code data can also be displayed by setting to the Mixed display
mode (default).
This panel appears only when connected to the debug tool.
Caution
A step execution is performed in instruction level units when the focus is in this panel (see "2.8.3 Execute programs in steps").
Remark 1.
You can set the scroll range of the vertical scroll bar on this panel via the Scroll Range Settings dialog
box which is opened by clicking the
button from [View] on the toolbar.
Remark 2.
You can print the current screen image of this panel by selecting [Print...] from the [File] menu.
Remark 3.
This panel can be zoomed in and out by
in the tool bar, or by moving the mouse
wheel forward or backward while holding down the [Ctrl] key.
Figure A.16 Disassemble Panel (When Mixed Display Mode Is Selected)
[Tool
bar]
(1)
(2)
R20UT3456EJ0100 Rev.1.00
Aug 01, 2015
(3)
Page 178 of 281
CS+ V3.02.00
A. WINDOW REFERENCE
Figure A.17 Disassemble Panel (When Disassemble Display Mode Is Selected)
[Tool
bar]
(1)
(2)
(3)
Figure A.18 Disassemble Panel (When Code Coverage Measurement Result Is Displayed) [Simulator]
[Tool
bar]
(1)
(2)
(3)
This section describes the following.
- [How to open]
- [Description of each area]
- [Toolbar]
- [[File] menu (Disassemble panel-dedicated items)]
- [[Edit] menu (Disassemble panel-dedicated items)]
- [Context menu]
R20UT3456EJ0100 Rev.1.00
Aug 01, 2015
Page 179 of 281
CS+ V3.02.00
A. WINDOW REFERENCE
[How to open]
- From the [View] menu, select [Disassemble] >> [Disassemble1 - 4].
[Description of each area]
(1)
Event area
The lines for which events can be set are shown with the background color in white (this mean that events cannot
be set for those lines whose background color in gray).
In addition, the Event mark corresponding to an event that has been currently set is displayed.
This area is provided with the following functions.
(a)
Setting/deleting breakpoints
By clicking where you want to set a breakpoint with the mouse, the breakpoint can be set easily.
The breakpoint is set to the instruction at the start address of the clicked line.
Once the breakpoint is set, the Event mark is displayed at the line that is set. In addition, the detailed information about the set breakpoint is reflected in the Events panel.
When this operation is performed at a place where any one of the event marks is already being displayed, that
event is deleted and the setting of breakpoints cannot be done.
Note that the setting of events can be done only for those lines where the background color is shown in white.
See "2.9.3 Stop the program at the arbitrary position (breakpoint)" for details on how to set the breakpoint.
(b)
Changes event status
Event status can be changed from the following menu displayed by right-clicking the event mark.
(c)
(2)
Enable Event
Changes the selected event state to a Valid state.
Event occurs when the specified condition is met.
When the event mark (
) which indicates that multiple events have been set is
selected, all of the events that have been set are enabled.
Disable Event
Changes the selected event state to an Invalid state.
Event does not occur when the specified condition is met.
When the event mark (
) which indicates that multiple events have been set is
selected, all of the events that have been set are disabled.
Delete Event
Deletes the selected event.
When the event mark (
) which indicates that multiple events have been set is
selected, all of the events that have been set are deleted.
View Event Detailed
Setup
Opens the Events panel to display the detailed information of the selected event.
Pop-up display
By hovering the mouse cursor over the Event mark, the name of the event, the detailed information for the event
and the comments added to the event are pop-up displayed.
When multiple events have been set in the applicable place, information for each event, up to a maximum of
three events, is listed and displayed.
Address area
The address per line to start disassembling is displayed (hexadecimal number notation fixing).
In addition, the current PC mark ( ) that corresponds to the current PC position (PC register value) is displayed.
The address width corresponds to the one in memory space of the specified microcontroller in the project.
For the source text line in the Mixed display mode, line numbers (xxx:) in the source file correspond to the start
address are displayed.
Remark
The current PC mark changes from
to
when the position of the current PC is invalid (e.g., in
cases where the current target core for debugging differs from the one selected at the time the program was stopped).
This area is provided with the following functions.
(a)
Pop-up display
By hovering the mouse cursor over a address or line number, the following information is pop-up displayed.
R20UT3456EJ0100 Rev.1.00
Aug 01, 2015
Page 180 of 281
CS+ V3.02.00
A. WINDOW REFERENCE
Address
Format:<Label name> + <Offset value>
Example1: main + 0x10
Example2: sub function + 0x20
Source line number
Format:<Load module name>Note$<File name> # <Line number>
Example1: test1.out$main.c#40
Example2: main.c#100
Note
(3)
<Load module name> is displayed only when multiple load modules have been downloaded to
the debug tool.
Disassemble area
The results of disassembling are displayed next to the corresponding source text as follows:
Figure A.19 Display Contents of Disassemble Area (In Case of Mixed Display Mode)
Label line
PC line
Breakpoint line
Source text line
Disassemble results
Offset value
Code
Instruction
Label line
The label is displayed when a label is defined for the address, and its corresponding line is shown highlighted in lightgreen.
PC line
A line corresponding to an address of the current PC (PC register value) is
shown highlightedNote 1.
Breakpoint line
A line at which a breakpoint is set is shown highlightedNote 1.
Source text line
The source text corresponding to the code data is displayedNote 2.
Disassemble
results
Offset value
The offset value from the nearest label is displayed when a label is defined for
the addressNote 3.
Code
The code that is the target of disassembly is displayed in hexadecimal number.
Instruction
Instruction is displayed as the result of disassembling.
The mnemonics are shown highlighted in blue.
Note 1.
The highlighting color depends on the configuration in the [General - Font and Color] category of
the Option dialog box.
Note 2.
The source text can be set to non-display by clicking the
button (toggle) on the toolbar or
removing the check for [Mixed Display] from the context menu (this option is checked by default).
Note 3.
Offset values are not displayed by default. They can be displayed by clicking the
toolbar or selecting [Show Offset] from the context menu.
button on the
This area is provided with the following functions.
(a)
Line assembly
Instructions and code displayed in this panel can be edited (line assembly).
See "2.6.4 Perform line assembly" for details on how to operate it.
(b)
Program execution by instruction level
Execution can be controlled at the instruction level unit by step executing a program in a state where there is a
focus on this panel.
R20UT3456EJ0100 Rev.1.00
Aug 01, 2015
Page 181 of 281
CS+ V3.02.00
A. WINDOW REFERENCE
See "2.8.3 Execute programs in steps" for details on how to operate it.
(c)
Setting of various events
Various events can be set to the addresses/lines where the caret currently exists by selecting [Bread Settings],
[Trace Settings] or [Timer Settings] from the context menu.
The corresponding Event mark is displayed in the Event area when an event is set. In addition, the detailed
information about the set event is reflected in the Events panel.
+Note, however, that the setting of events can be done only for those lines where the background color is shown
in white in the event area.
See the following for details on how to set events.
- "2.9.4 Stop the program at the arbitrary position (break event)"
- "2.9.5 Stop the program with the access to variables/I/O registers"
- "2.12.3 Collect execution history in the arbitrary section"
- "2.12.4 Collect execution history only when the condition is met"
- "2.13.2 Measure execution time in the arbitrary section"
- "2.15.1 Inset printf"
Remark
A breakpoint can be set or deleted easily in the Event area as well (see "(a) Setting/deleting
breakpoints").
(d)
Registering a watch-expression
Variable names of C language, CPU registers, I/O registers, and assembler symbols can be registered in the
Watch panel as watch-expressions.
See "2.10.6.1 Register a watch-expression" for details on how to operate it.
(e)
Moving to symbol definition place
By clicking the
button on the toolbar or selecting [Go to Symbol] from the context menu in a state where the
caret has been moved to a instruction that has referenced a symbol, the caret position is moved to the address
where the symbol at the caret position has been defined.
In addition, when following on this operation you click on the
button on the toolbar or select [Back to
Address] from the context menu, the caret position is returned to the instruction that has referenced a symbol
before the caret was moved (the address value of the instruction that has referenced a symbol is displayed in
Address).
(f)
Jump to source line and memory
Selecting [Jump to Source] from the context menu will open the Editor panel with the caret moved to the source
line corresponding to the address at the current caret position (if the Editor panel is already open, the screen will
jump to the panel).
In addition, similarly, selecting [Jump to Memory] will open the Memory panel (Memory1) with the caret moved
to the memory value corresponding to the address at the current caret position (if the Memory panel (Memory1)
is already open, the screen will jump to the panel).
(g)
Code coverage measurement result display [Simulator]
When the coverage function is valid, lines corresponding to the specified coverage measurement area are
shown highlighted based on the code coverage measurement result that is acquired by executing the program.
See "2.14 Measure Coverage [Simulator]" for details on the coverage measurement.
(h)
Saving the contents of disassembled data
The Data Save dialog box can be opened by selecting the [File] menu >> [Save Disassemble Data As…], and
the contents of this panel can be saved in a text file (*.txt) or CSV file (*.csv).
See "2.6.2.5 Save the disassembled text contents" for details on the method for saving the contents of disassembled data.
[Toolbar]
Acquires the latest data from the debug tool, and updates the contents of this panel.
Toggles between the mixed display mode (default) and disassemble display mode, as
the display mode of this panel (see "2.6.2.1 Change display mode").
Specifies the caret position so that it follows the current PC value.
R20UT3456EJ0100 Rev.1.00
Aug 01, 2015
Page 182 of 281
CS+ V3.02.00
A. WINDOW REFERENCE
Moves the caret to the define position of the selected symbol.
Moves the caret to the position (address) immediately before it is moved with the
button.
View
The following buttons to set the display contents in the disassemble area are displayed.
Show Offset
Displays the offset value of the label. The offset value from the nearest label is displayed when a label is defined for the address.
Show Symbol
Displays the address value in the format "symbol + offset value" (default).
Note that when a symbol has been defined as the address value, only the symbol is
displayed.
Show Function Name
Displays the name of the register by its function name (default).
Show Absolute Name
Displays the name of the register by its absolute name.
Opens the Scroll Range Settings dialog box to set the scroll range for this panel.
[[File] menu (Disassemble panel-dedicated items)]
The following items are exclusive for the [File] menu in the Disassemble panel (other items are common to all the panels).
Note that all these items are disabled during execution of a program.
Save Disassemble Data
Overwrites the contents of the disassembling to the previously saved text file (*.txt)/CSV
file (*.csv) (see "(h) Saving the contents of disassembled data").
Note that when the file has never been saved or the file is write disabled, the same
operation is applied as the selection in [Save Disassemble Data As…].
Save Disassemble Data
As…
Opens the Data Save dialog box to newly save the contents of the disassembling to the
specified text file (*.txt)/CSV file (*.csv) (see "(h) Saving the contents of disassembled
data").
Print...
Opens the Print Address Range Settings dialog box for printing the contents of this
panel.
[[Edit] menu (Disassemble panel-dedicated items)]
The following items are exclusive for the [Edit] menu in the Disassemble panel (all other items are disabled).
Copy
When a line is selected, copies the contents of the selected line to the clipboard as a
character string.
In the case of the edit mode, copies the selected character string to the clipboard.
Rename
Changes to the edit mode to edit the instruction/code at the caret position (see "2.6.4
Perform line assembly").
This item is disabled during execution of a program.
Find…
Opens the Find and Replace dialog box with selecting the [Find in Files] tab.
Replace…
Opens the Find and Replace dialog box with selecting the [Replace in Files] tab.
Move…
Opens the Go to the Location dialog box to move the caret to the specified address.
[Context menu]
(1) Disassemble area and Address area
(2) Event area [Full-spec emulator][E1][E20]
R20UT3456EJ0100 Rev.1.00
Aug 01, 2015
Page 183 of 281
CS+ V3.02.00
(1)
A. WINDOW REFERENCE
Disassemble area and Address area
Register to Watch1
Registers the selected character string or the word at the caret position to the Watch
panel (Watch1) as a watch-expression (the judgment of the word depends on current build
tool).
At this time, since it is registered as a variable name, the symbol name that is displayed changes depending on the scope.
Register Action
Event...
Opens the Action Events dialog box to set an action event to the address at the caret
position.
Go to Here
Executes the program from the address indicated by the current PC value to the
address corresponding to the line at the caret position.
This item is disabled during program execution/build (not including rapid build) execution.
Set PC to Here
Sets the address of the line at the current caret position to the current PC value.
This item is disabled during program execution/build (not including rapid build) execution.
Move…
Opens the Go to the Location dialog box to move the caret to the specified address.
Go to Symbol
Moves the caret to the define position of the selected symbol.
Back to Address
Moves the caret to the position (address) immediately before it is moved by [Go to
Symbol].
Note that this item is disabled when no symbol name is displayed in the address.
Break Settings
The following cascade menus are displayed to set the break-related event.
Set Hardware Break
Sets a breakpoint (Hardware Break event to the address at the caret position (see
"2.9.3 Stop the program at the arbitrary position (breakpoint)").
Set Software Break
[Full-spec emulator]
[E1][E20]
Sets a breakpoint (Software Break event) to the address at the caret position (see
"2.9.3 Stop the program at the arbitrary position (breakpoint)").
Set Combination
Break
In this product version, this item is not supported.
Set Read Break to
Sets a break event with read access condition to a variable at the caret or a selected
variable (global variable/static variable inside functions/file-internal static variable)/I/O
register (see "2.9.4 Stop the program at the arbitrary position (break event)").
Set Write Break to
Sets a break event with write access condition to a variable at the caret or a selected
variable (global variable/static variable inside functions/file-internal static variable)/I/O
register (see "2.9.4 Stop the program at the arbitrary position (break event)").
Set R/W Break to
Sets a break event with read/write access condition to a variable at the caret or a
selected variable (global variable/static variable inside functions/file-internal static variable)/I/O register (see "2.9.4 Stop the program at the arbitrary position (break
event)").
Break Option
Opens the Property panel to set the break function.
R20UT3456EJ0100 Rev.1.00
Aug 01, 2015
Page 184 of 281
CS+ V3.02.00
Trace Settings
A. WINDOW REFERENCE
The following cascade menus are displayed to set the trace-related event.
Start Tracing
Sets a trace start event to start collecting the trace data when an instruction of an
address at the caret position is executed (see "2.12.3 Collect execution history in the
arbitrary section")Note 1.
Stop Tracing
Sets a trace end event to stop collecting the trace data when an instruction of an
address at the caret position is executed (see "2.12.3 Collect execution history in the
arbitrary section")Note 1.
Record Reading
Value
Sets a Point Trace event to record the access value as the trace data when a variable
at the caret or the selected variable (global variable, static variable inside functions,
file-internal static variable) or I/O register is read accessed (see "2.12.4 Collect execution history only when the condition is met").
Record Writing
Value
Sets a Point Trace event to record the access value as the trace data when a variable
at the caret or the selected variable (global variable, static variable inside functions,
file-internal static variable) or I/O register is write accessed (see "2.12.4 Collect execution history only when the condition is met").
Record R/W Value
Sets a Point Trace event to record the access value as the trace data when a variable
at the caret or a selected variable (global variable/static variable inside functions/fileinternal static variable)/I/O register is read/write accessed (see "2.12.4 Collect execution history only when the condition is met").
Record Start R/W
Value
[E1][E20]
Sets a trace start event to start collecting the trace data when a variable at the caret or
the selected variable (global variable, static variable inside functions, file-internal static
variable) /SFR is read/ write accessed (see "2.12.3.1 Set a Trace event").
Record End R/W
Value
[E1][E20]
Sets a trace end event to stop collecting the trace data when a variable at the caret or
the selected variable (global variable, static variable inside functions, file-internal static
variable) /SFR is read/ write accessed (see "2.12.3.1 Set a Trace event").
Show Trace Result
Opens the Trace panel and displays the acquired trace data.
Trace Settings
Opens the Property panel to set the trace function.
Timer Settings
The following cascade menus are displayed to set the timer-related event (see "2.13.2
Measure execution time in the arbitrary section").
Start timer
Sets a timer start event to start measuring the execution time of the program when an
instruction of an address at the caret position is executedNote 2.
Set Timer n
Stop timer
Set Timer n
View Result of Timer
Specify a channel (n: 1 to 8) in which a timer start event is set.
Sets a timer end event to stop measuring the execution time of the program when an
instruction of an address at the caret position is executedNote 2.
Specify a channel (n: 1 to 8) in which a timer stop event is set.
Opens the Events panel and displays only timer-related events.
Clear Coverage Information
[Simulator]
Clears all the coverage measurement results currently being stored in the debug tool.
Edit Disassemble
Changes to the edit mode to edit the instruction of the line at the caret position (see
"2.6.4 Perform line assembly").
This item is disabled during execution of a program.
Edit Code
Changes to the edit mode to edit the code of the line at the caret position (see "2.6.4
Perform line assembly").
This item is disabled during execution of a program.
R20UT3456EJ0100 Rev.1.00
Aug 01, 2015
Page 185 of 281
CS+ V3.02.00
A. WINDOW REFERENCE
View
(2)
The following cascade menus to set the display contents in the disassemble area are
displayed.
Show Offset
Displays the offset value of the label. The offset value from the nearest label is displayed when a label is defined for the address.
Show Symbol
Displays the address value in the format "symbol + offset value" (default).
Note that when a symbol has been defined as the address value, only the symbol is
displayed.
Show Function
Name
Displays the name of the register by its function name (default).
Show Absolute
Name
Displays the name of the register by its absolute name.
Settings Scroll
Range...
Opens the Scroll Range Settings dialog box to set the scroll range for this panel.
Mixed Display
Toggles between the mixed display mode (default) and disassemble display mode, as
the display mode of this panel (see "2.6.2.1 Change display mode").
Jump to Source
Opens the Editor panel and jumps to the source line corresponding to the address at
the caret position in this panel.
Jump to Memory
Opens the Memory panel (Memory1) and jumps to the memory value corresponding
to the address at the caret position in this panel.
Note 1.
[Simulator]
The [Use trace function] property in the [Trace] category on the Property panel is automatically set
to [Yes].
Note 2.
[Simulator]
The [Use timer function] property in the [Timer] [Simulator] category on the Property panel is automatically set to [Yes].
Event area [Full-spec emulator][E1][E20]
Hardware Break First
The type of break that can be set by a one click operation of the mouse is set as a
hardware breakpoint (this is reflected in the setting of the [First using type of
breakpoint] property in the [Break] [Full-spec emulator][E1][E20] category on the Property panel).
Software Break First
The type of break that can be set by a one click operation of the mouse is set as a software breakpoint (this is reflected in the setting of the [First using type of breakpoint]
property in the [Break] [Full-spec emulator][E1][E20] category on the Property panel).
R20UT3456EJ0100 Rev.1.00
Aug 01, 2015
Page 186 of 281
CS+ V3.02.00
A. WINDOW REFERENCE
CPU Register panel
This panel is used to display the contents of the CPU register (program registers/system registers) and change the CPU
register values (see "2.10.2 Display/change the CPU register").
This panel appears only when connected to the debug tool.
Caution
When the selected microcontroller supports multi-core, this panel displays/changes the value regarding a
core (PE) by switching selection between the target cores (see "2.7 Select a Core (PE)").
Remark 1.
This panel can be zoomed in and out by
in the tool bar, or by moving the mouse
wheel forward or backward while holding down the [Ctrl] key.
Note 1.
When the separator line of each area in this panel is double-clicked, the width of the area changes to the
shortest possible size that can display the contents of the area.
Figure A.20 CPU Register Panel
[Toolbar]
(1)
(2)
This section describes the following.
- [How to open]
- [Description of each area]
- [Toolbar]
- [[File] menu (CPU Register panel-dedicated items)]
- [[Edit] menu (CPU Register panel-dedicated items)]
- [Context menu]
[How to open]
- From the [View] menu, select [CPU Register].
[Description of each area]
(1)
[Register Name] area
The types of register are classified as categories (folders), and a list of the respective register names is displayed.
Note that neither category names nor register names can be edited and deleted.
The meanings of the icons are as follows:
Indicates that the register name belonging to this category is displayed. When you double-click
on the icon, or click on the "-" mark, the category is closed and the register name is hidden.
R20UT3456EJ0100 Rev.1.00
Aug 01, 2015
Page 187 of 281
CS+ V3.02.00
A. WINDOW REFERENCE
Indicates that the register name belonging to this category is hidden. When you double-click on
the icon, or click on the "+" mark, the category is opened and the register name is displayed.
Indicates the name of the register. When you double-click on the icon, or click on the "+" or "-"
marks, the name of the register part is displayed or hidden.
Indicates the name of the register part.
This area is provided with the following functions.
(a)
(2)
Registering a watch-expression
CPU registers/categories can be registered in the Watch panel as watch-expressions.
See "2.10.6.1 Register a watch-expression" for details on how to operate it.
Remark 1.
When you have registered a watch-expression with a category as the object, all of the CPU registers belonging to that category are registered as watch-expressions.
Remark 2.
A scope specification is automatically added to a registered watch-expression.
[Value] area
The values of each CPU register are displayed and changed.
The radix of a data value can be selected by the button on the toolbar or the context menu item. In addition, a display format adding the value in hexadecimal number constantly can also be selected as well.
The meanings of the colors of the CPU register values are as follows (character colors and background colors
depend on the configuration in the [General - Font and Color] category of the Option dialog box):
Display Example (Default)
Character color
Blue
Background color
Standard color
Character color
Brown
Background color
Cream
Description
The value of the CPU register that the user is changing
Press the [Enter] key to write to the target memory.
The value of the CPU register that has been changed
because of the execution of a program.
The highlighting is rest by executing again the program.
This area is provided with the following functions.
(a)
Changing the CPU register value
To edit the CPU register value, select the value to edit, then change the value directly from the keyboard after
clicking again on it (press the [Esc] key to cancel the edit mode).
After you edit the value of the CPU register, it is written to the target memory of the debug tool by pressing the
[Enter] key or moving the focus to outside the edit region.
(b)
Saving the contents of the CPU register
The Save As dialog box can be opened by selecting the [File] menu >> [Save CPU Register Data As…], and all
the contents of this panel can be saved in a text file (*.txt) or CSV file (*.csv).
See "2.10.2.4 Save the CPU register contents" for details on the method for saving the contents of the CPU
register.
R20UT3456EJ0100 Rev.1.00
Aug 01, 2015
Page 188 of 281
CS+ V3.02.00
A. WINDOW REFERENCE
[Toolbar]
Acquires the latest data from the debug tool, and updates the contents of this panel.
This item is disabled during execution of a program.
Notation
The following buttons to change the notation of a data value are displayed.
AutoSelect
Displays the value of the selected item (including sub-items) in the default notation
(default).
Hexadecimal
Displays the value of the selected item (including sub-items) in hexadecimal number.
Signed Decimal
Displays the value of the selected item (including sub-items) in signed decimal number.
Unsigned Decimal
Displays the value of the selected item (including sub-items) in unsigned decimal number.
Octal
Displays the value of the selected item (including sub-items) in octal number.
Binary
Displays the value of the selected item (including sub-items) in binary number.
ASCII
Displays the character string of the selected item (including sub-items) in ASCII code. If
the character size is 2 bytes and above, it is displayed with the characters for each 1 byte
arranged side-by-side.
Float
Displays the value of the selected item in float.
Note that when the value is not 4-byte data, displays it in the default notation.
Double
Displays the value of the selected item in double.
Note that when the value is not 8-byte data, displays it in the default notation.
Adds the value in hexadecimal number enclosing with "()" at the end of the value.
[[File] menu (CPU Register panel-dedicated items)]
The following items are exclusive for the [File] menu in the CPU Register panel (other items are common to all the panels).
Note that all these items are disabled during execution of a program.
Save CPU Register
Data
Overwrites the contents of this panel to the previously saved text file (*.txt)/CSV file (*.csv)
(see "(b) Saving the contents of the CPU register").
Note that when the file has never been saved or the file is write disabled, the same operation is applied as the selection in [Save CPU Register Data As…].
Save CPU Register
Data As…
Opens the Save As dialog box to newly save the contents of this panel to the specified text
file (*.txt)/CSV file (*.csv) (see "(b) Saving the contents of the CPU register").
[[Edit] menu (CPU Register panel-dedicated items)]
The following items are exclusive for [Edit] menu in the CPU Register panel (all other items are disabled).
Cut
Deletes the selected character string and copies it to the clipboard.
This item becomes valid only when the character string is being edited.
Copy
Copies the selected character string to the clipboard during editing.
If a line is selected, copies the register or the category to the clipboard.
The copied item can be pasted to the Watch panel.
Paste
Pasts the character string copied in the clipboard to the caret position.
This item becomes valid only when the character string is being edited.
Select All
Selects all the items of this panel.
Find…
Opens the Find and Replace dialog box with selecting the [Find in Files] tab.
Replace…
Opens the Find and Replace dialog box with selecting the [Replace in Files] tab.
R20UT3456EJ0100 Rev.1.00
Aug 01, 2015
Page 189 of 281
CS+ V3.02.00
A. WINDOW REFERENCE
[Context menu]
Register to Watch1
Registers the selected register or category to the Watch panel (Watch1).
Copy
Copies the selected character string to the clipboard during editing.
If a line is selected, copies the register or the category to the clipboard.
The copied item can be pasted to the Watch panel.
Notation
The following cascade menus to specify the notation of a data value are displayed.
AutoSelect
Displays the value of the selected item (including sub-items) in the default notation
(default).
Hexadecimal
Displays the value of the selected item (including sub-items) in hexadecimal number.
Signed Decimal
Displays the value of the selected item (including sub-items) in signed decimal number.
Unsigned Decimal
Displays the value of the selected item (including sub-items) in unsigned decimal number.
Octal
Displays the value of the selected item (including sub-items) in octal number.
Binary
Displays the value of the selected item (including sub-items) in binary number.
ASCII
Displays the character string of the selected item (including sub-items) in ASCII code.
If the character size is 2 bytes and above, it is displayed with the characters for each 1
byte arranged side-by-side.
Float
Displays the value of the selected item in float.
Note that when the value is not 4-byte data, displays it in the default notation.
Double
Displays the value of the selected item in double.
Note that when the value is not 8-byte data, displays it in the default notation.
Include Hexadecimal
Value
Adds the value in hexadecimal number enclosing with "()" at the end of the value.
R20UT3456EJ0100 Rev.1.00
Aug 01, 2015
Page 190 of 281
CS+ V3.02.00
A. WINDOW REFERENCE
IOR panel
This panel is used to display the contents of the I/O register and change the I/O register values (see "2.10.3 Display/
change the I/O register").
This panel appears only when connected to the debug tool.
Caution 1.
The I/O registers that cause the microcontroller to operate when they are read are read-protected and
therefore cannot be read ("?" is displayed in [Value]).
To read out the value of a read-protected I/O register, select [Force Read Value] from the context menu.
Reading of each register is allowed only once. After [Force Read Value] is applied, the register is no longer
marked "?" so it will not be instantly recognizable as read-protected.
Caution 2.
When the selected microcontroller supports multi-core, this panel displays/changes the value regarding a
core (PE) by switching selection between the target cores (see "2.7 Select a Core (PE)").
Remark 1.
This panel can be zoomed in and out by
in the tool bar, or by moving the mouse
wheel forward or backward while holding down the [Ctrl] key.
Remark 2.
When the separator line of each area in this panel is double-clicked, the width of the area changes to the
shortest possible size that can display the contents of the area.
Figure A.21 IOR Panel
[Toolbar]
(1)
(2)
(3)
(4)
(5)
This section describes the following.
- [How to open]
- [Description of each area]
- [Toolbar]
- [[File] menu (IOR panel-dedicated items)]
- [[Edit] menu (IOR panel-dedicated items)]
- [Context menu]
[How to open]
- From the [View] menu, select [IOR].
[Description of each area]
(1)
Search area
This area is used to search for the I/O register name.
R20UT3456EJ0100 Rev.1.00
Aug 01, 2015
Page 191 of 281
CS+ V3.02.00
A. WINDOW REFERENCE
Specifies the character strings to search (case-insensitive).
You can either type character strings directly from the key board (up to 512 characters), or
select one from the input history via the drop-down list (up to 10 items).
Searches up for the I/O register name containing the string specified in the text box, and
selects the I/O register that is found.
Searches down for the I/O register name containing the string specified in the text box, and
selects the I/O register that is found.
(2)
Remark 1.
A hidden I/O register name being classified with a category can be searched (the category is
opened and the I/O register is selected).
Remark 2.
After typing character strings to search, to press the [Enter] key is the same function as clicking the
button, and to press the [Shift] + [Enter] key is the same function as clicking the
button.
[IOR] area
The types of I/O register are classified as categories (folders), and a list of the respective I/O register name is displayed.
The meanings of the icons are as follows:
Indicates that the I/O register name belonging to this category is displayed. When you doubleclick on the icon, or click on the "-" mark, the category is closed and the I/O register name is hidden.
Note that no categories exist by default. Perform Tree editing if you need a category.
Indicates that the I/O register name belonging to this category is hidden. When you double-click
on the icon, or click on the "+" mark, the category is opened and the I/O register name is displayed.
Note that no categories exist by default. Perform Tree editing if you need a category.
Indicates the name of the I/O register.
Remark
The category names are sorted in character code order by clicking on the header part of this area
(the I/O register names in the category are also similarly sorted).
This area is provided with the following functions.
(a)
Tree editing
The each I/O register can be categorized (by folders) and displayed in the tree view.
To create a category, Click the
button on the toolbar or select [Create Category] from the context menu after
moving the caret to a I/O register name to create a category, and then input a desired name from the keyboard
(up to 1024 characters).
To delete a category, select the category then click the
button on the toolbar or select [Delete] from the context menu. However, the categories that can be deleted are only the empty categories.
To rename the created category, select the category then do either one of the following.
- Click the name again, then directly rename the category name.
- Select the [Edit] menu >> [Rename], then directly rename the category name.
- Press the [F2] key, then directly rename the category name.
By directly dragging and dropping the I/O register in the created category, each I/O register is displayed in the
categorized tree view.
Also, the display order of the categories and the I/O register names (upper or lower position) can be changed
easily by drag and drop operation.
(b)
Caution 1.
Categories cannot be created within categories.
Caution 2.
I/O registers cannot be added or deleted.
Registering a watch-expression
Variable names of C language, CPU registers, I/O registers, and assembler symbols can be registered in the
Watch panel as watch-expressions.
See "2.10.6.1 Register a watch-expression" for details on how to operate it.
R20UT3456EJ0100 Rev.1.00
Aug 01, 2015
Page 192 of 281
CS+ V3.02.00
(3)
A. WINDOW REFERENCE
Remark 1.
When you have registered a watch-expression with a category as the object, all of I/O registers
belonging to that category are registered as watch-expressions.
Remark 2.
A scope specification is automatically added to a registered watch-expression.
[Value] area
The value of I/O register is displayed and changed.
The radix of a data value can be selected by the button on the toolbar or the context menu item. In addition, a display format adding the value in hexadecimal number constantly can also be selected as well.
The meanings of the marks and colors displayed as I/O register values are as follows (character colors and background colors depend on the configuration in the [General - Font and Color] category of the Option dialog box):
Display Example (Default)
Description
Character color
Blue
The value of the I/O register that the user is changing (press
the [Enter] key to write to the target memory).
Background color
Standard color
Character color
Brown
Background color
Cream
The value of the I/O register that has been changed because
of the execution of a program
To reset the highlighting, select the
button on the toolbar
or [Reset Color] from the context menu.
Character color
Gray
The value of the I/O register that is a read-protected objectNote
Background color
Standard color
Note
An I/O register for which the microcontroller ends up being activated by a read operation is shown.
To read the value of read-protected I/O register, select [Force Read Value] from the context menu.
Caution
The timing for acquiring the values differs in the case of a 1 byte/2 bytes I/O register and that of 1
bit I/O registers that have been allocated to a 1 byte/2 bytes I/O register. Owing to this, there are
also cases where the values differ even if the value of the same I/O register is displayed.
Remark
The values are sorted in ascending order of the numerical values by clicking on the header part of
this area.
This area is provided with the following functions.
(a)
Changing I/O register values
To edit the I/O register value, select the value to edit, then change the value directly from the keyboard after
clicking again on it (press the [Esc] key to cancel the edit mode).
After you edit the value of the I/O register, it is written to the register of the debug tool by pressing the [Enter]
key, or moving the focus to outside the edit region.
See "2.10.3.4 Modify the I/O register contents" for details on the method for changing the I/O register value.
(b)
Saving the contents of the I/O register
The Save As dialog box can be opened by selecting the [File] menu >> [Save IOR Data As...], and all the contents of the I/O register can be saved in a text file (*.txt) or CSV file (*.csv).
See "2.10.3.6 Save the I/O register contents" for details on the method for saving the contents of the I/O
register.
(4)
[Type (Byte Size)] area
The type information of each I/O register is displayed in the form shown below.
- <Type of I/O register> [<Access attribute> <Accessible sizes>](<Size>)
Access attribute
Accessible sizes
One of the following is displayed as the access attribute.
R
Read only
W
Write only
R/W
Read/Write
All accessible sizes are demarcated by a comma and listed in order of the smallest size
in bit units (1 to 32 bits).
R20UT3456EJ0100 Rev.1.00
Aug 01, 2015
Page 193 of 281
CS+ V3.02.00
A. WINDOW REFERENCE
Size
(5)
The size of the I/O register is displayed.
It is displayed by supplying the unit, in byte units in the event that it can be displayed in
byte units, and in bit units in the event that it can be displayed on in bit units.
Example 1.
"The case of "IOR [R/W 1.8] (1 byte)"
An I/O register that is readable/writable and 1 bit accessible/8 bit accessible, and whose size is 1
byte
Example 2.
"The case of "IOR [R/W 1] (1 bit)"
An I/O register that is readable/writable and 1 bit accessible, and whose size is 1 byte
Remark
The type information is sorted in the character code order by clicking on the header part of this
area.
[Address] area
The address that each I/O register is mapped is displayed (hexadecimal number notation fixing).
However, in the case of the bit register, it is displayed by providing a bit offset value like the following examples.
Example 1.
The case of "0xFF40"
This is allocated to the address "OxFF40"
Example 2.
The case of "0xFF40.4"
This is allocated to bit 4 of the address "0xFF40.4" (bit register)
Remark
The addresses are sorted in ascending order of numerical values by clicking on the header part of
this area.
[Toolbar]
Acquires the latest data from the debug tool, and updates the contents of this panel.
Note that the values of read-protected I/O register are not re-read.
This item is disabled during execution of a program.
Resets highlighting of the selected I/O register whose value has been changed by executing a program.
Note that this item is disabled during execution of a program.
Adds a new category (folder). Directly input the category name in the text box.
There are no restrictions on the number of categories that can be created anew (however, it is not possible to create a category inside a category).
Note that this item is disabled during execution of a program.
Deletes the selected character string(s).
If an empty category is in a select state, its category is deleted (it is not possible to delete
I/O registers).
Notation
The following buttons to change the notation of a data value are displayed.
Hexadecimal
Displays the value of the selected item in hexadecimal number (default).
Signed Decimal
Displays the value of the selected item in signed decimal number.
Unsigned Decimal
Displays the value of the selected item in unsigned decimal number.
Octal
Displays the value of the selected item in octal number.
Binary
Displays the value of the selected item in binary number.
ASCII
Displays the value of the selected item in ASCII code.
Adds the value in hexadecimal number enclosing with "()" at the end of the value of the
selected item.
R20UT3456EJ0100 Rev.1.00
Aug 01, 2015
Page 194 of 281
CS+ V3.02.00
A. WINDOW REFERENCE
[[File] menu (IOR panel-dedicated items)]
The following items are exclusive for the [File] menu in the IOR panel (other items are common to all the panels).
Note that all these items are disabled during execution of a program.
Save IOR Data
Overwrites the contents of this panel to the previously saved text file (*.txt)/CSV file (*.csv)
(see "(b) Saving the contents of the I/O register").
Note that when the file has never been saved or the file is write disabled, the same operation is applied as the selection in [Save IOR Data As...].
Save IOR Data As...
Opens the Save As dialog box to newly save the contents of this panel to the specified text
file (*.txt)/CSV file (*.csv) (see "(b) Saving the contents of the I/O register").
[[Edit] menu (IOR panel-dedicated items)]
The following items are exclusive for [Edit] menu in the IOR panel (all other items are disabled).
Cut
Deletes the selected character string(s) and copies them to the clipboard (it is not possible
to cut I/O registers/categories).
Copy
Copies the contents of the selected range to the clipboard as character string(s).
If the I/O register(s)/category(s) are selected, copies them to the clipboard.
The copied item can be pasted to the Watch panel.
Paste
If texts are in editing, pastes the contents of the clipboard to the caret position (it is not
possible to paste I/O registers/categories).
Delete
Deletes the selected character string(s).
If an empty category is in a select state, its category is deleted (it is not possible to delete
I/O registers).
Select All
If texts are in editing, selects all the character strings.
If texts are not in editing, selects all the I/O registers/categories.
Rename
Edits the name of the selected category.
Find...
Moves the focus to the text box in the Search area.
Move...
Opens the Go to the Location dialog box to move the caret to the specified I/O register.
[Context menu]
Register to Watch1
Registers the selected I/O register or category to the Watch panel (Watch1).
Refresh
Acquires the latest data from the debug tool, and updates the contents of this panel.
Note that the values of read-protected I/O register are not re-read.
This item is disabled during execution of a program.
Force Read Value
Forcibly reads once the value of the read-protected I/O register.
Move...
Opens the Go to the Location dialog box.
Create Category
Adds a new category (folder). Directly input the category name in the text box.
There are no restrictions on the number of categories that can be created anew (however,
it is not possible to create a category inside a category).
Note that this item is disabled during execution of a program.
Copy
Copies the contents of the selected range to the clipboard as character string(s).
If the I/O register(s)/category(s) are selected, copies them to the clipboard.
The copied item can be pasted to the Watch panel.
Delete
Deletes the selected character string(s).
If an empty category is in a select state, its category is deleted (it is not possible to delete
I/O registers).
R20UT3456EJ0100 Rev.1.00
Aug 01, 2015
Page 195 of 281
CS+ V3.02.00
Notation
A. WINDOW REFERENCE
The following cascade menus are displayed to specify the notation.
Hexadecimal number
Displays the value of the selected item in hexadecimal number (default).
Signed Decimal
Displays the value of the selected item in signed decimal number.
Unsigned decimal
number
Displays the value of the selected item in unsigned decimal number.
Octal
Displays the value of the selected item in octal number.
Binary
Displays the value of the selected item in binary number.
ASCII
Displays the value of the selected item in ASCII code.
Include Hexadecimal
Value
Adds the value in hexadecimal number enclosing with "()" at the end of the value of the
selected item.
Reset Color
Resets highlighting of the selected I/O register whose value has been changed by executing a program.
R20UT3456EJ0100 Rev.1.00
Aug 01, 2015
Page 196 of 281
CS+ V3.02.00
A. WINDOW REFERENCE
Local Variables panel
This panel is used to display the contents of the local variable and change the local variable values (see "2.10.5 Display/change local variables").
This panel appears only when connected to the debug tool.
Caution 1.
Nothing is displayed on this panel during execution of a program. When the execution of a program is
stopped, items in each area are displayed.
Caution 2.
Due to compiler optimization, the data for the target variable may not be on the stack or in a register in
blocks where that variable is not used. In this case, the target variable will not be displayed.
Caution 3.
When the selected microcontroller supports multi-core, this panel displays/changes the value regarding a
core (PE) by switching selection between the target cores (see "2.7 Select a Core (PE)").
Remark 1.
This panel can be zoomed in and out by
in the tool bar, or by moving the mouse
wheel forward or backward while holding down the [Ctrl] key.
Note 2.
When the separator line of each area in this panel is double-clicked, the width of the area changes to the
shortest possible size that can display the contents of the area.
Figure A.22 Local Variables Panel
[Toolbar]
(1)
(2)
(3)
(4)
(5)
This section describes the following.
- [How to open]
- [Description of each area]
- [Toolbar]
- [[File] menu (Local Variables panel-dedicated items)]
- [[Edit] menu (Local Variables panel-dedicated items)]
- [Context menu]
[How to open]
- From the [View] menu, select [Local Variable].
[Description of each area]
(1)
Scope area
Select the scope of the local variable to be displayed from the following drop-down list.
Item
Current
R20UT3456EJ0100 Rev.1.00
Aug 01, 2015
Operation
Displays local variables in the scope of the current PC value.
Page 197 of 281
CS+ V3.02.00
Item
Operation
<Depth> <Function name() [file name#line
number]>Note
Displays local variables in the scope of the calling function.
After the program is executed, the scope that is selected is maintained as long as the selected scope exists.
Note
(2)
A. WINDOW REFERENCE
The calling functions displayed in the Call Stack panel are displayed.
[Name] area
The local variable name or function name is displayed.
The argument of the function is also displayed as the local variable.
In addition, the hierarchical structure is displayed in tree format for arrays, pointer variables, and structures or
unions.
This area cannot be edited.
The meanings of the icons are as follows:
Indicates the variable.
Auto variables, internal static variables, and register variables are also displayedNote.
In addition, the hierarchical structure is displayed in tree format for arrays, pointer variables, and
structures or unions.
If "+" mark exist at the top of the name, the next structure is expanded by clicking it (the mark
changes to "-" after the expansion).
Array
All elements in the array
Pointer variables
Variables that the pointer designates
If the pointer designates a pointer, add "+" mark and expand it by clicking the
mark.
Note that if the pointer designates an unknown, "?" mark is displayed.
Structures/Unions
All the member of structures/unions
Indicates the argument.
Indicates the function.
Note
When Auto variables are used to display local variables, accurate values cannot be displayed at a
prologue ("{") or epilogue ("}") of a function. The Auto variable addresses are the relative
addresses from the address pointed to by the stack pointer (SP), so their addresses are not determined until the SP value is determined in the function. The SP is manipulated via prologues or epilogues, so the accurate value cannot be displayed.
This area is provided with the following functions.
(a)
Registering a watch-expression
Variable names of C language can be registered in the Watch panel as watch-expressions.
See "2.10.6.1 Register a watch-expression" for details on how to operate it.
Remark
(b)
(3)
A scope specification is automatically added to a registered watch-expression.
Jump to memory
By selecting [Jump to Memory] from the context menu, the Memory panel (Memory1) opens with moving the
caret to the source line corresponding to the address where the selected local variable is disposed (if the Memory panel (Memory1) is already open, the screen will jump to the panel).
[Value] area
The value of the local variable is displayed and changed.
The notation of a data value can be selected by the button on the toolbar or the context menu item. In addition, a
display format adding the value in hexadecimal number constantly can also be selected as well.
The meanings of the marks and colors displayed as the values of the local variables are as follows (character colors and background colors depend on the configuration in the [General - Font and Color] category of the Option
dialog box):
R20UT3456EJ0100 Rev.1.00
Aug 01, 2015
Page 198 of 281
CS+ V3.02.00
A. WINDOW REFERENCE
Display Example (Default)
Note
Description
Character color
Blue
The value of the local variable that the user is changing
Press the [Enter] key to write to the target memory.
Background color
Standard color
Character color
Brown
Background color
Cream
The value of the local variable that have been changed
because of the execution of a programNote.
The highlighting is rest by executing again the program.
Character color
Gray
The value of the local variable that could not be acquired.
Background color
Standard color
Variables that the name stays same from the start point where the program started executing to the
breakpoint and their values are changed are the target.
This area is provided with the following functions.
(a)
Changing the local variable/argument value
To edit the local variable value or the argument value, select the value to edit, then change the value directly
from the keyboard after clicking again on it (press the [Esc] key to cancel the edit mode).
After you edit the value of the local variable or the argument, it is written to the target memory of the debug tool
by pressing the [Enter] key or moving the focus to outside the edit region.
See "2.10.5.2 Modify the contents of local variables" for details on the method for changing the local variable/
argument value.
(b)
Saving the contents of the local variable
The Save As dialog box can be opened by selecting the [File] menu >> [Save Local Variables Data As...], and all
the contents of this panel can be saved in a text file (*.txt) or CSV file (*.csv).
See "2.10.5.3 Save the contents of local variables" for details on the method for saving the contents of the local
variable.
(4)
[Type (Byte Size)] area
The type name of the local variable is displayed. The notation accords with the description of C language.
For an array, an element number is displayed in "[]". For a function, its size (number of bytes) is displayed in "()".
This area cannot be edited.
(5)
[Address] area
The address of the local variable is displayed. When a variable is assigned to the register, the name of the register
is displayed.
This area cannot be edited.
R20UT3456EJ0100 Rev.1.00
Aug 01, 2015
Page 199 of 281
CS+ V3.02.00
A. WINDOW REFERENCE
[Toolbar]
Acquires the latest data from the debug tool, and updates the contents
of this panel.
Notation
The following buttons to specify the notation of values are displayed.
AutoSelect
Displays values on this panel in the default notation according to the
type of variable (default).
Hexadecimal
Displays values on this panel in hexadecimal number.
Decimal
Displays values on this panel in decimal number.
Octal
Displays values on this panel in octal number.
Binary
Displays values on this panel in binary number.
Decimal Notation for Array Index
Displays array indexes on this panel in decimal number (default).
Hexadecimal Notation for Array Index
Displays array indexes on this panel in hexadecimal number.
Float
Displays values on this panel in float.
Note that when the value is not 4-byte data, or has the type information, displays it in the default notation.
Double
Displays values on this panel in double.
Note that when the value is not 4-byte data, or has the type information, displays it in the default notation.
Adds the value in hexadecimal number enclosing with "()" at the end
of the value.
Encoding
The following buttons to specify the encoding of character variables
are displayed.
Displays character variables in ASCII code (default).
Displays character variables in Shift-JIS code.
Displays character variables in EUC-JP code.
Displays character variables in UTF-8 code.
Displays character variables in UTF-16 code.
[[File] menu (Local Variables panel-dedicated items)]
The following items are exclusive for the [File] menu in the Local Variables panel (other items are common to all the panels).
Note that all these items are disabled during execution of a program.
Save Local Variables
Data
Overwrites the contents of this panel to the previously saved text file (*.txt)/CSV file (*.csv)
(see "(b) Saving the contents of the local variable").
Note that when the file has never been saved or the file is write disabled, the same operation is applied as the selection in [Save Local Variables Data As...].
Save Local Variables
Data As...
Opens the Save As dialog box to newly save the contents of this panel to the specified text
file (*.txt)/CSV file (*.csv) (see "(b) Saving the contents of the local variable").
[[Edit] menu (Local Variables panel-dedicated items)]
The following items are exclusive for [Edit] menu in the Local Variables panel (all other items are disabled).
R20UT3456EJ0100 Rev.1.00
Aug 01, 2015
Page 200 of 281
CS+ V3.02.00
A. WINDOW REFERENCE
Copy
Copies the contents of the selected line or the character string to the clipboard.
Select All
Selects all the items of this panel.
Rename
Changes to the edit mode to edit the selected local variable value (see "2.10.5.2 Modify
the contents of local variables").
This item is disabled during execution of a program.
Find...
Opens the Find and Replace dialog box with selecting the [Find in Files] tab.
Replace...
Opens the Find and Replace dialog box with selecting the [Replace in Files] tab.
[Context menu]
Register to Watch1
Registers the selected local variable to the Watch panel (Watch1).
Copy
Copies the contents of the selected line or the character string to the clipboard.
Notation
The following cascade menus to specify the notation of values are displayed.
AutoSelect
Displays values on this panel in the default notation according to the type of variable
(default).
Hexadecimal
Displays values on this panel in hexadecimal number.
Decimal
Displays values on this panel in decimal number.
Octal
Displays values on this panel in octal number.
Binary
Displays values on this panel in binary number.
Decimal Notation for
Array Index
Displays array indexes on this panel in decimal number (default).
Hexadecimal Notation for Array Index
Displays array indexes on this panel in hexadecimal number.
Float
Displays values on this panel in float.
Note that when the value is not 4-byte data, or has the type information, displays it in the
default notation.
Double
Displays values on this panel in double.
Note that when the value is not 4-byte data, or has the type information, displays it in the
default notation.
Include Hexadecimal
Value
Adds the value in hexadecimal number enclosing with "()" at the end of the value.
Encoding
The following cascade menus to specify the encoding of character variables are displayed.
ASCII
Displays character variables in ASCII code (default).
Shift_JIS
Displays character variables in Shift-JIS code.
EUC-JP
Displays character variables in EUC-JP code.
UTF-8
Displays character variables in UTF-8 code.
UTF-16
Displays character variables in UTF-16 code.
Jump to Memory
Opens the Memory panel (Memory1) and jumps to the memory value corresponding to the
address of the selected line in this panel.
R20UT3456EJ0100 Rev.1.00
Aug 01, 2015
Page 201 of 281
CS+ V3.02.00
A. WINDOW REFERENCE
Watch panel
This panel is used to display the contents of the registered watch-expressions and change their values (see "2.10.6
Display/change watch-expressions").
Up to a maximum of four of these panels can be opened. Each panel is identified by the names "Watch1", "Watch2",
"Watch3", and "Watch4" on the titlebar, and the watch-expressions can be registered/deleted/moved individually.
Watch-expressions can be registered in this panel as well as in the Editor panel, Disassemble panel, Memory panel,
CPU Register panel, Local Variables panel or IOR panel.
When the panel is closed with registered watch-expressions, the panel closes but the information on the registered
watch-expressions is retained. Therefore, if the same panel is opened again, it is opened with the watch-expressions registered.
The display contents are automatically updated when the value of the watch-expression changes after a program is
executed (when the execution is done in steps, the display is updated after each step).
In addition, by enabling the Real-time display update function, it is also possible to update the display contents in realtime even while a program is being executed.
This panel appears only when connected to the debug tool.
Caution
When the selected microcontroller supports multi-core, this panel displays/changes the value regarding a
core (PE) by switching selection between the target cores (see "2.7 Select a Core (PE)").
Remark 1.
This panel can be zoomed in and out by
in the tool bar, or by moving the mouse
wheel forward or backward while holding down the [Ctrl] key.
Remark 2.
When the separator line of each area in this panel is double-clicked, the width of the area changes to the
shortest possible size that can display the contents of the area.
Figure A.23 Watch Panel
[Toolbar]
(1)
(2)
(3)
(4)
(5)
This section describes the following.
- [How to open]
- [Description of each area]
- [Toolbar]
- [[File] menu (Watch panel-dedicated items)]
- [[Edit] menu (Watch panel-dedicated items)]
- [Context menu]
[How to open]
- From the [View] menu, select [Watch] >> [Watch1 - 4].
[Description of each area]
(1)
[Watch] area
All the registered watch-expressions are displayed in a list.
R20UT3456EJ0100 Rev.1.00
Aug 01, 2015
Page 202 of 281
CS+ V3.02.00
A. WINDOW REFERENCE
Clicking the title of the list in this area sorts the watch-expressions in the list in alphabetical order. Categories
(folders) can be created to categorize the watch-expressions and display them in the tree view (see "(a) Tree editing").
The meanings of the icons are as follows:
Indicates that the watch-expression belonging to this category is displayed. When you doubleclick on the icon, or click on the "-" mark, the category is closed and the watch-expression is
hidden.
Indicates that the watch-expression belonging to this category is hidden. When you doubleclick on the icon, or click on the "+" mark, the category is opened and the watch-expression is
displayed.
Indicates that the watch-expression is a variable.
At the top of the watch-expression represents arrays, pointer type variables, and structures/
unions, "+"/"-" mark is displayed. Click the mark to Expand/shrink display.
Indicates that the watch-expression is a function.
Indicates that the watch-expression is an immediate value.
Indicates that the watch-expression is an expression.
Indicates that the watch-expression is I/O register.
Indicates that the watch-expression is CPU register.
At the top of the watch-expression that has the lower level register (part of the register), "+"/"-"
mark is displayed. Click the mark to Expand/shrink display.
This area is provided with the following functions.
(a)
Tree editing
Watch-expressions can be categorized (by folders) and displayed in the tree view.
To create a category, click the
button on the toolbar or select [Create Category] from the context menu after
moving the caret to the position to create a category, and then input a desired name from the keyboard.
To delete a category, select the category then click the
button on the toolbar or select [Delete] from the
context menu.
To rename the created category, select the category then do either one of the following.
- Click the name again, then directly rename the category name.
- Select the [Edit] menu >> [Rename], then directly rename the category name.
- Press the [F2] key, then directly rename the category name.
By directly dragging and dropping the registered watch-expression in the created category, each category is displayed in the categorized tree view. Also, the display order of the categories and the watch-expressions (upper
or lower position) can be changed easily by drag and drop operation.
(b)
Caution 1.
Categories cannot be created within categories.
Caution 2.
Up to 1500 categories can be created in one watch panel (if this restriction is violated, a message
appears).
Remark
Drag and drop the watch-expressions/categories in other watch panel (Watch1 to Watch4) to
copy them.
Expand/shrink display
At the top of the watch-expression represents arrays, pointer type variables, structures/unions, and registers
(with the name of the part), "+"/"-" mark is displayed. Click the mark to expand the contents ("+" mark is
changed to "-" after the expansion).
Watch-Expression
Array
R20UT3456EJ0100 Rev.1.00
Aug 01, 2015
Contents When Expanded
All elements in the array
Select [Encoding] >> [ASCII] from the context menu to display the value as a string
(up to 256 characters). Note, however, that any characters that cannot be displayed in the encoding will be shown as periods "." or "?".
Page 203 of 281
CS+ V3.02.00
A. WINDOW REFERENCE
Watch-Expression
(c)
Contents When Expanded
Pointer type variable
Variables that the pointer designates
Structure/Union
All the member of structure/union
Register
Name of the bit/bit string that constructs register
Example) ECR register
FECC register
EICC register
Registering new watch-expression
There are following three methods of registering a new watch expression.
<1> Register from other panels
Do either one of the following to register watch-expressions in other panels.
- Drag and drop the target character string onto this area in the desired watch panel (Watch1 to Watch4).
- Select [Register to Watch1] from the context menu after selecting the target character string or place the
caret on either of the target character string (the target is automatically determined).
- Select the [Edit] menu >> [Paste] in this area in the desired watch panel (Watch1 to Watch4) after selecting
the [Edit] menu >> [Copy] for the target character string.
The relationship between panels that can use this operation and targets that can be registered as watchexpressions is as follows:
Table A.2
Relationship between Panels and Targets That Can be Registered as Watch-Expressions
Panel Name
Targets That can be Registered as Watch-Expressions
Editor panel
Variable names of C language, CPU registers, I/O registers, and assembler symbols
Disassemble panel
Variable names of C language, CPU registers, I/O registers, and assembler symbols
CPU Register panel
CPU registersNote
Local Variables panel
Variable names of C language (local variables)
IOR panel
I/O registersNote
Note
The scope-specification is automatically added to the registered watch-expression.
<2> Directly register in the Watch panel
Click the
button on the toolbar or select [Add New Watch] from the context menu in the desired watch
panel (Watch1 to Watch4) to display an entry box for a new watch-expression in the bottom of this area.
Directly input a watch-expression from the keyboard in the [Watch] area in the entry box then press the [Enter]
key.
For details on the input format of the watch-expression, see "(b) Watch-expression and operator".
Watch-expressions can be registered with specifying the scope. The scope specifications with watch-expression registration are as follows:
Caution 1.
If a load module name or file name contains a space or one of the following symbols, enclose
the name in double-quotes (" ").
$, #, (, ), [, ], &, ^,~ , %, +, - *, /, :, ?, ', |, \, <, >, !
Example: "c:\folder\prog.abs" $file.c#func
Caution 2.
If functions with the same name exist, write the type of parameter expressly. Example: func(int,
int)
R20UT3456EJ0100 Rev.1.00
Aug 01, 2015
Page 204 of 281
CS+ V3.02.00
A. WINDOW REFERENCE
Table A.3
Handling of a C Language Function When Registered in Watch by Specifying Scope
Scope Specification
Load Module
File Name
Source File
Name
Function Name
Subject to be
searched
prog$file#func
prog
file
func
Static functions
prog$func
prog
Global
func
Global functions
file#func
Current
file
func
Static functions
func
Current
Current
func
AllNote
Note
Table A.4
A search is made for static functions and global functions from the scope of the current PC
value in that order. Static functions out of scope are not searched for.
Handling of a C Language Variable When Registered in Watch by Specifying Scope
Scope Specification
Load Module
File Name
Source
File Name
Function
Name
Variable
Name
Subject to be searched
prog$file#func#var
prog
file
func
var
Static variables inside a
static functionNote 1
prog$file#var
prog
file
Global
var
Static variables inside a file
prog$var
prog
Global
Global
var
Global variables
file#func#var
Current
file
func
var
Static variables inside a
static functionNote 1
file#var
Current
file
Global
var
Static variables inside a file
var
Current
Current
Current
var
AllNote 2
Note 1.
If the current PC value exists in a specified function, the local variables that are not declared as
static also comprise the subject to be searched.
Note 2.
A search is made for local variables, static variables inside a file and global variables from the
scope of the current PC value in that order. The local variables and the static variables inside
a file that are out of scope are not searched for.
Table A.5
Handling of a CPU Register When Registered in Watch by Specifying Scope
Scope Specification
Register Bank
r10:REG
Table A.6
(None)
Name of CPU Register
r10
Handling of an I/O Register when Registered in Watch by Specifying Scope
Scope Specification
Name of I/O register
P0:IOR
P0
P0
P0
Remark 1.
A symbol name at the current caret position can be complemented by pressing the [Ctrl] +
[Space] key in this area (see "2.18.2 Symbol name completion function").
Remark 2.
An immediate value is treated as an address. Note, however, that an immediate value with
operators cannot be used.
Remark 3.
An arithmetic expression with symbols cannot be used for a watch-expression.
Remark 4.
If the same name exists either in C language variables, CPU registers or I/O registers, and it is
registered without specifying scopes, then its value will be displayed after the symbol is determined in the following order.
Variable of C language > CPU registers > I/O register
If "$" is specified at the top of a watch-expression, then its value will be displayed after the
R20UT3456EJ0100 Rev.1.00
Aug 01, 2015
Page 205 of 281
CS+ V3.02.00
A. WINDOW REFERENCE
symbol is determined in the following order.
CPU registers > I/O register > Variable of C language
Remark 5.
If a local variable and a global variable exist with the same name, and its symbol name is registered without specifying scopes, then its value will be displayed after the symbol is determined based on the scope of the current PC value.
Remark 6.
If the letter "I" alone is specified as a watch-expression, it is interpreted as an imaginary keyword. To acquire the value of a register "I," add ":REG" after the register.
Remark 7.
When watch-expressions are registered from the IOR panel or the CPU Register panel, the
scope specification is automatically added.
<3> Register from other application
Select a character string of a variable of C language, CPU register, I/O register or assembler symbol from a
external editor then do either one of the following.
- Drag and drop the target character string in this area in the desired watch panel (Watch1 to Watch4).
- Select the [Edit] menu >> [Paste] in this area in the desired watch panel (Watch1 to Watch4) after copying
the target character string.
Caution 1.
Up to 3000 watch-expressions can be registered in one watch panel (if this restriction is violated, a message appears).
Caution 2.
Due to compiler optimization, the data for the target variable may not be on the stack or in a
register in blocks where that variable is not used. In this case, the target watch-expression
value is displayed as "?".
Remark 1.
Each watch-expression registered in each watch panel (Watch1 to Watch4) is managed in
each panel and saved as the user information of the project.
Remark 2.
More than one watch-expression with the same name can be registered.
Remark 3.
You can export registered watch-expressions to a file and import it so that the watch-expressions can be re-registered (see "2.10.6.8 Export/import watch-expressions").
(d)
Editing watch-expression
To edit the registered watch-expression, double-click the watch-expression to be edited to change the watchexpression to edit mode then directly edit from the keyboard (press the [Esc] key to cancel the edit mode).
After editing the watch-expression, press the [Enter] key to complete the editing.
(e)
Deleting watch-expression
To delete the registered watch-expression, select the watch-expression(s) to be deleted then click the
ton on the toolbar or select [Delete] from the context menu.
(f)
but-
Setting of various events
Various events can be set to the selected watch-expression by selecting [Access Break] or [Trace Output] from
the context menu.
If an access event is set, the mark of the watch-expression is changed (the event mark of a break event is displayed under the icon of the watch-expression in layers).
When an event is set, the detailed information about the set event is reflected in the Events panel.
Note that events are only set to the watch-expressions that are global variables, static variables inside functions,
or file-internal static variables.
See the following for details on how to set events.
- "2.9.5 Stop the program with the access to variables/I/O registers"
- "2.12.4 Collect execution history only when the condition is met"
(g)
(2)
Jump to the address with memory definition
By selecting [Jump to Memory] from the context menu, the Memory panel (Memory1) opens with moving the
caret to the address in which the selected watch-expression is defined (if the Memory panel (Memory1) is
already open, the screen will jump to the panel).
Note that this operation is disabled when more than one watch-expression is selected at the same time or the
CPU register/I/O register is selected.
[Value] area
The value of the registered watch-expression is displayed and changed (if the watch-expression is a function
pointer, the function name is displayed in this area).
Notations and encodes can be selected by the button on the toolbar or the context menu item. In addition, a display format adding the value in hexadecimal number constantly can also be selected as well.
R20UT3456EJ0100 Rev.1.00
Aug 01, 2015
Page 206 of 281
CS+ V3.02.00
A. WINDOW REFERENCE
The default display format of the values is automatically decided depending on the type of the watch-expression.
Table A.7
Display Format of Watch-Expressions (Default)
Type of Watch-Expression
Display Format
char, signed char, unsigned char
ASCII code with hexadecimal number
short, signed short, short int, signed short int, int,
signed, signed int, long, signed long, long int, signed
long int
Signed decimal number with hexadecimal number
unsigned short, unsigned short int, unsigned,
unsigned int, unsigned long, unsigned long int
Unsigned decimal number with hexadecimal number
float
Float (when the size is 4-byte) with hexadecimal number
double, long double
Double (when the size is 8-byte) with hexadecimal
number
Pointers to char, signed char, unsigned char
Characters
Encoding: ASCII
Pointers to other than char, signed char, unsigned
char
Hexadecimal number
Arrays of char, signed char, unsigned char types
Characters
Encoding: ASCII
bit, boolean, _boolean
Unsigned decimal number with hexadecimal number
Enumeration type
Enumeration constant value with hexadecimal number
Label, address of immediate value, EQU symbol
Signed decimal number with hexadecimal number
bit symbol
Unsigned decimal number with hexadecimal number
Others
Hexadecimal number
The meanings of the marks and colors displayed as the values of watch-expressions are as follows (character colors and background colors depend on the configuration in the [General - Font and Color] category of the Option
dialog box):
Display Example (Default)
Note
Character color
Blue
Background color
Standard color
Character color
Pink
Background color
Standard color
Character color
Brown
Background color
Cream
Character color
Gray
Background color
Standard color
Description
The value of the watch-expression that the user is changing
Press the [Enter] key to write to the target memory.
The value of the watch-expression that is displayed with the
Real-time display update function
The value of the watch-expression that has been changed
because of the execution of a program
To reset the highlighting, select the
button on the toolbar
or [Reset Color] from the context menu.
Variable that does not exist is registered as a watchexpression or the value of the watch-expression cannot be
retrieved (i.g. when the I/O register is read-protectedNote, or a
variable is out of the scope, etc.)
The I/O register that cause the microcontroller to operate when it is read is read-protected and
therefore cannot be read ("?" is displayed in the value).
R20UT3456EJ0100 Rev.1.00
Aug 01, 2015
Page 207 of 281
CS+ V3.02.00
A. WINDOW REFERENCE
To read out the value of a read-protected I/O register, select [Force Read Value] from the context
menu. Reading of each register is allowed only once.
Remark 1.
Each watch-expression acquires the value in the order it was registered.
As the timing to acquire a value is different, the values displayed may be different if the same I/O
register is registered more than once.
Remark 2.
When a hexadecimal value is also given, then values in the specified notation and hexadecimal values are read separately. For this reason, the values with the specified notion and the hexadecimal
values may differ due to the time lag between being read.
This area is provided with the following functions.
(a)
Real-time display update function
Using the real-time display update function allows you to display/modify the value of the watch-expression not
only while the program is stopped, but also in execution.
See "2.10.1.4 Display/modify the memory contents during program execution" for details on the real-time display update function.
(b)
Changing values of watch-expressions
To edit the value of the watch-expression, change the value directly from the keyboard after double-clicking on
the value to be edited (press the [Esc] key to cancel the edit mode).
After you edit the value of the watch-expression, it is written to the target memory of the debug tool by pressing
the [Enter] key, or moving the focus to outside the edit region.
See "2.10.6.6 Modify the contents of watch-expressions" for detail on how to change values of watch-expressions.
(c)
Saving the contents of watch-expressions
By selecting the [File] menu >> [Save Watch Data As...], the Save As dialog box can be opened, and all the contents of this panel can be saved in a text file (*.txt) or CSV file (*.csv).
By selecting [Save Expanded Watch Data…] from the context menu, the Save As dialog box can be opened,
and the selected contents of watch-expressions can be saved in a text file (*.txt) or CSV file (*.csv).
See "2.10.6.9 Save the contents of watch-expressions" for details on the method for saving the contents of
watch-expressions.
(3)
[Type (Byte Size)] area
The type information of watch-expressions with the following format is displayed.
Watch-Expression
(4)
Display Format
Single CPU register
<Types of CPU register> (<SizeNote 1>)
Single I/O register
<I/O register type> (<Access attribute> <Accessible sizes><SizeNote 1>)
Access attribute
R:
W:
R/W:
Read only
Write only
Read/Write only
Accessible sizes
All accessible sizes are demarcated by a comma and listed in
order of the smallest size in bit units (1 to 32 bits).
Unknown
?
Others
<Watch-expression type that follow the C compiler's determinationNote 2> (<SizeNote 1>)
Note 1.
The size of the watch-expression is displayed in bytes.
However, for bit I/O register or C language bit field, the size is displayed in bits and "bits" is added
to the end of the number.
Note 2.
Types to be treated are displayed when compiling the watch-expression.
[Address] area
The address that each watch-expression is mapped is displayed (hexadecimal number notation fixing).
If the watch-expression is single CPU register or is unknown, "-" or "?" is displayed instead.
Remark
Example
If the watch-expression is the bit I/O register, the bit-offset value is also displayed as follows:
When the bit register is allocated to bit 4 of the address "0xFF40":
Display example: 0xFF40.4
R20UT3456EJ0100 Rev.1.00
Aug 01, 2015
Page 208 of 281
CS+ V3.02.00
(5)
A. WINDOW REFERENCE
[Memo] area
The user can write comments for the watch-expressions/categories.
Each comment for a watch-expression/category written in this area is saved individually as the user information of
the project. Therefore, when any of the watch-expression/category is deleted, the comment corresponding to it is
also deleted.
Note that when arrays or register are displayed expanded, the comment cannot be input for each element.
To edit the comment, input the character strings directly from the keyboard after double-clicking on the item to be
edited (press the [Esc] key to cancel the edit mode). Up to 256 character strings can be input (line feed code is
ignored). After editing the character strings, complete the editing by pressing the [Enter] key or moving the focus
to outside the edit region.
[Toolbar]
Reacquires all the values of the registered watch-expression and updates the display.
Note that read-protected I/O register values are not re-read.
Resets highlighting of the selected watch-expression whose value has been changed by
executing a program.
This item is disabled during execution of a program.
Registers a new watch-expression.
Directly input the watch-expression in the text box (see "(c) Registering new watchexpression")
Note that up to 3000 watch-expressions can be registered in one watch panel.
Adds a new category (folder).
Directly input the category name in the text box.
Note that up to 1500 categories can be created in one watch panel (categories cannot be
created in categories).
Deletes the selected character string(s).
If the watch-expression(s)/category(s) are selected, deletes them (except when the
expanded item of the watch-expression is selected).
Notation
The following buttons to change the notation of a data value are displayed.
AutoSelect
Displays the value of the selected watch-expression in the default notation (see "Table
A.7 Display Format of Watch-Expressions (Default)") according to the type of variable
(default).
Hexadecimal
Displays the value of the selected item in hexadecimal number.
Signed Decimal
Displays the value of the selected item in signed decimal number.
Unsigned Decimal
Displays the value of the selected item in unsigned decimal number.
Octal
Displays the value of the selected item in octal number.
Binary
Displays the value of the selected item in binary number.
ASCII
Displays the value of the selected item in ASCII code.
Float
Displays the value of the selected item in float.
Note that this item becomes valid only when the selected watch-expression value is 4byte data.
Double
Displays the value of the selected item in double.
Note that this item becomes valid only when the selected watch-expression value is 8byte data.
Adds the value in hexadecimal number enclosing with "()" at the end of the value of the
selected item (except the item displayed in hexadecimal number).
R20UT3456EJ0100 Rev.1.00
Aug 01, 2015
Page 209 of 281
CS+ V3.02.00
A. WINDOW REFERENCE
[[File] menu (Watch panel-dedicated items)]
The following items are exclusive for the [File] menu in the Watch panel (other items are common to all the panels).
Note that all these items are disabled during execution of a program.
Save Watch Data
Overwrites the contents of this panel to the previously saved text file (*.txt)/CSV file (*.csv)
(see "(c) Saving the contents of watch-expressions").
Note that when the file has never been saved or the file is write disabled, the same operation is applied as the selection in [Save Watch Data As...].
Save Watch Data As...
Opens the Save As dialog box to newly save the contents of this panel to the specified text
file (*.txt)/CSV file (*.csv) (see "(c) Saving the contents of watch-expressions").
[[Edit] menu (Watch panel-dedicated items)]
The following items are exclusive for [Edit] menu in the Watch panel (all other items are disabled).
Cut
Deletes the selected character string(s) and copies them to the clipboard.
If the watch-expression(s)/category(s) are selected, deletes them (except when the
expanded item of the watch-expression is selected).
Copy
Copies the contents of the selected range to the clipboard as character string(s).
If the watch-expression(s)/category(s) are selected, copies them to the clipboard (except
when the expanded item of the watch-expression is selected).
Paste
If texts are in editing, pastes the contents of the clipboard to the caret position.
If texts are not in editing and the watch-expression(s) are copied in the clipboard, registers
them to the caret position.
Delete
Deletes the selected character string(s).
If the watch-expression(s)/category(s) are selected, deletes them (except when the
expanded item of the watch-expression is selected).
Select All
If texts are in editing, selects all the character strings.
If texts are not in editing, selects all the watch-expressions/categories.
Rename
Renames the selected watch-expression/category.
Find...
Opens the Find and Replace dialog box with selecting the [Find in Files] tab.
Replace...
Opens the Find and Replace dialog box with selecting the [Replace in Files] tab.
[Context menu]
Access Break
This item becomes valid only when the selected watch-expression is the global variable,
the static variable inside functions, the file-internal static variable, or I/O register (multiple
selections not allowed).
The following cascade menus are displayed to set the access break event (see "2.9.5.1
Set a break event (access type)").
Set Read Break to
Sets a break event with read access condition to the selected watch-expression.
Set Write Break to
Sets a break event with write access condition to the selected watch-expression.
Set R/W Break to
Sets a break event with read/write access condition to the selected watch-expression.
Trace Output
This item becomes valid only when the selected watch-expression is a global variable,
static variable inside functions, file-internal static variable, or I/O register (multiple selections not allowed).
The following cascade menus are displayed to set the trace-related event (see "2.12.4.1
Set a Point Trace event").
R20UT3456EJ0100 Rev.1.00
Aug 01, 2015
Page 210 of 281
CS+ V3.02.00
A. WINDOW REFERENCE
Record Reading
Value
Sets a Point Trace event to record the values in the trace memory when the selected
watch-expression is accessed for read.
Record Writing Value
Sets a Point Trace event to record the values in the trace memory when the selected
watch-expression is accessed for write.
Record R/W Value
Sets a Point Trace event to record the values in the trace memory when the selected
watch-expression is accessed for read/write.
Record Start R/W
Value
[E1][E20]
Sets a trace start event to start collecting the trace data when the selected watch-expression is accessed for read/write.
Record End R/W
Value
[E1][E20]
Sets a trace end event to stop collecting the trace data when the selected watch-expression is accessed for read/write.
Trace
Opens the Trace panel and displays the acquired trace data.
Periodic Updating
Periodic Updating
Options
The following cascade menus are displayed to set for the real-time display update function
(see "(a) Real-time display update function").
Opens the Property panel to set for the real-time display update function.
Refresh
Reacquires all the values of the registered watch-expression and updates the display.
Note that the values of read-protected I/O register are not re-read.
Force Read Value
Forcibly reads once the values of the read-protected I/O register.
This item is disabled during execution of a program.
Add New Watch
Registers a new watch-expression. Directly input the watch-expression in the text box (see
"(c) Registering new watch-expression")
Note that up to 3000 watch-expressions can be registered in one watch panel.
Create Category
Adds a new category (folder). Directly input the category name in the text box.
Note that up to 1500 categories can be created in one watch panel (categories cannot be
created in categories).
Delete
Deletes the selected character string(s).
If the watch-expression(s)/category(s) are selected, deletes them (except when the
expanded item of the watch-expression is selected).
Cut
Deletes the selected character string(s) and copies them to the clipboard.
If the watch-expression(s)/category(s) are selected, deletes them (except when the
expanded item of the watch-expression is selected).
Copy
Copies the contents of the selected range to the clipboard as character string(s).
If the watch-expression(s)/category(s) are selected, copies them to the clipboard (except
when the expanded item of the watch-expression is selected).
Paste
If texts are in editing, pastes the contents of the clipboard to the caret position.
If texts are not in editing and the watch-expression(s) are copied in the clipboard, registers
them to the caret position.
Rename
Renames the selected watch-expression/category.
Import Watch Expression...
Opens the Open Watch Expression Data File dialog box to import watch-expressions (see
"2.10.6.8 Export/import watch-expressions").
Notation
The following cascade menus are displayed to specify the notation.
R20UT3456EJ0100 Rev.1.00
Aug 01, 2015
Page 211 of 281
CS+ V3.02.00
A. WINDOW REFERENCE
AutoSelect
Displays the value of the selected watch-expression in the default notation (see "Table A.7
Display Format of Watch-Expressions (Default)") according to the type of variable
(default).
Hexadecimal number
Displays the value of the selected item in hexadecimal number.
Signed Decimal
Displays the value of the selected item in signed decimal number.
Unsigned decimal
number
Displays the value of the selected item in unsigned decimal number.
Octal
Displays the value of the selected item in octal number.
Binary
Displays the value of the selected item in binary number.
ASCII
Displays the value of the selected item in ASCII code.
Include Hexadecimal
Value
Adds the value in hexadecimal number enclosing with "()" at the end of the value of the
selected item (except the item displayed in hexadecimal number).
Float
Displays the value of the selected item in float.
Note that when the selected watch-expression value is not 4-byte data, or has the type
information, displays it in the default notation (see "Table A.7 Display Format of WatchExpressions (Default)").
Double
Displays the value of the selected item in double.
Note that when the selected watch-expression value is not 8-byte data, or has the type
information, displays it in the default notation (see "Table A.7 Display Format of WatchExpressions (Default)").
Decimal Notation for
Array Index
Displays array indexes on this panel in decimal number (default).
Hexadecimal Notation for Array Index
Displays array indexes on this panel in hexadecimal number.
Encoding
The following cascade menus are displayed to specify the character code.
ASCII
Displays the value of the selected item in ASCII code (default).
Shift_JIS
Displays the value of the selected item in Shift-JIS code.
EUC-JP
Displays the value of the selected item in EUC-JP code.
UTF-8
Displays the value of the selected item in UTF-8 code.
UTF-16
Displays the value of the selected item in UTF-16 code.
Size Notation
The following cascade menus are displayed to specify the size notation.
1 Bytes
Displays the value of the selected item as 8-bit data.
2 Bytes
Displays the value of the selected item as 16-bit data.
4 Bytes
Displays the value of the selected item as 32-bit data.
8 Bytes
Displays the value of the selected item as 64-bit data.
Jump to Memory
Opens the Memory panel (Memory1) and jumps to the address which the selected watchexpression is defined (see "(g) Jump to the address with memory definition").
Reset Color
Resets highlighting of the selected watch-expression whose value has been changed by
executing a program.
This item is disabled during execution of a program.
Save Expanded Watch
Data…
Opens the Save As dialog box to newly save the selected contents of watch-expressions
to the specified text file (*.txt)/CSV file (*.csv) (see "(c) Saving the contents of watchexpressions").
R20UT3456EJ0100 Rev.1.00
Aug 01, 2015
Page 212 of 281
CS+ V3.02.00
A. WINDOW REFERENCE
Call Stack panel
This panel is used to display the call stack information for the function call (see "2.11.1 Display call stack information").
This panel appears only when connected to the debug tool.
Caution 1.
Nothing is displayed on this panel during execution of a program.
When the execution of a program is stopped, items in each area are displayed.
Caution 2.
When the selected microcontroller supports multi-core, this panel displays the value regarding a core
(PE) by switching selection between the target cores (see "2.7 Select a Core (PE)").
Remark
This panel can be zoomed in and out by
in the tool bar, or by moving the mouse
wheel forward or backward while holding down the [Ctrl] key.
Figure A.24 Call Stack Panel
[Toolbar]
(1)
(2)
This section describes the following.
- [How to open]
- [Description of each area]
- [Toolbar]
- [[File] menu (Call Stack panel-dedicated items)]
- [[Edit] menu (Call Stack panel-dedicated items)]
- [Context menu]
[How to open]
- From the [View] menu, select [Call Stack].
[Description of each area]
(1)
[Depth] area
The depth of the call is displayed.
The line at the current PC position becomes 0 and incremented numbers from 1 is added to the calling function in
the order.
(2)
[Call Stack] area
The current source position and the call stack information pushed on the stack (position of the calling function and
arguments of a each function, etc.) are displayed.
/
button on the toolbar, or
The display format in this area differs depending on the selection condition of the
of [Show Parameter]/[Show Module File Name] from the context menu.
R20UT3456EJ0100 Rev.1.00
Aug 01, 2015
Page 213 of 281
CS+ V3.02.00
A. WINDOW REFERENCE
Condition
- Display arguments
- Display module file name
- Display arguments
- Do not display module file name
- Do not display arguments
Display Format
<Function>(<Argument>=<Argument ValueNote>, ...)[<Module file
name>$<File name>#<Line number>] (default)
<Function>(<Argument>=<Argument valueNote>, ...)[<File Name>#<Line
number>]
<Function>()[<Module file name>$<File name>#<Line number>]
- Display module file name
- Do not display arguments
<Function>()[<File name>#<Line number>]
- Do not display module file name
Note
When the argument value is character string, up to 20 characters can be displayed.
Remark
Array arguments are passed as pointers rather than arrays (C language specification). For this reason, if the argument is an array, it is displayed as a pointer.
This area is provided with the following functions.
(a)
Jump to source line and disassemble
By selecting [Jump to Source] from the context menu, the Editor panel is opened with moving the caret to the
source line corresponding to the calling function at the current caret position (if the Editor panel is already open,
the screen will jump to the panel).
In addition, similarly by selecting [Jump to Disassemble], the Disassemble panel (Disasemmble1) is opened
with moving the caret to the address corresponding to the calling function at the current caret position (if the Disassemble panel is already open, the screen will jump to the panel (Disassemble1)).
Remark
(b)
It is possible to jump to the target source line by double-clicking on that line as well.
Saving the contents of call stack information
By selecting the [File] menu >> [Save Call Stack Data As...], the Save As dialog box can be opened, and all the
contents of this panel can be saved in a text file (*.txt) or CSV file (*.csv).
See "2.11.1.4 Save the contents of call stack information" for details on the method for saving the contents of
call stack information.
[Toolbar]
Acquires the latest data from the debug tool, and updates the contents of this panel.
Notation
The following buttons to specify the notation of values are displayed.
AutoSelect
Displays values on this panel in the default notation according to the type of variable (default).
Hexadecimal
Displays values on this panel in hexadecimal number.
Decimal
Displays values on this panel in decimal number.
Octal
Displays values on this panel in octal number.
Binary
Displays values on this panel in binary number.
Encoding
The following buttons to specify the encoding of character variables are displayed.
ASCII
Displays character variables in ASCII code (default).
Shift_JIS
Displays character variables in Shift-JIS code.
EUC-JP
Displays character variables in EUC-JP code.
UTF-8
Displays character variables in UTF-8 code.
UTF-16
Displays character variables in UTF-16 code.
R20UT3456EJ0100 Rev.1.00
Aug 01, 2015
Page 214 of 281
CS+ V3.02.00
A. WINDOW REFERENCE
Displays the call stack information with the module file name (default).
Displays the call stack information with the parameters (arguments) of the function call
(default).
[[File] menu (Call Stack panel-dedicated items)]
The following items are exclusive for the [File] menu in the Call Stack panel (other items are common to all the panels).
Note that all these items are disabled during execution of a program.
Save Call Stack Data
Overwrites the contents of this panel to the previously saved text file (*.txt)/CSV file
(*.csv) (see "(b) Saving the contents of call stack information").
Note that when the file has never been saved or the file is write disabled, the same
operation is applied as the selection in [Save Call Stack Data As...].
Save Call Stack Data As...
Opens the Save As dialog box to newly save the contents of this panel to the specified
text file (*.txt)/CSV file (*.csv) (see "(b) Saving the contents of call stack information").
[[Edit] menu (Call Stack panel-dedicated items)]
The following items are exclusive for [Edit] menu in the Call Stack panel (all other items are disabled).
Copy
Copies the contents of the selected line to the clipboard.
Select All
Selects all the items of this panel.
Find...
Opens the Find and Replace dialog box with selecting the [Find in Files] tab.
Replace...
Opens the Find and Replace dialog box with selecting the [Replace in Files] tab.
[Context menu]
Copy
Copies the contents of the selected line to the clipboard.
Show Module File
Name
Displays the call stack information with the module file name (default).
Show Parameter
Displays the call stack information with the parameters (arguments) of the function call
(default).
Notation
The following cascade menus to specify the notation of values are displayed.
AutoSelect
Displays values on this panel in the default notation according to the type of variable
(default).
Hexadecimal
Displays values on this panel in hexadecimal number.
Decimal
Displays values on this panel in decimal number.
Octal
Displays values on this panel in octal number.
Binary
Displays values on this panel in binary number.
Encoding
The following cascade menus to specify the encoding of character variables are displayed.
ASCII
Displays character variables in ASCII code (default).
Shift_JIS
Displays character variables in Shift-JIS code.
EUC-JP
Displays character variables in EUC-JP code.
UTF-8
Displays character variables in UTF-8 code.
UTF-16
Displays character variables in UTF-16 code.
R20UT3456EJ0100 Rev.1.00
Aug 01, 2015
Page 215 of 281
CS+ V3.02.00
A. WINDOW REFERENCE
Jump to Disassemble
Opens the Disassemble panel (Disassemble1) and jumps to the address corresponding to
the calling function of the selected line in this panel.
Jump to Source
Opens the Editor panel and jumps to the source line corresponding to the calling function
of the selected line in this panel.
Jump to Local Variable
at This Time
Opens the Local Variables panel to display the local variable corresponding to the selected
line.
R20UT3456EJ0100 Rev.1.00
Aug 01, 2015
Page 216 of 281
CS+ V3.02.00
A. WINDOW REFERENCE
Trace panel
This panel is used to display trace data recording the execution history of the program (see "2.12 Collect Execution History of Programs").
The trace data displays by mixing the disassembled text and source text by default, but it is also possible to display
either one of these by selecting the Display mode.
After the execution of the program is stopped, the display position is automatically updated such that the latest trace
data is displayed.
This panel appears only when connected to the debug tool.
Caution
[Full-spec emulator][E1][E20]
When trace data has been collected after selecting [all core] in the [Trace target setting] property in the
[trace] category on the [Debug Tool Settings] tab of the Property panel, this panel displays the trace data
regarding a core (PE) by switching selection between the target cores (see "2.7 Select a Core (PE)").
Remark 1.
When the separator line of each area in this panel is double-clicked, the width of the area changes to the
shortest possible size that can display the contents of the area.
Remark 2.
This panel can be zoomed in and out by
in the tool bar, or by moving the mouse
wheel forward or backward while holding down the [Ctrl] key.
Figure A.25 Trace Panel [Full-spec emulator][E1][E20]
(1)
(3)
(4)
(5)
(7)
(8)
(9) (10) (11)
(12)
[Toolbar]
R20UT3456EJ0100 Rev.1.00
Aug 01, 2015
Page 217 of 281
CS+ V3.02.00
A. WINDOW REFERENCE
Figure A.26 Trace Panel [Simulator]
(1)
[Toolbar]
(2)
(3)
(4)
(5)
(6)
(7)
(8)
(9)
This section describes the following.
- [How to open]
- [Description of each area]
- [Toolbar]
- [[File] menu (Trace panel-dedicated items)]
- [[Edit] menu (Trace panel-dedicated items)]
- [Context menu]
[How to open]
- From the [View] menu, select [Trace].
- On the Editor panel/Disassemble panel, select [Trace Settings] >> [Show Trace Result] from the context menu.
[Description of each area]
(1)
[Number] area
The trace number corresponding to the trace frame is displayed.
(2)
[Target] area [Simulator]
The name of the target core is displayed.
(3)
[Time (h:min:s,ms,s,ns)] area
This area displays the time required from the execution start of the program to the execution start of an instruction
of each frame or generation of memory access cause.
The time is displayed in units of "hours, minutes, seconds, milliseconds, microseconds and nanoseconds".
Remark 1.
[Full-spec emulator][E1][E20]
The time is displayed as a relative time.
Remark 2.
[Simulator]
The question of whether to set the time display as an accumulated time or differential time depends
on the setting of the [Accumulate trace time] property on the [Trace] category on the [Debug Tool
Settings] tab of the Property panel.
R20UT3456EJ0100 Rev.1.00
Aug 01, 2015
Page 218 of 281
CS+ V3.02.00
(4)
(5)
A. WINDOW REFERENCE
[Time(Clock)] area
This area displays the time required from the execution start of the program to the execution start of an instruction
of each frame or generation of memory access cause. The time is displayed in CPU clock cycles.
Remark 1.
[Full-spec emulator][E1][E20]
The time is displayed as a differential CPU clock cycles.
Remark 2.
[Simulator]
The question of whether to set the time display as an accumulated CPU clock cycles or differential
CPU clock cycles depends on the setting of the [Accumulate trace time] property on the [Trace]
category on the [Debug Tool Settings] tab of the Property panel.
[Line Number/Address] area
The line number of a source file or the address of the assemble code is displayed.
The notation of a data value can be selected by the button on the toolbar or the context menu item.
The display formats are as follows:
Type of Display Line
Display Format
Source text
<File name>#<Line number>
Instruction (disassemble results)
<Address>
Other than above
Remark
-
Since the following execution histories are not displayed, the line numbers displayed are not consecutive numbers.
- CPU register access
- Operand access
- Invalid fetch
(6)
[Pipeline] area [Simulator]
This area displays the pipeline execution status.
A 20-character string is displayed in this field, and each character represents the stage of the pipeline in one clock
cycle. Residues of 20 from the number of clock cycles are used as indices in display of the string representing the
corresponding stages of execution.
The meanings of the letters used to represent the stages are as follows.
Stage
Fetch
F
Decode
D
Execute
E
Example 1.
F: 10th clock cycle, D: 11th clock cycle, E: 13th clock cycle
Display: FD_E_ _ _ _ _ _ _ _ _ _ _ _ _ _ _ _
Example 2.
F: 18th clock cycle, D: 19th clock cycle, E: 20th clock cycle
Display: E_ _ _ _ _ _ _ _ _ _ _ _ _ _ _ _ _FD
Remark
(7)
Character
"_" indicates a space.
[Source/Disassemble] area
The collected trace data is displayed as follows:
Note that the items displayed in this area differ depending on the selection of the display mode (see "(a) Display
mode").
R20UT3456EJ0100 Rev.1.00
Aug 01, 2015
Page 219 of 281
CS+ V3.02.00
A. WINDOW REFERENCE
Figure A.27 Display Contents of [Source/Disassemble] Area (Default)
label
Source text
Instruction (disassemble results)
Offset value
Variable value
(including point trace results)
Break cause
Label
The label is displayed when a label is defined for the address.
Offset value
The offset value from the nearest label is displayed when a label is defined for
the address.
Source text
The corresponding source text is displayed when the Mixed display mode or
Source display mode is selected.
However, when a place where no debugging information is present is executed, "<No Debug Information>" is displayed.
In addition, when the value of a variableNote 1 or an I/O register that is
accessed during execution of a source line can be analyzed, that value is displayed in the following format at the end of the source line.
- <<<Variable name = Variable value>>>
- <<<I/O register name = I/O register value>>>
Example: a=b; <<<a=5>>>
The results of the Point Trace are displayed as same as format above.
Instruction (disassemble
results)
The corresponding instructions are displayed as the result of disassembling
when the Mixed display mode or Disassemble display mode is selectedNote 2.
The mnemonics are shown highlighted.
Break cause
[Simulator]
The reason why the program has broken down is displayed.
Note 1.
When there is a memory access, a symbol will be interpreted as a variable and displayed only if a
symbol is assigned to the accessed address. Note, however, that only variables of up to 4 bytes
are supported. If multiplication or other code is processed by the standard libraries, the label of the
SADDR area used by the standard library may be shown.
Note 2.
At a frame for which not all the trace data was fetched, "(LOST)" is displayed. In this case, the corresponding line is shown in error color (the error color depends on the configuration in the [General
- Font and Color] category of the Option dialog box).
This area is provided with the following functions.
(a)
Display mode
It is possible to select the following three display modes by selection of a button on the toolbar or the context
menu.
Display Mode
Mixed display mode
R20UT3456EJ0100 Rev.1.00
Aug 01, 2015
Displayed Content
Displays the instruction (disassemble results), labels, source text (corresponding source line), point trace results, and break causes (default).
Page 220 of 281
CS+ V3.02.00
A. WINDOW REFERENCE
Display Mode
Displayed Content
Disassemble display mode
Displays the instruction (disassemble results), labels, point trace results, and
break causes.
Source display mode
Displays the source text (corresponding source line) and break causes.
However, when a place where no debugging information is present is executed, "<No Debug Information>" is displayed.
(b)
Jumping to source line or disassemble
By selecting [Jump to Source] from the context menu, the Editor panel opens with moving the caret to the
source line corresponding to the line at the current caret position (if the Editor panel is already open, the screen
will jump to the panel).
In addition, similarly by selecting [Jump to Disassemble], the Disassemble panel (Disasemmble1) is opened
with moving the caret to the address corresponding to the fetch address of the line at the current caret position
(if the Disassemble panel is already open, the screen will jump to the panel (Disassemble1)).
(c)
Linking with other panels
By clicking the
/
button on the toolbar, or selecting [Window Connecting] >> [Connect Source Window]/
[Connect Disassemble Window] from the context menu, it is possible to link and display the corresponding
places on the Editor panel/Disassemble panel, with the address of the caret position on this panel used as the
pointer (no movement of the focus is done).
(d)
Pop-up display
By hovering the mouse cursor over a line, all the area (item) data corresponding to that line is pop-up displayed
in tandem shape.
(e)
Saving trace data
The Data Save dialog box can be opened by selecting the [File] menu >> [Save Trace Data As...], and the contents of this panel can be saved in a text file (*.txt) or CSV file (*.csv).
See "2.12.9 Save the contents of execution history" for details on the method for saving trace data.
(8)
[Factor] area [Full-spec emulator][E1][E20]
This area displays information on the memory access cause.
The display formats are as follows:
Factor
(9)
Display Format
PE/Thread
<Debug target information>
DMA
DMA
Other than above
(Nothing is displayed)
[Area] area [Full-spec emulator][E1][E20]
This area displays information on the target area of memory access.
The display formats are as follows:
Target Area
Display Format
Global RAM
Global RAM
Other than above
(Nothing is displayed)
(10) [ID] area [Full-spec emulator][E1][E20]
This area displays the ID of memory access.
The display formats are as follows:
ID
Display Format
ID number
ID <Decimal number between 0 and 15>
Other than above
(Nothing is displayed)
(11) [Address] area
The target address of memory access is displayed.
R20UT3456EJ0100 Rev.1.00
Aug 01, 2015
Page 221 of 281
CS+ V3.02.00
A. WINDOW REFERENCE
However, in the event of access to I/O register, the I/O register name is displayed instead of the address (when a
plurality is accessed these are displayed in the following lines).
The radix of a data value can be selected by the button on the toolbar or the context menu item.
(12) [Data] area
The accessed data value and the access type at that time are displayed.
However, CPU register access is not displayed.
The notation of a data value can be selected by the button on the toolbar or the context menu item.
The display format of the data value and the access type are as follows (character colors and background colors
depend on the configuration in the [General - Font and Color] category of the Option dialog box):
Display Example (Default)
RData value
WData value
RWData value
VECTData value
Memory Access Type
Character color
Standard color
Background color
Palegreen
Character color
Standard color
Background color
Orange
Character color
Standard color
Background color
Paleturquoise
Character color
Standard color
Background color
Palegreen
Read access
Write access
Read and write access
Vector read access
[Toolbar]
Acquires the latest data from the debug tool, and updates the contents of this panel.
This item is disabled while the tracer is running.
Clears the trace memory and the display of this panel (initialized).
This item is disabled while the tracer is running.
Starts the tracer operation.
The content currently being displayed in this panel is cleared.
This item is disabled while the tracer is running.
Stops the tracer operation.
The contents of trace data newly acquired are displayed.
This item is disabled while the tracer is stopped.
Opens the Trace Search dialog box.
Notation
The following buttons to change the notation of a data value are displayed.
This item is disabled while the tracer is running.
Displays values on this panel in hexadecimal number (default).
Displays values on this panel in decimal number.
Displays values on this panel in octal number.
Displays values on this panel in binary number.
Links with the Editor panel.
Links with the Disassemble panel.
Sets to the Mixed display mode as the display mode (default).
This item is disabled while the tracer is running.
Sets to the Disassemble display mode as the display mode.
This item is disabled while the tracer is running.
R20UT3456EJ0100 Rev.1.00
Aug 01, 2015
Page 222 of 281
CS+ V3.02.00
A. WINDOW REFERENCE
Sets to the Source display mode as the display mode.
This item is disabled while the tracer is running.
[[File] menu (Trace panel-dedicated items)]
The following items are exclusive for the [File] menu in the Trace panel (other items are common to all the panels).
Note that all these items are disabled during execution of a program.
Save Trace Data
Overwrites the contents of this panel to the previously saved text file (*.txt)/CSV file (*.csv)
(see "(e) Saving trace data").
Note that when the file has never been saved or the file is write disabled, the same operation is applied as the selection in [Save Trace Data As...].
This item is disabled while the tracer is running.
Save Trace Data As...
Opens the Data Save dialog box to newly save the contents of this panel to the specified
text file (*.txt)/CSV file (*.csv) (see "(e) Saving trace data").
This item is disabled while the tracer is running.
[[Edit] menu (Trace panel-dedicated items)]
The following items are exclusive for [Edit] menu in the Trace panel (all other items are disabled).
Copy
Copies the contents of the selected line to the clipboard (multiple line selections impossible).
This item is disabled while the tracer is running.
Find...
Opens the Trace Search dialog box.
[Context menu]
Clear Trace
Clears the trace memory and the display of this panel (initialized).
This item is disabled while the tracer is running.
Start Trace
Starts the tracer operation (see "2.12.5.2 Restart collection of execution history").
The content currently being displayed in this panel is cleared.
This item is disabled while the tracer is running.
Stop Trace
Stops the tracer operation (see "2.12.5.1 Stop collection of execution history temporarily").
The contents of trace data newly acquired are displayed.
This item is disabled while the tracer is stopped.
Find...
Opens the Trace Search dialog box.
This item is disabled while the tracer is running.
Copy
Copies the contents of the selected line to the clipboard (multiple line selections impossible).
This item is disabled while the tracer is running.
Mixed Display
Sets to the Mixed display mode as the display mode.
This item is disabled while the tracer is running.
Disassemble View
Sets to the Disassemble display mode as the display mode.
This item is disabled while the tracer is running.
Source View
Sets to the Source display mode as the display mode.
This item is disabled while the tracer is running.
Notation
The following cascade menus are displayed to specify the notation.
This item is disabled while the tracer is running.
R20UT3456EJ0100 Rev.1.00
Aug 01, 2015
Page 223 of 281
CS+ V3.02.00
A. WINDOW REFERENCE
Hexadecimal number
Displays values on this panel in hexadecimal number (default).
Decimal
Displays values on this panel in decimal number.
Octal
Displays values on this panel in octal number.
Binary
Displays values on this panel in binary number.
Window Connecting
The following cascade menus are displayed to link with other panels (see "(c) Linking
with other panels").
Connect Source Window
Links with the Editor panel.
Connect Disassemble
Window
Links with the Disassemble panel.
Jump to Disassemble
Opens the Disassemble panel (Disassemble1) and jumps to the fetch address corresponding to the line at the caret position in this panel.
Jump to Source
Opens the Editor panel and jumps to the source line corresponding to the line at the
caret position in this panel.
Jump to Memory
Opens the Memory panel and jumps to the memory value corresponding to the line at
the caret position in this panel.
R20UT3456EJ0100 Rev.1.00
Aug 01, 2015
Page 224 of 281
CS+ V3.02.00
A. WINDOW REFERENCE
Events panel
This panel is used to display the detailed information about the events that are set on the Editor panel/Disassemble
panel/Watch panel. On this panel, you can change the setting state of the event between valid/invalid and delete the
event (see "2.16 Manage Events").
This panel appears only when connected to the debug tool.
Remark 1.
Also see "2.16.6 Notes for setting events" for details on events (e.g. limits on the number of enabled
events).
Remark 2.
Events set via the Function List panel or Variable List panel of the analyze tool (Program Analyzer) are
also managed on this panel.
Remark 3.
This panel can be zoomed in and out by
in the tool bar, or by moving the mouse
wheel forward or backward while holding down the [Ctrl] key.
Remark 4.
When the separator line of each area in this panel is double-clicked, the width of the area changes to the
shortest possible size that can display the contents of the area.
Figure A.28 Events Panel
[Toolbar]
(1)
(2)
(3)
This section describes the following.
- [How to open]
- [Description of each area]
- [Toolbar]
- [[Edit] menu (Events panel-dedicated items)]
- [Context menu]
[How to open]
- From the [View] menu, select [Event].
- [Simulator]
On the Editor panel/Disassemble panel, select [Timer Settings] >> [View Result of Timer] from the context menu.
[Description of each area]
(1)
[Name] area
A list of the event names that have currently been set is displayed in the form shown below.
R20UT3456EJ0100 Rev.1.00
Aug 01, 2015
Page 225 of 281
CS+ V3.02.00
A. WINDOW REFERENCE
(a)
Remark
(a)
(b)
(b)
(c)
It is possible to limit the event to be displayed by clicking the button on the toolbar (see "[Toolbar]").
Check box
The setting state of the event is displayed/changed.
Note that the Event mark is changed depending on the setting state of the event.
Valid state
Event occurs when the specified condition is met.
It is possible to set the event to an invalid state by removing the check.
Invalid state
Event does not occur when the specified condition is met.
It is possible to set the event to a valid state by removing the check.
Suspended
state
The conditions that have been specified cannot be set with the program of the
debugging target.
It is not possible to operate the check box.
Remark 1.
Both of the Timer Start event and Timer Stop event is must be set for the Timer Result event.
Therefore, it is not possible to set a particular event to a valid state by only the setting of one of
these (at the same time as both events are set, they are treated as grouped events as a Timer
Result).
Remark 2.
It is not possible to set the Run-Break Timer event to an invalid/suspended state.
Remark 3.
The setting of the Unconditional Trace event and the Trace event to valid or invalid state is exclusively controlled. Therefore, the Unconditional Trace event, which is a built-in event, is valid
state by default, but if either a trace start event/trace end event is set, it automatically becomes
invalid state, and the Trace event, which is a event name that is collectively called with a trace
start event and a trace end event, becomes valid state. Conversely, if the set Trace event is
invalid state, the Unconditional Trace event automatically becomes valid state.
Event mark
The event mark shows the type of event, and in addition shows the current setting state.
The meanings of the marks displayed are as follows:
Table A.8
Event Mark
Event Type
Valid State
Invalid State
Suspended
State
Note
Hardware Break
Including a hardware break point
Software Break
Including a software break point
Break at start of function
A break event that can be set via
the analyze tool.
Access break to variable
Unconditional Trace
Run-Break Timer
Trace
Trace start
Trace end
None
None
-
None
Displayed on only the Events panel
Displayed on only the Editor panel/
Disassemble panel
Timer Result
Displayed on only the Events panel
Timer start
Displayed on only the Editor panel/
Disassemble panel
Timer end
R20UT3456EJ0100 Rev.1.00
Aug 01, 2015
Page 226 of 281
CS+ V3.02.00
A. WINDOW REFERENCE
Event Type
Invalid State
Suspended
State
Note
Point Trace
-
Printf (Action event)
-
Setting of two or more
events
(c)
Valid State
Note 1
Note 2
Note 3
Displayed on only the Editor panel/
Disassemble panel
Note 1.
There is one or more event with valid state.
Note 2.
There is no event with valid state and at least one event with invalid state.
Note 3.
All the set events are suspended state.
Event name
The event type and ID number are displayed as the event name.
A number from 0001 is automatically provided as the ID number for each event (no renumbering of the ID number is done even in the event that an event that has been set once is deleted).
Event types that are displayed are as follows:
Table A.9
Event Type
Event Type
Description
Hardware Break
(BreakNote 1)
Breaks the program when the condition is met while the debug tool monitors
the break condition all the time during program execution.
-> See "2.9.3 Stop the program at the arbitrary position (breakpoint)"
-> See "2.9.4 Stop the program at the arbitrary position (break event)"
-> See "2.9.5 Stop the program with the access to variables/I/O registers"
Software Break
(BreakNote 1)
Breaks the program when the instruction, which an address code to break is
rewritten for the break instruction, is executed.
-> See "2.9.3 Stop the program at the arbitrary position (breakpoint)"
Break at start of function
This event type is a Hardware Break (execution type) that is set in the Function
panel of the analyze tool (Program Analyzer).
Access break to variable
This event type is a Hardware Break (access type) that is set in the Variable
panel of the analyze tool (Program Analyzer).
Unconditional Trace
Automatically collects the trace data with start of a program execution, and
stops collecting the trace data with stop of the program execution.
This event cannot be deleted because of the built-in eventNote 2 (this event is
set to a Valid state by default).
-> See "2.12.2 Collect execution history until stop of the execution"
Run-Break Timer
Automatically measures the execution time of a program with start of the program execution, and stops the measurement with stop of the program execution. This event cannot be deleted because of the built-in eventNote 2 (this
event is set to a Valid state by default).
-> See "2.13.1 Measure execution time until stop of the execution"
Trace
Starts/stops collecting the trace data when the condition specified with a trace
start event and a trace end event is met (this event is displayed when either a
trace start event or a trace end event is set).
-> See "2.12.3 Collect execution history in the arbitrary section"
Timer Result n
Starts/stops measuring the execution time of a program when the condition
specified with a timer start event and a timer end event is met (this event is displayed when either a timer start event or a timer end event is set).
"n" indicates the channel number in which a Timer Result event is set.
-> See "2.13.2 Measure execution time in the arbitrary section"
R20UT3456EJ0100 Rev.1.00
Aug 01, 2015
Page 227 of 281
CS+ V3.02.00
A. WINDOW REFERENCE
Event Type
(2)
Description
Point Trace
Records the information as the trace data only when accessing the specified
variable or I/O register during execution of a program.
-> See "2.12.4 Collect execution history only when the condition is met"
Printf
Executes printf command in software processing after temporary stopping a
program in execution at an arbitrary position (action event).
-> See "2.15.1 Inset printf"
Note 1.
A breakpoint that is set by a one click operation of the mouse is displayed "Break" (see "2.9.3.1
Set a breakpoint").
Note 2.
This is set in the debug tool by default.
[Detail Information] area
Detailed information about each event is displayed.
The contents of the information that is displayed differ depending on the event type as follows:
Table A.10
Detailed Information with Event Type
Displayed ContentNote 1
Event Type
Hardware Break
(Condition: execution)
Format1
<Condition to occur> <File name#Line number> <Address>
Example
Before Execution main.c#39
0x100
After Execution
0x200
sub.c#100
Before Execution -
0x300
Execution
0x300 [Simulator]
main.c#39
Format2
<Condition to occur> <Symbol + Offset> <Address>
Example
Before Execution funcA + 0x10
0x100
After Execution
0x200
funcB + 0x20
Before Execution Hardware Break
(Condition: access)
Software Break
R20UT3456EJ0100 Rev.1.00
Aug 01, 2015
0x300
Format1
<Condition to occur> <File name#Variable name> <Address(range)>
<Comparison condition> <Comparison value>
Example
Read
main.c#variable1
0x100 - 0x101 == 0x5
Write
sub.c#variable2
0x200 - 0x200 == 0x7
Read/Write
sub2.c#variable3
0x300 - 0x303 == 0x8
Format2
<Condition to occur> <File name#Function name#Variable name>
<Address(range)> <Comparison condition> <Comparison value>
Example
Read
Format3
<Condition to occur> <Variable name> <Address(range)> <Comparison condition> <Comparison value>
Example
Write
Format1
<Condition to occur> <File name#Line number> <Address>
Example
Before Execution
main.c#40
0x102
Before Execution
sub.c#101
0x204
main.c#func1#variable1 0x100 - 0x101 == 0x10
variable1 0x100 - 0x101 == 0x10
Format2
<Condition to occur> <Symbol + Offset> <Address>
Example
Before Execution
funcA + 0x12
0x102
Page 228 of 281
CS+ V3.02.00
A. WINDOW REFERENCE
Displayed ContentNote 1
Event Type
Unconditional Trace
Run-Break Timer
Trace
(Condition: execution)
Timer Result n
(Condition: execution)
Format
-
Example
-
Format
Total: <Total execution time>
Example
Total:
1000ms
Total:
OVERFLOW
Format
Total of Start/End: <Total number of trace start/trace end events> Note 2
<Start/End> <Detailed information of trace start/trace end event>
Example
Total of Start/End: 4
Format
- Start After Execution
main.c#100
0x300
- Start After Execution
funcA + 0x100 0x300
- End
After Execution
main.c#200
0x100
- End
After Execution
funcA + 0x10
0x100
Total:<Total execution time > Total of Start/End: <Total number of
timer start event/timer end event>Note 2
- <Total execution time> <Pass Count> <Average> <Max> <Min>
- <Start/End> <Detailed information of timer start event/timer end
event>
Example
Total: 10ms Total of Start/End: 4
- Total: 10ms Pass Count: 5 Average: 2ms Max: 4ms Min: 1ms
Point Trace
(Condition: access)
Printf
(Action event)
Note 1.
- Start After Execution
main.c#100
0x300
- Start After Execution
funcA + 0x30
0x100
- End
After Execution
main.c#100
0x300
- End
After Execution
funcA + 0x50
0x100
Format1
<Condition to occur> <Variable name> <Variable address>
Example
Read
Format2
<Condition to occur> <File name#Variable name> <Variable address>
Example
Write
Format3
<Condition to occur> <File name#Function name#Variable name>
<Variable address>
Example
Read/Write
Format
<Condition to occur> <File name#Line number> <Address> <Setting
of Printf event>
Example
Before Execution
main.c#39 0x100 aaa, bbb, ccc
After Execution
sub.c#100 0x200 Result of aaa : aaa
variable1
sub.c#variable2
0x100
0x200
sub.c#func1#variabl3 0x300
Following are the details on the display format.
R20UT3456EJ0100 Rev.1.00
Aug 01, 2015
Page 229 of 281
CS+ V3.02.00
A. WINDOW REFERENCE
<Condition to
occur>
Displays one of the following conditions.
[Full-spec emulator][E1][E20]
Execution:
Before Execution or After Execution
Access:
Read, Write, Read/Write
[Simulator]
Execution:
Execution
Access:
Read, Write, Read/Write
<File name#Line
number>
Shows the line number of the source. Display format is the same as the
watch type scope specification expression. When multiple load module files
are downloaded, <Load module file name$File name#Line number> is displayed.
For those events set in the Disassemble panel, display <Line number> in
the format <Symbol + offset> in the condition below.
- Line information exists and the specified position that the event is set not
the top of the line information
- Line information does not exist and symbol information exists.
Show <Line number> in "-" in the following condition.
- Line information and symbol information does not exist.
<Variable name>
Shows the variable name in the source file. Display format is the same as
the watch type scope specification expression.
<Comparison
condition>
Condition to compare (==) is shown. If the comparison value is not specified,
comparison condition is not shown.
<Comparison
value>
Comparison value is shown. If the comparison value is not specified, comparison condition is not shown.
<Address>
Address in the memory area is shown (only in hex number).
<Start/End>
Shows whether the contents of the detailed information is start event or the
stop event.
<Pass Count>
Shows the measurement result of the pass count of the timer.
If a timer overflow occurs (see "2.13.3 Measurable time ranges"), or if the
illegal value was acquired, "OVERFLOW" is displayed.
If measurements have not been performed yet, "Not measured" is displayed.
<Total>
Shows the measurement result of the timer total execution time.
The unit is either of ns/s,/ms/s/min/clock (if, however, the unit is in "min", a
value in "s" unit also appears).
If a timer overflow occurs (see "2.13.3 Measurable time ranges"), or if the
illegal value was acquired, "OVERFLOW" is displayed.
If measurements have not been performed yet, "Not measured" is displayed.
<Average>
Shows the measurement result of average execution of the timer.
The unit is either of ns/s,/ms/s/min/clock (if, however, the unit is in "min", a
value in "s" unit also appears).
If a timer overflow occurs (see "2.13.3 Measurable time ranges"), or if the
illegal value was acquired, "OVERFLOW" is displayed.
If measurements have not been performed yet, "Not measured" is displayed.
<Max>
Shows the measurement result of the maximum execution time of the timer.
The unit is either of ns/s,/ms/s/min/clock (if, however, the unit is in "min", a
value in "s" unit also appears).
If a timer overflow occurs (see "2.13.3 Measurable time ranges"), or if the
illegal value was acquired, "OVERFLOW" is displayed.
If measurements have not been performed yet, "Not measured" is displayed.
R20UT3456EJ0100 Rev.1.00
Aug 01, 2015
Page 230 of 281
CS+ V3.02.00
Note 2.
(3)
A. WINDOW REFERENCE
<Min>
Shows the measurement result of the minimum execution time of the timer.
The unit is either of ns/s,/ms/s/min/clock (if, however, the unit is in "min", a
value in "s" unit also appears).
If a timer overflow occurs (see "2.13.3 Measurable time ranges"), or if the
illegal value was acquired, "OVERFLOW" is displayed.
If measurements have not been performed yet, "Not measured" is displayed.
<Set print event>
Shows the variable expression and the character strings specified in the
Action Events dialog box.
Click this line to display the detailed information of the lower lines.
[Comment] area
The user can write comments for each event that has been set.
To input comments, click on this area, or select [Edit Comment] form the context menu after selecting the event in
which you want to input comments, and then input directly the desired text from the keyboard (the edit mode is
cancelled by pressing down the [Esc] key).
After editing the comments, complete the editing by pressing the [Enter] key or moving the focus to outside the
edit region. Up to a maximum of 256 characters can be inputted for the comments, and this is saved as the settings of the user during use.
[Toolbar]
Deletes the selected event and event condition.
Note that it is not possible to delete the built-in events (Unconditional Trace event and
Run-Break Timer event).
Displays events related to Hardware Break (default).
Displays events related to Software Break (default).
[Full-spec emulator]
[E1][E20]
Displays events related to the trace (default).
Displays events related to the timer (default).
Displays events related to the action event (Printf event) (default).
Displays events related to the built-in event (Unconditional Trace event/Run-Break Timer
event) (default).
Opens the Editor panel and jumps to the source line corresponding to the address where
the selected eventNote is being set.
Opens the Disassemble panel and jumps to the disassemble results corresponding to the
address where the selected eventNote is being set.
Opens the Memory panel and jumps to the memory corresponding to the address where
the selected eventNote is being set.
Note
Events other than Trace events, Timer Result events and built-in events (Unconditional Trace events/
Run-Break Timer events) can be objects of this button.
[[Edit] menu (Events panel-dedicated items)]
The following items are exclusive for [Edit] menu in the Events panel (all other items are disabled).
Delete
Deletes the selected event and event condition.
Note that it is not possible to delete the built-in events (Unconditional Trace event and
Run-Break Timer event).
R20UT3456EJ0100 Rev.1.00
Aug 01, 2015
Page 231 of 281
CS+ V3.02.00
A. WINDOW REFERENCE
Select All
Selects all the events displayed on the panel.
Find...
Opens the Find and Replace dialog box with selecting [Find in Files] tab.
Replace...
Opens the Find and Replace dialog box with selecting [Replace in Files] tab.
[Context menu]
Enable Event
Enables the selected event (valid state).
Note that this item is disabled if the selected event is a valid state.
Disable Event
Disables the selected event (invalid state).
Note that this item is disabled if the selected event is an invalid state.
Delete
Deletes the selected event.
Note that it is not possible to delete the built-in events (Unconditional Trace event and
Run-Break Timer event).
Select All
Selects all the events of this panel.
View Select
The following cascade menus are displayed to limit the event type to be displayed.
All of the items have been selected by default.
Hardware Break
Displays events related to Hardware Break.
Software Break
Displays events related to Software Break.
Timer Event
Displays events related to the timer.
Trace Event
Displays events related to the trace.
Action Event
Displays events related to action events (Printf events).
Built-in Event
Displays events related to built-in events (Unconditional Trace event or Run-Break Timer
event).
Timer Settings
The following cascade menus are displayed to do the settings related to the timer.
Note that this item is enabled only when a timer-related event has been selected.
Init Timer
Initializes the timer used by the selected event (except for Run-Break Timer).
Nanosecond
Displays the result of a selected event measured by a timer in nanosecond (ns) units.
Microsecond
Displays the result of a selected event measured by a timer in microsecond (s) units.
Millisecond
Displays the result of a selected event measured by a timer in millisecond (ms) units.
Second
Displays the result of a selected event measured by a timer in second (s) units.
Minute
Displays the result of a selected event measured by a timer in minute (min) units.
Clock
Displays the result of a selected event measured by a timer in clock units.
Jump to Memory
Opens the Memory panel (Memory1) and jumps to the memory corresponding to the
address where the selected eventNote is being set.
Jump to Disassemble
Opens the Disassemble panel (Disassemble1) and jumps to the disassemble results corresponding to the address where the selected eventNote is being set.
Jump to Source
Opens the Editor panel and jumps to the source line corresponding to the address where
the selected eventNote is being set.
Edit Condition...
Opens one of the following dialog box to edit the selected event
- For an action event (Printf event)
Action Events dialog box
R20UT3456EJ0100 Rev.1.00
Aug 01, 2015
Page 232 of 281
CS+ V3.02.00
A. WINDOW REFERENCE
Edit Comment
Note
Sets to the edit mode to input comments for the selected event.
When comments are already present, all of that character string is set to a select state.
Events other than Trace events, Timer Result events and built-in events (Unconditional Trace events/
Run-Break Timer events) can be objects of this item.
R20UT3456EJ0100 Rev.1.00
Aug 01, 2015
Page 233 of 281
CS+ V3.02.00
A. WINDOW REFERENCE
Output panel
This panel is used to display operation logs for various components (debug tool, design tool, build tool, etc.) provided by
CS+, in addition to results of batch searches by the Find and Replace dialog box and a Printf event (see "2.15.1 Inset
printf").
The messages are classified by the message origination tool and displayed on the individual tabs.
Remark
This panel can be zoomed in and out by
in the tool bar, or by moving the mouse
wheel forward or backward while holding down the [Ctrl] key.
Figure A.29 Output Panel
(1)
(2)
This section describes the following.
- [How to open]
- [Description of each area]
- [[File] menu (Output panel-dedicated items)]
- [[Edit] menu (Output panel-dedicated items)]
- [Context menu]
[How to open]
- From the [View] menu, select [Output].
[Description of each area]
(1)
Message area
The output messages of each tool, search results and results by a Printf event are displayed.
In the case of search results (batch search), every time a search is performed, a new message will be displayed
after the previous message is cleared (except for the [All Messages] tab).
The colors of message display differ with the type of message as shown below (character colors and background
colors depend on the configuration in the [General - Font and Color] category of the Option dialog box).
Message Type
Normal message
Warning message
Error message
R20UT3456EJ0100 Rev.1.00
Aug 01, 2015
Display Example (Default)
Character color
Black
Background color
White
Character color
Blue
Background color
Standard color
Character color
Red
Background color
Light gray
Description
Displayed with information notices
Displayed with warnings about operations
Displayed when there is a critical error,
or when execution is not possible due
to a operational mistake
Page 234 of 281
CS+ V3.02.00
A. WINDOW REFERENCE
This area is provided with the following functions.
(a)
Tag jump
By double-clicking on the output message, the Editor panel is opened and the number of the corresponding line
in the corresponding file is displayed.
This allows you to jump from error messages that are output when building, etc. to the corresponding error line
in the source file.
(b)
Help display
If there is a caret on the line where a warning message or error message is being displayed, you can select
[Help for Message] from the context menu. You can also display help for that line's message by pressing the
[F1] key.
(c)
Saving a log
The Save As dialog box can be opened by selecting the [File] menu >> [Save Output-tab name As...], and the
contents that are displayed on the currently selected tab can be saved in a text file (*.txt) (messages on deselected tabs will not be saved).
(2)
Tab selection area
Select the tab that indicates the origin of message.
The following tabs are available for the debug tool.
Tab Name
Description
All Messages
Displays operation logs for all components (debug tool, design tool, build tool, etc.)
provided by CS+ in order of output.
Debug Tool
Displays messages output from the debug tool.
Display only operation logs for the debug tool out of those for various components
(debug tool, design tool, build tool, etc.) provided by CS+.
Cashe rate
[Simulator]
Displays the cache hit rate (the ratio of the cache hit count to the cache access
count).
Find and Replace
Displays the batch search results from the Find and Replace dialog box.
Caution
Even if a new message is output on a deselected tab, tab selection will not automatically switch. In
this case, "*" mark will be added in front of the tab name, indicating that a new message has been
output.
[[File] menu (Output panel-dedicated items)]
The following items are exclusive for the [File] menu in the Output panel (other items are common to all the panels).
Note that all these items are disabled during execution of a program.
Save Output-tab name
Overwrites the contents that are displayed on the currently selected tab to the preciously saved text file (see "(c) Saving a log").
Note that when the file has never been saved or the file is write disabled, the same
operation is applied as the selection in [Save Output-tab name As...].
This item is disabled while building.
Save Output-file name As...
Opens the Save As dialog box to newly save the contents that are displayed on the
currently selected tab to the specified text file (*.txt) (see "(c) Saving a log").
[[Edit] menu (Output panel-dedicated items)]
The following items are exclusive for [Edit] menu in the Output panel (all other items are disabled).
Copy
Copies the contents of the selected range to the clipboard as character string(s).
Select All
Selects all the messages displayed on the currently selected tab.
Find...
Opens the Find and Replace dialog box with selecting [Quick Find] tab.
Replace...
Opens the Find and Replace dialog box with selecting [Replace in Files] tab.
R20UT3456EJ0100 Rev.1.00
Aug 01, 2015
Page 235 of 281
CS+ V3.02.00
A. WINDOW REFERENCE
[Context menu]
Copy
Copies the contents of the selected range to the clipboard as character string(s).
Select All
Selects all the messages displayed on the currently selected tab.
Clear
Deletes all the messages displayed on the currently selected tab.
Tag Jump
Opens the Editor panel and jumps to the number of the corresponding line in the corresponding file of the message at the caret position.
Stop Searching
Cancels the search currently being executed.
This item is disabled when a search is not being executed.
Help for Message
Displays help for the massage on the current caret position.
This item only applies to warning messages and error messages.
R20UT3456EJ0100 Rev.1.00
Aug 01, 2015
Page 236 of 281
CS+ V3.02.00
A. WINDOW REFERENCE
Memory Mapping dialog box
This dialog box is used to set the memory mapping for each type of memory.
Caution
When the selected microcontroller supports multi-core, this property displays the memory mapping status
regarding a core (PE) by switching selection between the target cores (see "2.7 Select a Core (PE)").
Figure A.30 Memory Mapping Dialog Box [Full-spec emulator][E1][E20]
(1)
(2)
[Function
buttons]
R20UT3456EJ0100 Rev.1.00
Aug 01, 2015
Page 237 of 281
CS+ V3.02.00
A. WINDOW REFERENCE
Figure A.31 Memory Mapping Dialog Box [Simulator]
(1)
(2)
[Function
buttons]
This section describes the following.
- [How to open]
- [Description of each area]
- [Function buttons]
[How to open]
- On the [Debug Tool Settings] tab of the Property panel, click the [...] button displayed by selecting one of the values of
the [Memory mappings] property in the [Memory] category.
Caution
This dialog box cannot be opened during execution of a program.
[Description of each area]
(1)
(a)
Added memory mapping specification area
Specify the information for a memory mapping newly added.
This area is always invalid except for in the simulator.
[Memory type] [Simulator]
Select the memory type for the memory mapping to be added from the following drop-down list (The item
selected by default differs depending on the debug tool to use).
R20UT3456EJ0100 Rev.1.00
Aug 01, 2015
Page 238 of 281
CS+ V3.02.00
A. WINDOW REFERENCE
Temporary
This area is for testing and it can be accessed from the user program.
It can be allocated to only space that overlaps with [Access prohibited].
Mapping attributes and their sizes that can be set are as follows:
Table A.11
Settable Mapping Attribute
Attribute
Debug Tool
Full-spec emulator
E1(LPD)
E20(LPD)
-
-
Temporary
Simulator
: Valid
-: Invalid
(b)
[Address range]
Specify the start address and end address for the memory mapping to be added. Directly input a hexadecimal
number into the text box for each.
In the case of the following settings, however, new memory mappings cannot be added (Clicking the [Add] button in this area causes an error message to be displayed).
- If the specified address range duplicates the memory area other than [Access prohibited] when [Temporary] is
selected as the memory type
(c)
[Access width] (except [Simulator])
This item is always invalid.
(d)
Button
Button
Add
(2)
(a)
Function
Adds the content specified in this area to memory mapping.
The added memory mapping is displayed in the [Memory mapped list] area.
The changes will not take effect until the [OK] button is clicked.
[Memory mapped list] area
List display
Information about the memory mapping added in the Added memory mapping specification area and the microcontroller's internal memory mapping is displayed.
This area cannot be edited.
R20UT3456EJ0100 Rev.1.00
Aug 01, 2015
Page 239 of 281
CS+ V3.02.00
A. WINDOW REFERENCE
Memory type
Displays the following memory types.
- Code Flash (xxx)Note 1
- Local RAM (xxx)Note 1
- Retention RAM (xxx)Note 1
- Global RAM (xxx)Note 1
- Data Flash
- HBUS
- CPU Peripheral (xxx)Note 1
- PBUS
- FCU RAM
- Emulation RAM
- Video RAM
- SDRAM
- Serial Flash
- Access prohibited
- Temporary
Address range
Displays the address range as <Start address> - <End address>.
Display is fixed as "0x"-prefixed hexadecimal numbers.
Size
Displays size as a decimal number (unit: bytes/KbytesNote 2).
Access width
Displays the access width (unit: bits).
Note 1.
The following additional information is entered to xxx.
- Bank information (e.g. BankA, BankB)
- PE number (e.g. PE1, PE3)
- Unique names, such as Self and PCU (e.g. PCU, Self, Primary, Secondary)
Note 2.
(b)
Only in the case of multiple of 1024, displays in kilobyte units.
Button
Button
Function
Remove
Deletes the memory mapping selected in this area.
The memory area that can be deleted is the memory mapping added by the user (the
microcontroller's internal memory mapping cannot be deleted).
[Function buttons]
Button
Function
OK
Sets the currently specified memory mapping to the debug tool and closes this dialog box.
Cancel
Cancels memory mapping changes and closes this dialog box.
Help
Displays the help for this dialog box.
R20UT3456EJ0100 Rev.1.00
Aug 01, 2015
Page 240 of 281
CS+ V3.02.00
A. WINDOW REFERENCE
Download Files dialog box
This dialog box is used to select files for downloading and configure download conditions (see "2.5 Download/Upload
Programs").
Note that files specified as build targets in a project (main project or sub-project) are automatically registered as download targets (they can be unregistered).
Caution
This dialog box cannot be opened during execution of a program.
Figure A.32 Download Files Dialog Box
(2)
(1)
[Function buttons]
This section describes the following.
- [How to open]
- [Description of each area]
- [Function buttons]
[How to open]
- On the [Download File Settings] tab of the Property panel, click the [...] button displayed by selecting the [Download
files] property in the [Download] category.
[Description of each area]
(1)
(a)
[Download file list] area
List display
Displays a list of files to download. The names of files specified as build targets in a project (main project or
sub-project) are displayed by default (they can be removed).
Files are downloaded in the order that they are displayed here.
To add a new file to be downloaded, click the [Add] button in this area, then in the [Download file property] area,
specify the download conditions of the file to add.
R20UT3456EJ0100 Rev.1.00
Aug 01, 2015
Page 241 of 281
CS+ V3.02.00
(b)
A. WINDOW REFERENCE
Button
Button
(2)
(a)
Function
Up
Moves the selected file up one row in the list.
Clicking this for the top file in the list has no effect.
Down
Moves the selected file down one row in the list.
Clicking this for the bottom file in the list has no effect.
Add
Adds an empty item "-" to the list, and selects it.
Specify the download conditions of the file to add in the [Download file property] area.
Note that this button will be disabled if 20 files have already been registered.
Remove
Removes the selected file from the list.
Note, however, that this button is disabled if the selected file is a project build target.
Remark 1.
By hovering the mouse cursor over a file name, the pass information of the file is pop-up displayed.
Remark 2.
By dragging a file name with the mouse, the display order in the list can be changed.
Note, however, that the order of a project build target cannot be changed.
[Download file property] area
[Download file information]
This area is used to display or edit the download conditions of the file selected in the [Download file list] area.
It can also be used to specify the download conditions of new download files added via the [Add] button.
File
File type
Compiler Vendor
R20UT3456EJ0100 Rev.1.00
Aug 01, 2015
Specify the name of the file to download.
Default
File name (but it will be blank for newly added files)
Modifying
Directly enter from the keyboard, or specify with the Select Download File dialog box opened by clicking the [...] buttonNote 1 appears
at right by selecting this item.
Available values
See "Table 2.1 Downloadable File Formats"
Up to 259 characters
Select the type of the file to download.
Default
Load module file
Modifying
Select from the drop-down list.
Available values
Load module file
Specifies a load module file (*.abs).
Hex file
Specifies an Intel HEX file (*.hex).
S-record file
Specifies a Motorola S-record file (*.mot).
Binary data file
Specifies an binary file (*.bin).
Specify the vendor of the compiler that was used to create a load module file.
This property setting is used to handle the information that was output in the load module file and is specific to the compiler's vendor.
Default
Auto
Modifying
Select from the drop-down list.
Available values
Auto
Specify when having the compiler determined automatically.
Green Hills
Software
Specify when using a GHS compiler.
Page 242 of 281
CS+ V3.02.00
A. WINDOW REFERENCE
Offset
Specify the offset from the address at which the file's download is to start.
Note that this item appears only when [File type] is set to [Hex file] or [S record file].
Start address
Default
0
Modifying
Directly enter from the keyboard.
Available values
0x0 to 0xFFFFFFFF in hexadecimal number
Specify the address at which to start the file's download.
Note that this item appears only when [File type] is set to [Binary file].
Download object
Download symbol
information
Generate the
information for
input completion
Default
0
Modifying
Directly enter from the keyboard.
Available values
0x0 to 0xFFFFFFFF in hexadecimal number
Select whether to download the object information from the specified file.
Note that this item appears only when [File type] is set to [Load module file].
Default
Yes
Modifying
Select from the drop-down list.
Available values
Yes
Downloads object information.
No
Does not download object information.
Select whether to download the symbol information from the specified fileNote 2.
Note that this item appears only when [File type] is set to [Load module file].
Default
Yes
Modifying
Select from the drop-down list.
Available values
Yes
Downloads symbol information.
No
Does not download symbol information.
Select whether to generate the information for the Symbol name completion function
when downloadingNote 3.
Note that this item appears only when [File type] is set to [Load module file].
Default
Yes
Modifying
Select from the drop-down list.
Available values
Yes
Generates the information for the symbol name
completion function. (i.e. uses the symbol name
completion function.)
No
Does not generate the information for the symbol
name completion function. (i.e. does not use the
symbol name completion function.)
Note 1.
When a file specified as build target in the project is selected in the [Download file list] area, or
when the program is executing, the [...] button does not appear.
Note 2.
If the symbol information have not been downloaded, the source level debugging cannot be performed.
Note 3.
When [Yes] is selected, the time taken for downloading and the memory usage on the host
machine will increase. We recommend selecting [No] in this item if you do not intend to use the
symbol name completion function.
R20UT3456EJ0100 Rev.1.00
Aug 01, 2015
Page 243 of 281
CS+ V3.02.00
A. WINDOW REFERENCE
[Function buttons]
Button
Function
OK
Finishes configuring the download files, and closes this dialog box.
Cancel
Cancels any changes to the download files, and closes this dialog box.
Help
Displays the help for this dialog box.
R20UT3456EJ0100 Rev.1.00
Aug 01, 2015
Page 244 of 281
CS+ V3.02.00
A. WINDOW REFERENCE
Flash Options Setting dialog box
This dialog box is used to configure options for the flash memory incorporated in the microcontroller.
Caution 1.
[Full-spec emulator][E1][E20]
This dialog box appears only when connecting to the debug tool.
[Simulator]
This dialog box appears only when disconnecting from the debug tool.
Caution 2.
[Full-spec emulator][E1][E20]
CPU reset may be generated automatically when you click the [Write] button after changing the configuration of this dialog box.
Figure A.33 Flash Options Setting Dialog Box [Full-spec emulator][E1][E20]
(1)
[Function buttons]
Figure A.34 Flash Options Setting Dialog Box [Simulator]
(1)
[Function buttons]
R20UT3456EJ0100 Rev.1.00
Aug 01, 2015
Page 245 of 281
CS+ V3.02.00
A. WINDOW REFERENCE
This section describes the following.
- [How to open]
- [Description of each area]
- [Function buttons]
[How to open]
- On the [Flash Options Settings] tab tab of the Property panel, click the [...] button displayed by selecting the [Flash
options] property in the [Flash Options] category.
[Description of each area]
(1)
[Flash option property] area
(a)
[Option Bytes Setting]
You can configure the option bytes for the flash memory.
OPBT0 - 15
Caution
Specify the option bytes.
Default
The initial value stored in the device file.
Modifying
Directly enter from the keyboard.
Available values
0x0 to 0xFFFFFFFF in hexadecimal number
The number of option bytes (OPB0 - 15) to be displayed differs with the selected microcontroller
(the bytes for some numbers might actually be unused).
[Function buttons]
Button
Function
Read
[Full-spec emulator][E1][E20]
Reads the values currently specified in the debug tool, and reflects them in this
dialog box.
Write
[Full-spec emulator][E1][E20]
Writes the currently set values in this dialog box to the debug tool, and reflects
them in the project. Then, closes this dialog box.
Close
Specifies the currently set values in this dialog box to the project and closes this
dialog box.
Cancel
Closes this dialog box without setting.
Help
Displays the help for this dialog box.
R20UT3456EJ0100 Rev.1.00
Aug 01, 2015
Page 246 of 281
CS+ V3.02.00
A. WINDOW REFERENCE
Select Priority Boot Loader Project dialog box
This dialog box is used to select a boot loader project for use in debugging of an individual core when its application
project is included among multiple boot loader projects.
Figure A.35 Select Priority Boot Loader Project Dialog Box
(1)
[Function buttons]
This section describes the following.
- [How to open]
- [Description of each area]
- [Function buttons]
[How to open]
When all of the [Priority Debugging] property in the [Debug] category on each boot loader project's Property panel are
being set to [Yes] or [No] and the following operation is performed:
- Start communication with the debug tool (see "2.4.1 Connect to the debug tool")
[Description of each area]
(1)
Priority boot loader project selection area
From the list of boot loader projects, select the one that you wish to take precedence over other projects in standalong debugging.
[Function buttons]
Button
Function
OK
The selected boot loader project will take precedence over other projects in stand-along
debugging.
The property setting ([Debug] category >> [Priority Debugging] property) for all boot loader
projects is also changed accordingly.
Help
Displays the help for this dialog box.
R20UT3456EJ0100 Rev.1.00
Aug 01, 2015
Page 247 of 281
CS+ V3.02.00
A. WINDOW REFERENCE
Action Events dialog box
This dialog box is used to configure action events (see "2.15 Set an Action into Programs").
This dialog box appears only when connected to the debug tool.
Caution
Also see "2.16.6 Notes for setting events" for details on Printf events (e.g. limits on the number of
enabled events).
Figure A.36 Action Events Dialog Box
(1)
(2)
[Function
buttons]
This section describes the following.
- [How to open]
- [Description of each area]
- [Function buttons]
[How to open]
- On the Editor panel, move the caret to the line where you wish to set an action event, then select [Register Action
Event...] from the context menu.
- On the Disassemble panel, move the caret to the address where you wish to set an action event, then select [Register
Action Event...] from the context menu.
- On the Events panel, select an action event, then select [Edit Condition...] from the context menu.
R20UT3456EJ0100 Rev.1.00
Aug 01, 2015
Page 248 of 281
CS+ V3.02.00
A. WINDOW REFERENCE
[Description of each area]
(1)
Tab selection area
Select a tab to switch the type of an action event to be set.
This dialog box has the following two tabs.
- [Printf event] tab
- [State save event] tab
Caution
(2)
If this dialog box is opened by selecting [Edit Condition...] from the context menu, this area does not
appear.
Event condition setting area
Use this area to configure detailed condition of an action event.
For details on how to setup an action event, see the section explaining the corresponding tab.
[Function buttons]
Button
Function
OK
Finishes configuring the action event, and sets it at the position specified in this dialog box.
Cancel
Cancels the action event settings and closes this dialog box.
Help
Displays the help for this dialog box.
R20UT3456EJ0100 Rev.1.00
Aug 01, 2015
Page 249 of 281
CS+ V3.02.00
A. WINDOW REFERENCE
[Printf event] tab
This tab is used to configure Printf events as action events (see "2.15 Set an Action into Programs").
A Printf event momentarily stops the execution of the program at a specified location, and executes the printf command
via software processing. When a Printf event is set, the program momentarily stops immediately before executing the
command at the location where this event is set, and the value of the variable expression specified in this dialog box is
output to the Output panel.
This dialog box appears only when connected to the debug tool.
Figure A.37 Action Events Dialog Box: [Printf event] Tab
(1)
(2)
(3)
This section describes the following.
- [How to open]
- [Description of each area]
[How to open]
- On the Editor panel, move the caret to the line where you wish to set a Printf event, then select [Register Action
Event...] from the context menu.
- On the Disassemble panel, move the caret to the address where you wish to set a Printf event, then select [Register
Action Event...] from the context menu.
- On the Events panel, select a Printf event, then select [Edit Condition...] from the context menu.
[Description of each area]
(1)
[Output string] area
Type in the string to add to the Output panel directly via the keyboard (up to 1024 characters).
Note that the output string can only be one line (spaces allowed).
(2)
[Variable expression] area
Specify the variable expression(s) for the Printf event.
R20UT3456EJ0100 Rev.1.00
Aug 01, 2015
Page 250 of 281
CS+ V3.02.00
A. WINDOW REFERENCE
Type a variable expression directly into the text box (up to 1024 characters).
You can specify up to 10 variable expressions for a single Printf event by separating them with commas (",").
If this dialog box opens with a variable expression selected in the Editor panel /Disassemble panel, the selected
variable expression appears as the default.
The basic input format that can be specified as variable expressions and the values output by Printf event are as
follows:
Table A.12
Relationship between Variable Expressions and Output Value (Printf Event)
Variable Expression
(3)
Output Value
Variable name of C language
Value of C language variable
Variable expression [Variable expression]
Element of array
Variable expression.Member name
Member of structure/union
Variable expression -> Member name
Member of structure/union that pointer designates
*Variable expression
Value of pointer variable
&Variable expression
Location address
CPU register name
Value of the CPU register
I/O register name
I/O register value
Label nameNote, EQU symbol nameNote and
[immediate address]
Values of label, EQU symbol and immediate address
Note
If the label name or EQU symbol name includes a "$," be sure to enclose the name in "{ }".
Example: {$Label}
Any imaginary number must be multiplied by an uppercase "I" (e.g. 1.0 + 2.0*I). When you specify
the CPU register name "I", add ":REG" (e.g. I:REG) to distinguish it from the keyword "I".
Remark
A symbol name at the current caret position can be complemented by pressing the [Ctrl] + [Space]
key in this text box (see "2.18.2 Symbol name completion function").
[Address] area
Specify the address at which to set the Printf event.
You can either type an address expression directly into the text box (up to 1024 characters), or select them from
the input history via the drop-down list (up to 10 items). The address of the location currently being specified is
displayed by default.
Remark
A symbol name at the current caret position can be complemented by pressing the [Ctrl] + [Space]
key in this text box (see "2.18.2 Symbol name completion function").
Note that the output result format by the Printf event in the Output panel are as follows:
Figure A.38 Output Result Format of Printf Event
Specified-characters Variable-expression-1 = Value-1, Variable-expression-2 = Value-2, ...
Specified characters
Characters specified with [Output string]
Variable expression 1 - 10
Characters specified with [Variable expression]
Value 1 - 10
Value of variable corresponds to " Variable expression 1 - 10 ".
The value is displayed in the default notation (see "Table A.7 Display Format of
Watch-Expressions (Default)") according to the type of the variable (note, however,
that "?" will be displayed if the specified variable expression cannot be obtained).
Moreover, the value in hexadecimal number enclosing with "()" is also displayed (note,
however, that "-" will be displayed if the value cannot be displayed in that notation).
R20UT3456EJ0100 Rev.1.00
Aug 01, 2015
Page 251 of 281
CS+ V3.02.00
A. WINDOW REFERENCE
[State save event] tab
This tab is used to configure how to save and restore the state of the debug tool upon occurrence of an action event.
Note that the data to be restored is limited to memory and register values that can be read or written.
Figure A.39 Action Events Dialog Box: [State save event] Tab
(1)
(2)
(3)
This section describes the following.
- [How to open]
- [Description of each area]
[How to open]
- On the Editor panel, move the caret to the line where you wish to set a State save event, then select [Register Action
Event...] from the context menu.
- On the Disassemble panel, move the caret to the address where you wish to set a State save event, then select [Register Action Event...] from the context menu.
- On the Events panel, select a State save event, then select [Edit Condition...] from the context menu.
[Description of each area]
(1)
[Save debug tool state n] area
When an action event occurs, the state of the debug tool is saved in a file as the n-th data.
(2)
[Restore debug tool state n] area
When an action event occurs, the state of the debug tool is restored from the n-th data file.
(3)
[Address] area
Specify the address at which to set a state save event.
You can either type an address expression directly into the text box (up to 1024 characters), or select them from
the input history via the drop-down list (up to 10 items). The address of the location currently being specified is displayed by default.
R20UT3456EJ0100 Rev.1.00
Aug 01, 2015
Page 252 of 281
CS+ V3.02.00
A. WINDOW REFERENCE
Column Number Settings dialog box
This dialog box is used to set the number of view columns of memory values on the Memory panel.
Figure A.40 Column Number Settings Dialog Box
(1)
[Function buttons]
This section describes the following.
- [How to open]
- [Description of each area]
- [Function buttons]
[How to open]
- On the Memory panel, select [View] >> [Column Number Settings…] from the context menu.
[Description of each area]
(1)
[Column Number] area
Directly enter a decimal value as the number of columns you want to display.
The settable range depends on [Size Notation] currently being set on the Memory panel, as follows:
Size Notation
Settable Range
4 Bits
2 - 512Note
1 Byte
1 - 256
2 Bytes
1 - 128
4 Bytes
1 - 64
8 Bytes
1 - 32
Note
Only an even number is specifiable (if an odd number is specified, then it will be changed to a value
one greater than such odd number).
[Function buttons]
Button
Function
OK
Displays memory values in the specified number of columns.
Cancel
Cancels the settings and closes this dialog box.
Help
Displays the help for this dialog box.
R20UT3456EJ0100 Rev.1.00
Aug 01, 2015
Page 253 of 281
CS+ V3.02.00
A. WINDOW REFERENCE
Address Offset Settings dialog box
This dialog box is used to set an offset value of the start address in the address area on the Memory panel.
Figure A.41 Address Offset Settings Dialog Box
(1)
[Function buttons]
This section describes the following.
- [How to open]
- [Description of each area]
- [Function buttons]
[How to open]
- On the Memory panel, select [View] >> [Address Offset Value Settings...] from the context menu.
[Description of each area]
(1)
[Address Offset Value] area
Directly enter a hexadecimal value as an offset value for the address display.
The settable range depends on the number of bytes of the memory currently being displayed in a line on the Memory panel, as follows:
Settable range:0x0 - ("Set value of [Size Notation]" x "The number of view columns") -1
Example
When "Set value of [Size Notation]" is 1 byte and "The number of view columns" is 16 columns:
Offset Value
Displayed Content of Address Area
0x0 (default)
0000
0010
0020
0x1
0001
0011
0021
0x2
0002
0012
0022
[Function buttons]
Button
Function
OK
Displays memory addresses with the specified offset value.
Cancel
Cancels the settings and closes this dialog box.
Help
Displays the help for this dialog box.
R20UT3456EJ0100 Rev.1.00
Aug 01, 2015
Page 254 of 281
CS+ V3.02.00
A. WINDOW REFERENCE
Memory Initialize dialog box
This dialog box is used to initialize memory (see "2.10.1.6 Modify the memory contents in batch (initialize)").
The memory area in the specified address range is repeatedly overwritten with the specified initial data pattern.
Figure A.42 Memory Initialize Dialog Box
(1)
(2)
[Function buttons]
This section describes the following.
- [How to open]
- [Description of each area]
- [Function buttons]
[How to open]
- On the Memory panel, select [Fill…] from the context menu.
[Description of each area]
(1)
(2)
Range specification area
Specify the range of memory address to initialize via the [Start address/symbol] and [End address/symbol]. You
can either type address expressions directly into the text boxes (up to 1024 characters), or select them from the
input history via the drop-down list (up to 10 items).
The results of calculating the address expressions you have entered are treated as start and end addresses,
respectively.
Note that address values greater than the microcontroller address space cannot be specified.
Caution
You cannot specify the range of address aligned across the different endian area.
Remark
A symbol name at the current caret position can be complemented by pressing the [Ctrl] + [Space]
key in each text box (see "2.18.2 Symbol name completion function").
[Initialize data] area
Specify the initial value(s) with which to overwrite the memory.
You can either type the initial value into the text box directly in hexadecimal number (the value need not start with
"0x"), or select one from the input history via the drop-down list (up to 10 items).
You can specify more than one initial value. Specify up to 16 values of up to 4 bytes (8 characters) each, separated by spaces.
Each initial value is parsed from the end of the string, with each two characters interpreted as a byte.
If the string has an odd number of characters, then the first character is interpreted as one byte.
Note that if a initial value consists of more than one byte, then the target memory is overwritten with the value converted into an array of bytes of the specified address range's endian, as follows:
Input Character Strings
(Initial Value)
How Data is Overwritten (in Bytes)
Little Endian
Big Endian
1
01
01
0 12
00 12
00 12
R20UT3456EJ0100 Rev.1.00
Aug 01, 2015
Page 255 of 281
CS+ V3.02.00
A. WINDOW REFERENCE
Input Character Strings
(Initial Value)
How Data is Overwritten (in Bytes)
Little Endian
Big Endian
00 012 345
00 12 00 45 03
00 00 12 03 45
000 12 000345
00 00 12 45 03 00
00 00 12 00 03 45
[Function buttons]
Button
Function
OK
The memory area in the specified address range is repeatedly overwritten with the specified initial data pattern. If the end address is reached in the middle of the pattern, then
writing ends at that point.
Cancel
Cancels the memory initialization and closes this dialog box.
Help
Displays the help for this dialog box.
R20UT3456EJ0100 Rev.1.00
Aug 01, 2015
Page 256 of 281
CS+ V3.02.00
A. WINDOW REFERENCE
Memory Search dialog box
This dialog box is used to search memory (see "2.10.1.5 Search the memory contents").
Search in either the Memory value area or Character strings area where the caret was located in the Memory panel
immediately before this dialog box opened.
Figure A.43 Memory Search Dialog Box
(1)
(2)
(3)
[Function buttons]
This section describes the following.
- [How to open]
- [Description of each area]
- [Function buttons]
[How to open]
- On the Memory panel, select [Find…] from the context menu.
[Description of each area]
(1)
[Search Data] area
Specify data to search.
You can either type a value directly into the text box (up to 256 bytes), or select one from the input history via the
drop-down list (up to 10 items).
If the search is performed in the Memory value area of the Memory panel, the value must be entered in the same
display format (notation and size) as that area.
If the search is performed in the Character strings area, then the target of the search must be a string. The specified string is converted into the encoding format displayed in that area, and searched for.
If a memory value was selected immediately prior to opening this dialog box, then that value will appear as default.
(2)
[Search Range] area
Select the range to search from the following drop-down list.
(3)
Specify address range
Searches in the address range specified in the [Address] area.
Memory mapping
Searches within the selected memory mapping range.
This list item displays the memory mappings set in the Memory Mapping dialog box.
Display format: <memory type> <address range> <size>
[Address] area
This item is only enabled if [Specify address range] is selected in the [Search Range] area.
Specify the range of memory address to search via the start and end addresses. You can either type address
expressions directly into the text boxes (up to 1024 characters), or select them from the input history via the dropdown list (up to 10 items).
The results of calculating the address expressions you have entered are treated as start and end addresses,
respectively.
Note, however, that the largest address that can be searched is the maximum address of the program space
(0x03FFFFFF) (the mirror area cannot be searched).
R20UT3456EJ0100 Rev.1.00
Aug 01, 2015
Page 257 of 281
CS+ V3.02.00
A. WINDOW REFERENCE
In addition, an address value greater than the value expressed within 32 bits cannot be specified.
Remark 1.
A symbol name at the current caret position can be complemented by pressing the [Ctrl] + [Space]
key in each text box (see "2.18.2 Symbol name completion function").
Remark 2.
If the start address field is left blank, it is treated as if "0x0" were specified.
Remark 3.
If the end address field is left blank, then it is treated as if the maximum value in the microcontroller's address space were specified.
[Function buttons]
Button
Function
Search Backward
Searches upward within the range specified in the [Address] area or the [Search Range]
area. The location found by the search is selected in the Memory panel.
Note that if an illegal value is specified or while the program is being executed, a message
will appear, and the memory search will not be performed.
If focus moves to this dialog box while the memory panel is hidden or another panel has
focus, then this button will be disabled.
Search Forward
Searches downward within the range specified in the [Address] area or the [Search
Range] area. The location found by the search is selected in the Memory panel.
Note that if an illegal value is specified or while the program is being executed, a message
will appear, and the memory search will not be performed.
If focus moves to this dialog box while the memory panel is hidden or another panel has
focus, then this button will be disabled.
Cancel
Cancels the memory search and closes this dialog box.
Help
Displays the help for this dialog box.
R20UT3456EJ0100 Rev.1.00
Aug 01, 2015
Page 258 of 281
CS+ V3.02.00
A. WINDOW REFERENCE
Print Address Range Settings dialog box
This dialog box is used to specify the address range to print the contents of the Disassemble panel.
Figure A.44 Print Address Range Settings Dialog Box
(1)
[Function buttons]
This section describes the following.
- [How to open]
- [Description of each area]
- [Function buttons]
[How to open]
- On the Disassemble panel, select [Print...] from the [File] menu.
[Description of each area]
(1)
Range specification area
Select a range to print from the following option buttons.
(a)
[Current display area] (default)
Prints only the contents of the Disassemble panel currently being displayed.
(b)
[Current selected area]
Prints only the range currently being selected in the Disassemble panel.
Note, however, that this option button will be disabled when nothing is selected in the Disassemble panel.
(c)
[Range of specified]
Specify the range of address to print via [Start address] and [End address]. You can either type address expressions directly into the text boxes (up to 1024 characters), or select them from the input history via the drop-down
list (up to 10 items).
Remark
A symbol name at the current caret position can be complemented by pressing the [Ctrl] +
[Space] key in each text box (see "2.18.2 Symbol name completion function").
[Function buttons]
Button
OK
R20UT3456EJ0100 Rev.1.00
Aug 01, 2015
Function
Closes this dialog box and opens the Windows dialog box to print the contents of
the specified range of the Disassemble panel.
Page 259 of 281
CS+ V3.02.00
A. WINDOW REFERENCE
Button
Function
Cancel
Cancels the range specification and closes this dialog box.
Help
Displays the help for this dialog box.
R20UT3456EJ0100 Rev.1.00
Aug 01, 2015
Page 260 of 281
CS+ V3.02.00
A. WINDOW REFERENCE
Trace Search dialog box
This dialog box is used to search for trace data (see "2.12.8 Search the trace data").
The search can be performed at the instruction or source level.
Figure A.45 Trace Search Dialog Box
(1)
(2)
[Function
buttons]
This section describes the following.
- [How to open]
- [Description of each area]
- [Function buttons]
[How to open]
- On the Trace panel, select
button on the toolbar.
- On the Trace panel, select [Find…] from the context menu.
[Description of each area]
(1)
Tab selection area
Select a tab to switch the level of the search.
This dialog box has the following two tabs.
- [Instruction Level] tab
- [Source Level] tab
(2)
Search parameter setup area
Use this area to configure detailed search parameters.
R20UT3456EJ0100 Rev.1.00
Aug 01, 2015
Page 261 of 281
CS+ V3.02.00
A. WINDOW REFERENCE
For details on the window elements and how to configure the parameters for a particular tab, see the section for
the tab in question.
[Function buttons]
Button
Function
Search Backward
Searches upward (in the direction of larger to smaller numbers) within the specified range.
Search matches are selected in the Trace panel.
Note that if an illegal value is specified or while the program is being executed, a message
will appear, and the trace data search will not be performed.
If focus moves to this dialog box while the Trace panel is hidden or another panel has
focus, then this button will be disabled.
Search Forward
Searches forward (in the direction of smaller to larger numbers) within the specified range.
Search matches are selected in the Trace panel.
Note that if an illegal value is specified or while the program is being executed, a message
will appear, and the trace data search will not be performed.
If focus moves to this dialog box while the Trace panel is hidden or another panel has
focus, then this button will be disabled.
Cancel
Cancels the trace data search and closes this dialog box.
Help
Displays the help for this dialog box.
R20UT3456EJ0100 Rev.1.00
Aug 01, 2015
Page 262 of 281
CS+ V3.02.00
A. WINDOW REFERENCE
[Instruction Level] tab
This tab is used to search for the acquired trace data at the instruction level.
Caution
If the Trace panel is set to Source display mode, then performing an instruction level search via this tab
will not perform the target search correctly. In order to perform an instruction level search, set the mode
to Mixed display mode or Disassemble display mode.
Figure A.46 Trace Search Dialog Box: [Instruction Level] Tab
(1)
(2)
This section describes the following.
- [How to open]
- [Description of each area]
[How to open]
- On the Trace panel, select
button on the toolbar.
- On the Trace panel, select [Find…] from the context menu.
[Description of each area]
(1)
(a)
[Search condition] area
[Fetch Address]
Specify the fetch address if it is a required search parameter.
You can either type address expressions directly into the text boxes, or select them from the input history via the
drop-down lists (up to 10 items).
The fetch address can also be specified as a range. In this case, specify a range by specifying address expressions in both the left and right text boxes.
If the right-hand text box is blank or contains the text [(Input value when range is specified)], then the fixed
address specified in the left-hand text box will be searched.
R20UT3456EJ0100 Rev.1.00
Aug 01, 2015
Page 263 of 281
CS+ V3.02.00
A. WINDOW REFERENCE
Note that if an address value greater than the microcontroller address space is specified, the upper address
value is masked.
In addition, an address value greater than the value expressed within 32 bits cannot be specified.
(b)
[Mnemonic]
Specify the mnemonic if it is a required search parameter.
The specified character strings in this area are searched within the [Source/Disassemble] area of the Trace
panel.
You can either type a mnemonic directly into the text boxes, or select one from the input history via the dropdown list (up to 10 items).
Searches are case-insensitive, and partial matches are also allowed.
(c)
[Access Address]
Specify the access address if it is a required search parameter.
You can either type address expressions directly into the text boxes, or select them from the input history via the
drop-down lists (up to 10 items).
The access address can also be specified as a range. In this case, specify a range by specifying address
expressions in both the left and right text boxes.
If the right-hand text box is blank or contains the text [(Input value when range is specified)], then the fixed
address specified in the left-hand text box will be searched.
Note that if an address value greater than the microcontroller address space is specified, the upper address
value is masked.
In addition, an address value greater than the value expressed within 32 bits cannot be specified.
(d)
[Access Status]
This item is only enabled if a value for [Access Address] is specified.
Select the access type from the following drop-down list.
(e)
(2)
(a)
(No Specification)
Does not limit access types.
Read/Write
Searches the location where a read or write access occurred.
Read
Searches the location where a read access occurred.
Write
Searches the location where a write access occurred.
Vector Read
Searches the location where a vector read access occurred.
DMA
This item is invalid.
[Data]
This item is only enabled if a value for [Access Address] is specified.
Specify the access data.
You can either type the data directly into the text boxes (in hexadecimal number), or select it from the input history via the drop-down list (up to 10 items).
The data can also be specified as a range. In this case, specify a range by specifying data in both the left and
right text boxes.
If the right-hand text box is blank or contains the text [(Input value when range is specified)], then the fixed data
specified in the left-hand text box will be searched.
[Search range] area
[Number]
Specify the range within the trace data to search via the number displayed in the [Number] area of the Trace
panel.
Specify the starting number in the left text box, and the ending number in the right text box ("0" to "last number"
are specified by default).
You can either type the numbers directly into the text boxes (in base-10 format), or select them from the input
history via the drop-down lists (up to 10 items).
If the left-hand text box is left blank, it is treated as if "0" were specified.
If the right-hand text box is left blank, it is treated as if the last number were specified.
R20UT3456EJ0100 Rev.1.00
Aug 01, 2015
Page 264 of 281
CS+ V3.02.00
A. WINDOW REFERENCE
[Source Level] tab
This tab is used to search for the acquired trace data at the source level.
Caution
If the Trace panel is set to Disassemble display mode, then performing an source level search via this tab
will not perform the target search correctly. In order to perform an source level search, set the mode to
Mixed display mode or Source display mode.
Figure A.47 Trace Search Dialog Box: [Source Level] Tab
(1)
(2)
(3)
This section describes the following.
- [How to open]
- [Description of each area]
[How to open]
- On the Trace panel, select
button on the toolbar.
- On the Trace panel, select [Find…] from the context menu.
[Description of each area]
(1)
[Search object] area
Select the search object from the following option buttons.
The execution part is retrieved specifying the source line
Finds the execution location in the specified source line (default).
Only [Source and Line] will be enabled as a search parameter.
The execution part is retrieved specifying the function
Finds the execution location in the specified function.
Only [Function Name] will be enabled as a search parameter.
R20UT3456EJ0100 Rev.1.00
Aug 01, 2015
Page 265 of 281
CS+ V3.02.00
A. WINDOW REFERENCE
The execution part is retrieved specifying the global variable
(2)
(a)
Finds the location at which the specified global variable was
accessed.
Only [Variable Name], [Kind] and [Value] will be enabled as a search
parameters.
[Search condition] area
[Source and Line]
This item is only enabled if [The execution part is retrieved specifying the source line] is selected.
The specified character strings in this area are searched within the [Line Number/Address] area of the Trace
panel.
You can either type the character strings of the source line to be find directly into the text box, or select them
from the input history via the drop-down list (up to 10 items).
Searches are case-insensitive, and only complete matches are retrieved.
Example 1.
main.c#40
Example 2.
main.c
Example 3.
main
(b)
[Function Name]
This item is only enabled if [The execution part is retrieved specifying the function] is selected.
You can either type the function name to be find directly into the text box, or select it from the input history via
the drop-down list (up to 10 items).
Searches are case-insensitive, and only complete matches are retrieved.
(c)
[Variable Name]
This item is only enabled if [The execution part is retrieved specifying the global variable] is selected.
You can either type the variable name to be find directly into the text box, or select it from the input history via
the drop-down list (up to 10 items).
Searches are case-insensitive, and only complete matches are retrieved.
(d)
[Kind]
This item is only enabled if [The execution part is retrieved specifying the global variable] is selected.
Select the access type ([Reference/Substitution], [Reference], or [Substitution]) from the drop-down list.
(e)
[Value]
This item is only enabled if [The execution part is retrieved specifying the global variable] is selected.
Specify the accessed variable value in hexadecimal number.
You can either type a variable value directly into the text box, or select one from the input history via the dropdown list (up to 10 items).
The variable value can also be specified as a range. In this case, specify a range by specifying variable values
in both the left and right text boxes.
If the right-hand text box is blank, then access locations with the fixed variable values specified in the left-hand
text box will be searched for.
(3)
(a)
[Search range] area
[Number]
Specify the range within the trace data to search via the number displayed in the [Number] area of the Trace
panel.
Specify the starting number in the left text box, and the ending number in the right text box ("0" to "last number"
are specified by default).
You can either type the numbers directly into the text boxes (in base-10 format), or select them from the input
history via the drop-down lists (up to 10 items).
If the left-hand text box is left blank, it is treated as if "0" were specified.
If the right-hand text box is left blank, it is treated as if the last number were specified.
R20UT3456EJ0100 Rev.1.00
Aug 01, 2015
Page 266 of 281
CS+ V3.02.00
A. WINDOW REFERENCE
Detailed Settings of Point Trace dialog box [Full-spec emulator][E1][E20]
This dialog box is used to display and change the detailed information on the point trace event selected on the Events
panel. For details on point trace event setting, see "2.12 Collect Execution History of Programs".
Figure A.48 Detailed Settings of Point Trace Dialog Box [Full-spec emulator][E1][E20]
[Toolbar]
(1)
(2)
[Function buttons]
This section describes the following.
- [How to open]
- [Description of each area]
- [Toolbar]
- [Description of each category]
- [Function buttons]
[How to open]
- On the Events panel, move the caret to the point trace event of which you wish to change the detailed information,
then select [Edit Condition...] from the context menu.
[Description of each area]
(1)
Detailed information display/change area
In this area, detailed information on the point trace event selected in the Events panel is displayed by category in
the list. Also, you can directly change its settings.
(2)
Property description area
In this area, brief description of the categories and properties selected in the detailed information display/change
area is displayed.
R20UT3456EJ0100 Rev.1.00
Aug 01, 2015
Page 267 of 281
CS+ V3.02.00
A. WINDOW REFERENCE
[Toolbar]
Displays categories in the detailed information display/change area.
Hides categories in the detailed information display/change area and rearranges
only property items in the ascending order.
[Description of each category]
(1)
[Address condition]
You can display and modify the address condition of the point trace.
Start address
End address
(2)
Specify the start address.
Default
The current set value
Modifying
Directly enter from the keyboard.
Available
values
Address expression within the valid range
Specify the end address.
Default
The current set value
Modifying
Directly enter from the keyboard.
Available
values
Address expression within the valid range
[Target]
You can display and modify the target of the point trace.
Event target
Specify the target of the point trace.
Default
CPU
Modifying
Select from the drop-down list.
Available
values
One of the following as selected from the drop-down list.
CPU, Global RAM
[Function buttons]
Button
Function
OK
Applies the detailed settings specified in the dialog box to the timer event and
closes this dialog box.
Cancel
Nullifies settings and closes this dialog box.
Help
Displays the help for this dialog box.
R20UT3456EJ0100 Rev.1.00
Aug 01, 2015
Page 268 of 281
CS+ V3.02.00
A. WINDOW REFERENCE
Detailed Settings of Timer Measurement dialog box [Full-spec emulator][E1][E20]
This dialog box is used to display and change the detailed information on the timer event selected on the Events panel.
Note that you cannot edit the address value of the timer event in this dialog box. If you need to edit the address value, first
delete the timer event and then create a new one. For details on timer event setting, see "2.13 Measure Execution Time
of Programs".
Figure A.49 Detailed Settings of Timer Measurement Dialog Box [Full-spec emulator][E1][E20]
[Toolbar]
(1)
(2)
[Function buttons]
This section describes the following.
- [How to open]
- [Description of each area]
- [Toolbar]
- [Description of each category]
- [Function buttons]
[How to open]
- On the Events panel, move the caret to the timer event of which you wish to change the detailed information, then
select [Edit Condition ...] from the context menu.
[Description of each area]
(1)
Detailed information display/change area
In this area, detailed information on the timer event selected in the Events panel is displayed by category in the
list. Also, you can directly change its settings.
R20UT3456EJ0100 Rev.1.00
Aug 01, 2015
Page 269 of 281
CS+ V3.02.00
(2)
A. WINDOW REFERENCE
Property description area
In this area, brief description of the categories and properties selected in the detailed information display/change
area is displayed.
[Toolbar]
Displays categories in the detailed information display/change area.
Hides categories in the detailed information display/change area and rearranges
only property items in the ascending order.
[Description of each category]
(1)
[Measurement Setting]
You can display and modify the detailed settings on timer measurement.
Measurement item
Specify the measurement item.
Default
Total Count
Modifying
Select from the drop-down list.
Available
values
One of the following as selected from the drop-down list.
Total Count, Max Count, Min Count, Pass Count
[Function buttons]
Button
Function
OK
Applies the detailed settings specified in the dialog box to the timer event and
closes this dialog box.
Cancel
Nullifies settings and closes this dialog box.
Help
Displays the help for this dialog box.
R20UT3456EJ0100 Rev.1.00
Aug 01, 2015
Page 270 of 281
CS+ V3.02.00
A. WINDOW REFERENCE
Scroll Range Settings dialog box
This dialog box is used to set the scroll range of the vertical scroll bar on the Memory panel/Disassemble panel.
By setting the appropriate range, it is possible to improve the operability of a mouse (e.g. dragging) because the size of
the vertical scroll bar on the panel is changed suitably.
Caution
After setting a scroll range via this dialog box, the scroll range is not updated automatically even if the
address evaluated by the address expression is changed because of such as a line assembly.
Remark
It is possible to move outside the scroll range by using the [Page Up]/[Page Down]/[Up]/[Down] key, a
button at either end of the scroll bar or a menu item related to the jump function.
Figure A.50 Scroll Range Setting Dialog Box
(1)
(2)
[Function buttons]
This section describes the following.
- [How to open]
- [Description of each area]
- [Function buttons]
[How to open]
- On the Memory panel, click the
button from [View] on the toolbar.
- On the Memory panel, select the [View] menu >> [Settings Scroll Range...] from the context menu.
- On the Disassemble panel, click the
button from [View] on the toolbar.
- On the Disassemble panel, select the [View] menu >> [Settings Scroll Range...] from the context menu.
[Description of each area]
(1)
[Start address] area
Specify the start address of the range of scrolling.
You can either type an address expression directly into the text box (up to 1024 characters), or select it from the
input history via the drop-down list (up to 10 items).
Note that the setting of the scroll range is not performed if "All" is selected in the drop-down list at this time (the
scroll range is not limited).
Remark
(2)
A symbol name at the current caret position can be complemented by pressing the [Ctrl] + [Space]
key in this text box (see "2.18.2 Symbol name completion function").
[End address] area
Specify the end address of the range of scrolling.
You can either type an address expression directly into the text box (up to 1024 characters), or select it from the
input history via the drop-down list (up to 10 items).
Note that this area becomes invalid if [Start address] is specified with [All].
Remark
A symbol name at the current caret position can be complemented by pressing the [Ctrl] + [Space]
key in this text box (see "2.18.2 Symbol name completion function").
R20UT3456EJ0100 Rev.1.00
Aug 01, 2015
Page 271 of 281
CS+ V3.02.00
A. WINDOW REFERENCE
[Function buttons]
Button
Function
OK
Sets the specified scroll range for the target panel.
Moves the caret to the start address, from the beginning of the area displayed in
the target panel.
Cancel
Cancels the jump and closes this dialog box.
Help
Displays the help for this dialog box.
R20UT3456EJ0100 Rev.1.00
Aug 01, 2015
Page 272 of 281
CS+ V3.02.00
A. WINDOW REFERENCE
Go to the Location dialog box
This dialog box is used to move the caret to a specified position.
Figure A.51 Go to the Location Dialog Box
(1)
[Function buttons]
This section describes the following.
- [How to open]
- [Description of each area]
- [Function buttons]
[How to open]
- Focus the Disassemble panel, and then select [Go to…] from the [Edit] menu.
- Focus the IOR panel, and then select [Go to…] from the [Edit] menu.
- On the Disassemble panel, select [Go to…] from the context menu.
- On the IOR panel, select [Go to…] from the context menu.
[Description of each area]
(1)
[Address/Symbol], or [IOR] area
Specify the location to which the caret jumps.
You can either type a location directly into the text box (up to 1024 characters), or select one from the input history
via the drop-down list (up to 10 items).
The data to specify various depending on the target panel, as follows:
Target Panel
Data Specified
Disassemble panel
Address expression
IOR panel
I/O register name
Remark
If this dialog box is opened from the Disassemble panel, a symbol name at the current caret
position can be complemented by pressing the [Ctrl] + [Space] key in this text box (see "2.18.2
Symbol name completion function").
[Function buttons]
Button
Function
OK
Moves the caret to the specified location, from the beginning of the area displayed in the target panel.
Cancel
Cancels the jump and closes this dialog box.
Help
Displays the help for this dialog box.
R20UT3456EJ0100 Rev.1.00
Aug 01, 2015
Page 273 of 281
CS+ V3.02.00
A. WINDOW REFERENCE
Data Save dialog box
This dialog box is used to save data displayed in the Disassemble panel, Memory panel, or Trace panel, and save
uploaded data (see "2.5.3 Execute uploading").
This dialog box appears only when connected to the debug tool.
Figure A.52 Data Save Dialog Box
(1)
(2)
(3)
[Function buttons]
This section describes the following.
- [How to open]
- [Description of each area]
- [Function buttons]
[How to open]
- With the Disassemble panel in focus, select [Save Disassemble Data As…] form the [File] menu.
- With the Memory panel in focus, select [Save Memory Data As…] form the [File] menu.
- With the Trace panel in focus, select [Save Trace Data As…] form the [File] menu.
- From the [Debug] menu, select [Upload…].
[Description of each area]
(1)
[File Name] area
Specify the name of the file to save.
You can either type a filename directly into the text box (up to 259 characters), or select one from the input history
via the drop-down list (up to 10 items).
You can also specify the file by clicking the […] button, and selecting a file via the Select Data Save File dialog
box.
(2)
[File Type] area
Select the format in which to save the file from the following drop-down list.
The available file formats will differ as follows depending on the type of data being saved.
(a)
When saving the displayed content of a panel
Text files (*.txt)
Text format (default)
CSV (Comma-Separated Variables) (*.csv)
CSV formatNote
Note
The data is saved with entries separated by commas (,).
If the data contains commas, each entry is surrounded by double quotes ("") in order to avoid illegal formatting.
R20UT3456EJ0100 Rev.1.00
Aug 01, 2015
Page 274 of 281
CS+ V3.02.00
(b)
A. WINDOW REFERENCE
When saving upload data
Intel HEX format (*.hex)
Intel HEX file format
Motorola S-record (*.mot)
Motorola S-record file format
Binary data (*.bin)
Binary file format
Remark
(3)
See "2.5.3 Execute uploading" for details on uploading.
[Save Range xxx] area
Specify the range of data to save.
You can either type ranges directly into the text boxes, or select them from the input history via the drop-down lists
(up to 10 items).
The method of specifying the ranges will differ as follows depending on the type of data to be saved.
Type of Data
Description
Disassemble panel
Specify the range of addresses to save via the start and end addresses.
Ranges can be entered as base-16 numbers or as address expressions.
When a range is selected in the panel, that range is specified by default.
When there is no selection, then the range currently visible in the panel is specified.
Memory panel
Specify the range of memory to save via the start and end addresses.
Ranges can be entered as base-16 numbers or as address expressions.
When a range is selected in the panel, that range is specified by default.
When there is no selection, then the range currently visible in the panel is specified.
Trace panel
- Specifying a range to save
Specify the trace range to save via the start and end trace numbersNote.
Ranges can only be entered as base-10 numbers.
- Saving all trace data
From the drop-down list to the left, select [All Trace Data]. The text box to the
right is disabled. All currently acquired trace data will be saved.
The range currently visible in the panel is specified by default.
Upload data
Specify the range of memory to save via the start and end addresses.
Ranges can be entered as base-16 numbers or as address expressions.
Note
These are the numbers shown in the [Number] area of the Trace panel.
Remark
A symbol name at the current caret position can be complemented by pressing the [Ctrl] + [Space]
key in each text box (see "2.18.2 Symbol name completion function").
[Function buttons]
Button
Function
Save
Saves the data to a file with the specified filename, in the specified format.
Cancel
Cancels the save and closes this dialog box.
Help
Displays the help for this dialog box.
R20UT3456EJ0100 Rev.1.00
Aug 01, 2015
Page 275 of 281
CS+ V3.02.00
A. WINDOW REFERENCE
Specified Section dialog box
This dialog box is used to specify the range for skipping step execution.
Figure A.53 Specified Section Dialog Box
(2)
(1)
[Function buttons]
This section describes the following.
- [How to open]
- [Description of each area]
- [Function buttons]
[How to open]
- On the [Debug Tool Settings] tab of the Property panel, click the [...] button displayed by selecting the [Target section]
property in the [Step function] category.
[Description of each area]
(1)
[Specified section list] area
(a)
List display
This area is used to display the list of the range for skipping step execution.
To add a new section, click the [Add] button in this area, then in the [Specified section property] area, specify the
sections to add.
(b)
Button
Button
Up
Function
Moves the selected section up one row in the list.
Clicking this for the top section in the list has no effect.
R20UT3456EJ0100 Rev.1.00
Aug 01, 2015
Page 276 of 281
CS+ V3.02.00
A. WINDOW REFERENCE
Button
(2)
Function
Down
Moves the selected section down one row in the list.
Clicking this for the bottom section in the list has no effect.
Add
Adds an empty item "-" to the list, and selects it.
Specify the section to add in the [Specified section property] area.
Remove
Removes the selected section from the list.
[Specified section property] area
(a)
[Select section]
This area is used to display or edit the section selected in the [Specified section list] area.
It can also be used to specify the new sections added via the [Add] button.
Section select
type
Specify the method for specifying the section.
Section name
Default
Section name
Modifying
Select from the drop-down list.
Available values
Section name
Specifies the range by the section name.
Start and end
address
Specifies the range by the start and end address.
Specify the section name.
Note that this item appears only when [Section select type] is set to [Section name].
Modifying
Start address
Directly enter from the keyboard.
Specify the start address.
Note that this item appears only when [Start and end address] is set to [Section name].
Modifying
End address
Directly enter from the keyboard.
Specify the end address.
Note that this item appears only when [Start and end address] is set to [Section name].
Modifying
Directly enter from the keyboard.
[Function buttons]
Button
Function
OK
Finishes configuring the target sections, and closes this dialog box.
Cancel
Cancels any changes to the target sections, and closes this dialog box.
Help
Displays the help for this dialog box.
R20UT3456EJ0100 Rev.1.00
Aug 01, 2015
Page 277 of 281
Revision Record
Rev.
Date
Description
Page
1.00
Aug 01, 2015
-
Summary
First Edition issued
CS+ V3.02.00 User's Manual:
RH850 Debug Tool
Publication Date:
Published by:
Rev.1.00
Aug 01, 2015
Renesas Electronics Corporation
http://www.renesas.com
SALES OFFICES
Refer to "http://www.renesas.com/" for the latest and detailed information.
Renesas Electronics America Inc.
2801 Scott Boulevard Santa Clara, CA 95050-2549, U.S.A.
Tel: +1-408-588-6000, Fax: +1-408-588-6130
Renesas Electronics Canada Limited
9251 Yonge Street, Suite 8309 Richmond Hill, Ontario Canada L4C 9T3
Tel: +1-905-237-2004
Renesas Electronics Europe Limited
Dukes Meadow, Millboard Road, Bourne End, Buckinghamshire, SL8 5FH, U.K
Tel: +44-1628-585-100, Fax: +44-1628-585-900
Renesas Electronics Europe GmbH
Arcadiastrasse 10, 40472 Düsseldorf, Germany
Tel: +49-211-6503-0, Fax: +49-211-6503-1327
Renesas Electronics (China) Co., Ltd.
Room 1709, Quantum Plaza, No.27 ZhiChunLu Haidian District, Beijing 100191, P.R.China
Tel: +86-10-8235-1155, Fax: +86-10-8235-7679
Renesas Electronics (Shanghai) Co., Ltd.
Unit 301, Tower A, Central Towers, 555 Langao Road, Putuo District, Shanghai, P. R. China 200333
Tel: +86-21-2226-0888, Fax: +86-21-2226-0999
Renesas Electronics Hong Kong Limited
Unit 1601-1611, 16/F., Tower 2, Grand Century Place, 193 Prince Edward Road West, Mongkok, Kowloon, Hong Kong
Tel: +852-2265-6688, Fax: +852 2886-9022
Renesas Electronics Taiwan Co., Ltd.
13F, No. 363, Fu Shing North Road, Taipei 10543, Taiwan
Tel: +886-2-8175-9600, Fax: +886 2-8175-9670
Renesas Electronics Singapore Pte. Ltd.
80 Bendemeer Road, Unit #06-02 Hyflux Innovation Centre, Singapore 339949
Tel: +65-6213-0200, Fax: +65-6213-0300
Renesas Electronics Malaysia Sdn.Bhd.
Unit 1207, Block B, Menara Amcorp, Amcorp Trade Centre, No. 18, Jln Persiaran Barat, 46050 Petaling Jaya, Selangor Darul Ehsan, Malaysia
Tel: +60-3-7955-9390, Fax: +60-3-7955-9510
Renesas Electronics India Pvt. Ltd.
No.777C, 100 Feet Road, HALII Stage, Indiranagar, Bangalore, India
Tel: +91-80-67208700, Fax: +91-80-67208777
Renesas Electronics Korea Co., Ltd.
12F., 234 Teheran-ro, Gangnam-Gu, Seoul, 135-080, Korea
Tel: +82-2-558-3737, Fax: +82-2-558-5141
© 2015 Renesas Electronics Corporation. All rights reserved.
Colophon 4.0
CS+ V3.02.00
R20UT3456EJ0100