1
USING ANALYTICS IN THE GAME PROTOTYPING PROCESS
TIMEA TABORI
UNIVERSITY OF ABERTAY DUNDEE
INSTITUTE OF ARTS, MEDIA AND COMPUTER GAMES
M AY 2013
University of Abertay Dundee
Permission to copy
Author:
Timea Tabori
Title:
Using Analytics in the Game Prototyping Process
Degree:
BSc. (Hons) Computer Games Technology
Year:
2013
I certify that the above mentioned project is my original work.
I agree that this dissertation may be reproduced, stored or transmitted, in any form
and by any means without the written consent of the undersigned.
Signature
......................................................................................
Date
..........................................................
ii
iii
ACKNOWLEDGEMENTS
I would like to take this opportunity to acknowledge the following people for their
support
and
guidance
throughout
the
undertaking
of
this
project.
I would like to thank my supervisor Iain Donald for his indispensible help and advice
during the course of this project.
I would also like to thank my friends and family for their ongoing support and
constructive input throughout the year.
Finally, I would like to thank everyone who took part in the evaluation process and
user test sessions for their invaluable insight and suggestions regarding the
development of the project.
iv
ABSTRACT
With the continuously expanding demographic attracted by games, developers
experience growing pressure to create content that is widely accessible and wellbalanced for a range of different users with varying skills, whilst maintaining
development budgets. In order to meet this challenge, development is expected to be
fast and flawless. To help developers satisfy this demand, this project carries out an
investigation into the relationship of game prototyping and telemetry, and their effects
on one-another.
The project examines the current trends in game telemetry and aims to implement a
design tool combining simple level creation and editing functionality with data
collection and visualisation features concentrating on improving the design of the
level created. The level editor is directed primarily at designing 2D platformer games,
because of their universality, popularity and simple core mechanics. During its
implementation, user experience design concepts were explored and applied to create
a user interface and flow suitable for a target audience of mainly game designers. A
number of metrics were selected through user test sessions, focusing on key
information for discovering design flaws or imbalances in the game. A simple API,
serving as a proof of concept alongside the level editor collects and visualises these
metrics collected during play sessions so that the user gains a deeper understanding of
how players experience their creations.
User testing throughout the project investigated the utility of game analytics at an
early stage of development with a specific focus on its role in level design and
balancing. The test sessions conducted with the help of game developers from
different disciplines and backgrounds revealed a great perceived utility associated
with the project. A number of user interface improvements and additional features
were suggested, which highlighted interest in the design tool proposed and suggested
v
that the combination of game analytics and early stage game prototyping is indeed a
viable solution to achieve better level design.
Keywords: data visualisation, game balancing, game prototyping, game telemetry,
level design, level editor, visual analytics
vi
TABLE OF CONTENTS
INTRODUCTION ......................................................................................................1
BACKGROUND AND LITERATURE REVIEW ......................................................3
METHODOLOGY ................................................................................................... 12
Objectives ............................................................................................................. 12
RESULTS ................................................................................................................ 18
DISCUSSION ..........................................................................................................21
CONCLUSION AND FUTURE WORK .................................................................. 24
APPENDICES ..........................................................................................................29
APPENDIX A User Manual ..................................................................................... 30
APPENDIX B Accompanying CD ............................................................................ 33
APPENDIX C User Test 1 Protocol ..........................................................................34
APPENDIX D User Test 1 Results ...........................................................................37
APPENDIX E User Test 2 Protocol ..........................................................................40
APPENDIX F User Test 2 Results ............................................................................ 41
APPENDIX G API Plans .......................................................................................... 42
REFERENCES ......................................................................................................... 47
BIBLIOGRAPHY .................................................................................................... 51
vii
LIST OF FIGURES
Figure 1: Analysing a game system step-by-step
Figure 2: Phases of the Knowledge Discovery System adapted to game analytics
Figure 3: Various data visualisation suggestions representing player death
Figure 4: Project development methodology flow chart
Figure 5: Application User interface in Editing (left) and Analytics mode (right)
Figure 6: Data overlay exported from editor for collaboration purposes.
viii
ix
INTRODUCTION
With their universal appeal, games are gaining increasingly diverse audiences, and the
market is continually expanding. Demographic groups previously alien to them, now
provide the biggest market for some games, together with new mechanics, platforms
and business models. This poses a set of challenges to developers, who now need to
cater for vastly different play styles, skill levels and budgets often simultaneously. In
doing so, evaluating user experience and balancing the game becomes increasingly
important.
Level design is a fundamental part of most games’ design. Creating levels is often an
iterative process of continuous testing and tweaking to make sure it’s enjoyable and
challenging enough for players with widely differing proficiency and expectations.
This iterative process usually relies on verbal feedback only, if any at all, regarding
the flow of the level, there is rarely any objective data involved. Recording key events
and information during test sessions can reveal problems and opportunities that would
otherwise go unnoticed.
While the concept of game telemetry and analytics exists and many companies rely on
it to help improve their titles, it is often not utilised until after the game has been
released to the public. This approach is therefore more reactive, trying to determine
influential trends or balance issues after production is complete. This has some
advantages such as the vast amount of data generated from the play sessions of every
player, which is excellent for finding patterns and information hidden beneath the
surface. However if a major flaw or underlining design problem arises, it can be very
costly to fix, if at all possible. Instead, a more proactive solution is proposed where the
gameplay analytics are packaged with the prototyping and design tools, allowing for
data collection to be carried out during the conceptualisation phase, before finalising
the design during production. This has the potential to reduce costs and increase the
quality of the final product.
1
Research carried out in the area is summarised in the Background and Literature
Review section of the Dissertation.
Based on the above, the project’s primary research question is:
What are the effects of integrating the collection and visualisation of game analytics
into a game prototyping tool to facilitate early game balancing and quick iteration
of level design ideas?
In order to answer the above question the following objectives were identified:
Develop a simple game level editor including basic platformer elements. Focus
on the user experience and usability of the tool by directed user testing to
ensure crucial features are implemented.
Identify the metrics to be logged, most useful for level designers, together with
the most appropriate visualisation techniques for each.
Create a simple API responsible for recording the list of metrics determined as
well as calculating and rendering the visualisation overlays using the data
collected.
Through a set of user tests, evaluate whether the analytics tool succeeds in
highlighting design flaws early on in development while assessing its usability.
Finally, analyse the effect of combining prototyping, design tools and visual
gameplay metrics in a single editor. Examine the availability and need for such
a solution.
For the purposes of this project, a simple two-dimensional level editor, aimed mostly
at the creation of platformer games, was created. The platformer genre was chosen for
its popular yet simple core mechanics and universal appeal that satisfy the main
objectives of the research carried out. On top of the editor, a small, basic API is
responsible for the collection of player data, the creation of various game metrics and
the visualisation of this information.
The development process is detailed in the Methodology section with findings based
on test sessions and conclusions drawn can be found in the Results and Discussion
sections respectively.
2
BACKGROUND AND LITERATURE REVIEW
Computer games have developed considerably since their creation some 40 years ago.
They have grown from a predominantly niche pastime for children, to an experience
embraced by a much wider audience and an industry larger than Hollywood. Today’s
games offer photo-realistic 3D graphics, vast open worlds and new, revolutionary
ways of interacting with virtual environments. With these vast technological
advancements, the focus has shifted from improving realism to adding deeper levels
of immersion and making games available and accessible to a wider audience. This
means that games now have to satisfy many different types of gamers. From hard-core
players, who grew up playing games, are very comfortable with the way games work
and who are looking for challenging fun, to the new wave of gamers who are new to
this medium and prefer a more casual experience. According to Richard Bartle’s
character theory on gamer psychology, people enjoy playing in a number of different
ways (Bartle, 1996), but whether interacting with players or acting on the world, one
thing all players across the spectrum want is deeper, more immersive experiences.
Immersion in games is best described by what psychologists call “spatial presence”
which exists when “media contents are perceived as real”, such as gamers feel
spatially located in the game environment (Madigan, 2010). According to Wirth’s
theory (Wirth et al., 2007) this happens in three steps:
First, the player forms a representation of the game world in their mind, based
on visual and audio cues in the game, combined with any assumptions they
might have about the game and its world.
The player begins to favour this game world as their primary ego reference
frame (point of reference for “themselves” and where they “are”)
Spatial presence (immersion) is created.
3
Some important factors are needed in order to create and maintain immersion. The
game itself should contribute to creating a rich mental model of its environments by
using multiple channels of sensory information (e.g. audio cues supporting visual
events), involving a strong, interesting plot, and making sure there are no large gaps in
the mental model. Consistency is just as important for maintaining immersion, as
providing a rich background is for creating it.
It quickly becomes evident that complex, immersive experiences have to be designed
from the ground up; it’s not something that can be easily added onto the project at the
end of development. Therefore it’s key to focus on the natural flow and balance of a
design from the start. Design is “the process by which a designer creates a context to
be encountered by a participant, from which meaning emerges” (Salen and
Zimmerman, 2004) and level design in particular plays a great role in establishing
spatial presence as discussed above. A well designed level or game map is a powerful
tool in the developer’s repertoire that allows them to manipulate what the player
thinks or does by influencing where they look while maintaining the player’s sense of
control and thus, immersion. (Schell, 2008). However achieving this requires
balancing and just like the fun factor of the core mechanics, level design has to be
prototyped, assessed and iterated upon as well. This process can be greatly enhanced
by design tools, such as level editors that enable developers to create and edit levels
faster and with easier.
Prototyping is the “approximation of a system and its components in some form for a
definite purpose in its implementation” (Chua et al., 2003). It is a process of taking a
complex and often incomplete idea, and simplifying it until only the core, most
important aspects remain. This way all attention can be focused on perfecting the base
that the rest will be built on. When prototyping games this can mean anything from
using simple primitives to block out the level (e.g. BSP Brushes in the UDK),
dropping a dimension for simplicity (e.g. 2D prototypes) or going straight back to pen
and paper to create a greatly simplified but potentially powerful proof of concept
paper prototype.
Another type of design tools that prove to be very useful in game development is
game telemetry tools. Game telemetry is the collection of game development or
research data that is operationalised - turned into game metrics, interpretable,
4
quantitative measures of attributes of objects, extracted from raw telemetry data
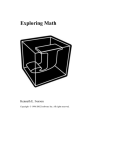
(Drachen, 2012). Games are often considered to be a “collection of interlocked
systems” (Salen and Zimmerman 2003). A game variable tracks any change in the
game systems as a result of a player interacting with the system or game (Canossa,
2013).
Figure 1: Analysing a game system step-by-step (Drachen et al. 2013 p. 265)
Quoting the trailer for the game Watch Dogs: ”You are no longer an individual, you
are a data cluster bound to a vast global network” (Ubisoft, 2012). This quote
describes well how users are seen during data analysis – clusters of data containing
attributes of a certain object, which is in turn connected to the larger network formed
by the game and its community. The main goal of games is to deliver specific user
experiences, and the ability to analyse user interaction proves to be the best source of
information for determining the success of a game’s design delivering an engaging
experience (Medlock et al. 2002; Nacke and Drachen, 2011).
Data collected can be categorised into three types: user or player metrics, performance
metrics and process metrics (Mellon, 2009). While the latter two focus on the
performance of the software infrastructure behind games, or the actual process of
5
game development respectively, player metrics generally focus on the way people
interact with the game system, its components and other players, i.e. focusing on ingame behaviour. Player metrics will be the focus in the following discussion.
Concentrating on gameplay metrics – measuring player behaviour and providing the
most important information when evaluating game design and user experience – user
metrics can be further classified into generic metrics that apply across all digital
games, genre specific metrics and game specific metrics (Drachen et al. 2013). It is
accepted that game metrics can be recorded during all phases of game development as
well as following launch (Isbister and Schaffer, 2008; Lameman et al. 2010).
User gameplay metrics can mostly fall into two broad categories: temporal (i.e. time
based, such as time spent on each level segment) or spatial (i.e. location based, such as
where most players died) metrics. Spatial analytics can be especially useful, as they do
not reduce the dimensions of the game metric data, but rather deal with the actual
dimensions of play, providing insights otherwise unobtainable (Drachen and Schubert,
2013). Spatial analytics also allow for the visualisation and analytics of multiple
variables at once by overlaying them, highlighting how these features interact with
one another. There are a number of strategies for tracking user data. Frequency-based
telemetry records data following a specific frequency. Event-based telemetry
(implemented in the project presented) logs information every time a pre-specified
event occurs. This ensures data is only being sent when something important happens
(Drachen et al. 2013). What metrics are recorded at each event can also be tailored for
each event allowing bandwidth and storage space to be saved with a well designed
system. In either case, the total amount of data recorded and therefore the cost of
analytics can be reduced by sampling data – selecting a small subset representative of
the entire dataset, or its behaviour in the case of game telemetry (Gagné et al. 2013;
Han et al 2005).
When looking to answer a specific question, it is important to track the right
information. Metrics can be a powerful aid in decision making: strategic analytics
focus on how the game should evolve in the long run based on player behaviour, while
tactical analysis is used for shorter term decisions, such as testing a new game feature.
When deciding on the set of metrics to be monitored, there are a number of issues to
consider. These include usage – deciding on the questions before beginning
6
implementation; integration time – early integration is essential or data storage
requirements (Santhosh and Vaden, 2013), but one of the most important issues is
balancing cost and benefit. The economic concept of Diminishing Marginal Returns
applies to game analytics as well (Kim et al. 2008). Selecting the right features to
track will yield great results however after a certain point, adding extra variables to
track only increases the size of the dataset, thus increasing noise and the cost of
analysis without providing any new relevant insights.
The Knowledge Discovery System is a method widely used in data-driven analytics in
order to discover useful knowledge from that data. The system starts off with attribute
definition, determining the aims and objectives of the analysis, before performing data
acquisition. Following software instrumentation – preparing it for data collection
(Fields, 2013) - the data is then loaded into a database or similar, more accessible
structure during the pre-processing stage. Metrics can now be developed, transforming
raw data into variables or more complex features to track. Analysis and evaluation can
now be carried out, visualising the knowledge gathered to enable easier
comprehension. The knowledge is then presented and deployed to the appropriate
stakeholders through reporting and knowledge deployment (Larosse, 2004). The game
analytics process can be observed to follow the same cyclic iterative approach
(Larosse, 2004; Witten et al. 2011). Stakeholders of game analytics can include a
number of disciplines from producers, marketing managers or even the players
themselves, however the focus in this dissertation is placed on game designers and in
particular, level designers, who are responsible for creating the game world and its
mechanics. Designers will often formulate specific hypotheses that require
confirmation to fine tune and balance the game elements (Drachen et al. 2013).
Analytics provide a great way to fine-tune player experience. Below is an image
displaying all steps involved and highlighting the system’s cyclical nature.
7
Figure 2: Phases of the Knowledge Discovery Process adapted to game analytics
(Drachen et al. 2013 p.36)
Data collected can then be processed, analysed and represented in a number of
different ways, the most widely accepted method being visual representation, which is
the most natural, easy to understand and therefore most useful for communicating
information (McCandless, 2010). According to Norretrander, the human brain is
capable and used to processing an immense amount of visual information, much more
than any other sensory information. If the bandwidth of human senses were converted
to computer terms, visual data would be sent to the brain at a rate of 1250Mb/s,
compared to touch at 125Mb/s or smell at a mere 12.5Mb/s, not to mention taste at
around the throughput of a pocket calculator (Norretrander, 1999). Information
visualisation is therefore accepted to be the most comprehensible way to represent
information and the popularity of data charts and info-graphics supports this
statement. This approach is known as “visual analytics” and can be defined as the
“science of analytical reasoning facilitated by interactive visual interfaces” (Thomas
and Cook, 2005).
There are currently a number of telemetry tools used by games companies, mostly at
the end of the development cycle or post production during the lifecycle of the
8
finished product. Visceral Games’ Data Cracker (Medler, 2011) monitors player
behaviour in their game Dead Space 2 (Visceral Games, 2011). Microsoft’s TRUE
(Kim, 2008) combines telemetry measurements with monitored test sessions,
interviews and user surveys in order to achieve a greater understanding of player
behaviour and expectations. Both of the tools mentioned collect this data post-release,
after work on the game has been completed and it has been shipped to customers.
However access to this information early on in development can reveal pattern and
trends that can prove extremely useful during the design and balancing phase.
Bioware’s SkyNet (Zoeller, 2010) focuses on developers’ behaviour rather than
players with built-in bug tracking, software metrics and a social portal for developers
to engage with the project and each other. This is a good example of using data
analysis as part of the development and production process. Similarly the in-game
visualisation and analytics tools described by David “Rez” Graham at GDC 2012 in
his talk on the tools used during the development of The Sims Medieval (EA, 2011)
highlight the importance and applicability of similar implementations at an early stage
(Graham, 2012). Perhaps one of the best examples for visual data analysis during the
concept phase is shown by Bret Victor during his talk “Inventing on Principle”, where
he demonstrates a game design tool capable of recording gameplay data in a way that
- combined with interactive, runtime tweaking of gameplay variables - the application
continuously visualises the effects of modifying gameplay variables – e.g. change in
the player’s jump projectile path as a result of modifying jump height or gravity
(Victor, 2010).
The project discussed in this dissertation was developed with the aim to bring these
two powerful tools together and assess their utility in game prototyping and their
influence on a project.
Data is often complex and multi-dimensional, which creates a design challenge in
itself when creating tools dealing with it (Shneiderman, 2005). In order to provide
useful and comprehensible tools, it is therefore key to allow the data to be explored
and examined from different perspectives. Shneiderman talks about an information
visualisation mantra which should be at the core of every system designed to convey
and communicate information: “Overview first, zoom and filter, then details on
demand”(Shneiderman, 2005). This clearly highlights the significance of user control
9
and the recursive nature of the process, filtering and relating information while
digging deeper down to the smallest details. Without this freedom, the user loses her
power to understand data through exploration or gain valuable insights from nuances
that the “big picture” might not reveal. The architect Christopher Alexander described
an unusual method for designing space– plant grass and examine where people have
worn paths by themselves after a year, only then start building (Alexander, 1977).
This is what level designers can achieve through the power of early stage player data
visualisations – natural player patterns can be highlighted and the level or game can be
designed around the instinctive behaviours of the players, rather than forcing them to
adapt to the artificial game world, creating more believable and immersive
experiences.
Developing a tool that combines the idea of early prototyping and visual game metrics
has a number of challenges including the design of a clear, intuitive user interface that
is useful for and usable by developers from different backgrounds, and also the
understanding of game and level design so the metrics collected and the way they are
visualised
provide
useful
information
for
the
development
team.
The first challenge can be addressed by relying on Nielsen’s user heuristics (Nielsen
and Molich, 1990), of the following:
1.
2.
3.
4.
5.
6.
7.
8.
Visibility of system status – keep users informed on what’s going on.
Appropriate feedback within reasonable time.
Match between system and real world – use natural words and concepts
familiar to user. Follow real world conventions.
User control and freedom – provide a clear „emergency exit” for users to
resolve mistakes. Support undo-redo.
Consistency and standards – follow platform conventions, make sure user
understand what each action means.
Error prevention – eliminate error-prone conditions or ask user for
confirmation before committing.
Recognition rather than recall – make actions and options visible, don’t rely on
user remembering information from another part of the program. Make user
instructions easily accessible at any time.
Flexibility and efficiency – optional accelerators can help experienced users be
more efficient while novice users can still utilise the application.
Aesthetic and minimalist design – Display the minimum amount of
information needed to avoid cluttering the screen.
10
Recognize, diagnose and recover from errors – error messages should describe
the problem and suggest a solution.
10. Help and documentation – if documentation is necessary, it should be easy to
access, search and should be informative.
9.
Then, according to Rouse (Rouse, 2005), a game design tool must:
Allow the designer to view the level from the player’s perspective
Allow the designer to test out changes without delay
And display additional information otherwise invisible
Schaffer discussed a different set of heuristics, focusing on balancing gameplay rather
than software usability (Isbister and Shaffer, 2008). A number of them are highly
applicable to design and gameplay analytics and are concerned about the following:
Whether the game provides clear goals,
Whether challenges, strategy and pace are balanced, and
Whether the game stagnates or includes boring, repetitive tasks.
In order to help determine the answer to the above questions, visual game analytics
can be extended with a number of additional techniques to provide more information
for the developers. While analytics are an excellent source of objective data and
metrics are fast to analyse, leaving more time for results to be processed, a single
source of information is often not enough to make a fully informed design decision
(Guardini and Maninetti, 2013). Two powerful additions to game feature analysis
include collecting subjective feedback during or after play sessions, using surveys,
questionnaires, simple comment boxes or interviews. This enables the developer to
gain insight into how players react in reality and how that compares to assumptions
based on the metrics alone. Similarly, collecting video data – recordings of the screen
or the player throughout the session – can highlight player reactions analytics would
not detect or players are not consciously aware of. It can therefore be seen that it most
cases it can be very beneficial to rely on more than one source of user information to
obtain a more detailed, refined view.
11
METHODOLOGY
In order to evaluate the utility and the role of analytics and information visualisation
in game prototyping and balancing, a number of steps were required, detailed in the
case study below. The steps were determined by the aims and objectives of the
project. In the following, the project’s objectives are recited and the ways in which the
completion of each of these objectives was ensured, is reflected upon.
Objectives
1. Implement a game prototype editor that enables developers to easily create custom
2D levels, add basic platforming game elements (e.g. collectibles or enemies) and
test them rapidly;
2. Identify a system of gameplay metrics most useful when designing and balancing
a level for a 2D platformer game;
3. Compare different visual representations (e.g. heat map versus graphs) and isolate
the most appropriate for each metric;
4. Develop a simple API for collecting metrics within the game code by placing
“hooks” for recording information;
5. Add a visualisation layer to the editor that will communicate various data
collected;
6. Evaluate the utility and user experience of the analytics tool and whether it
effectively highlights design flaws early on;
7. Analyse the effect of combining prototyping and design tools and visual feedback
on gameplay metrics in a single editor.
8. Construct conclusions and justify the need for such a tool.
Although a number of prototyping tools and game engines are readily available and
could have been extended instead of spending time on developing a new solution from
scratch, these already existing tools would have involved a unique learning curve with
12
limitations in the ease of use and extensibility that are hard to predict. Pre-existing
tools that are often released for commercial use are very large and robust pieces of
software and there is a chance that the simplicity of, and control when evaluating the
project cannot be ensured amongst the myriad different factors and features on offer.
Besides the above, a basic version of the level editor built during the development of a
prototype game prior to this project, served as an optimal starting point to build upon
and extend. These two arguments provide a good reason why a custom editor was
created for Objective 1. The project was built in C# using the XNA framework. The
project developed, an extended version of a simple 2D drag and drop level editor,
primarily focused on the prototyping of platformers, mainly includes improvements
relating to design and usability when compared to the aforementioned tool it’s built
upon, as well as the entire presence and implementation of the visualisation API
detailed below. The main goal and most important point to keep in mind when
working with and extending an already existing program was to transform it from an
internal development tool, where bugs and poor user interface will unfortunately often
be disregarded, to a tool that’s more suitable to deal with the demands of a wider
public user base. However the main focus of this project was on exploring and
understanding the power and correct use of analytics in prototyping, so it was
important to keep the development of the editor relatively short and simple.
The next significant part of the project was to determine a set of metrics that would
prove to be the most informative and essential to the developers (Objective 2-3). The
initial list was developed through research into existing data analytics solutions for
games discussed in the Literature Review and it was extended upon through user
evaluation and testing sessions. These sessions took place half way through
development and included the assessment of the user-interface and the quality of user
experience. Five participants, from various development disciplines including
designers, programmers and artists, were shown the editor’s interface for the first time
with 5 minutes to explore and familiarise themselves with the basics. They were then
asked to complete an array of simple tasks, ranging from placing a single level
element, through editing collision data and game elements to interacting with data
visualisations. The participants were asked to think out loud as they were performing
the tasks in order to gain valuable insight related to the flow of the application and any
13
potential design flaws. A set of usability heuristics were used to ensure focus on key
design areas and provide structure to the assessment. This proved to be an invaluable
exercise and ensured a number of improvements and tweaks were made in order to
enhance the tool, such as redesigning the physics ledge palette and adding hint
bubbles over UI elements explaining their function to the user. A number of additional
tweaks were suggested that unfortunately did not fit into the scope and focus of this
project; however they will be considered for future work and discussed in a later
section.
In addition to the hands-on user tests, a questionnaire was also developed, focusing on
the information and metrics to be collected and the ways to visualise them. This was
handed out to the candidates during the test session as well as sent to additional
participants online. The survey consisted of a list of possible metrics, asking for the
ones deemed the most important to be marked, as well as a section of images with
each type of metric being visualised in at least two distinct ways and asking for the
most natural and clear representation to be marked for each. The simple, multiplechoice nature of the questionnaire allowed for the easy involvement of participants
online and so access to a larger amount of data, Combined with the in-person, more
detailed interviews, this contributed greatly to finalising the list of metrics.
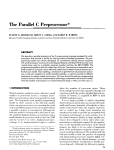
Below are the example images shown of various data visualisation propositions for the
“player death” metric. The detailed protocol and questionnaire used in these
evaluation sessions can be found in Appendices C and D.
Figure 3: Various data visualisation suggestions representing player death.
From left to right: heat map, pie chart, data point visualisation
14
The final set of metrics to be collected and visualisations to be created, determined by
the above procedure is the following:
Data point overlay for player deaths (including location and cause)
Data point overlay for players waiting longer than 10 seconds without
interaction, suggesting they might be stuck and highlighting potential
problematic locations. Add data point overlay for locations where players quit.
Bar chart displaying how long players spent on each level segment.
Bar chart displaying the number of players reaching each level segment.
Data point overlay of all collectible items showing their type and how often
they were collected/found by players
Additional comments included requests to:
o Allow multiple filters and overlays to be combined in order to
understand data and any connections better
o Allow for the information visualisation to be rendered to and external
file for easy sharing.
These additional suggestions were also taken into account when developing the
application.
Once the above list was determined, an application programming interface (API) was
required to serve as a communication layer between the developer wanting to extract
information from the game prototype, and the underlying program. The API forms the
core of the project and can be regarded as the most important part which is being put
to a test through using all other building blocks. Key considerations included the need
to make the API in a way that allows for flexibility and for it to be used within
different environments with minimal tweaking in the future.
The API was designed with simplicity in mind that would allow for the focus to be
placed on implementing the various visualisation techniques and not making
information handling too complex. The API consists of a number of functions that act
as hooks in the main code base and can be triggered every time an important event
occurs, such as the player dying, quitting or completing the level. At each event the
values of a set of important variables are recorded, including player coordinates in the
game world, play time elapsed as well as the type of event that triggered the
15
recording. This information is simply stored in a log file which makes the handling of
the stored data much more straightforward at the cost of being less flexible and easy to
expand. For the scale of the project, implementing a database system was considered
unjustified and out of the scope planned. The data collected throughout the play
sessions could then be analysed to acquire different metrics and render appropriate
visuals for the user. The API design document used to get an initial understanding of
the requirements of implementing an API, can be found in Appendix G.
At this point, after implementing the API and the functionality for visualising data, the
implementation phase of the development cycle was essentially completed and focus
could be moved to testing and evaluation, Objectives 6 and 7. After the tool was
completed to a satisfying level, another set of user test sessions were run. The same
group of volunteers who participated in the first test were invited back, as they were
able to provide a user perspective on how the tool evolved during its development and
were already familiar with the basic user interface, which sped up the process. The
structure was similar to that of the first session, however this time the participants’
task was to edit a game level based on visual data provided by the application,
prepared prior to the tests. This was a useful exercise as not only did it prove whether
the tool is usable or not, but it also showcased the comprehensibility and clarity of the
visuals and their effect on the design process. After the evaluations, a set of interviews
were performed where participants were asked for feedback on the usability and user
experience of the program as well as their opinion on the advantages or disadvantages
of combining visual analytics and development tools.
These test sessions showed a very positive attitude towards the project and suggested
a similar solution would be a welcome addition to designers’ repertoire. Users reacted
positively to the user experience changes implemented in response to their feedback
before and considered the project to be more “user friendly” and “commercial
looking” as a result. Unaware of commercially available packages providing a similar
service, the majority of designers said they rely on personally playtesting their
creations when iterating on the design. This posed the problem of subjectivity and lack
of factual data or range of experiences when trying to balance gameplay. The solution
proposed, including built-in analytics, was considered to be a very useful addition to
16
traditional level design practices and a clear improvement over balancing through
playtesting alone.
The protocol for and results of the final test session can be found in Appendices E and
F. Below is a summary of the development process of the project from concept
Figure 4: Project development methodology flow chart
Objective 8 serves as the main aim for this dissertation and will therefore not be
discussed in greater detail in this section. The findings and final conclusions of the
evaluation process can be found in the sections below.
17
RESULTS
Evaluating the project has produced a number of intriguing results, starting from the
first set of user testing evaluating the user experience, carried out during the end of
February. Setting up an early test session was beneficial for a number of reasons. The
early timing fit in better with the workload and schedule of test candidates, game
development student at University, who were therefore much more focused and tried
hard to provide useful feedback during sessions. The timing also allowed for feedback
early on in the development, ensuring the project was on track and development was
directed on the correct features.
The first round of testing focused primarily on the usability of the application and
improving the user experience, ensuring it has an intuitive user interface that assists in
enhancing productivity. Individual sessions of around 30 minutes in length were
carried out with a total of six candidates from a range of game development
disciplines including design, art and programming. A combination of task based hands
on sessions, interviews and questionnaire based discussions resulted in valuable
conclusions. Test candidates rated the intuitiveness and clarity of the initial user
interface an average of 4 out of 5, which shows that the planning and research while
establishing these standards was successful, providing a good basis to build upon.
Suggested alterations and feature requests were then compiled into an ordered list of
“needs” and “wants” based on the importance of implementing the change, creating a
route map for further evolving the project. Items such as enhancement of level
element and physics ledge highlighting or tool description boxes appearing when
hovering
over
most
UI
elements
were
considered
a
crucial
addition.
The first round of testing was therefore considered to be very successful and yielded a
great amount of excellent feedback. However some suggestions were outside of the
scope of the project or were considered to have too small a margin of return. Features
suggested that were not implemented include the ability to add custom assets with
18
ease or the scaling and rotation of individual elements. These will be discussed in the
Future Work section of the dissertation.
At the end of development, a second round of user testing was carried out using three
of the original six candidates, this time focusing on the opinion of the designers, the
primary target market for the tool. The second stage of testing aimed to measure the
perceived utility of the finished project, evaluation whether the right feature choices
and design decisions were made and to determine its limitations in its current form.
The general feedback received included an overall satisfaction with the user
experience improvements implemented in response to the first round of testing and
highlighted the lack of a similar solution readily available for developers. All
candidates admitted to lacking the tools to objectively playtest and balance a level and
agreed that the proposed concept could provide a better solution and would be a
welcome addition to traditional level design practices.
The prototype developed has evolved significantly over the course of the project.
While implementation started with a set list of features to be included, specifications
were kept flexible to allow for a more iterative approach to development resulting in a
more user friendly application. Based on feedback gathered from users, the final level
editor allows the user to build a 2D platformer game level using a set of level elements
provided, which can be placed on one of four layers corresponding to background
elements, foreground elements and the active layer in between that the player interacts
with. A separate scale value and scroll speed was assigned to each of these layers to
create a parallax scrolling effect adding depth to the scene. As well as level elements,
the user can also draw physical collision ledges for the player to walk along on,
allowing for a more natural, organic path through the level, completely in the
designer’s hands. Additionally a few core platformer game elements, such as
collectible gems, enemies and checkpoints were also included for the designer to place
in order to create very basic gameplay in the levels. The editor also features common
functionality one would expect from such a tool including the ability to undo and redo
actions, save and load different levels and keyboard shortcuts for most actions to
improve productivity.
19
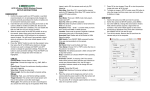
Besides the level editor, the application includes a Play Mode, allowing the user to test
the level while editing it without leaving the editor and the Analytics Mode which
displays all the various visual data overlays created using the metrics collected by the
data API during the play sessions. The Analytics Mode provides an interface allowing
the user to toggle the display of individual metrics in order to focus on getting exactly
the information needed as well as the ability to take screenshots of the screen for
future
reference,
documentation
or
discussing
it
with
the
team.
The final set of metrics collected includes:
Locations and reasons players died,
Locations players were idle for longer than 10 seconds or quit the game, which
could signify frustration,
Metrics regarding how often gems were collected or enemies were killed,
Metrics regarding how many players completed each level segment
(determined by checkpoints) and how long they took to do so, on average.
Figure 5: Application User interface in Editing (left) and
Analytics mode (right)
20
DISCUSSION
Results compiled from the findings of the user evaluation tests confirm that gameplay
metrics and analytics can indeed be introduced at the prototyping and design stage of
game development and doing so has the potential to increase user productivity.
Traditionally designers rely on playtesting their own creations when trying to find the
best solution, which highlights the problem of unavoidable bias and subjectivity,
interfering with a project reaching its full potential. Developers who have been
working on a project from the beginning behave in a way they expect future players to
behave, which is however often far from reality. This difference in turn makes it really
easy for developers to overlook problems obvious to players. By collecting and
displaying quantitative data in an easy to understand, visual manner, design flaws and
imbalances are easier to identify and correct earlier on. Test candidates agreed that the
proposed solution would be a welcome addition to existing developer tools as even in
the case of personal, iterative playtesting only, the statistics and information gathered
can highlight patterns otherwise unobserved by the developer. This would result in a
higher quality product being produced in less time, reducing cost and allowing
developers to focus more of their resources on creating more content or fixing more
important problems.
Potential dangers of using the proposed tool include fixating too much on the data
collected and trying to make it perfect. The player base for games is not homogeneous
and there will always be data logged that doesn’t seem to fit the pattern or appears to
be out of place. It is important to keep in mind that the goal is not to eliminate the
possibility of the player failing and not all hotspots of players dying or spending a bit
too long need resolving. After all games are supposed to be challenging and the above
would achieve the opposite. There might be a learning curve involved in getting
developers accustomed to having the additional information on hand, but also in
making sure not to enter endless iteration or allow feature creep to happen.
Moreover, while analytics can provide invaluable information even when simply
continuing with the tradition of internal playtesting only, the real value is revealed
21
when a large amount of data is collected from a wide spectrum of realistically
behaving players. While user testing sessions and beta tests are part of most games’
development cycles, they are usually carried out much later in the process, towards
project completion. The reason for this is the organic nature of game design which is
almost guaranteed to evolve and often change significantly throughout its
development. It can be considered expensive to organise test sessions when the results
might not reflect the game’s final state at all. It is therefore a matter of balancing the
cost and effort of arranging user tests against the value the analytics gathered would
bring to the project and its longer term implications on the game’s direction.
There are also a number of ethical considerations to account for when working with
game data and player telemetry. With the current technology and solutions available,
highly detailed patterns can be discovered using the data collected and combining this
knowledge with information gathered from personal data forms means accurate
personal profiles can be constructed. These databases are confidential in nature, but
their high value means there is a risk of the information being accessed or used
illegally. This risk can be reduced with the establishment of standard regulations
regarding data collection in games and allowing players to opt out of sharing their
information if they wish to do so.
Answering the original research questions:
What are the effects of integrating the collection and visualisation of game analytics
into a game prototyping tool to facilitate early game balancing and quick iteration
of level design ideas?
The solution proposed and investigated includes the implementation of a simple 2D
level editor with an integrated playtesting mode allowing the user to carry out testing
without leaving the editing environment. The tool also collects data automatically
during these test sessions and uses it to render visualisations of the various metrics for
the designer to explore. Hands-on testing carried out at multiple stages of the project
focused on maximising the utility of such a tool while creating a highly accessible
user experience. While the scope of the project was restrained by limitations in both
time and resources, user opinions suggest
22
The project was developed using C# and Microsoft’s XNA Framework (Microsoft,
2010). XNA is a powerful tool for creating cross-platform games, hiding much of the
lower level feature implementations such as the game asset pipeline and taking care of
platform differences automatically when porting games to various platforms. It
provides a great amount of assistance in setting up the basic environment quickly and
cheaply, yet exposes enough of the framework to allow for much finer control than
commercially available game engines such as Unity. XNA also has a thriving user
community providing great support, which, together with the advantages mentioned
above, made it a really helpful and pleasant tool to work with throughout
development. Unfortunately, in January 2013, Microsoft has announced that they are
abandoning XNA and have “no plans for future versions” of the framework.
While the technology is no longer being developed by Microsoft, applications built in
XNA continue to operate without problem on all platforms it supported, meaning the
standalone application developed remains a working proof of concept and in theory
can
still
be
used
to
prototype
and
test
simple
2D
levels.
Moreover, there exists an open source implementation of the XNA 4.0 framework,
supporting an even wider range of platforms than the original Microsoft tool,
including Mac OS X, Windows 8, Android, iOS and PlayStation Mobile. The
implementation called MonoGame (MonoGame, 2013) is modelled on the same
structure as XNA and therefore provides a viable alternative with minimal effort
required to migrate. This option will be discussed in the Future Work section of this
dissertation below.
23
CONCLUSION AND FUTURE WORK
This document presents research into game prototyping and level design of a 2D game
with platforming elements. User experience and interface design was studied along
with game design concepts and techniques in order to create a simple level editor tool
with basic game elements and editor functionalities. Two sets of user tests were
carried out, the first focusing on the UX design of the editor, ensuring intuitiveness
and clarity of the interface as well as the presence of key features needed by designers
when using such a tool. Perceptions about game analytics were also studied and the
best set of metrics to be monitored was constructed. Based on the feedback received,
the editor was tweaked to be more user-friendly and an event-based analytics API was
implemented to collect and visualise the data. The second set of user tests were then
carried out, concentrating on the overall value of the tool proposed in real-life
development scenarios and its advantages over traditional techniques.
The project yielded positive results investigating the effects of gameplay analytics on
the design and prototyping process. Based on the knowledge gathered and user tests
carried out, a number of future steps, features and improvements are suggested. These
would improve the usability of the editor, provide better design insight or allow for
more flexible data exploration, adding to the value of the tool. The following features
were considered a necessary or otherwise important addition that would increase the
perceived value or usability of the tool to game developers:
1. Port application to MonoGame
As mentioned in the Discussion section of this dissertation, the program was built
using Microsoft’s XNA framework, which was unfortunately abandoned by
Microsoft during the development of this project. While applications creating in
XNA continue to function as usual on all platforms supported by the framework,
the consequences of Microsoft discontinuing support cannot be ignored.
24
As new platforms without XNA support continue to appear and spread, the
currently active user community and will likely decrease in activity and the
excellent library of examples will become obsolete. However there exists an open
source port of the framework, called MonoGame, which offer straightforward
migration of the code as well as more supported platforms. While the standalone
editor is still a functioning proof of concept, porting it to MonoGame would
extend the lifetime and potential user base of the application by being able to
release on and support a wider range of platforms.
2. Implement additional editor features
There are a number of features suggested during user tests that unfortunately did
not fit the scope of the project, however would be an excellent addition to the
editor. They include the ability to scale and rotate individual level elements,
greater control when painting physics ledges including snapping nodes to a grid
system or altering individual nodes after placement.
3. Adding further game features
The current version of the editor includes very basic platformer game elements
such as collectibles, enemies and checkpoints. The quality and relevance of the
application can be improved by adding more functionality to existing elements –
such as enemy AI including attacking – and adding extra elements as well – such
as power-ups or hidden areas.
4. Allow for custom game content to be loaded easily
Implementing an easy to use content package system, where users can easily
create level and game elements to extend the library offered by the current version
would increase the value of the editor significantly. This would enable users to
create any level they envisage while working with art intended specifically for
their game prototype.
5. Change API structure to record appropriate data based on event type
Currently, the analytics API records a predefined set of data every time a tracked
event happens – including player position, ID, time stamp and event flag. In the
current version, most metrics are general enough that data isn’t being wasted, but
there are a few cases where a data-field being recorded isn’t actually necessary for
25
analysing the particular event. Especially with the implementation of a more
sophisticated analytics system where a wider range of metrics are being
monitored, it becomes unfeasible to only record the same, general set of data.
Implementing a system where the type of event triggered would determined what
variables’ values get logged would increase the complexity of the API while
helping reduce the bandwidth and storage requirements of data collection by
recording only the information needed and would therefore reduce the overall cost
of analytics.
6. Allow user to search for information recorded with each metric
The current version of the data visualisation provides limited additional
information apart from the map overlays and extracting specific information from
the visuals can be difficult. The ability to search for and filter data based on user
specifications would enable patterns and connections to be highlighted and
identified more easily.
7. Extend analytics with surveys and video recording
As mentioned in the Background and Literature Review section, the value of
analytics can be extended by relying on more than one source of information.
Including player surveys during test sessions, where subjective information can be
gathered, or video recordings of the screen and the player’s face, which might
reveal subconscious reactions or data otherwise hidden, can significantly increase
a designer’s understanding of how a game or level is being played and
experienced by the player.
In conclusion and to answer the research question initially presented, introducing
gameplay analytics as early in the development cycle as the prototyping stage can
have very positive effects by highlighting implications of design choices and balance
issues previously not visible to developers. While there are a number of analytics
solutions used in the games industry, they are mostly introduced towards the end of
development or post-release. Many developers are not currently aware of a solution
readily available to be integrated with prototyping, but feel there is definitely an
opportunity to be explored in this space. Throughout the project insight was gained
into user experience design and game data analysis techniques that were utilised
26
during the implementation of the test application. A number of data visualisation
methods were tested after the core set of metrics was finalised, to find those most
informative for developers. The application received positive comments throughout
testing which highlighted the favourable relationship between game analytics and
prototype testing at an early stage.
Figure 6: Data overlay exported from editor for collaboration purposes.
27
28
APPENDICES
APPENDIX A
User Manual
Editor
Click to change name
of current level file.
New level file
Load exisiting
Test game in
play mode
level Save current level
Enter analytics
mode
Undo
Redo
Test game in
play mode
Choose editing
mode (level,
physics, game
elements)
Drag and drop
level elements
onto canvas
Current physics
ledge and number
of nodes inside it
Delete ledge
Add extra
ledge
30
Ctrl + N
New document
Ctrl + O/L
Open/Load Document
Ctrl + S
Save Document
Ctrl + Z
Undo last action
Ctrl + Y
Redo action
Ctrl + Up (▲) or Down (▼)
Move between layers
Left (◄) and Right (►) or A and D
Scroll level sideways
Game
Stop game,
back to editor
Click to change Player ID
Left (◄) and Right (►)
Move sideways
Up (▲)
Jump
31
Analytics Mode
Save screenshot
of screen as .png
Exit analytics mode, go
back to editor
Filter what metrics are
getting visualised by
toggling each option
32
APPENDIX B
Accompanying CD
CD Contents:
\Application
\Content\data
Contains the application .exe
Any screenshots taken in the editor will also be placed
here
Contains level saves (.map) and accompanying
analytics data (.data). These files can be deleted to reset
analytics.
\Source
Contains the project source code and assets
\Dissertation
Contains an electronic copy of the dissertation
\Screenshots
Contains a number of screenshots of the application
\Video
Contains the showcase reel of the application
33
APPENDIX C
User Test 1 Protocol
Goal:
Usability and user experience feedback – can the user find his way around the application
without requiring assistance? Can he accomplish different tasks in the application?
Ways to improve UI – are UI elements easy to understand?
Does navigation work without problems? Does the program flow naturally?
Are there any limitations that are frustrating or counter productive?
Location: University of Abertay
Time: During the week beginning 25th of February
Duration: Approximately 30 minutes per candidate broken down as follows:
5 minutes briefing candidate prior to testing, filling out consent form
15 minutes conducting test based on protocol below
10 minutes post test interview and debriefing
Tools:
Laptop – my own laptop will be used during these session, which will allow for everything to
be set up in advance inclusing the application to be tested and any recording software used.
Consent forms
Task list and interview questions
Participants: A mix of users that have worked with the editor before – colleagues from 3rd year group
project – and other games students that have never seen the application before.
Graham Hill (design – has worked with the editor before)
George Johnstone (art – has worked with the editor before)
Gregor Fergusson (programming – has worked with the editor before)
Fraser Clark (design – has NOT worked with the editor before)
Kayleigh Macleod (art – has NOT worked with the editor before)
Stuart Milne (programming – has NOT worked with the editor before)
Protocol:
Before test:
Candidate Briefing
Go through consent form, ensure candidate is fully informed
Pre-test survey
previous game development experience
knowledge of prototyping tools
opinion on visual metrics
their knowledge of any tools assisting level design
During test:
Tasks
First I would like to focus on the clarity of the user interface and layout. Then move onto
feature completeness and functionaility testing.
”We will begin the test by first looking at the clarity of the user interface – basically
meaning, how easy is it to find your way around it. Please remember that this test isn’t
trying to assess you or your skills, but rather focuses on evaluating and improving the
application. If you get stuck, don’t worry, just talk through the problem, as it only means
that
the
application
isn’t
good
enough
yet.
So let’s start. Please think aloud as you’re performing the tasks as this will help me to see
how you think about the flow of the application.”
Add a level element to the scene
Undo your last action, then redo
Change the depth layer you’re currently editing
34
Add elements on different depth layers
Scroll along the level to see more
Zoom in or out the scene
Add physics ledges to your level
Add collectibles and/or enemies to the level
Rename and save your level
Load a level called „map1”
Test your level in „Live mode”
Exit „Live mode”
Usability heuristics:
1.
Visibility of system status – keep users informed on what’s going on. Appropriate
feedback within reasonable time.
2.
Match between system and real world – use natural words and concepts familiar to
user. Follow real world conventions.
3.
User control and freedom – provide a clear „emergency exit” for users to resolve
mistakes. Support undo-redo.
4.
Consistency and standards – follow platform conventions, make sure user
understand what each action means.
5.
Error prevention – eliminate error-prone conditions or ask user for confirmation
before commiting.
6.
Recognition rather than recall – make actios and options visible, don’t rely on user
remembering information form another part of the program. Make user instructions
easily accessible at any time.
7.
Flexibility and efficiency – optional accelerators can help experienced users be more
efficient while novice users can still utilise the application.
8.
Aesthetic and minimalist design – Display the minimum amount of information
needed to avoid cluttering the screen.
9.
Recognize, diagnose and recover from errors – error messages should describe the
problem and suggest a solution.
10. Help and documentation – if documentation is necessary, it should be easy to
access, search and should be informative.
After test:
Interview
How intuitive did you find using the application ona scale of 0-5? Can you compare
it to any other application you might have used in the past?
Rate the clarity of the user interface on a scale of 0 to 5 (0 being very confusing and
unclear and 5 being easy to understand and natural)
Did you encounter any problems with any of the tasks? What were they? Why do
you think they happened? How would you solve it?
Do you think a detailed documentation for using this software is required to
understand it? How crucial would it be, on a scale of 0-5?
What did you feel the best feature of the application was? Why?
Is there anything you’d like to see added to the application to make it more useful,
easier to use or generally better?
Would you use an application like this in practice? How do you think it’d help you?
If it wouldn’t be or you wouldn’t use it, why?
Candidate Debriefing
Remind candidates of the purpose of the study and provide contact details to follow
up and find out more in the future.
User questionnaire – February
Goal: Determine the most easy to understand and intuitive ways to viualise every piece of player/level
metric. Assess the need for different kinds of data.
Participants: Extended, in person session with participants of the UI test session. Game students across
University and friends to fill out the online survey. Aiming to get 10 online participants in addition to
the in-person participants.
Questions:
35
Below are a number of metrics that can be collected during a play session in game, along with images
of visualising the data. Please number the images in order of clarity, starting from 1 for the image that
communicates the meaning of the data in the most comprehensible and natural way that’s easy to
understand.
Player death
Heatmap of level showing player deaths with continuous colour transition based on
number of players at each location
Heat map of level showing colour-coded dots at the location of deaths, each coloured
based on the cause of death
Pie chart of causes of death (eg enemies, falling, traps etc)
Players getting stuck
Heatmap of level highlighting where players waited longer than 20 seconds, or quit,
with continuous colour transitions based on number of players at each area.
Heat map of level with colour coded dots, one for each player, colour based on action
that triggered metric (eg. Player quit, waited for 20s+ etc)
Time spent on each level/segment
Heatmap colour coded based on amount of time spent at each segment
Bar chart showing the time spent on each level
Pie chart
Collectibles found
Pie chart of collectibles found/used/not found in each area/category
Heatmap
List of collectibles
Players reaching certain part of level/game
Pie chart of players reaching end
Heat map of the level based on how many people got to each section
Bar chart or number of players reaching each segment of the level
36
APPENDIX D
User Test 1 Results
Candidates: Graham Hill, George Johnstone, Gregor Fergusson, Fraser Clark, Kayleigh Macleod
Hands-on tasks:
Add ability to reorder elements on a layer (bring them forwards or back)
Allow element to be selected (remain selected even if mouse isn’t over it) which would then
allow for
o pixel perfect movement with arrow keys
o delete button on UI to delete element
o display an interaction widget/gizmo with rotate/scale/transform
Scrolling sideways with RMB is not obvious alternatives suggested include middle mouse
button or UI button. First guess was LMB.
Rename ledges and grid – there’s a confusion with the terms
Show ledges in every mode (translucent when not in ledge mode) – maybe add toggle
Add ledges to the list as they are being created to avoid confusion
Highlight palette item with a border/box and highlight the ledge along with it
Highlight player layer for adding layers to make it obvious what elements they should
follow/player icon next to layer name
Cosider allowing right click to finish a ledge and start the next rather than having to click on
the palette
Allow for editing individual vertices in ledges
When editing game elements, layers shouldn’t lock, or only middle layer should render?
Consider rename button/pop up box and/or changing cursor when hovering over editable area
or putting a box around it when editing/pop up dialog
Saving and loading confusing, all dialog popup after buttons are clicked
Ability to import own assets
Consider STOP button instead of PAUSE, or both with different effects
UI intuitiveness –4, 5, 5, 4, 4
Intro tutorial/walk though would be useful, pop up bubbles
Seach bar for finding asets would be very useful
Include a physics attribute editor for changing gravity, speed etc values
Element manipulation gizmo for scale/rotate/translate
Lock vertical scroll in editor as it’s confusing and barely used – maybe allow control with
keyboard but not with mouse. Or switch scrolling to keyboard entirely?
Collision editing is not the best, needs SHIFT+click to draw straight lines at 0/45/90 degree
angles.
Level elements could snap to each other so no gaps occur
Show a frame around starting game camera view
Show a preview window with live scales
Show character size for reference
Add a grid for measuring
UI clarity – 4, 4, 4, 4, 4
Change UI button colours to stand out more
Label the layer the player is going to be interacting with clearly
Change names of game elements and physics objects
Make editing mode dropdown menu bigger/more obvious
Indent Palette elements so that they line up with dropdown box (elements start under
dropdown box arrow)
37
Add an additional indentation to the dropdown menu – e.g. gameplay elements –enemies and
gems or physics – grid and ledges
Documentation needed for importing assets
Data visualisation techniques –
Player death
o Heatmap+pie chart
o Heatmap+datapoints
o Heatmap+Datapoints, Pie chart with further drill down
Players getting stuck
o Heatmap + datapoints or heatmaps but only at non-zero areas
o Heatmap – but colours can be confusing – is green the most common path?
o Heatmap for time waited + datapoints where they quit + display actual wait times
o Heatmap+points where player quit
o Heatmap(without zero data)+points
Time spent on each segment
o Bar chart
o Heatmap + bar chart (make sure that any anomalies on bar chart are representative of
difficulty, not the length of the area)
o Heatmap+Bar chart
Players reaching each segment
o Heatmap
o Heatmap+barchart
o Pie chart, heatmap
Collectibles found
o Datapoint overlay
o Datapoint overlay – colour based on regularity of gem found + shape based on
additional metric?
o Datapoint overlay – also show what type the gem is to give information on why it
was/n’t reached – difficulty v. value
Additional comments
o Allow combining multiple filters for multiple overlays
o Allow players to write comments
o Export visualisation images to external files for easy sharing
o Render only player layer for data vis to avoid confusion
Quotes –
“Data visualisation makes it much easier to understand information and would greatly enhance
productivity”
“A tool like this would eliminate bottlenecks and streamline development by enabling designers to
create the level on their own while programmers can focus on other tasks”
“The tool makes it really easy for people with no coding knowledge to mock up a level on their own
and test an idea without any problems”
“The ability to see the level as a whole and receive player data is an excellent way to improve design”
Ordered feature list:
Needs:
Indent Palette elements so that they line up with dropdown box (elements start under
dropdown box arrow)
Rename ledges and grid – there’s a confusion with the terms
Show ledges in every mode (translucent when not in ledge mode) – maybe add toggle
Highlight palette item with a border/box and highlight the ledge along with it
Highlight player layer for adding layers to make it obvious what elements they should
follow/player icon next to layer name
Consider rename button/pop up box and/or changing cursor when hovering over editable area
or putting a box around it when editing/pop up dialog
Consider STOP button instead of PAUSE, or both with different effects
Lock vertical scroll in editor as it’s confusing and barely used – maybe allow control with
keyboard but not with mouse. Or switch scrolling to keyboard entirely?
Add a grid for measuring
38
Likes:
Change UI button colours to stand out more
Make editing mode dropdown menu bigger/more obvious
Tutorial bubbles
Add ability to reorder elements on a layer (bring them forwards or back)
Allow element to be selected (remain selected even if mouse isn’t over it) which would then
allow for
o pixel perfect movement with arrow keys
o delete button on UI to delete element
o display an interaction widget/gizmo with rotate/scale/transform
Scrolling sideways with RMB is not obvious alternatives suggested include middle mouse
button or UI button. First guess was LMB.
Add ledges to the list as they are being created to avoid confusion
Cosider allowing right click to finish a ledge and start the next rather than having to click on
the palette
Allow for editing individual vertices in ledges
When editing game elements, layers shouldn’t lock, or only middle layer should render?
Saving and loading confusing, all dialog popup after buttons are clicked
Ability to import own assets
Intro tutorial/walk through would be useful, pop up bubbles
Seach bar for finding assets would be very useful
Include a physics attribute editor for changing gravity, speed etc values
Element manipulation gizmo for scale/rotate/translate
Collision editing is not the best, needs SHIFT+click to draw straight lines at 0/45/90 degree
angles.
Level elements could snap to each other so no gaps occur
Show a frame around starting game camera view
Show a preview window with live scales
Show character size for reference
Change names of game elements and physics objects
Add an additional indentation to the dropdown menu – e.g. gameplay elements –enemies and
gems or physics – grid and ledges
Documentation needed for importing assets
Data visualisation final choices:
Player death
o Heatmap+datapoints
Players getting stuck
o Heatmap(no zero data)+datapoints where players quit
Time spent on each segment
o Bar chart (+Heatmap)
Players reaching each segment
o Heatmap+Bar chart
Collectibles found
o Datapoint overlay + name/type of gem
Additional comments
o Allow combining multiple filters for multiple overlays
o Allow players to write comments
o Export visualisation images to external files for easy sharing
o Render only player layer for data vis to avoid confusion
39
APPENDIX E
User Test 2 Protocol
Goal:
Measure usability and utility of the finished tool
o Is it easy to use?
o Does the data visualisation aspect add value to the editor and influence the
productivity of the user?
Discover limitations and future improvements
Location: University, White Space
Time: Week of April 22nd
Duration: approx. 30 minutes
Tools:
Laptop with final version of project
Finished test level and dataset
Consent forms
Task list and interview Qs
Participants:
Graham Hill
Fraser Clark
Gregor Fergusson
Protocol:
Before:
Candidate briefing – consent form
During:
Task based Interview:
Play through the pre-built level
o Did you find it difficult? Why?
o Did the level flow smoothly?
o What would you change if you were the designer of this level targetting a wide
audience with varying skillsets?
o How would you usually go about balancing a level design?
Look at the analytics and play around with it
o Is it clear what is being represented by the visuals?
Find a hotspot where many players died.
Find out whether level segments are balanced in length and difficulty.
Are collectibles found/collected by everyone?
o What can you tell from these visuals? Anything more than what you saw
without them?
After: Candidate Debriefing
40
APPENDIX F
User Test 2 Results
Candidates: Graham Hill, Fraser Clark, Gregor Fergusson
Feedback:
Testers were very pleased with the UX changes and extra features added after the previous test
session.
Application was found to be more user friendly and commercial looking
Testers were not aware of any packages available that would provide similar analytics to aid
the design process. While they were familiar with the concept and were aware of AAA
companies using similar techniques (in-house), they don’t know of any solutions readily
available to purchase/use.
Testers resorted to personal playtesting alone (not unbiased) in the majority of cases in order
to balance levels created. When asked about catering for players with varying skillsets they
relied entirely on theories of what is conceived more/less difficult.
The solution proposed, including built in analytics, was considered to be a very useful addition
to traditional level design practices and a clear improvement over balancing through
playtesting alone.
Features to implement:
Move segment anbalytic graphs into menu to make it more obvious what they represent and
where users can find them
Ability to scroll the map with WASD keys in the editor
Add an additional screen-frame to the editor that scrolls along to remind the user of the screen
constraints at all times.
Render foreground objects with reduced alpha when editing physics ledges in order to reduce
obstruction and improve visibility.
Allow the display of all layers in analytics mode to reveal problems caused by any object.
Future work:
Ability to easily load custom content packages to extend the palette of assets available.
Improvements to physics painting system:
o Ability to draw straight lines while holding the SHIFT key (0, 45, 90 degrees)
o Ability to move ledges and/or internal nodes after placment
o Adding box and/or wall collision to complement painted/line collision
Implement physics attribute editor to include easycontrol over player jump height/speed, run
speed etc.
Implement scaling and rotation of elements
41
APPENDIX G
API Plans
API – data collection/visualisation
•
Information to collect
Player ID
Player coordinates
Level info
Difficulty
Version number
Where players died - coordinates
How did player die - falling/enemies
Time stamp
Time elapsed since start of level segment
Time elapsed since session start (differs from above if there are more than one levels)
Did the player reach the end of the level?
If not, where did they quit?
Have they been standing idle (no input without pausing) for more than 20 seconds?
Have they died at the same position and/or in the same way more than 3 times in a row?
Has each of the power-ups/collectibles been collected
• Visualisations:
Map overlays (e.g. heatmap)
o Player deaths
o Players getting stuck
o Character paths?
o Areas un/explored
o collectibles never found
Bar chart
o Time spent on each level/segment by single/all player(s)
o Sessions length (total played before quitting)
Pie chart
o % of players reaching end
o % of collectibles found
Options:
•
Toggle display of each individual type of data
Filter data based on (1.) above
Clicking on individual data points in visuals will display additional data (1.)
Each field in additional info can be clicked to change filter to selection
__________________________________________________________________
Initialize()
{
if log file exists
open
else create
}
LogData(event) -(called when event flags happen)
{
Write to file:
Player ID
Player coordinates
Time stamp
Level info and difficulty
42
Prototype version number
Event flag: enum{died/quit/level complete/powerup collected or used, enemy
killed/...}
}
Update&Render Visuals()
{
Iterate through every entry in log file
Filter data based on properties given (e.g. Date range, select player ID, version number etc)
Render appropriate visual:
renderHeatMaps(filter)
renderBarChart(filter)
renderPieChart(filter)
}
renderHeatMaps(filter)
{
Render full level to image
Convert filtered data (world) coordinates to image coordinates (x/xMax, y/yMax; as image
coordinates are between 0 and 1)
Render coloured dots on the map at appropriate locations
If(data point is clicked)
Bring up additional information
}
renderBarChart(filter)
{
Draw grid
If dataCount is less than 10
Then for each data:
Draw rectangle(height: data value)
Else Average data into 10 clusters
And for each draw rectangle(height: average data value)
}
renderPieChart(filter)
{
Set percentages based on data values
Set a colour for each discrete data value
Convert percentages to sum up to 360 (full circle)
Draw pie chart accordingly
}
Challenges:
Deal with large amount of data – efficient search, sort, compare
UI optimisation and preventing user from getting lost in the data.
43
Priorities:
Information
Visualisations
Options
Need
-Player Coords
- Where player died
-How player died
- Time spent on
segment
- Where player
quit?
- Player death
- Time spent on
segment
- Players stuck
-Toggle display of
each type of data
Want
- player ID
-Collectibles found
- has player been
standing idle?
-Level info
Like
-Difficulty
-Version number
-Character path
-Collectibles
not
found
- Areas unexplored
- Session length bar
chart
-Filter data
-Clicking on a data
point will bring up
additional
information
Pie chart of
-% players reaching
end
- % collectibles
found/used
44
-Interactive
filter
tags to browse data
intuitively
45
REFERENCES
REFERENCES
Alexander, C.1977. A pattern language: Towns, buildings, construction. Oxford
University P.
Bartle R., 1996. Hearts, Clubs, Diamonds, Spades: Players Who suit MUDs.
http://www.mud.co.uk/richard/hcds.htm
Canossa, A. 2013. Meaning in Gameplay: Filtering Variables, Defining Metrics,
Extracting Feature and Creating Models for Gameplay Analysis. In: Drachen A., Seif
El-Nasr M., Canossa A. Game Analytics - Maximizing the Value of Player Data.
Springer-Verlag, London
Chua, C. K., Leong, K. F. and Lim, C. S. 2003. Rapid prototyping: Principles and
applications. London: World Scientific Publishing.
Drachen, A. Game Data Mining: Fundamentals. Game Analytics Blog. (2012)
Available at: http://blog.gameanalytics.com
Drachen, A., Schubert, M. 2013. Spatial Game Analytics. In: Drachen A., Seif ElNasr M., Canossa A. Game Analytics - Maximizing the Value of Player Data.
Springer-Verlag, London
Drachen A., Seif El-Nasr M., Canossa A. 2013. Game Analytics - Maximizing the
Value of Player Data. Springer-Verlag, London
Fields T. V. 2013. Game Industry Metrics Terminology and Analytics Case Study. In:
Drachen A., Seif El-Nasr M., Canossa A. Game Analytics - Maximizing the Value of
Player Data. Springer-Verlag, London
Gagné, A., Drachen A., Seif El-Nasr, M. 2013. Sampling for Game User Research. In:
Drachen A., Seif El-Nasr M., Canossa A. Game Analytics - Maximizing the Value of
Player Data. Springer-Verlag, London
Graham, D. 2012. In-Game Debugging and Visualization Tools. GDC 2012.
Guardini, P., Maninetti, P. 201. Better Game Experience Through Game Metrics: A
Rally Videogame Case Study. In: Drachen A., Seif El-Nasr M., Canossa A.
Game Analytics - Maximizing the Value of Player Data. Springer-Verlag, London
47
Han, J., Kamber, M., & Pei, J. 2005. Data mining: Concepts and techniques (2nd ed.).
San Francisco: Morgan Kaufmann.
Isbister, K. and Schaffer, N. 2008. Game usability: Advice from the experts for
advancing the player experience. London: Morgan Kaufmann/Elsevier.
Johnstone, G. Environment art and level elements used in editor [Art] Produced as
part of Group Project module. 2012.
Kim, J. H., Gunn, D. V., Schuh E., Phillips, B. C., Pagulayan, R. J., & Wixon, D.
(2008). Tracking Real-Time User Experience (TRUE): A comprehensive
instrumentation solution for complex systems. In Proceedings of the Computer-Human
Interaction (CHI) (pp. 443–451), Florence, Italy.
Lameman, B. A., Seif El-Nasr, M., Drachen, A., Foster, W., Moura, D., & Aghabeigi,
B. 2010. User studies – A strategy towards a successful industry-academic
relationship. In Proceedings of future play 2010 (pp. 1–9) . Vancouver: ACM
Publishers. doi:10.1145/1920778.1920798
Larose, D. T. 2004. Discovering knowledge in data: An introduction to data mining.
Hoboken: Wiley-Interscience.
Madigan J., 2010. Analysis: The Psychology of Immersion in Video Games.
Gamasutra.com
Maxis, 2011. The Sims Medieval. [PC] USA: Electronic Arts
McCandless, D. The beauty of data visualization. 2010. TED Talks
Medler, B., John, M. and Lane, J., 2011. Data cracker: developing a visual game
analytic tool for analyzing online gameplay. Proceedings of the 2011 annual
conference on Human factors in computing systems 2011. New York, NY, USA:
ACM, pp. 2365-2374.
Medlock, M. C., Wixon, D., Terrano, M., Romero, R. L., & Fulton, B. (2002). Using
the RITE method to improve products: A definition and a case study. In Proceedings
of the Usability Professionals Association, Orlando, Florida.
Mellon, L. 2009. Applying metrics driven development to MMO costs and risks.
Versant Corporation, Tech. Rep
Microsoft. 2010. XNA Framework [software] Version 4.0. Available online.Redmond,
Washington: Microsoft Corporation.
MonoGame Framework [Open source software] Version 3.0.1, 2013
Nacke, L., & Drachen, A. 2011. Towards a framework of player experience research.
In Proceedings of the 2011 foundations of digital games conference , EPEX
11 . Bordeaux, France.
48
Nielsen J., Molich, R. 1990. Heuristic Evaluation of User Interfaces. Proc. ACM
CHI’90 Conf. (Seattle, WA, 1-5 April), 249-256
Norretrander, T. 1999. The User Illusion: Cutting Consciousness Down to
Size.Penguin Books.
Rouse, R. 2005. Game design: Theory and practice. Wordware.
Salen, K. and Zimmerman, E. 2004. Rules of play: Game design fundamentals.
Cambridge, Mass: MIT.
Santhosh, S, Vaden, M. 2013. Telemetry and Analytics Best Practices and Lessons
Learned. In: Drachen A., Seif El-Nasr M., Canossa A. Game Analytics - Maximizing
the Value of Player Data. Springer-Verlag, London
Schell, J. 2008. The Art of Game Design: A Book of Lenses. Elsevier/Morgan
Kaufmann, London
Semenov, A. Character art used in editor and game [Art] Produced as part of Group
Project module. 2012.
Shneiderman B., Plaisant C. 2005. Designing the user interface: Strategies for
Effective Human-Computer Interaction. Pearson/Addison Wesley. London
Thomas, J., & Cook, K. 2005. Illuminating the path: The research and development
agenda for visual analytics. Los Alamitos: IEEE Computer Society.
Ubisoft Entertainment. 2012. E3 trailer for Watch Dogs. [video game trailer]. E3.
Screened 04/06/2012.
Victor, B. 2012. Inventing on Principle. CUSEC 2012.
Visceral Games. 2011. Dead Space 2 [Xbox360] USA: Electronic Arts.
Wirth et al. 2007. A Process Model of the Formation of Spatial Presence Experiences.
Media Psychology, 9, 493-525
Witten, I. H., Frank, E., & Hall, M. A. 2011. Data mining: Practical machine learning
tools and techniques. The Morgan Kaufmann Series in Data Management Systems
(3rd ed.). Morgan Kaufmann.
Zoeller, G. 2010. Development Telemetry in Video Games Projects. GDC 2010.
49
BIBLIOGRAPHY
BIBLIOGRAPHY
Alexander, C.1979. The timeless way of building. New York, NY: Oxford University
Press.
Bernhaupt, R. 2010. Evaluating user experience in games: Concepts and methods.
Larman, C.2004. Agile and iterative development: A manager's guide. London:
Addison-Wesley.
McConnell, S.1996. Rapid development: Taming wild software schedules. Redmond,
Wash: Microsoft Press.
Pruett, C. Hot Failure: Tuning Gameplay With Simple Player Metrics. (2010)
Available at http://www.gamasutra.com
Weibel D., Wissmath B. 2011. Immersion in Computer Games: The Role of Spatial
Presence and Flow. International Journal or Computer Games Technology Volume
2011
51