1
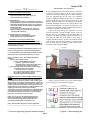
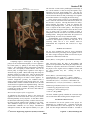
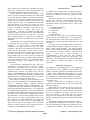
Session T4D A Windmill Competition in a Freshman Engineering Design Class Charles A. Gaston Penn State – York, cag9@psu.edu Abstract - Many freshmen these days have never had to solve an open-ended problem or design an experiment or build something or work in a team to solve a problem or describe a process in enough detail for someone else to replicate it. Many also have very limited understanding of how to apply physics and algebra. No short series of exercises can close all such gaps, but the sequence presented here at least addresses them all. There are two distinct phases in this exercise: (1) investigation of some of the properties of a windmill, and (2) design and construction of a windmill intended to generate as much power as possible. Both phases are very open-ended; instructions are minimal, so students are expected to think about what they need to do. The basic equipment required is a Windmill Test Apparatus capable of measuring torque and speed, a Test Windmill with adjustable flat blades, and a fan to supply the repeatable wind. The project is introduced with a review of physical measures, units and relationships, and is ended with a competition. Teams vie for best scores in such criteria as highest power, highest power-to-weight ratio, lowest testing time and closeness to predicted power. Scoring of the competition, with its multiple categories, weights and penalties, is complex enough that a spreadsheet is used to process the raw data. The instructor’s spreadsheet is used for actual scoring, but as a separate, related learning experience, each student is asked to create a functionally equivalent spreadsheet. This integrated project includes at least a review of physics, experiment design, data collection, analysis, plotting, report writing, following a design process, teamwork, and physical construction. It has been used in a freshman engineering design class for at least fifteen years, with continual improvement. based on a skill-and-interest survey taken the first day of class. Each student is asked to indicate his or her level of skill and interest in each of a page-long list of categories. Items include leadership, programming, math, finding information and building and repairing things. Every team should have at least one person who self-rates a 9 or 10 in the building and repairing categories. Math and leadership abilities also should be represented on each team. In addition to team assignments, that survey flags people with little skill or interest in typical engineering strengths for one-on-one guidance counseling. Someone who isn’t interested in math, programming or building things probably should not be in engineering. Before the Windmill Project is introduced, I spend about an hour reviewing physical quantities, units and relationships. Starting with a blank blackboard, students are urged to name various physical units. Each time one is named, that unit is added to a list of similar ones, or a new category is established. Categories include distance, velocity, energy (work), power, torque, etc. Under a category heading, applicable units are added, both metric and American. A fairly complete list can be obtained with appropriate prompting, such as, “When you pay for electricity, what are you buying?” or “How do you specify the tightness of an engine bolt?” By the time the process winds down, the units of Newton-meters will appear under both Energy and Torque. Then the class is asked, “We have the same units for Energy and Torque. Are they the same? If not, what’s the difference?” Ultimately, formulas for torque and energy are developed, and linked to formulas for power. This establishes the principles needed to measure torque and speed of a windmill and calculate its power. Index Terms – Comprehensive project, Integrated project, Physics, Windmill, Wind turbine. After the physics review and assignment of teams, students are given a one-page outline of the Windmill Project (covering both stages), as shown in Figure 1. They also are given a multi-page format for a lab report (not shown here). Teams are encouraged to organize themselves for the lab phase, make sure they know how to contact each other, and schedule mutually acceptable times to do the necessary experimentation. For the past two years the classroom used has been big enough to accommodate the windmill test stand; previously it was in a separate lab. The class includes a lot of self-directed time, but not enough for all teams to do all their experimentation during class time. INTRODUCTION, TEAMS, PHYSICS Engineering Design 100 has no formal prerequisites; however, I advise students on the first day that if they have tested into a remedial math or English course, they might want to postpone taking EDSGN 100. Algebra is used extensively, and there are several reports to be written. The Windmill Project described here includes both. There are many ways to select teams for student projects. I attempt to create “balanced” teams of four to six, INSTRUCTIONS GIVEN TO STUDENTS 5th First Year Engineering Experience (FYEE) Conference T4D-1 August 8 – 9, 2013, Pittsburgh, PA Session T4D EDSGN 100 FIGURE 1 WINDMILL DESIGN PROJECT THE WINDMILL TEST APPARATUS _ Goals of a two-stage windmill project: 1. Develop math & physics skills Force, torque, power, work, speed, angle, etc. Unit conversions and calculations 2. Develop lab skills Define experiment (# tests? what parameter variations?) Set up experiment (get needed equipment, assign duties) Read and understand manuals (how to use equipment) Collect data (modify experiment design, if appropriate) Plot & analyze data Draw conclusions (what was learned? surprises?) Report on experiment (follow lab report format; info should permit replication)) 3. Develop design skills and teamwork Follow all steps of a five-step design process Design, build and test a powerful windmill Instructions for a two-stage windmill project: Stage ONE (investigate a windmill; produce a lab report): 1. Get the team together to create a plan, compare schedules and divide jobs. (Some must be able to meet for experiments some time outside of class.) See the UNIQUENESS section near the end for a discussion of how this apparatus differs from the typical motor-asgenerator setup for determining power of small windmills. From the beginning this lab has used a test apparatus capable of handling windmill heads nearly 36” in diameter with horizontal axles that are clamped in a drill chuck. The directly measured parameters are applied load (grams) producing tangential friction on the rotating shaft of the chuck, and speed (RPM). From those two parameters (one controlled, one measured) and the constant shaft diameter it is possible to calculate torque and power. Figure 2 shows the current Test Apparatus, as it is set up in the classroom. The fan providing wind is at the left; near the center a test windmill with adjustable blades is clamped in the black drill chuck, which is mounted on a long shaft; the right end of the shaft is where string is wrapped around the shaft to provide a measurable friction load. Near the right end (but shielded) is a magnet rotating with the shaft, plus the stationary pickup of the bicycle speedometer that will indicate RPM. FIGURE 2 6TH GENERATION WINDMILL TEST APPARATUS 2. Read and understand the recommended format for a "lab report", including the hints on good experimental practice. 3. Use experimental system and modular windmills to collect required data, plus any extra data useful for your design. (date) - "Lab Report" due on experiments with modular windmill. Minimum requirements include: (1) graph of speed (RPM) vs blade angle (0 to 180 degrees) with no load; identify (possibly in notes) the angle(s) where speed crosses zero (rotation reverses); ------[The remaining results are for 45 degree blade angle]-----(2) a graph of speed vs load (grams) (from zero load to zero speed); (3) a graph of torque (Newton-meters) vs speed; (4) a graph of power (watts) vs speed. Clarify other procedures & parameters. Stage TWO (design, build, test a windmill; produce a design report): 4. Design and construct a windmill head, with the goal of generating as much power as possible. Keep records of your design process, as needed for the Design Report. Predict the number of watts your windmill will generate when tested. Your windmill designs should be based on what you learn and can extrapolate from experiments with the modular windmills, plus anything you learn from researching the literature. Construction should not involve tools more sophisticated than a table saw and drill press, and blades from commercial fans are not allowed. No team should have an unfair advantage because of “connections” to machine shops. Figure 4 provides a better view of the friction-loading system, but Figure 3 shows the basic principle. FIGURE 3 FORCE BALANCE FOR FRICTION TORQUE LOADING (date) - Turn in report on the windmill design process. (Follow the format given in "Design Report Guidelines". This is practice for a major design project later, but significantly shorter reports are expected here.) (date) - Have windmill ready for the in-class competition. _____________________________________________________ 5th First Year Engineering Experience (FYEE) Conference T4D-2 August 8 – 9, 2013, Pittsburgh, PA Session T4D FIGURE 4 FRICTION-LOADING END OF WINDMILL TEST APPARATUS The first four versions used a parallelogram with strings as the vertical members to close the loop and separate wraptightening force from torque-loading force. The first five versions all used the longest available 3/8” fine thread bolt to hold the drill chuck, but that put bearings close together and left little shaft free for wrapping the friction string. In the current version, a long 3/8” rod is threaded at one end to match the fine thread of the drill chuck (which, for the first time, is keyless). The long shaft allows for widelyspaced bearings and plenty of room for wrapping the friction string multiple times. (The more wraps, the less force is required on the tension pulley.) This design also assures that loads are applied off the end of the table, where size of spring scale or length of hanging weights is unimportant, and such activities are well removed from the spinning blades. Swing-out boards allow the system to be clamped solidly to a table of any reasonable width. Transportability is not completely overlooked. Major sections are held together by bolts with wing nuts. It is extremely stable, but in a few minutes could be disassembled into components that could fit in a large suitcase. POWER CALCULATIONS For any given windmill test, data for power calculation consists of the Load (grams hung from or applied to one of the white strings) and Speed (RPM read from the bicycle speedometer calibrated as km/hr*10). Power (Watts) = Load (grams) * Speed (RPM) * 4.89*10-6 Comparing Figure 4 with Figure 3, the large white pulleys are the fixed and tension pulleys. Force is applied to the tension pulley by pulling on the metal ring hanging below it. The connecting string is wrapped once around the smaller, low, fixed pulley to assure that the force on the tension pulley is straight down, regardless of the angle at which the ring is pulled. White load strings have loops for attaching weights or a spring scale. They tie into the main pulley loop at large S-hooks, and eye bolts prevent the Shooks from traveling too far when a load is applied. To maintain straight-line geometry, the windmill shaft is always wrapped with the string passing on the left. If the windmill rotates counter-clockwise from this view, the load would need to be applied to the right-hand string. Once the load is applied and the windmill is spinning, the metal ring is pulled just enough to balance the forces with neither Shook touching its eye bolt. That conversion factor has units of W/(g*RPM), and appears in the spreadsheet used during the competition, but students are expected to know how to calculate it, thanks to the physics review, algebra reviews, emphasis on units, and any other questions they ask. (Asking for help is encouraged.) Power (Watts) = (Newtons*meters/seconds) Load (Newtons) = (kg * 9.81 m/s2) = (grams * 0.00981) Surface speed (m/s) = (RPM)*(1 min/60 s)*Circumf (m/rev) Circumference (m/rev) = 2π (rad/rev) * shaft radius (m) Shaft radius (m) = 3/16 (in) *(2.54 cm/in) * (1 m/100 cm) 0.00981(N/g)*1/60(min/s)*2π(1/rev)*3/16(in)*0.0254(m/in) = 4.89252*10-6 (N/g)(min/s)(1/rev)(m) = 4.89252*10-6 (N*m/s)(min/(g*rev)) ≈ 4.89*10-6 (W)/(g*RPM) Historical development of the test apparatus As indicated in the caption for Figure 2, the current test apparatus is the sixth version built. The very first version had transportability as a key objective. In less than a minute the drill chuck and bearing assembly could be removed, and the frame could be collapsed into a bundle of 1x2” sticks. That minimalist design was not particularly stable, and student-made windmills are not always well-balanced. Subsequent versions all had improved stability as a goal. Of course, students typically calculate the conversion steps one at a time rather than working out the complete factor. LAB REPORT PRESENTATIONS The instructions for the lab portion of the project are deliberately not “cookbook style”. Notations in both the project instructions and in the description of a lab report point out that enough information should be recorded to 5th First Year Engineering Experience (FYEE) Conference T4D-3 August 8 – 9, 2013, Pittsburgh, PA Session T4D allow someone else to replicate the experiment and get the same results. Nevertheless, I would be surprised if any team of freshmen actually achieved that on their first try. On the due date for the lab reports (Stage 1 of the project), all teams are asked to sketch their first graph on the board. (This should plot RPM as a function of blade angle varying from 0 to 180 degrees.) When all are displayed, we discuss why teams given identical instructions got such radically different results. It is important that this be done with good humor, as a puzzle to be solved, not as an indictment. Eventually they realize that each team was free to pick a “zero angle” for the blades. Some make zero be parallel to the axis of rotation, while some pick perpendicular. It matters also whether the blade angle advances clockwise or counterclockwise. The fan has three speeds, and not all teams use the same one. As each of these possible differences is recognized, I ask each team which option they chose, and whether their report includes that detail. Occasionally a team will reason that they can save time by collecting data for 90 degrees of rotation and simply mirroring it. It doesn’t work, as they realize upon comparison with teams that did the full 180 degree experiment. The data is not symmetrical, because the wind produced by the fan includes a vortex. There is a zerospeed point when blades are perpendicular to the axis, but the other zero point is ten or fifteen degrees away from being parallel to the axis. Often “speed” is plotted as an absolute value, but the lack of symmetry makes it important to track the direction of rotation. The instructions clearly asked them to identify zero crossings, but most teams overlook that. As the other three required plots are put on the board, discrepancies of other types may be revealed. If Excelbased data is not displayed as a “scatter plot”, unequal spacing can produce very misleading curves, and nonsequential data collection can produce curves that are garbage. Misunderstanding of formulas or units for torque and power can yield results that are orders of magnitude off. Students do not always understand that “plot A vs B” means that B is on the horizontal axis and A is vertical. This activity of putting up graphs and seeing if they make sense has never failed to reveal multiple examples of errors in experiment design, equipment operation, documentation, calculation, plotting or interpretation. It is my philosophy that people learn more from errors than from following detailed instructions properly, so I consider this an excellent learning opportunity. Then it is pointed out that the schedule in the syllabus includes a future item, “Revised lab reports from 2 weeks earlier”. (Hardly anyone notices that beforehand.) I do not collect anything on the first due date; they have two weeks to improve their reports on the basis of what was revealed by that public review of the four plots. Reports may require as little as simple addition of details left out, but some will require review of formulas that gave obviously erroneous results, replotting of some of the graphs, or even additional data collection. WINDMILL DESIGN It is difficult to get “engineer-types” to postpone thinking of solutions to a design problem, and too often an approach will become “locked in” before the problem is fully understood. The class is introduced to a five-step design process, and is given a format for a Design Report that is clearly different from the previous Lab Report format (but occasionally someone will confuse the two). Here are the five steps: (1) Problem Identification (2) Preliminary Ideas (3) Refinement (4) Analysis (5) Final Solution This certainly is not the only way to subdivide the design process, but it is one reasonable way. I try to get teams to pay particular attention to the earlier steps, but there is a strong tendency to jump to the final design stage on a “gut feel” basis. The design process and report format are based on a “National Design Graphics Competition” that used to be held at ASEE annual meetings. The detailed grading scheme is based on one that I developed to make judging for that Competition a bit more objective. Each team must produce a report with a written description of accomplishments in each of the five steps, including graphics corresponding to each of the last four steps. The Lab Report and Design Report are graded with English errors marked, to address that aspect of the entire experience. WINDMILL COMPETITION The highlight of the windmill project is the competition where teams pit their windmill creations against one another. Sometimes spectators from outside the class come to watch. This competition counts roughly 4.5% of the semester grade (not a killer, but not insignificant). Students are warned that it is technically possible for every team to get more than 100%, but a really good team can drive poor teams below 50%. Figure 5 shows how the competition will be run. Students get this handout near the time of the initial Lab Report presentations. When EDSGN 100 is offered in the evening, the class runs three hours twice a week. That provides enough time to do all the testing in one evening. When the class runs in the day, it is scheduled for two hours, three times a week. Two hours generally is not enough time for adequate testing, so on the competition day we plan to start early or end late, typically taking up part of the lunch period for that one day. The handout containing the test procedure (Figure 5) also includes the scoring rules shown in Figure 6. After the first trial, teams should be using trial opportunities for two or possibly three purposes. They should be trying for the 5th First Year Engineering Experience (FYEE) Conference T4D-4 August 8 – 9, 2013, Pittsburgh, PA Session T4D maximum possible power, and they should be trying to determine the correct load to match their prediction on the last trial. Both can be accomplished by using enough different loads to flesh out a power-vs-load curve. If a windmill has adjustable blade angles, this may help in reaching maximum power, but adds an additional dimension to the search pattern. FIGURE 5 IN-CLASS TESTING OF “HIGH-POWER” WINDMILL DESIGNS _ 1. An order will be established in which the different teams' designs will be tested, and that order will be repeated as often as time allows. 2. Each team in turn will clamp its windmill in the tester, set up the desired torque loading and any other variable parameters, measure speed and calculate power using the instructor's spreadsheet. 3. Torque loading will be determined by weights, not a spring scale. Each team can select for its trials the weights deemed likely to yield the greatest power (or the most information about the load-to-power relationship). Except for the first and last trial, tests are done in pairs, with two different loads. 4. The sequence of actions for a single trial is summarized here: a. PREPARATION: (in no particular order) Mount windmill Put on safety glasses Set desired distance and alignment between fan and windmill Attach desired weight to the correct hanging cord b. TESTING: (1) Assure that no one is in line with windmill blades at any time during testing (2) Turn fan on to "High", let windmill get up to speed (fan and stand may be held, but not moved) (3) Tighten cord loop (with metal ring) to keep both S-hooks away from their stops (4) Wait for speed to stabilize, then start averaging (5) Record 10-second-average RPM, and loading weight c. SAFETY: (1) Turn off fan (2) Use string drag (not hands!) to stop windmill d. REPEAT: Using a load at least 10% higher or lower than for the first test, repeat steps b thru c. (Does not apply to first or last trial.) e. CLEAN-UP: (in no particular order) Remove windmill Replace safety glasses on table Return weights to table Unwrap string from shaft f. RESULTS: Enter data in spreadsheet, including time from first touch to last touch. ______________________________________________________ Historical results Students have used a remarkable variety of materials in constructing their windmill blades, including Tide boxes, FedX mailing envelopes, aluminum flashing, coat hangers, saran wrap, balsa, pine, flooring vinyl, Styrofoam and fiberglass. There was a semester when no team generated much more than one watt, and a semester when no team generated less than five watts. It represents a real lack of effort when a team’s predicted power is less than that achieved during the lab phase with the inefficient test windmill. A few windmills have shed blades during testing, so it is vital that no one be in line with the spinning blades. One flying blade poked a hole in the insulation of a ceiling duct. More than one took chunks out of the table. So far nothing has flown horizontally, but safety precautions must be stressed repeatedly. FIGURE 6 SCORING OF THE WINDMILL COMPETITION _ Grading will be based on six different measures, three of which are related to each team's predicted power. a) b) c) d) e) f) 15 points for the highest predicted power; other teams get points proportional to their predictions vs the highest. 10 points for exactly matching predicted power on first trial. (If not exactly matching, reduce points by multiplying by the ratio between predicted and measured power.) If setup or calculation errors result in zero power on the first attempt, points for (b) will be based on the first successful trial, then halved. 35 points for exactly matching prediction on last trial. (Reduced proportionally as in first-trial matching, and similarly halved if the first attempt fails.) 40 points for the highest power measured on any trial by any team; other teams get points proportional to their best power vs the highest. 15 points for the best power-to-weight ratio; others proportional. 5 points for the minimum total time for testing, not counting the first or last trial. (Other teams score proportionally to the inverse ratio of times.) If no team accumulates 100 points, all scores will be scaled to give the best team 100. Because an unreasonably high predicted power can affect other teams as well as the one in error, predictions may be modified after the first successful trial, with these restrictions and penalties: (1) An unreasonably low prediction may be increased to 120% of the power actually measured in the first successful trial, but the original prediction will be used to calculate the points in (a). (2) An unreasonably high prediction may be reduced to 120% of the power in the first successful trial, but then the points in (a) will be based on the ratio of reduced to original prediction, or 0.5, whichever is lower. The highest final prediction (revised or unrevised) will be considered "best" when calculating points in (a). CONCURRENT RELATED ACTIVITIES & ASSIGNMENTS This freshman engineering design course includes so many topics that I regularly describe it as “ten pounds in a fivepound bag.” Listed below are the topics and assignments that are independent of the windmill project, but support it. Excel ® Most students have had some exposure to Excel or a similar spreadsheet program in high school or on the job, but some have not. (Our campus has many non-traditional students.) Excel is introduced very early in the semester, and there is an assignment to create a simple spreadsheet for tracking a cross-country auto race. From inputs of (1) date and time of “pit stop”, (2) odometer reading and (3) quantity of fuel added to the tank, the spreadsheet must calculate 5th First Year Engineering Experience (FYEE) Conference T4D-5 August 8 – 9, 2013, Pittsburgh, PA Session T4D average speed and fuel economy for the leg and since start, in both metric and American units – eight values for every leg of the race. When the competition scoring rules (Figure 6) are introduced, there is a second Excel assignment. The scoring is complex enough that a spreadsheet is almost essential. My version is available to them; it incorporates many more complex and advanced features such as nested IF statements, MAX, MIN & SUM functions, formatting of text, background and borders, and Freeze Panes. Each student is asked to replicate the function of that spreadsheet without direct copy-and-paste from mine. Ideally, they should understand how the spreadsheet implements the scoring rules; nevertheless, they may look at my formulas, but must retype them. The pedagogical concept is that knowing what is possible will enable them to apply it in the future, using Help when necessary. SolidWorks ® SolidWorks, a 3-D CAD program, is introduced early in the semester, and increasingly sophisticated functions are introduced throughout the course. Creating a base shape from a sketch, adding bosses and making cuts are simple and intuitive enough that fifteen minutes of instruction is enough to get students started in using the program. By the time teams are designing their windmills, most are comfortable enough to do circular patterns and even assemblies when depicting their windmill designs. Nevertheless, hand sketches are considered completely acceptable in their design reports. Writing Periodically there is a “Quick Quiz” given in class. Students working in teams of two try to solve an engineering-related word problem as quickly as possible. Scoring ranges from 125 for the first team to 75 for the last team, with the distribution in between adjusted to make the median about 86. The most important point, repeatedly stressed during these quizzes, is that they should keep track of units during calculations. If formulas used or created to solve a problem do not yield the correct units, the number almost certainly is wrong. If the units are correct, the number might be, too. A second important principle is the value of sketches in clarifying a problem. One Quick Quiz deals with the weight of snow on a sloped roof. A clear sketch helps in understanding that snow depth is not measured perpendicular to the roof. There exists a stereotype that engineers can’t write, but I have worked with many engineers, including some raised in other countries, whose English skills were excellent. I consider good English an important part of communicating ideas in engineering, and tend to mark English errors even when it has no effect on the grade in an assignment. On the first day of class there are three activities related to writing. One, to be finished during the period, is a description of how something works, internally. Suggested topics include such things as a flush toilet, a retractable ballpoint pen, a three-way light switch and bicycle gears. This enables me to judge both technical understanding and writing skills. If the English is really bad, I ask the student to visit the campus learning center for help and try again. A second individual assignment is a report on some particular engineering discipline. A third is a team project reporting on symbols used in place of words in various disciplines. Feedback on all of these writing assignments, plus anything noted on other assignments, should help improve writing on the windmill design report. Sketching The design process Drawing with instruments has not been a part of this course for more than 15 years; however, sketching on graph paper remains an important way to develop and communicate ideas. The first sketching assignment presents students with a dimensioned 2-D drawing of a small turned part and asks them to sketch it on graph paper 20 times actual size. It seems simple, even to the students, to multiply by 20 and to measure off corresponding distances. Still, some sketches are so far removed from the actual shape that the differences can be spotted from across the room. Others seem OK at first glance, but have errors in observation (of the master), multiplication, measurement or block-counting) Most assignments in this class may be redone for higher scores, but for a maximum of 90% on a second try, 80% on a third try, etc. By the time students are working on their windmill design report, they should be beyond making gross errors in sketching. While teams are working on the lab phase of the windmill project, they also start on a separate exercise aimed at emphasizing and experiencing the five-step design process. The situation presented is that an accountant, Joe, got excited about solar energy, but didn’t know how to set up a system to make use of that “free” energy. Each of the five steps is addressed in sequence, by students working individually or in teams of two or three, as they choose. For Problem Identification, students are asked to imagine having a long conversation with Joe and come up with a problem statement that, if solved, would make Joe happy. Higher marks are given for those who recognize that they need to know something about where Joe lives. Solar systems may not be practical for his property. The Preliminary Idea stage asks them to identify many primary sources of “free” energy and multiple ways of making use of each source. Since these first two stages Algebra 5th First Year Engineering Experience (FYEE) Conference T4D-6 August 8 – 9, 2013, Pittsburgh, PA Session T4D require imagination and creativity, they cannot be redone for higher grades, but the rest can. For Refinement the students are told that Joe has settled on a waterwheel to make use of the free energy in the stream crossing his property. Their task is to identify and sketch a few key features of the wheel, such as the shape of the buckets and how the wooden wheel might be attached to the pipe axle to turn it. Analysis involves calculating the theoretical energy available in the stream, the amount of water that goes into each bucket and the estimated efficiency of their design. A specified rotation rate and simplifying assumptions make this less daunting than it may sound at first. The Final Design stage specifies the number of buckets and asks for a complete list of the board shapes necessary to build the wheel. It also requires recalculation of efficiency, and redesign if efficiency is less than 50%. This structured pass through the design process gives guidance and experience useful for the design report in the windmill project. UNIQUENESS More than seven hours of internet searching failed to turn up any example of torque application similar to the apparatus described here, in spite of the fact that an earlier version was described in 1998 [1]. The closest example [2] uses a string wrapped around the shaft of a Stirling engine to apply a load. A weight hangs on the lower end of the string, the upper end is supported on a scale, and the string is wrapped so that shaft rotation attempts to lift it. Tangential load is the weight minus the scale reading. An article on Prony brakes [3] shows the configuration in which a strap wrapped halfway around the shaft has spring scales attached to both ends. Again, the tangential load is the difference between two forces, and is measured and calculated, not set. The two-pulley system depicted in Figure 3 allows one to specify (by the single applied weight) the tangential friction force. Most descriptions of projects that involve measuring windmill output mount the blades directly on the shaft of a small DC motor that will act as an electrical generator. None that I found mentions the inefficiency of a small motor generating much less (or more than) than its rated power. Unfortunately, many described procedures have students varying parameters such as blade count and size (which could have a significant influence on power) while measuring only voltage (which is merely proportional to speed). One article [4] follows such tests with, “You will use your optimized windmill from the Lab to measure the actual power.” (Italics mine.) Even the relatively good KidWind sites sometimes fail to clearly distinguish voltage from power. One lesson [5] suggests that after all the voltage-based tests, students could measure current and calculate power. Since there is no resistor in the parts list, it would imply connecting the ammeter directly to the motor (generator), adding a large load that did not exist during the voltage tests. A site related to KidWind [6] ignores power both ways in saying, “When producing electricity, the goal is to make the rotor spin as fast as possible to spin the generator faster. When lifting weights, however, your blades need to provide lots of torque (muscle) not just speed.” The test apparatus described here appears to be unique in being easily able to apply a specific mechanical torque load continuously (not merely measuring an unspecified load via the difference between two measurements). It also is rugged enough to handle heavy, poorly-balanced windmills. Some procedures measure power by winding up a string bearing a weight, but those ignore start-up accelerations and have limited duration. SUMMARY The integrated windmill project described here uses unique test equipment and involves far more aspects of engineering education than usual. It touches on at least the following: Physics Algebra Writing Sketching CAD use Spreadsheet use Experiment design Data collection Data analysis Data plotting The design process Mechanical design Construction Teamwork Competition As mentioned before, this EDSGN 100 class covers many topics. Grading categories completely separate from the windmill project include Sketches, CAD models, Reports, Quizzes, Spreadsheets, a second Major Project and the Final exam. The Windmill Lab Report is worth 9% of the total course grade, while the Competition and Design Report are worth 4.5% each. The windmill competition is one place where a particularly good team can drive down scores of other teams, because most of the points are calculated relative to the best performance in the category. Still, the competition counts for only 4.5% of the final grade, and a team must do very poorly to score below 50%. Virtually every year there is some improvement made to the windmill project. Sometimes it is a minor clarification of instructions; sometimes (as this past year) it is a significant improvement in the test equipment. Next on the agenda is an improved test windmill head that will allow very accurate adjustment of the angle of the windmill blades, via meshing of the ridges on two poker chips as one is rotated relative to the other. 5th First Year Engineering Experience (FYEE) Conference T4D-7 August 8 – 9, 2013, Pittsburgh, PA Session T4D REFERENCES All were accessed as recently as 2013 July 10. [1] Gaston,C,A, Itzoe,L,V, Margle,J,M, “A Multipurpose Windmill Design Project”, 1998 ASEE Annual Conference, Session 1547. (Google title; link was too long to copy.) [2] http://www.stirlingengine.com/download/smart_stirling_ma nual.pdf, “Smart Engine User Manual”, © 2008 American Stirling Company [3] http://my.voyager.net/~jrrandall/PronyBrake/PronyBrake.ht ml, “How to build and use a Prony Brake to determine Horse Power” [4] http://www.infinitepower.org/pdf/No17%2096-817B.pdf “Wind Power Basics - For High School” [5] http://learn.kidwind.org/sites/default/files/windwise/V2/Les son-10.pdf, from www.WindWiseEducation.org [6] http://www1.eere.energy.gov/education/pdfs/wind_basicpvc windturbine.pdf, “Building the Basic PVC Wind Turbine”, U.S. Department of Energy, Energy Education And Workforce Development 5th First Year Engineering Experience (FYEE) Conference T4D-8 August 8 – 9, 2013, Pittsburgh, PA