1
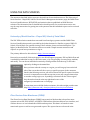
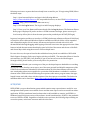
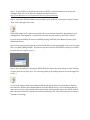
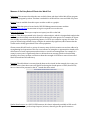
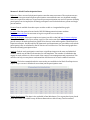
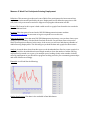
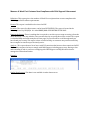
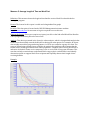
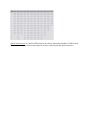
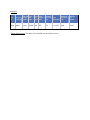
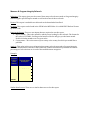
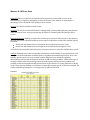
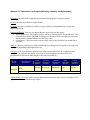
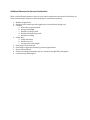
NORTH CAROLINA’S EFFECTIVE DATA USE TOOLKIT
VERSION 1.1
FEBRUARY, 2013
TABLE OF CONTENTS
INTRODUCTION TO THE TOOLKIT ............................................................................................................................. 3
FAQS BEFORE YOU START ............................................................................................................................................. 5
USING THE DATA SOURCES ........................................................................................................................................... 7
Measure 1: Re-Entry Rate of Clients into Work First......................................................................................... 11
Measure 2: Work First Participation Rates ............................................................................................................ 12
Measure 3: Work First Participants Entering Employment............................................................................ 13
Measure 4: Work First Customer Non-Compliance with Child Support Enforcement ........................ 14
Measure 5: Average Length of Time on Work First ............................................................................................ 15
Measure 6: Program Integrity Collections in Dollars ........................................................................................ 17
Measure 7: Amount of Program Integrity Claims Established....................................................................... 19
Measure 8: Program Integrity Referrals ................................................................................................................. 20
Measure 9: FNS Error Rates ......................................................................................................................................... 21
Measure 10: Penetration Rate (FNS) ........................................................................................................................ 23
Measure 11: Expenditures by Program (Monthly, Annually, and By Recipient).................................... 24
Additional Measures for County Consideration ................................................................................................... 25
INTRODUCTION TO THE TOOLKIT
Overview
The data collection, analysis, and reporting process can be daunting for county staff of any level. As
part of the Work Support Strategies (WSS) initiative, DHHS has partnered with county staff to
develop the Toolkit for Effective Data Use, whose goal is to provide staff with the tools identify
outcomes and measures as well as make sure that data is easily accessible. One of the original steps
that was part of the WSS Action Plan is:
5. Increase capacity for data collection and analysis. Specific indicators that are aligned
with WSS goals will be incorporated into state and county decision-making, shifting the
focus from compliance to outcomes and family-centered indicators. The WSS Leadership
Team will provide counties with technical assistance to incorporate this data into day-today operations.
This toolkit is designed to meet those goals and support rigorous data analysis to inform decisionmaking. Through the information contained here, county leadership can produce salient analyses
that will push your organization to think about how the data that already exists within your system
can be used differently.
The information contained below is designed to assist North Carolina’s County Departments of
Social Services: (1) easily find data that is pertinent to decision-making; (2) understand how to
interpret those data reports in a way that can be more meaningful; (3) build county-capacity for
managing with a data-driven practice
Based on your familiarity with reporting structures such as Client Services Data Warehouse, XPTR,
the UNC School of Social Work (SSW) Management Assistance Website, and the statistics pages of
DSS and DMA, as well as data utilization, running reports, and analysis, you may choose to use a
portion of this toolkit that is most relevant to you, or work through it from beginning to end.
This toolkit has been developed for all levels of county leadership, from DSS Boards, to Directors, to
managers and supervisors as well as staff with varying levels of data experience to provide support
from data collection to analyses and decision-making.
Sections
The toolkit that follows is laid out in easy-to-navigate sections. It begins with a set of frequently
asked questions so that staff have access to the answers to common questions about how to use the
toolkit, who should be using it, what they need to have before they start, and who to contact if they
have specific questions. Following the FAQs is an overview of each data source that describes the
process, systems, and login information for accessing each.
The measures themselves take up the bulk of the toolkit. They were selected by a group of county
and state staff selected as part of the Work Support Strategies project. This group was tasked with
identifying the questions that directors, administrators, managers, and supervisors should want
answered and should be using in daily and strategic decision-making. The information that is
included in this toolkit is broken down by specific measure and contains the following information
for each measure:
• Measures Title
• Definition
• Format
• Location
• Running the Report
• Analysis
• Example
• Similar Data Sources
To locate an electronic copy of this toolkit, as well as stay abreast of future versions, please visit the
Work Support Strategies website at: www.ncwss.com
FAQS BEFORE YOU START
Q: Who should work through this toolkit? This toolkit is designed for all levels of staff at local
county departments of social services, from line supervisors to Program Managers/Administrators,
all the way to Directors and Boards. We have designed this toolkit to hit at several of the key
measures that staff should be using in daily decision-making as well as yearly strategic planning.
This toolkit is also helpful to give to new supervisors so that they may become familiar with some of
the data points they need to manage.
Q: Do I need any special access or equipment? Yes, there are special requirements for Client
Services Data Warehouse (CSDW), many of which are the same as are required for running NCFAST.
Operating Systems
1. Windows 2000 SP4
2. Windows XP SP1 or SP2
Internet Browsers
1. Internet Explorer 6.0 SP1 or SP2
2. Internet Explorer 7.0
3. FireFox 2.0.0.6
Sun Java JRE
1. Java Runtime Environment (JRE) 1.6.0_41 (does not support 1.7.0_xx)
(to check to see if you have the correct version of Java, click here: Getting Started)
There is also special access that is needed if you are running XTND and/or XPTR You must have
access to XPTR (the mainframe application) via a RACF ID, which is obtained from your local
security officer, before you can use XTND (the Windows-based, full client version.) Once you have
access to XPTR, you put can download and install XTND from the System ware website. You must
have a RACF ID to get to the website. Once you download, install, and configure XTND, you can
access reports in XPTR via the Windows interface. XTND provides the ability to create formats and
queries so you can download reports or customized reports in Excel format. You can also access
X/NET from the Systemware website, which is a browser-based interface to XPTR. Again, you must
have a RACF ID. X/NET provides download options not available in XPTR, but not as flexible or
good as those in XTND..
Instructions for accessing and configuring XPTR for use can be found in the EIS User’s Manual,
Section EIS 1061, found here:
http://info.dhhs.state.nc.us/olm/manuals/dma/eis/man/Eis1061.htm#P32_913
Q: What if I don’t know how to use Data Warehouse or XPTR/XTND?
We have intentionally designed this toolkit for the novice user, understanding the inherent
confusion and complication created by CSDW and XPTR for those who do not use it on a regular
basis. We have created new, easy-to-use state reports as well as simplified existing ones. If you are
altogether unfamiliar with any of the data sources listed in this toolkit a brief description of how to
get started follows in the next chapter.
Q: Where should I start?
Users are encouraged to start anywhere they feel comfortable. This toolkit was designed for both
the first-time user as well as to provide source locations for those with more advanced data and
analysis skills. Each measure is set forth in its own section so that users can utilize the table of
contents to easily find what is needed. Counties are encouraged, however, to advance to looking at
all of these reports, if even just once, to get a clear picture of where areas of concern exist in their
process.
Q: What if I need help?
If at any time you need assistance with any of the reports listed here, please contact the help desk
as specified by each report:
1. For CSDW Questions, please email data warehouse support at: csdwsupport@dhhs.nc.gov.
They can also be reached by phone at 919-855-3200, option 2.
2. For UNC-CH SSW comments, please contact dfduncan@email.unc.edu or the NC DSS
Performance Management/Reporting and Evaluation Management Section (PM/REM) at
919-527-6260.
3. For questions about your RACF ID for XPTR, please contact your local security officer. For
questions please reference the EIS User’s manual or PM/REM Section.
4. For all other data questions, please contact your local program representative and/or
PM/REM.
USING THE DATA SOURCES
The measures described in this report are derived from four main data sources: The University of
North Carolina – Chapel Hill, School of Social Work’s Management Assistance page, the DHHS Client
Services Data Warehouse, XPTR/XTND, and statistics that are published on DHHS Division
websites. The information that is detailed below should provide, for even the most novice user,
step-by-step instructions for getting into each system so that the individual reports can be accessed
with ease.
University of North Carolina – Chapel Hill, School of Social Work
The UNC SSW website contains data extracted from State legacy systems and the DHHS Client
Services Data Warehouse and is provided by the Jordan Institute for Families, as part of UNC-CH
School of Social Work. For optimal viewing of their website, please use Internet Explorer 7 (or
higher) or Mozilla Firefox. The website can be access with a simple internet connection and
requires no special user permissions or log-in.
The primary address for this website is: http://ssw.unc.edu/ma/
Data can be accessed off of this main page for two Work Support programs: FNS and Work First and
is available by individual county, for the entire state, or by size grouping of county (large, medium,
and small). You can choose individual counties by clicking on them from the map, or the other
options by clicking on the named box.
Once you have selected a county or a region, you will see gray bars on the left
side of the screen that will direct you to a specific program. In the measures
listed in the following sections, you will be directed to specific reports from this
screen. It is important to note that at any time, users may compare themselves
to another county/region, etc. by making a selection from the “Select region:”
drop-down box located at the top right-hand corner of the
navigation/command menu on each page.
If at any time you would like further assistance, this video might provide some
help: http://www.unc.edu/~kum/ma/videos/overview/overview.htm
Client Services Data Warehouse (CSDW)
The Client Services Data Warehouse (CSDW) houses much of the data that is keyed into state
systems such as EIS, FSIS, NCFAST, and EPICS. CSDW utilizes a Business Objects user interface, and
it allows the user to access hundreds of different data points. This data is accessed via statesanctioned reports as well as user generated reports. The reports that are referenced in the
following sections are reports that have already been created for you. To begin using CSDW, follow
the below steps:
Step 1: Open Internet Explorer and type in the following address
https://www.csdw.dhhs.state.nc.us For comparable browsers, see the CSDW Project Repository
webpage: http://www.csdw.status.dhhs.state.nc.us/
Step 2: Click the Log In button. The Log On to InfoView page displays.
Step 3: Enter your User Name and Password and click the Log On button. The Business Objects
Home page is displayed. If you do not have a CSDW username and login, please contact your
local security officer (this is often the same person who provided your NCFAST/EIS login).
In general, navigation and the user interface in CSDW (also known as Business Objects XI InfoView)
are similar to that in Microsoft Windows Explorer and Microsoft Word: folders can be expanded
and collapsed through a click of a mouse, documents and options selected with a click, and
documents built through dragging and dropping of desired criteria into the appropriate area. Other
features include shortcut menus that display upon left clicks of the mouse and the use of the Shift
and Control keys while using the mouse to select multiple items.
For ease of access, the reports listed in this toolkit have been placed in a subfolder of DSS called
Work Support Strategies. Each report begins with the prefix WSS_. The name that follows is listed in
each measure. (ex, WSS_FNS_Cases_Denied). If you do not have access to the Work Support
Strategies folder, please contact your security officer for permission.
CSDW Metadata. Whether you are using one of the pre-developed reports detailed here to striking
out on your own to develop a new report, one of the most powerful and helpful components of the
CSDW is the metadata site. Metadata is information about all of the data elements and can tell a
user exactly what values are acceptable for a particular field. Metadata is available for each data
element in the CSDW includes the following: descriptions, table names, program name, data type,
length, format, and valid values with descriptions if the descriptions are available. The link to the
metadata tables can be found here: http://www.csdw.metadata.dhhs.state.nc.us/metadata.asp
XPTR/XTND
XPTR/XTND is a report distribution system which contains many reports that are useful for case
management. Both systems are available for use and the same reports can be accessed from either
application. XPTR is mainframe-based software that is still available to counties, and XTND is a
Windows-based, full-client version of the software. A web-based interface, X/NET, is also available
to users of XPTR or XTND. Regardless of which version you have, the following steps will help you
access the system, as the basic structure and look is the same.
Step 1: To use XTND, you must first have access to XPTR. For details about how to access and
configure XPTR, refer to the EIS User’s Manual, Section EIS-1061 at
http://info.dhhs.state.nc.us/olm/manuals/dma/eis/man/index.htm.
Step 2: If you have XTND installed on your machine, open up XTND. To start your session, click the
“new” icon in the upper left corner.
XTND will prompt you for your security logon ID or your desired Connection, depending on your
configuration. If prompted for a Connection, select the desired connection and click “Connect”.
If you do not have XTND you can access XPTR by keying “NCXPTR” at the Banner Screen of your
mainframe session.
Step 2: Enter your security logon ID, your Password and Account as prompted. (Your security logon
ID is your RACF (HRSS) number. If you do not yet have access to XPTR/XTND, contact your county
security officer to request access. )
Step 3: After responding to all prompts, XPTR/XTND the report directory will open. (After viewing
a report, the directory may close. You can bring it back up by clicking the new icon in the upper left
corner. )
To access the reports listed in the measures below, the specific directory information is listed in
each measure. All the reports detailed below are in the DHR directory. It is worth noting that you
may want to access a report that has been archived. By clicking on that report, you will be notified
that it has been archived, in which case it will be restored for you. This restoration process takes 25 minutes, on average.
DHHS Statistics Pages
NCDHHS offers a significant amount of useful data on the individual webpages of two of its primary
divisions: Department of Social Services (DSS) and Division of Medical Assistance (DMA). Both of
these sites provide a significant amount of information that is not easily found elsewhere. For
optimal viewing of their website, please use Internet Explorer 7 (or higher) or Mozilla Firefox. The
website can be access with a simple internet connection and requires no special user permissions
or log-in.
The primary address for the DSS statistics page is http://www.ncdhhs.gov/dss/stats/index.htm
This page includes information for two Work Support programs, Food and Nutrition Services and
Work First. Selecting either of those two links at the top of the main page will take you to separate
pages that list all of the available data.
The primary address for the DMA statistics page is http://www.ncdhhs.gov/dma/pub/
This page gives detailed reports on Medicaid data.
Measure 1: Re-Entry Rate of Clients into Work First
Definition: This measure describes the rate at which clients who have left the Work First program
re-enter the program by cohort. This data is available for all Work First cases and child-only cases.
Format: Data is available from this report as either a table or a graphic.
Location: This data point is located at the UNC SSW Management Assistance website:
http://ssw.unc.edu/ma. No username or login is required to access this site.
Running the Report: This report requires no inputs, just click on the link.
Analysis: This data is presented in the form of a cohort analysis, which is a longitudinal analysis that
tracks clients that initially entered the Work First during the same quarter. For example, all clients
who initially entered the program during Quarter 1 of 2011 are tracked as a group over time. The
group of clients being tracked is large enough to be statistically significant, which means that the
results can be reliably generalized to the entire population.
Clients reenter Work First for a variety of reasons, many of which counties can work to address by
strengthening local operations. This rate is an indicator of strengths or opportunities related to the
effectiveness of work requirements and activities or overall case management. For example, if a
county’s reentry rate is significantly above or below the state average (which is what this data
includes), the county can draw conclusions about the strength of its efforts to move clients off of
Work First and into self-sufficiency.
Example: The table below is one way that the data can be viewed. In that example, the county can
see that, of the cohort that came onto Work First during the fourth quarter of 2009, that 29.13%
have re-entered the program by the 14th month after they exited.
Similar Data Sources: As a UNC-CH SSW measure, this data is inherently available in DW as well.
There are currently no pre-developed reports, however, that will give this specific measure.
Measure 2: Work First Participation Rates
Definition: There are two federal participation rates that states must meet. The requirements are
different for two parent and all parent participation rates and both rates are calculated monthly.
States are required to achieve a 90 percent two parent participation rate and a 50 percent all family
participation rate. As implied, the all family participation rate includes both two parent and single
parent families.
Format: Data is available from this report as either a table or a longitudinal line graph.
Location: This data point is located at the UNC SSW Management Assistance website:
http://ssw.unc.edu/ma. No username or login is required to access this site.
Running the Report: This report requires no inputs, just click on the link http://ssw.unc.edu/ma
Then you will need to select your county, region, or the entire state. Both the two parent and all
parent rates are located separately in graphic form, but are in the table together called Work First
Experiences Report. On this website, the numerator and denominator are provided as well as both
participation rates as calculated by the NC Division of Social Services. The charts and graphs here
show the all family participation rates.
Analysis: Federal work participation rates have a significant impact on the state and individual
counties, which may include fiscal sanctions for noncompliance. The number of individuals that
engage in work activities is a direct result of the county’s case management and preparation. This
measure can help a county better understand the effectiveness of its work readiness activities.
Example: The below example details the rates as they are available in the Work First Experiences
Report. As you can see it includes far more than just the participation rates.
Similar Data Sources: This data is also available in Data Warehouse. Two reports have been placed
in the WSS folder, one called County All Parent Rate and one called County Two Parent Rate.
Measure 3: Work First Participants Entering Employment
Definition: This measure gives the total count of Work First participants who have entered into
employment in the month specified by the user. Employment can be defined as part-time or fulltime, and is only as accurate as workers’ diligence in keying that information into EIS.
Format: The format for this report is both a table as well as a graph. Data from this site can also be
downloaded into Excel.
Location: This data point is located at the UNC SSW Management Assistance website:
http://ssw.unc.edu/ma. No username or login is required to access this site.
Running the Report: From the main UNC SSW Management Assistance, once you have chosen your
county or tier of counties, click the Work First link on the left. You will then want to choose the
Work First Experiences Report. In the center of the screen you will see a link that says Number of
Adults Entering Employment. This link will give you both the data and a graph for this measure.
Analysis: As noted above, data from this report can be downloaded into Excel to create a graph. It is
especially useful to download data from multiple months to show the number of adults entering
employment by month over a year or for multiple years. Looking closely at the number of adults
entering employment in your Work First program can help you tailor your community partnerships
and work activities accordingly.
Example: It will look like the following:
Similar Data Sources: This data is also available in Data Warehouse.
Measure 4: Work First Customer Non-Compliance with Child Support Enforcement
Definition: This report gives t the number of Work First recipients that are non-compliant with
Child Support Enforcement requirements.
Format: This report is available to be viewed as PDF.
Location: The report for this measure can be found XPTR/XTND. The report is located in the
following directory: DHR/EJA. It is titled DHREJ NON-COOP WITHOUT IVD SANC.
Running the Report: There is nothing that is required to run this report except accessing it from the
above directory. You may which to view previous days by accessing the archive section. This report
is refreshed daily and each county has its own page, so you will want to scroll through until you
have found your county. This report is best accessed weekly, as customers stay on there until they
have complied or timed out per the timely notice.
Analysis: This report shows a list of cases with IV-D sanctions that have not been sanctioned in EIS.
This includes anyone who has to comply with Child Support, including payee cases. Having a clear
understanding of who is, and is not complying with Child Support can help Work First better
manage the caseload and intake.
Example:
Similar Data Sources: This data is not available in other data sources.
Measure 5: Average Length of Time on Work First
Definition: This measure shows the length of time families receive Work First benefits before
leaving the program.
Format: The format for this report is a table and a longitudinal line graph.
Location: This data point is located at the UNC SSW Management Assistance website:
http://ssw.unc.edu/ma. No username or login is required to access this site.
Running the Report: This report requires no inputs, just click on the link called Work First Benefits
Cases (Longitudinal Data), the select rate of exit.
Analysis: This data is presented in the form of a cohort analysis, which is a longitudinal analysis that
tracks clients that initially entered the Work First during the same quarter. For example, all clients
who initially entered the program during Quarter 1 of 2011 are tracked as a group over time. The
group of clients being tracked is large enough to be statistically significant, which means that the
results can be reliably generalized to the entire population. Length of time receiving Work First is
indicative of whether clients are in a temporary crisis or are in need of long-term assistance. This
raw data can help counties better understand which category their caseload falls in and identify
alternative options to support Work First recipients and hopefully shorten their length of time
receiving benefits.
Example:
Similar Data Sources: As a UNC-CH SSW measure, this data is inherently available in CSDW as well.
There are currently no pre-developed reports, however, that will give this specific measure.
Measure 6: Program Integrity Collections in Dollars
Definition: This report gives the total amount of dollars collected as part of county program
integrity efforts for a given month.
Format: This report is available as a table and can be downloaded into Excel.
Location: This report can be found in CSDW. It is called: Collection Report (CROP Not Included).
Running the Report: There are four inputs that are required to run this report:
1. County name – This is the name of your county or the county for which you would like to
pull data.
2. Report month – This is the month for which you are looking for the collections. The format
for this value is YYYYMM. Scrolling to the bottom of the list will give you the latest month.
Double click that month to set it as your value.
3. First day of report month – This is the first day of the report month you have entered in the
report month section. The format for this value is DD/MM/YYYY.
4. First day of following month – This is the first day of the month following the report month
you have entered in the report month section. The format for this value is DD/MM/YYYY.
Analysis: Once this report is run the table that is produced shows the following fields:
Referral ID – This is the individual code that was given to this payer when they were
referred to program integrity.
Program Acronym – This is the program for which they are being investigated.
Payment Receipt Number Payer First Name – Payer’s first name.
Payer Middle Initial – Payer’s Middle Initial
Payer Last Name – Payers’s last name.
Claim Category Code – Code for how the claim is classified. In the below example, IHE is the
code for Inadvertent Household Error.
Payment Received Date – This is the date that denial was effective.
Create Timestamp – The timestamp gives the exact date and a unique code as to when the
payment was keyed and accepted.
Method of Collection – This is their method of payment.
Distribution Amount – This is the amount that was collected.
This report is helpful to understand how much your Program Integrity Division collected in the
desired report month(s), who it was received from, for what program, and in what form it was
received. This data can be saved to Excel so that you can sort, filter, and create graphics to show
different information, such as what percentage of total collections come in as cash, or what
percentage of total collections are from Medicaid vs. Food and Nutrition Services and Work First
programs. A total amount collected can be found at the bottom of the last page. Use the arrows at
the top of the report for scrolling to the end.
Example:
Ref.
Id
Payment Payer Payer Claim
Payment
Method of
Program Receipt Last
First Category Received Create
Collection
Acronym Number Name Name Code
Date
Timestamp Code
0000 MAFN
111111 SMITH BOB IHE
09/21/2 2012-09012
21-11.22.3 CASH
Similar Data Sources: This data is not available via alternative sources.
Distribut
-ion
Amount
$10.00
Measure 7: Amount of Program Integrity Claims Established
Definition: This report gives the user the customers in the agency who have overpayments and the
exact dollar amount of that overpayment (including agency totals). It also gives the type of claim as
well as the program.
Format: This report is available as a table and can be downloaded into Excel.
Location: This report can be found in CSDW. It is called Claims Established during Specified Report
Month.
Running the Report: There are four inputs that are required to run this report:
1. Report month – This is the month for which you are looking for the establishments. The
format for this value is YYYYMM. Scrolling to the bottom of the list will give you the latest
month. Double click that month to set it as your value.
2. First day of report month – This is the first day of the report month you have entered in the
report month section. The format for this value is DD/MM/YYYY.
3. Last day of report month – This is the last day of the report month you have entered in the
report month section. The format for this value is DD/MM/YYYY.
4. County name – This is the name of your county or the county for which you would like to
pull data.
Analysis: Running this report can give a county many valuable items of information including:
Total dollar amount of claims outstanding
The ability to sort by claim establishment date to identify both older and newer outstanding
claims
Data on program types of claims for reporting
Totals have also been made available by program type.
Example:
Current
OriginatCaseCaseCounty
Claim Discover
ing
head
head
of
Ref Id
Est
y
County
Last
First
OwnerDate
Date
Name
Name Name
ship
000000
07/20 06/05/2
Bertie
Bertie
SMITH BOB
000
/2007 007
Actual
Over- Claim
Propay- Type
gram
ment Code
Amt
$77.00 IHE
Similar Data Sources: This data is not available via an alternative source.
FS
Case
Id
Work
er
Id
11111
001
1111
Measure 8: Program Integrity Referrals
Definition: This report gives you the count of how many referrals were made to Program Integrity
staff during the specified report month as well as the status of those referrals.
Format: This report is available as a table and can be downloaded into Excel.
Location: This report can be found in the CSDW in the WSS folder. It is called EPICS Referral Counts
by Status Code
Running the Report: There are two inputs that are required to run this report:
1. Report month – This is the month for which you are looking for the referrals. The format for
this value is YYYYMM. Scrolling to the bottom of the list will give you the latest month.
Double click that month to set it as your value.
2. County name – This is the name of your county or the county for which you would like to
pull data.
Analysis: This value in this report is knowing how many referrals are made to Program Integrity
staff each month and the outcome of those referrals. Counties should closely examine the relative
percentages of referrals that are in each of the available status categories.
Example:
Program
Case Id
Count
Distinct
Referral Status
Description
0000
CLOSED
1111
COLLECTIONS
2222
INVESTIGATION
3333
TERMINATED
COUNT
4
Similar Data Sources: There are no similar data sources for this report.
Measure 9: FNS Error Rates
Definition: FNS error rates are an estimate of the proportion of cases with an error in the
determination of eligibility, ineligibility, or basis of issuance. This estimate is expressed as a
percentage of the completed active quality control reviews.
Format: This data is available in table format.
Location: The North Carolina DSS Statistics webpage. http://www.ncdhhs.gov/dss/stats/fsp.htm
There are several error rate reports that may be useful for counties under the Quality Control
section.
Running the Report: Nothing is required to run this report, counties will just want to use the drop
down to click on the requested month to access reports in the above section. The available reports
are called:
State Food and Nutrition Services Payment Accuracy Reports on Active Cases
State Food and Nutrition Services Payment Accuracy Reports on Negative Cases
*It is also worth noting that federal accuracy rate reports and error rates are available here as well.
Analysis: Although error rates are typically calculated in a small number of cases pulled from each
county, it can be an indication of trouble spots for eligibility determination processes. Error rates
(and the specific types of errors) can help counties diagnose issues within the eligibility
determination process and develop new methods to address those problems. Without this type of
strategic analysis, these issues may go unknown to the agency and become more widespread,
resulting in inaccurate payments and potential fiscal repercussions. If a county finds errors during
its QC review process relating to calculation of a particular income type or verification accepted, the
county can develop trainings or a revised process to address that issue.
Example:
Similar Data Sources: There is no other source for this data.
Measure 10: Penetration Rate (FNS)
Definition: The SNAP participation rate is a federal performance measure showing a State’s
effectiveness at reaching the program goal of reducing hunger and improving nutrition among lowincome households. It is calculated using the state’s total caseload as the numerator and the state’s
total eligible population (calculated using U.S. Census data) as the denominator.
Format: This report is available in table format.
Location: The North Carolina DSS Statistics webpage. http://www.ncdhhs.gov/dss/stats/fsp.htm
The report is located under “Food and Nutrition Participation Reports”
Running the Report: This report requires no inputs, just click on the link. Data is available by
calendar year quarter and shows information for each individual county as well as the state as a
whole.
Analysis: This information shows how much of the eligible population is receiving services. Bear in
mind that since Census data is only updated every 10 years, this data can quickly become outdated.
Example: Counties can gauge how effective their community presence and outreach efforts are by
analyzing this data. A penetration rate of 50% indicates very different levels of efficacy than a
penetration rate of 100%.
Similar Data Sources: There is no other data source for this information.
Measure 11: Expenditures by Program (Monthly, Annually, and By Recipient)
Definition: The total dollars expended by each individual program in any given month.
Format: This data is available in a table format.
Location: This data is available in CSDW in a report called Fiscal Expenditures by County and
Report Month End
Running the Report: There are two inputs that are required to run this report:
1. Report month end – This is the month for which you are looking for the expenditures. The
format for this value is YYYYMM. Scrolling to the bottom of the list will give you the latest
month. Double click that month to set it as your value.
2. County name – This is the name of your county or the county for which you would like to
pull data.
Analysis: This is a great report to either validate against existing internal systems or to keep track
of program expenditures throughout the year.
Example: In the example below, Alamance has spent a total of $527,361.43 on Adoptions and
Foster Care through this last month. As you can see that expenditure is broken down into
$526,885.00 for the federal and $476.43 for the state expenditures.
County
Name
Fiscal Program
Description
ADOPTION/FOSTER
Alamance CARE
CFDA
Program
Sequence Expenditure
Number
Amount
00.008-01 $527,361.43
Federal
Expenditure
Amount
$526,885.00
State
Expenditure
Amount
$0.00
County
Expenditure
Amount
$476.43
Similar Data Sources: This report contains data contained in many other sources including on 1571
reports as well as individual county ledgers.
Additional Measures for County Consideration
[Note: on the following measures, there is not a way to track these at the state level, but they are
worth considering for counties to track manually or with internal systems]
1. Method of application
2. Average client contacts per task (application, recertification, change, etc).
3. Call data
a. Wait times to get resolution
b. Average call length
c. Number of calls per task
d. Number of hand-offs per task
e. Reasons for calling
4. Lobby data
a. Lobby wait times
b. Reasons for visit
c. Average interaction length
5. Percentage of mail returned
6. Percentage of applications taken by partner organizations
7. Direct client feedback
8. Child care subsidy participants who are “deemed” through FNS participation
9. Certification periods aligned