1
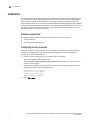
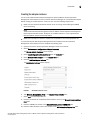
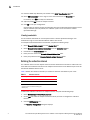
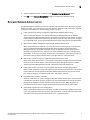
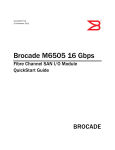
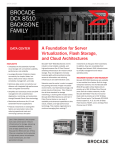
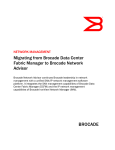
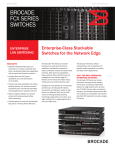
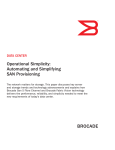
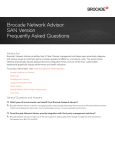
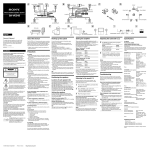
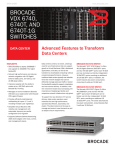
53-1003192-01
29 January 2014
Brocade SAN Analytics
Management Pack
for VMware vCenter Operations
Management Suite
User’s Guide
Version 1.0
®
Copyright © 2014 Brocade Communications Systems, Inc. All Rights Reserved.
Brocade, the B-wing symbol, Brocade Assurance, ADX, AnyIO, DCX, Fabric OS, FastIron, HyperEdge, ICX, MLX, MyBrocade, NetIron,
OpenScript, VCS, VDX, and Vyatta are registered trademarks, and The Effortless Network and the On-Demand Data Center are
trademarks of Brocade Communications Systems, Inc., in the United States and in other countries. Other brands and product
names mentioned may be trademarks of others.
Notice: This document is for informational purposes only and does not set forth any warranty, expressed or implied, concerning
any equipment, equipment feature, or service offered or to be offered by Brocade. Brocade reserves the right to make changes to
this document at any time, without notice, and assumes no responsibility for its use. This informational document describes
features that may not be currently available. Contact a Brocade sales office for information on feature and product availability.
Export of technical data contained in this document may require an export license from the United States government.
The authors and Brocade Communications Systems, Inc. assume no liability or responsibility to any person or entity with respect
to the accuracy of this document or any loss, cost, liability, or damages arising from the information contained herein or the
computer programs that accompany it.
The product described by this document may contain “open source” software covered by the GNU General Public License or other
open source license agreements. To find out which open source software is included in Brocade products, view the licensing
terms applicable to the open source software, and obtain a copy of the programming source code, please visit
http://www.brocade.com/support/oscd.
Brocade Communications Systems, Incorporated
Corporate and Latin American Headquarters
Brocade Communications Systems, Inc.
130 Holger Way
San Jose, CA 95134
Tel: 1-408-333-8000
Fax: 1-408-333-8101
E-mail: info@brocade.com
Asia-Pacific Headquarters
Brocade Communications Systems China HK, Ltd.
No. 1 Guanghua Road
Chao Yang District
Units 2718 and 2818
Beijing 100020, China
Tel: +8610 6588 8888
Fax: +8610 6588 9999
E-mail: china-info@brocade.com
European Headquarters
Brocade Communications Switzerland Sàrl
Centre Swissair
Tour B - 4ème étage
29, Route de l'Aéroport
Case Postale 105
CH-1215 Genève 15
Switzerland
Tel: +41 22 799 5640
Fax: +41 22 799 5641
E-mail: emea-info@brocade.com
Asia-Pacific Headquarters
Brocade Communications Systems Co., Ltd. (Shenzhen WFOE)
Citic Plaza
No. 233 Tian He Road North
Unit 1308 – 13th Floor
Guangzhou, China
Tel: +8620 3891 2000
Fax: +8620 3891 2111
E-mail: china-info@brocade.com
Document History
Title
Publication number
Summary of changes
Date
Brocade SAN Analytics Management Pack for
VMware vCenter Operations Management Suite
User Manual
53-1003192-01
New document.
January 2014
Contents
About This Document
Chapter 1
Installation
In this chapter . . . . . . . . . . . . . . . . . . . . . . . . . . . . . . . . . . . . . . . . . . . . 1
Overview . . . . . . . . . . . . . . . . . . . . . . . . . . . . . . . . . . . . . . . . . . . . . . . . 1
Brocade Network Advisor feature limitations. . . . . . . . . . . . . . . . 1
Installation . . . . . . . . . . . . . . . . . . . . . . . . . . . . . . . . . . . . . . . . . . . . . . . 2
Software requirements . . . . . . . . . . . . . . . . . . . . . . . . . . . . . . . . . 2
Configuring vCenter properties . . . . . . . . . . . . . . . . . . . . . . . . . . . 2
Creating the adapter instance . . . . . . . . . . . . . . . . . . . . . . . . . . . 3
Defining the collection interval . . . . . . . . . . . . . . . . . . . . . . . . . . . 4
Brocade Network Advisor server . . . . . . . . . . . . . . . . . . . . . . . . . . . . . 5
Chapter 2
Resources
In this chapter . . . . . . . . . . . . . . . . . . . . . . . . . . . . . . . . . . . . . . . . . . . . 7
Resources overview . . . . . . . . . . . . . . . . . . . . . . . . . . . . . . . . . . . . . . . 7
Health Tree . . . . . . . . . . . . . . . . . . . . . . . . . . . . . . . . . . . . . . . . . . . . . . 7
Fabric resources . . . . . . . . . . . . . . . . . . . . . . . . . . . . . . . . . . . . . . . . . . 8
Switch resources . . . . . . . . . . . . . . . . . . . . . . . . . . . . . . . . . . . . . . . . . . 8
Switch metrics . . . . . . . . . . . . . . . . . . . . . . . . . . . . . . . . . . . . . . . . 8
FC Port resources . . . . . . . . . . . . . . . . . . . . . . . . . . . . . . . . . . . . . . . . . 9
Port metrics . . . . . . . . . . . . . . . . . . . . . . . . . . . . . . . . . . . . . . . . . . 9
Chapter 3
SAN Event Handling
In this chapter . . . . . . . . . . . . . . . . . . . . . . . . . . . . . . . . . . . . . . . . . . . 11
SAN events. . . . . . . . . . . . . . . . . . . . . . . . . . . . . . . . . . . . . . . . . . . . . . 11
MAPS alerts . . . . . . . . . . . . . . . . . . . . . . . . . . . . . . . . . . . . . . . . . 11
Fabric and switch alerts . . . . . . . . . . . . . . . . . . . . . . . . . . . . . . . 12
Event handling configuration . . . . . . . . . . . . . . . . . . . . . . . . . . . . . . . 12
Configuring vCenter Operations Manager for event handling. . 12
Configuring Brocade Network Advisor event handling . . . . . . . 13
Configuring devices for event handling . . . . . . . . . . . . . . . . . . . 14
Verifying alerts . . . . . . . . . . . . . . . . . . . . . . . . . . . . . . . . . . . . . . . 14
Brocade SAN Analytics Management Pack for VMware vCenter Operations Management Suite User Manual
53-1003192-01
iii
Chapter 4
SAN Dashboards
In this chapter . . . . . . . . . . . . . . . . . . . . . . . . . . . . . . . . . . . . . . . . . . . 15
Brocade troubleshooting dashboard overview . . . . . . . . . . . . . . . . . 15
Brocade - SAN Troubleshooting dashboard. . . . . . . . . . . . . . . . . . . . 16
Brocade - VM Troubleshooting dashboard. . . . . . . . . . . . . . . . . . . . . 17
Brocade - SAN Utilization dashboard . . . . . . . . . . . . . . . . . . . . . . . . . 18
Brocade - Health Overview dashboard . . . . . . . . . . . . . . . . . . . . . . . 19
Building a Brocade dashboard. . . . . . . . . . . . . . . . . . . . . . . . . . . . . . 20
Adding resource kinds . . . . . . . . . . . . . . . . . . . . . . . . . . . . . . . . . 21
Editing the widget name . . . . . . . . . . . . . . . . . . . . . . . . . . . . . . . 22
Launch in context support for Brocade Network Advisor . . . . . . . . .22
iv
Brocade SAN Analytics Management Pack for VMware vCenter Operations Management Suite User Manual
53-1003192-01
About This Document
In this chapter
• How this document is organized . . . . . . . . . . . . . . . . . . . . . . . . . . . . . . . . . . . v
• Supported software. . . . . . . . . . . . . . . . . . . . . . . . . . . . . . . . . . . . . . . . . . . . . . v
• What’s new in this document . . . . . . . . . . . . . . . . . . . . . . . . . . . . . . . . . . . . . . vi
• Document conventions . . . . . . . . . . . . . . . . . . . . . . . . . . . . . . . . . . . . . . . . . . . vi
• Additional information . . . . . . . . . . . . . . . . . . . . . . . . . . . . . . . . . . . . . . . . . . . vii
• Document feedback . . . . . . . . . . . . . . . . . . . . . . . . . . . . . . . . . . . . . . . . . . . . viii
How this document is organized
This document is organized to help you find the information that you want as quickly and easily as
possible. This document supports the Brocade SAN Analytics Management Pack for VMware
vCenter Operations Management Suite.
The document contains the following components:
• Chapter 1, “Installation,” provides installation requirements and instructions.
• Chapter 2, “Resources,” provides information about the resources available for the Brocade
SAN Management adapter.
• Chapter 3, “SAN Event Handling,” provides information about the events that display and
configuring event handling.
• Chapter 4, “SAN Dashboards,” provides using and create dashboards.
Supported software
The Brocade SAN Analytics Management Pack for VMware vCenter Operations Management Suite
is supported with the following software versions:
• Brocade Network Advisor
• vCenter Server 5.5
• vCenter Operations Manager 5.8
Brocade SAN Analytics Management Pack for VMware vCenter Operations Management Suite User Manual
53-1003192-01
v
What’s new in this document
This is a new document.
Document conventions
This section describes text formatting conventions and important notice formats used in this
document.
Text formatting
The narrative-text formatting conventions that are used are as follows:
bold text
Identifies command names
Identifies the names of user-manipulated GUI elements
Identifies keywords and operands
Identifies text to enter at the GUI or CLI
italic text
Provides emphasis
Identifies variables
Identifies paths and Internet addresses
Identifies document titles
code text
Identifies CLI output
Identifies command syntax examples
For readability, command names in the narrative portions of this guide are presented in mixed
lettercase: for example, switchShow. In actual examples, command lettercase is all lowercase.
Notes, cautions, and warnings
The following notices and statements are used in this manual. They are listed below in order of
increasing severity of potential hazards.
NOTE
A note provides a tip, guidance, or advice, emphasizes important information, or provides a
reference to related information.
ATTENTION
An Attention statement indicates potential damage to hardware or data.
Key terms
For definitions specific to Brocade and Fibre Channel, see the Brocade Glossary.
For definitions of SAN-specific terms, visit the Storage Networking Industry Association online
dictionary at:
http://www.snia.org/education/dictionary
vi
Brocade SAN Analytics Management Pack for VMware vCenter Operations Management Suite User Manual
53-1003192-01
Notice to the reader
This document may contain references to the trademarks of the following corporations. These
trademarks are the properties of their respective companies and corporations.
These references are made for informational purposes only.
Corporation
Referenced trademarks and products
VMware, Inc.
VMware
Additional information
This section lists additional Brocade and industry-specific documentation that you might find
helpful.
Brocade resources
To get up-to-the-minute information, go to http://my.brocade.com to register at no cost for a user ID
and password.
White papers, online demonstrations, and data sheets are available through the Brocade website
at:
http://www.brocade.com/products-solutions/products/index.page
For additional Brocade documentation, visit the Brocade website:
http://www.brocade.com
Release notes are available on the MyBrocade website and are also bundled with the Fabric OS
firmware.
Other industry resources
For additional resource information, visit the Technical Committee T11 website. This website
provides interface standards for high-performance and mass storage applications for Fibre
Channel, storage management, and other applications:
http://www.t11.org
For information about the Fibre Channel industry, visit the Fibre Channel Industry Association
website:
http://www.fibrechannel.org
Brocade SAN Analytics Management Pack for VMware vCenter Operations Management Suite User Manual
53-1003192-01
vii
Document feedback
Quality is our first concern at Brocade and we have made every effort to ensure the accuracy and
completeness of this document. However, if you find an error or an omission, or you think that a
topic needs further development, we want to hear from you. Forward your feedback to:
documentation@brocade.com
Provide the title and version number of the document and as much detail as possible about your
comment, including the topic heading and page number and your suggestions for improvement.
viii
Brocade SAN Analytics Management Pack for VMware vCenter Operations Management Suite User Manual
53-1003192-01
Chapter
1
Installation
In this chapter
• Overview . . . . . . . . . . . . . . . . . . . . . . . . . . . . . . . . . . . . . . . . . . . . . . . . . . . . . . . 1
• Installation . . . . . . . . . . . . . . . . . . . . . . . . . . . . . . . . . . . . . . . . . . . . . . . . . . . . . 2
• Brocade Network Advisor server . . . . . . . . . . . . . . . . . . . . . . . . . . . . . . . . . . . 5
Overview
You can use the Brocade SAN Analytics Management Pack for VMware vCenter Operations
Management Suite to collect SAN data (such as fabrics, switches, ports, and metrics) from a single
Brocade Network Advisor server (data source). Once collected, the system analyzes the data by
learning the behavior of the data, checking the data, and correlating the data. The system then
stores the data in a repository. Based on this output, the system sends alerts to other applications
(such as, SMARTS, e-mail, and SNMP traps.
NOTE
The Brocade SAN Analytics Management Pack for VMware vCenter Operations Management Suite
requires Professional Plus, Enterprise, or Headless editions. It is not supported with Brocade
Network Advisor Professional edition.
Brocade Network Advisor feature limitations
Table 1 details the feature limitations based on the version of Brocade Network Advisor that you
use for the data source.
TABLE 1
Brocade Network Advisor feature limitations
Brocade Network
Advisor version
MAPS Events
Port metrics
Switch metrics AG port metrics
support
12.1.3 or
earlier
No
Yes, but limited support. For more
information, refer to “Port metrics” on
page 9.
No
No
12.1.4 or later
Yes
Yes
Yes
No
12.2 or later
Yes
Yes
Yes
Yes
Brocade SAN Analytics Management Pack for VMware vCenter Operations Management Suite User Manual
53-1003192-01
1
1
Installation
Installation
The Brocade SAN Analytics Management Pack for VMware vCenter Operations Management Suite
only manages data from one Brocade Network Advisor server; however, each Brocade Network
Advisor server manages one or more fabrics. If you need to manage more than one Brocade
Network Advisor server, you must create and Brocade SAN Analytics Management Pack for VMware
vCenter Operations Management Suite instance for each Brocade Network Advisor server. To install
the adapter, refer to the Install the Adapter in a vApp Installation section in the VMware vCenter
Adapter Installation and Configuration Guide.
Software requirements
• Brocade Network Advisor Professional Plus, Enterprise, or Headless editions
• vCenter Server 5.5
• vCenter Operations Manager 5.8
Configuring vCenter properties
Before you create the adapter instance, you must specify the IP address and credentials for the
vCenter that is registered with the vCenter Operations Manager. The vCenter properties are
specified in the vCenter.properties file.
1. Open the vcenter.properties file in a a text editor (such as Notepad).
The vcenter.properties file is located in the
/usr/lib/vmware-vcops/user/plugins/inbound/BrocadeFabricAdapter/conf directory on the
Analytics virtual machine.
2. Configure the IP address and credentials for the vCenter that is registered with the vCenter
Operations Manager using the following format:
vcenter.server.1=<IP_address>
vcenter.port.1=<port_number>
vcenter.user.1=<user_name>
vcenter.passwd.1=<password>
3. Select File > Save.
2
Brocade SAN Analytics Management Pack for VMware vCenter Operations Management Suite User Manual
53-1003192-01
Installation
1
Creating the adapter instance
You must add a Brocade SAN Analytics Management Pack for VMware vCenter Operations
Management Suite adapter instance in vCenter Operations Manager for each embedded adapter.
Before creating an adapter instance, make sure you meet the following requirements.
• Make sure that the Brocade Network Advisor server is running and the SMI agent/CIMOM
Server is listening.
NOTE
The Brocade SAN Analytics Management Pack for VMware vCenter Operations Management
Suite requires Professional Plus, Enterprise, or Headless editions. It is not supported with
Brocade Network Advisor Professional edition.
• Make sure to specify the vCenter IP address and credentials in the vcenter.properties file.
To create the Brocade SAN Analytics Management Pack for VMware vCenter Operations
Management Suite adapter instance, complete the following steps.
1. Open the launch the vCenter Operations Manager custom user interface.
2. Select Environment > Configuration > Adapter Instances.
The Manage Adapter Instances screen displays.
3. Select vCenter Operations Standard Server from the Collector list.
4. Select Brocade Fabric Adapter from the Adapter Kind list.
5. Click the Add New Adapter Instance icon.
The Add Adapter Instance screen displays.
FIGURE 1
Add Adapter Instance screen
6. Type Brocade_Management_PAK1 in the Adapter Instance Name field.
7.
Select true from the Enable SSL list.
8. Enter the IP address for the Brocade Network Advisor server in the Brocade Network Advisor
Host field.
9. Enter the CIMOM port number in the Brocade Network Advisor CIMOM Port field.
10. Enter the CIM Indications Listener port number in the CIM Indications Listener Port field.
Brocade SAN Analytics Management Pack for VMware vCenter Operations Management Suite User Manual
53-1003192-01
3
1
Installation
11. Enter the SNMP Trap Receiver port number in the SNMP Trap Receiver Port field.
12. Select BNA credentials to use to sign on to the data source from the Credential list.
If necessary, click Edit to modify the credentials.
13. (Optional) Click Test to test the adapter instance.
14. Click OK to save your configuration.
Once created, the system queries the SAN fabric data from the Brocade Network Advisor server
every 3 collection cycles. By default, the collection cycle is set to 5 minutes in vCenter
Operations Manager.
Creating credentials
You must define credentials for each adapter instance. vCenter Operations Manager uses
credentials to sign on to the Brocade Network Advisor data source.
To modify Brocade Network Advisor credentials, complete the following steps.
1. Select Brocade Fabric Adapter from the Adapter Kind list.
2. Select Brocade Network Advisor Credentials from the Credential kind list.
3. Enter BNA in the Instance name field.
4. Enter your user name in the Brocade Network Advisor User field.
5. Enter your password in the Brocade Network Advisor Password field.
Defining the collection interval
The collection interval for the adapter instance resource determines how often to collect data. You
must define the collection interval for each adapter instance based on the Switch FC port count for
the Brocade Network Advisor server.
Table 2 defines the collection intervals you should use based on the Switch FC port count.
TABLE 2
Collection intervals
Switch FC port count
Adapter collection interval
1000
5 minutes
1000 - 4000
10 minutes
4000 and above
(maximum limit is 9000 including the
device port)
15 minutes
To define the collection interval for an adapter instance, complete the following steps.
1. Select Environment > Environment Overview.
2. On the List tab, select the adapter instance for which you want to configure the collection
interval.
3. Click the Edit Resource icon.
The Resource Management dialog box displays.
4
Brocade SAN Analytics Management Pack for VMware vCenter Operations Management Suite User Manual
53-1003192-01
Brocade Network Advisor server
1
4. Type the collection interval, in minutes, in the Collection Interval (Minutes) text box.
5. Click OK on the Resource Management dialog box to define the collection interval.
Brocade Network Advisor server
The Brocade Network Advisor server uses one device, called the seed switch, to discover all other
devices in a fabric. If the seed switch or any other device in the fabric loose connectivity, segment,
or becomes unreachable, one of the following actions may occur:
• Fabric split with both fabrics managed by single Brocade Network Advisor server
This is a seamless operation. The Brocade SAN Analytics Management Pack for VMware
vCenter Operations Management Suite lists all resources the Health Tree and Resource Detail
screens. When a switch leaves Fabric A to join Fabric B and both Fabric A and B are managed
by a single BNA server, all resources displayed with the parent child relations set appropriately.
• Switch leaves a fabric managed by single Brocade Network Advisor server
When a switch leaves the fabric for any reason, the switch resource changes to an Unknown
state in the Brocade SAN Analytics Management Pack for VMware vCenter Operations
Management Suite. The adapter maintains state of all collected resources, even when the
resources no longer exists for a minimum of 3 weeks. Collected resources are purged every
three weeks. In this case, the switch resource stays in the Unknown state until it is purged. If
the switch resource merges with the fabric, it changes back to a valid health state.
• Switch joins a fabric managed by single Brocade Network Advisor server
When a new switch joins a fabric or a new fabric is discovered in the Brocade Network Advisor
server, the new resources display in Brocade SAN Analytics Management Pack for VMware
vCenter Operations Management Suite with valid health states and relationships.
• Fabric splits and the new fabric is not managed by the Brocade Network Advisor server
When a switch moves from Fabric A to Fabric B or when Fabric A splits into Fabric A and Fabric
B and Fabric B is not managed by the Brocade Network Advisor server, all resources moved
from Fabric A change to an unknown health state until purged (3 weeks).
• New Seed switch elected in the fabric
When the seed switch for a fabric changes in Brocade Network Advisor and a new seed switch
is elected, the new fabric resource, using the new seed switch WWN as the key for the fabric,
displays in the adapter. The fabric resource with the old seed switch WWN changes to an
Unknown health state until it is purged or becomes the seed switch for the fabric again.
• Seed switch segments from the existing fabric
When a seed switch segments from the fabric, the fabric resource in the adapter remains the
same. The switches that are not part of the new fabric will be set to an unknown health state.
The switches that are part of this fabric will be set to a valid health state.
Brocade SAN Analytics Management Pack for VMware vCenter Operations Management Suite User Manual
53-1003192-01
5
1
6
Brocade Network Advisor server
Brocade SAN Analytics Management Pack for VMware vCenter Operations Management Suite User Manual
53-1003192-01
Chapter
2
Resources
In this chapter
• Resources overview. . . . . . . . . . . . . . . . . . . . . . . . . . . . . . . . . . . . . . . . . . . . . .
• Health Tree. . . . . . . . . . . . . . . . . . . . . . . . . . . . . . . . . . . . . . . . . . . . . . . . . . . . .
• Fabric resources . . . . . . . . . . . . . . . . . . . . . . . . . . . . . . . . . . . . . . . . . . . . . . . .
• Switch resources . . . . . . . . . . . . . . . . . . . . . . . . . . . . . . . . . . . . . . . . . . . . . . . .
• FC Port resources . . . . . . . . . . . . . . . . . . . . . . . . . . . . . . . . . . . . . . . . . . . . . . .
7
7
8
8
9
Resources overview
A resource is an entity in your network for which the Brocade SAN Analytics Management Pack for
VMware vCenter Operations Management Suite collects data. A resource can be a fabric, switch,
host, storage, virtual machine (VM), or a container that holds other resources (such as,
applications).
Health Tree
The health tree displays the relationship between various resources using a parent-child
relationship. The Fabric resource is the parent for all switches that belong to the fabric and the
Switch resource is the parent for the F-ports connected to end devices. E-ports on the switch
display as a metric group or resource group on the Switch resource. The End Devices (such as
Hosts, Virtual Machines (VM), and Storage devices) are parents of the Fabric resource. The end
device data obtained from the Brocade Network Advisor data source is correlated with the Hosts
and VMs known to the vCenter registered with vCenter Operations Manager. If the VM has a path to
a Storage known to the vCenter and collected from the Brocade Network Advisor server, the
Storage resource is displayed as a parent of the Fabric.
For FCR deployment, devices display as a storage device in the Initiator connected fabric link. Note
that phantom switches do not display in the interface.
For FCIP deployment, Ve and Vex ports and tunnels do not display in the interface.
For Access Gateway (AG) deployment, AG switches display as a resource group. In the collection
data, Switch Mode displays as Access Gateway and the Domain Id field is empty. If you are
collecting data from Brocade Network Advisor 12.2 or later, data is collected for the AG ports. If you
are collecting data from Brocade Network Advisor 12.1.X or earlier, data is not collected for AG
ports and the value displays as zero.
Brocade SAN Analytics Management Pack for VMware vCenter Operations Management Suite User Manual
53-1003192-01
7
2
Fabric resources
Fabric resources
The Brocade SAN Analytics Management Pack for VMware vCenter Operations Management Suite
collects the following data for a fabric resource:
• Seed Switch IP Address — The IP address of the seed switch.
• Seed Switch WWN — The world wide name (WWN) of the seed switch. This is the resource key
identifier for a fabric resource.
• Fabric Name — The name of the fabric in Brocade Network Advisor.
• Number of Switches — The number of switches in the fabric.
• Fabric WWN — The WWN of the principal switch in the fabric.
Switch resources
Switch resources display as children of the Fabric resource. The Brocade SAN Analytics
Management Pack for VMware vCenter Operations Management Suite collects the following data
for a switch resources:
•
•
•
•
•
•
•
Switch Name — The name of the switch. The switch name is configured on the device.
Domain Id — The domain Id of the switch. This field is empty for Access Gateway devices.
Fabric Name — The name of the fabric to which the switch belongs.
Switch WWN — The WWN of the switch. This is the resource key identifier for a switch resource.
Switch Mode — Whether the switch is in AG (Access Gateway) mode or normal mode.
Switch IP Address — The IP address of the switch.
Operational Status — The operational status of the switch (such as, Error, Degraded, OK, and
No Contact).
Switch metrics
Click a switch in the Switch Resources List to display the switch metrics in the Metric Selector
widget. The Brocade SAN Analytics Management Pack for VMware vCenter Operations
Management Suite collects the following metrics for switch resources:
• CPU Usage (%)
• Memory Usage (%)
8
Brocade SAN Analytics Management Pack for VMware vCenter Operations Management Suite User Manual
53-1003192-01
FC Port resources
2
FC Port resources
F-port resources display as children of the Switch resource. F-port metrics are resource attributes
for the F-port resource. E-ports on the switch display as a metric group or resource group on the
Switch resource. E-port metrics are a metric group or resource group on the Switch resource and
each entry in this metric or resource group is the E-port WWN with the same set of port metrics.
The Brocade SAN Analytics Management Pack for VMware vCenter Operations Management Suite
collects the port WWN for a port resource. The port WWN is the resource key identifier for a port
resource.
Port metrics
For Brocade Network Advisor instances running 12.1.3 or earlier, the Brocade SAN Analytics
Management Pack for VMware vCenter Operations Management Suite collects the following
metrics for port resources:
• C3 Discards — The total number of class 3 frames that were discarded upon reception from the
point of time the counter was reset.
• CRC Errors — The number of frames received in which the CRC in a frame does not match the
CRC computed by the receiver. This count is part of the Link Error Status Block (LESB).
• Encoding Errors — The total number of disparity errors received at this port from the point of
time the counter was reset.
• Link Failures — The number of times a link error occurred. This count is part of the Link Error
Status Block (LESB).
• Rx % Utilization — The percentage of data received to the maximum amount of data that can be
received
• Rx (MB/sec) — The total number of megabytes received from the point of time the counter was
reset.
• Tx % Utilization — The percentage of data transmitted to the maximum amount of data that can
be transmitted.
• Tx (MB/sec) — The total number of megabytes transmitted from the point of time the counter
was reset.
For Brocade Network Advisor instances running 12.1.4 or later, the Brocade SAN Analytics
Management Pack for VMware vCenter Operations Management Suite collects the following
additional metrics for port resources:
• BB Credit Zero — The total number of transitions in or out of BBcredit zero state. The other side
is not providing any credit.
• C3 Discard Others — The total number of Class 3 frames discarded due to unknown reasons
upon reception from the point of time the counter was reset.
• C3 Discard Rx Timeout — The number of Class 3 receive frames discarded due to timeout upon
reception from the point of time the counter was reset.
• C3 Discard Tx Timeout — The number of Class 3 transmit frames discarded due to timeout
upon reception from the point of time the counter was reset.
• C3 Discard Unreachable — The number of Class 3 frames discarded due to destination
unreachable upon reception from the point of time the counter was reset.
• FEC Corrected Blocks — Indicates the FEC Corrected Blocks Count.
Brocade SAN Analytics Management Pack for VMware vCenter Operations Management Suite User Manual
53-1003192-01
9
2
FC Port resources
• FEC Uncorrected Blocks — Indicates the FEC Uncorrected Blocks Count.
• Invalid Ordered Sets — The total number of invalid ordered sets received at the port.
• Invalid Transmissions — The number of transmission words that had an invalid character
(8b10b code violation) in one or more of its characters, had a K28.5 (8b10b control) in its
second, third, or fourth character position, or had an incorrect Beginning Running Disparity.
This count is part of the Link Error Status Block (LESB).
• Rx Link Resets — The total number of Link resets. This count is the number of link resets
received.
• Sequence Errors — The total number of primitive sequence protocol errors that detected at this
port. This count is part of the Link Error Status Block (LESB).
• Signal Losses — The number of times the signal is lost on the Port since the last device reset.
This count is part of the Link Error Status Block (LESB).
• Sync Losses — The number of times that synchronization is lost on the Port since the last
device reset. Synchronization is assumed lost which a timeout period (identified by the
Receiver Transmitter Timeout property) is exceeded. This count is part of the Link Error Status
Block (LESB).
• Truncated Frames — The total number of frames received at this port where the frame length
was less than the minimum indicated by the frame header.
• Tx Link Resets — The total number of Link resets. This count is the number of link resets
transmitted.
10
Brocade SAN Analytics Management Pack for VMware vCenter Operations Management Suite User Manual
53-1003192-01
Chapter
SAN Event Handling
3
In this chapter
• SAN events . . . . . . . . . . . . . . . . . . . . . . . . . . . . . . . . . . . . . . . . . . . . . . . . . . . . 11
• Event handling configuration . . . . . . . . . . . . . . . . . . . . . . . . . . . . . . . . . . . . . 12
SAN events
The Brocade SAN Analytics Management Pack for VMware vCenter Operations Management Suite
displays Monitoring and Alerting Policy Suite (MAPS), Fabric, and Switch alerts received from the
Brocade Network Advisor server. Before you can view event alerts, you must configure event
handling for vCenter Operations Manager and Brocade Network Advisor (refer to “Event handling
configuration” on page 12).
MAPS alerts
For switch resources, all MAPS violations on the switch display as an alert on the switch in the
Health Tree for the violations received from switch or Brocade Network Advisor server. Click a
switch in the Health Tree to display the alerts specific to the switch in the Alerts widget.
The Brocade SAN Analytics Management Pack for VMware vCenter Operations Management Suite
displays the following MAPS violations from the switch resources.
• Fabric Health violation — Monitors potential problems arising between devices, such as zone
changes, fabric segmentation, downed E_Ports, fabric reconfiguration, domain ID changes,
and fabric log ins.
• Traffic/Flow violation — Monitors the source and destination of traffic and flows.
• Switch FC Port violation — Monitors the number of violations for each product based on the
selected fabric and a specified time range. There are four port health violation widgets: All, ISL,
Initiator, and Target.
• Switch Policy Status violation — Monitors the health of the switch by defining the number of
errors that transitions the overall switch state into a state that is not healthy. For example, you
can specify a switch policy so that if a switch has two port failures, it is considered to be in a
marginal state; if it has four failures, it is in a down state.
• Switch resource violation — Monitors the system RAM, flash, CPU, and memory.
• Switch Security violation — Monitors monitors different security violations on the switch and
takes action based on the configured thresholds and their actions.
Brocade SAN Analytics Management Pack for VMware vCenter Operations Management Suite User Manual
53-1003192-01
11
3
Event handling configuration
Fabric and switch alerts
The Brocade SAN Analytics Management Pack for VMware vCenter Operations Management Suite
displays the CIM event and SNMP trap alerts from the fabric and switch resources. The following
table lists the CIM event and SNMP trap alerts that display and details the associated resource for
each of the events with their type and severity level.
TABLE 3
Fabric and switch alerts
Name
Type
Level
Associated Resource
Zone DB Change event
CIM Indication
Informational
Fabric
Zone set Activate Event
CIM Indication
Informational
Fabric
Port Online
SNMP Trap
Informational
Switch
Port Offline
SNMP Trap
Critical
Switch
Bottleneck detected
SNMP Trap
Critical
Switch
Bottleneck cleared
SNMP Trap
Informational
Switch
Map Events
CIM Indication
Warning
Switch
Event handling configuration
You must configure vCenter Operations Manager and Brocade Network Advisor to enable event
handling so that the adapter receives events from Brocade Network Advisor. You should also make
sure that devices are configured to send traps to Brocade Network Advisor. For vCenter Operation
Manager, the SNMP port is specified when you create the adapter instance (refer to “Creating the
adapter instance” on page 3).
Configuring vCenter Operations Manager for event handling
You must configure the TCP and UDP ports in the firewall configuration (vcopsfirewall.conf) file
located in the /usr/lib/vmware-vcops/user/conf/install/ directory of the Analytics virtual machine
1. Open the vcopsfirewall.conf file in a text editor (such as Notepad).
2. Add the TCP and UDP ports port numbers (any number where socket can be opened) using the
following format:
TCPPORTS="$TCPPORTS 5999" (TCP Ports)
UDPPORTS="$UDPPORTS 16200" (UDP ports)
3. Select File > Save.
4. Open a command prompt on the Analytics virtual machine and run the following commands:
•
•
12
service vcops restart collector
/etc/init.d/vcopsfirewall restart
Brocade SAN Analytics Management Pack for VMware vCenter Operations Management Suite User Manual
53-1003192-01
Event handling configuration
3
Configuring Brocade Network Advisor event handling
You need to configure Brocade Network Advisor to forward SNMP events and traps to the vCenter
Operation Manager SNMP listening port.
1. Select Monitor > SNMP Setup > Trap Forwarding.
The SNMP Trap Forwarding dialog box displays.
2. Select the Enable trap forwarding check box.
3. Click Add in the Destinations area to add the vCenter Operation Manager Analytics virtual
machine as the trap recipient.
The Add Trap Destination dialog box displays.
4. Enter vCOPs Trap Forward in the Description field.
5. Enter the IP address of the vCenter Operation Manager Analytics virtual machine in the IP
Address field.
This is a mandatory field. IPv4 and IPv6 addresses are accepted, but a DNS name is not
accepted.
6. Enter the SNMP trap listening port of the recipient in the Port # field.
This is a mandatory field. Valid numeric values range from 1 through 65535.
The Enable check box, Add Source Address check box, and SNMP Trap Repeater check box are
selected by default. When selected, all traps, whether the source is managed or unmanaged,
are forwarded. When unselected, only traps from the selected products are forwarded. When
selected, the Open View Source Name is added to the variable binding (varbind) value to the
trap before forwarding.
7.
Select a supported SNMP type from the Trap Forwarding Type list.
Supported SNMP types are v1, v2c, and v3. The default SNMP type is v1.
8. Select snmp traps for vcops in the Available Filters list and click the right arrow button to move
them to the Selected Filters list.
9. Click OK on the Add Trap Destination dialog box.
10. Click Add in the Trap Filters area of the SNMP Trap Forwarding dialog box.
The Add Trap Filter dialog box displays.
11. Enter snmp trap for vcops in the Filter Name field.
12. Select Warning from the Severity list.
Traps with the selected severity and those with higher severity levels are forwarded. By
selecting Warning traps with Warning, Error, Critical, Alert, and Emergency severity levels are
forwarded.
13. Select the SAN tab.
The products available to which you can add a trap filter display in the Available Products list.
14. Select the products you want in the Available Products list and click the right arrow button to
move them to the Selected Products list.
By default, all traps are listed in the Available Traps list, under the folders for the MIB to which
they belong.
Brocade SAN Analytics Management Pack for VMware vCenter Operations Management Suite User Manual
53-1003192-01
13
3
Event handling configuration
15. Select the MIB Alias check box to display trap aliases.
16. Select BD-MD and SW-MB from the Available Trap Type list and click the right arrow button to
move them to the Selected Trap Type list.
17. Click OK on the Add Trap Filter dialog box.
SNMP Traps and Syslog messages from the selected switches or fabric will now be forwarded
to the configured destination server.
18. Click OK on the SNMP Trap Forwarding dialog box.
Configuring devices for event handling
1. Login to the device.
2. Use the snmptraps --send -trap_name bd-trap to send bottleneck traps.
To remove an old bottleneck event from the interface, use the snmptraps --send -trap_name
bd-clear-trap to clear bottleneck traps.
3. Use the snmpconfig –show snmpv1 command to make sure that the v1 traps are forwarded to
Brocade Network Advisor.
If the Brocade Network Advisor server does not display in the list, use the snmpconfig –set
snmpv1 command to add it.
4. Use the snmpconfig –show snmpv3 to make sure that the v3 traps are forwarded to Brocade
Network Advisor.
If the Brocade Network Advisor server does not display in the list, use the snmpconfig –set
snmpv3 command to add it.
Verifying alerts
When you complete configuration of vCenter Operations Manager, Brocade Network Advisor, and
any devices for event handling, generate events in Brocade Network Advisor to verify the alerts in
the vCenter Operations Manager.
14
Brocade SAN Analytics Management Pack for VMware vCenter Operations Management Suite User Manual
53-1003192-01
Chapter
4
SAN Dashboards
In this chapter
• Brocade troubleshooting dashboard overview . . . . . . . . . . . . . . . . . . . . . . .
• Brocade - SAN Troubleshooting dashboard . . . . . . . . . . . . . . . . . . . . . . . . . .
• Brocade - VM Troubleshooting dashboard . . . . . . . . . . . . . . . . . . . . . . . . . . .
• Brocade - SAN Utilization dashboard . . . . . . . . . . . . . . . . . . . . . . . . . . . . . . .
• Brocade - Health Overview dashboard. . . . . . . . . . . . . . . . . . . . . . . . . . . . . .
• Building a Brocade dashboard . . . . . . . . . . . . . . . . . . . . . . . . . . . . . . . . . . . .
• Launch in context support for Brocade Network Advisor . . . . . . . . . . . . . . .
15
16
17
18
19
20
22
Brocade troubleshooting dashboard overview
The Brocade SAN Analytics Management Pack for VMware vCenter Operations Management Suite
comes with custom dashboards for troubleshooting. You can access these dashboards from the
Dashboards menu. To view a dashboard, select Dashboard > dashboard_name (where
dashboard_name is one of the following options:
•
•
•
•
Brocade - SAN Troubleshooting
Brocade - VM Troubleshooting
Brocade - SAN Utilization
Brocade - Health Overview
Brocade SAN Analytics Management Pack for VMware vCenter Operations Management Suite User Manual
53-1003192-01
15
4
Brocade - SAN Troubleshooting dashboard
Brocade - SAN Troubleshooting dashboard
FIGURE 2
Brocade - SAN Troubleshooting dashboard
The Brocade - SAN Troubleshooting dashboard contains the following widgets:
• Brocade Fabric Resources widget — This widget displays all fabric and switch resources
collected by the adapter. Select a resource in this widget to populate the Health Tree widget.
• Health Tree widget — This widget displays the relationship of the selected resource to other
resources in the fabric. Select a resource in this widget to populate the Alerts and Metric
Selector widgets.
• Alerts widget — This widget displays outstanding alerts (dynamic and hard threshold violations
and informational alerts sent by the server) for the selected resource.
• Metric Selector widget — This widget displays the metrics available for the selected resource.
Select a resource in this widget to populate the Metric Graph widget.
• Metric Graph widget — This widget shows graphs for the selected metric.
16
Brocade SAN Analytics Management Pack for VMware vCenter Operations Management Suite User Manual
53-1003192-01
Brocade - VM Troubleshooting dashboard
4
Brocade - VM Troubleshooting dashboard
FIGURE 3
Brocade - VM Troubleshooting Dashboard
The Brocade - VM Troubleshooting dashboard contains the following widgets:
• Brocade VM Resources widget — This widget displays all virtual machine resources collected by
the adapter. When you select a virtual machine connected to a fabric, the fabric connectivity
displays in the Health Tree widget.
• Health Tree widget — This widget displays the relationship of the selected resource to other
resources in the fabric. Select a resource in this widget to populate the Alerts and Metric
Selector widgets.
• Alerts widget — This widget displays outstanding alerts (dynamic and hard threshold violations
and informational alerts sent by the server) for the selected resource.
• Metric Selector widget — This widget displays the metrics available for the selected resource.
Select a resource in this widget to populate the Metric Graph widget.
• Metric Graph widget — This widget shows graphs for the selected metric.
Brocade SAN Analytics Management Pack for VMware vCenter Operations Management Suite User Manual
53-1003192-01
17
4
Brocade - SAN Utilization dashboard
Brocade - SAN Utilization dashboard
FIGURE 4
Brocade - SAN Utilization dashboard
The Brocade - SAN Utilization dashboard contains the following widgets:
• Top 25 Port Rx % Utilization widget — This widget displays the 25 ports with the highest
percentage of received data to the maximum amount of data that can be received
• Top 25 Port Tx % Utilization widget — This widget displays the 25 ports with the highest
percentage of transmitted data to the maximum amount of data that can be transmitted.
• Top 25 Port Rx (MB/sec) widget — This widget displays the 25 ports with the highest number of
megabytes received from the point of time the counter was reset.
• Top 25 Port Tx (MB/sec) widget — This widget displays the 25 ports with the highest number of
megabytes transmitted from the point of time the counter was reset.
• Top 25 Host System Read Rate (KBPS) widget — This widget displays the 25 host systems with
the highest disk read rate in KiloBytes per second (KBps).
• Top 25 Host System Write Rate (KBPS) widget — This widget displays the 25 host systems with
the highest disk write rate in KiloBytes per second (KBps).
18
Brocade SAN Analytics Management Pack for VMware vCenter Operations Management Suite User Manual
53-1003192-01
Brocade - Health Overview dashboard
4
Brocade - Health Overview dashboard
FIGURE 5
Brocade - Health Overview dashboard
The Brocade - Health Overview dashboard contains the following widgets:
• Health Overview widget — This widget displays an overview of the current operational status for
each resource (such as host or fabric) as a colored health badge. The operational status health
badges include Good (green), Abnormal (yellow), Degraded (orange), Bad (red), Unknown (grey
with a question mark), and Offline (grey with an X). Select a fabric widget to populate the Alerts
and Mashup Charts widgets.
• Alerts widget — This widget displays outstanding alerts (dynamic and hard threshold violations
and informational alerts sent by the server) for the selected resource.
• Mashup Charts widget — This widget displays the health and anomaly count graphs for the
selected resource.
Brocade SAN Analytics Management Pack for VMware vCenter Operations Management Suite User Manual
53-1003192-01
19
4
Building a Brocade dashboard
Building a Brocade dashboard
When your user account is created, a vCenter Operations Manager administrator assigns you to
one or more user groups. These user groups determine which dashboards are available to you
when you first log in to vCenter Operations Manager. However, if the predefined dashboards do not
meet your needs, you can create a custom dashboards.
To create a new dashboard, complete the following steps.
1. Select Dashboards > Add.
2. Add widgets to the dashboard by dragging each widget from the left pane to the right pane.
For more information about widgets, refer to Chapter 4, Using and Configuring Widgets in the
VMware vCenter Operations Manager Getting Started Guide - Custom User Interface.
3. Select the number of columns (1, 2, or 3) to use on the dashboard from the Select Layout
drop-down menu.
4. (Optional) To change the size of the columns, drag the divider bars under Drag to Change
Layout.
5. Type a name for the new dashboard in the Tab Name text box.
To make the new dashboard appear in a group in the Dashboards menu, use the following
syntax for the dashboard name.
dashboard-group/dashboard-name
Where dashboard-group is the name of a dashboard group and dashboard-name is the name
of the new dashboard. If the dashboard group already exists, the new dashboard appears in
the existing group. If the dashboard group does not already exist, vCenter Operations Manager
adds it. You can nest dashboard groups by typing multiple dashboard group names, for
example, dashboard-group/dashboard-group/dashboard-name
NOTE
Only the dashboard-name appears in the Dashboard menu and on the dashboard tab.
6. (Optional) Make the new dashboard your default dashboard by selecting Yes next to Mark as
Default.
7.
Click OK to save your changes.
For more information about building and managing dashboards, refer to Chapter 3, Designing
Your Workspace in the VMware vCenter Operations Manager Getting Started Guide - Custom
User Interface.
20
Brocade SAN Analytics Management Pack for VMware vCenter Operations Management Suite User Manual
53-1003192-01
Building a Brocade dashboard
4
Adding resource kinds
You must add one or more of the following resource kinds to the Resource widget:
•
•
•
•
Fabric
Switch
Port
Storage
To add resources to the widget, complete the following steps.
1. Click the Edit Resources icon on the Resource widget’s toolbar.
2. Select one or more of the resource kinds (see list above) in the Select which tags to filter list to
configure the Resources widget to show only resources that have these tag values.
FIGURE 6
Select which tags to filter list
3. Click OK to save your changes.
For more information about configuring individual widgets, refer to Chapter 4, Using and
Configuring Widgets in the VMware vCenter Operations Manager Getting Started Guide Custom User Interface.
Brocade SAN Analytics Management Pack for VMware vCenter Operations Management Suite User Manual
53-1003192-01
21
4
Launch in context support for Brocade Network Advisor
Editing the widget name
You can customize the name of a widget to make it more meaningful to you.
To customize a widget name, complete the following steps.
1. Click the Edit Resources icon on the widget’s toolbar.
2. Type another name in the Widget title text box to customize the name of the widget.
3. Click OK to save your changes.
For more information about editing widgets, refer to Chapter 4, Using and Configuring Widgets
in the VMware vCenter Operations Manager Getting Started Guide - Custom User Interface.
Launch in context support for Brocade Network Advisor
NOTE
Launch in context is not supported on Brocade Network Advisor headless version.
The Brocade SAN Analytics Management Pack for VMware vCenter Operations Management Suite
enables you to launch Brocade Network Advisor for fabrics, switches, and switch ports from the
following page and widgets:
•
•
•
•
Environment Overview page
Resource Detail page
Resources widget
Health Tree widget
To launch Brocade Network Advisor, complete the following steps.
1. Select a fabric, switch, or switch port from the Environment Overview page, Resource Detail
page, Resources widget, or Health Tree widget.
FIGURE 7
Launch in context list
2. Click the Open in external application icon on the toolbar and select Open Brocade Network
Advisor from the list.
22
Brocade SAN Analytics Management Pack for VMware vCenter Operations Management Suite User Manual
53-1003192-01