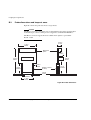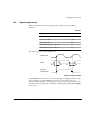
1
ARM MultiTrace
®
Version 1.0
User Guide
Copyright © 2001 ARM Limited. All rights reserved.
ARM DUI 0150A
ARM MultiTrace
User Guide
Copyright © 2001 ARM Limited. All rights reserved.
Release Information
The following changes have been made to this document.
Change history
Date
Issue
Change
19 February 2001
A
First Release
Proprietary Notice
Words and logos marked with ® or ™ are registered trademarks or trademarks owned by ARM Limited. Other
brands and names mentioned herein may be the trademarks of their respective owners.
Neither the whole nor any part of the information contained in, or the product described in, this document
may be adapted or reproduced in any material form except with the prior written permission of the copyright
holder.
The product described in this document is subject to continuous developments and improvements. All
particulars of the product and its use contained in this document are given by ARM in good faith. However,
all warranties implied or expressed, including but not limited to implied warranties of merchantability, or
fitness for purpose, are excluded.
This document is intended only to assist the reader in the use of the product. ARM Limited shall not be liable
for any loss or damage arising from the use of any information in this document, or any error or omission in
such information, or any incorrect use of the product.
Conformance Notices
This section contains ElectroMagnetic Conformity (EMC) notices.
Federal Communications Commission Notice
This device is test equipment and consequently is exempt from part 15 of the FCC Rules under section 15.103.
CE Declaration of Conformity
This equipment has been tested according to ISE/IEC Guide 22 and EN 45014. It conforms to the following
product EMC specifications:
The product herewith complies with the requirements of EMC Directive 89/336/EEC as amended.
ii
Copyright © 2001 ARM Limited. All rights reserved.
ARM DUI 0150A
Contents
ARM MultiTrace User Guide
Preface
About this document ...................................................................................... vi
Further reading ............................................................................................ viii
Feedback ....................................................................................................... ix
Chapter 1
Introduction
1.1
1.2
Chapter 2
Getting Started
2.1
2.2
2.3
Chapter 3
Configuring MultiTrace ................................................................................ 3-2
Performing a trace ...................................................................................... 3-7
MultiTrace Interface Connections
A.1
A.2
ARM DUI 0150A
System requirements .................................................................................. 2-2
Connecting the MultiTrace hardware .......................................................... 2-4
Configuring the Ethernet interface .............................................................. 2-8
Using MultiTrace with the Trace Debug Tools
3.1
3.2
Appendix A
About MultiTrace ......................................................................................... 1-2
Availability and compatibility ....................................................................... 1-4
MultiTrace interface .................................................................................... A-2
Trace signals ............................................................................................... A-5
Copyright © 2001 ARM Limited. All rights reserved.
iii
Contents
Appendix B
Designing the Target Board
B.1
B.2
B.3
B.4
B.5
Overview of high-speed design ..................................................................
Termination .................................................................................................
Probe dimensions and keep out areas .......................................................
Signal requirements ....................................................................................
Probe modelling ..........................................................................................
B-2
B-3
B-6
B-7
B-8
Glossary
iv
Copyright © 2001 ARM Limited. All rights reserved.
ARM DUI 0150A
Preface
This preface introduces the MultiTrace User Guide. It explains the structure of the User
Guide and lists other sources of information that relate to MultiTrace, the ARM Trace
Debug Tools, and ARM debuggers. It contains the following sections:
•
About this document on page vi
•
Further reading on page viii
•
Feedback on page ix.
ARM DUI 0150A
Copyright © 2001 ARM Limited. All rights reserved.
v
Preface
About this document
This document describes version 1.0 of MultiTrace, the ARM Trace Port Analyzer
(TPA).
Intended audience
This document is aimed at experienced hardware and software engineers. Some
sections of this manual assume prior knowledge of some aspects of the ARM
Architecture.
Organization
This document is organized into the following chapters and appendices:
Chapter 1 Introduction
Read this chapter for a description of what is provided in the MultiTrace
product.
Chapter 2 Getting Started
Read this chapter for information on how to start working with
MultiTrace. The chapter includes the hardware and software system
requirements, how to connect up the hardware, and start the debugger.
Chapter 3 Using MultiTrace with the Trace Debug Tools
This chapter describes how to:
•
connect MultiTrace to an ARM debugger
•
change the behavior of MultiTrace.
You must read this chapter in conjunction with the debugger user
documentation, for example the ADS Debuggers Guide.
Appendix A MultiTrace Interface Connections
This appendix describes and illustrates the interface cable pin
connections.
Appendix B Designing the Target Board
This appendix provides the details necessary to design a target board that
can operate with MultiTrace.
vi
Copyright © 2001 ARM Limited. All rights reserved.
ARM DUI 0150A
Preface
Typographical conventions
The following typographical conventions are used in this document:
bold
Highlights ARM processor signal names within text, and interface
elements such as menu names. Can also be used for emphasis in
descriptive lists where appropriate.
italic
Highlights special terminology, cross-references and citations.
typewriter
Denotes text that can be entered at the keyboard, such as commands, file
names and program names, and source code.
typewriter
Denotes a permitted abbreviation for a command or option. The
underlined text can be entered instead of the full command or option
name.
typewriter italic
Denotes arguments to commands or functions where the argument is to
be replaced by a specific value.
typewriter bold
Denotes language keywords when used outside example code.
ARM DUI 0150A
Copyright © 2001 ARM Limited. All rights reserved.
vii
Preface
Further reading
This section lists publications by ARM Limited, and by third parties, that are related to
this product.
ARM publications
Read the following ARM documents for more information on using trace and debug
tools:
•
AXD Trace Debug Tools User Guide (ARM DUI 0118).
•
ARM Developer Suite (ADS) manual set, in particular the ADS Debug Target
Guide (ARM DUI 0058)
•
ARM Architecture Reference Manual (ARM DUI 0100) is the main reference
source for information on ARM processors
•
ARM Multi-ICE Installation Guide (ARM DSI 0005) and ARM Multi-ICE User
Guide (ARM DUI 0048).
The following manuals can be useful for engineers using the respective ARM CPU
cores:
•
ARM7TDMI Data sheet (ARM DDI 0029)
•
ARM9TDMI Technical Reference Manual (ARM DDI 0145).
Application Note 38 and the technical reference manuals can be downloaded from the
ARM website. The ARM Architecture Reference Manual is a published book, ISBN
0-13-736299-4. The other documents are supplied with the appropriate products.
viii
Copyright © 2001 ARM Limited. All rights reserved.
ARM DUI 0150A
Preface
Feedback
ARM Limited welcomes feedback both on MultiTrace and on the documentation.
Feedback on MultiTrace
If you have any problems with MultiTrace, please contact your supplier. To help them
provide a rapid and useful response, please give:
•
the MultiTrace version you are using
•
details of the platforms you are using, including both the host and target hardware
types and operating system
•
where appropriate, a small standalone sample of code that reproduces the problem
•
a clear explanation of what you expected to happen, and what actually happened
•
the commands you used, including any command-line options
•
if possible, sample output illustrating the problem.
Feedback on this document
If you have any comments on this document, please send email to errata@arm.com
giving:
•
the document title
•
the document number
•
the page number(s) to which your comments refer
•
a concise explanation of your comments.
General suggestions for additions and improvements are also welcome.
ARM DUI 0150A
Copyright © 2001 ARM Limited. All rights reserved.
ix
Preface
x
Copyright © 2001 ARM Limited. All rights reserved.
ARM DUI 0150A
Chapter 1
Introduction
This chapter introduces MultiTrace Version 1.0 and describes its hardware and software
components and documentation. It contains the following sections:
•
About MultiTrace on page 1-2
•
Availability and compatibility on page 1-4.
ARM DUI 0150A
Copyright © 2001 ARM Limited. All rights reserved.
1-1
Introduction
1.1
About MultiTrace
The MultiTrace unit works in conjunction with the ARM Multi-ICE to provide
RealTrace functionality for software running in leading edge System-on-Chip (SoC)
devices with deeply embedded processor cores.
MultiTrace has the following features:
•
MultiTrace passively collects information from an ARM based SoC containing an
Embedded Trace Macrocell (ETM). The ETM monitors the ARM instruction and
data buses at full core speeds.
•
It collects trace information at clock speeds of up to 200MHz.
•
Uploading to Trace Debug Tools (TDT) uses Ethernet 10/100baseT
•
Data port widths of 4, 8, and 16 bits are supported.
•
A half rate trace clock is supported that captures data on both the rising and falling
clock edges.
•
The SoC voltage can be in the range of 1.0 to 3.3V.
•
Trace information is time stamped at a resolution of 10ns.
•
MultiTrace forms one component in the ARM Real-Time Trace (RealTrace)
debugging system. RealTrace consists of:
— Trace Debug Tools (TDT)
— MultiTrace
— Multi-ICE
— RealMonitor.
A typical system is shown in Figure 1-1.
PC running
AXD and TDT
Ethernet
Parallel-port
cable
MultiTrace
Multi-ICE
Data
cable
5-wire
JTAG
Trace
Probe
JTAG
port
ARM Core
Trace
port
Embedded Trace
Macrocell
ASIC
Figure 1-1 Trace system
1-2
Copyright © 2001 ARM Limited. All rights reserved.
ARM DUI 0150A
Introduction
1.1.1
The MultiTrace product
The MultiTrace product comprises:
1.1.2
•
an interface unit that connects to an Ethernet LAN
•
a cable to connect the interface unit to a trace port
•
software on CD-ROM that enables an ARM debugger to communicate with the
interface unit
•
a serial cable that can be used to configure and operate the MultiTrace unit if
Ethernet is not available
•
a power supply for the MultiTrace unit
•
printed copies of this User Guide and an Installation Guide.
Capture rates
The ETM on the target board can output 4, 8, or 16 trace data bits. Half rate clocking
allows data to be output from the ETM on both edges of TRACECLK. This effectively
halves the clock frequency.
Multiplexed mode allows 2 or 4 consecutive trace samples to written to same memory
location within MultiTrace. This effectively reduces the speed of operation of internal
circuitry and also increases the trace depth. It has the disadvantage of coarser time
stamping. The system has the capability to set the port width automatically from the
Configure ETM dialog.
Half rate clocking and multiplexing facilities provide correct operation at TRACECLK
frequencies above 100Mhz. Below 100Mhz, the MultiTrace system will operate
without these facilities.
ARM DUI 0150A
Copyright © 2001 ARM Limited. All rights reserved.
1-3
Introduction
1.2
Availability and compatibility
MultiTrace is available from ARM Limited and its resellers as a package that includes
both the hardware and the software. Contact ARM Limited directly regarding OEM
licenses.
1.2.1
Debugger
The ARM Developer Suite (ADS 1.1) CD-ROM for Windows includes the ARM
eXtendable Debugger (AXD). This debugger fully supports MultiTrace.
MultiTrace is also compatible with third-party debuggers that conform to the ARM
standard RDI 1.51tx interface.
1.2.2
Target board
The target board must have a device with an ARM core and the Embedded Trace
Macrocell (ETM). The board connects to the MultiTrace unit using the connector
described in Appendix A MultiTrace Interface Connections.
1-4
Copyright © 2001 ARM Limited. All rights reserved.
ARM DUI 0150A
Chapter 2
Getting Started
This chapter describes how to connect the parts of MultiTrace together and how to
configure the MultiTrace software. It contains the following sections:
•
System requirements on page 2-2
•
Connecting the MultiTrace hardware on page 2-4
•
Configuring the Ethernet interface on page 2-8.
ARM DUI 0150A
Copyright © 2001 ARM Limited. All rights reserved.
2-1
Getting Started
2.1
System requirements
This section describes the hardware and software requirements of MultiTrace:
•
Host software requirements on page 2-2
•
Host hardware requirements on page 2-3
•
Target hardware requirements on page 2-3.
2.1.1
Host software requirements
The software component of MultiTrace consists of the MultiTrace DLL. This DLL must
be run on the PC running the debugger. Table 2-1 identifies the operating systems you
that support the DLL.
Table 2-1 Supported operating systems for MultiTrace
Operating system
MultiTrace
DLL
Windows 95
yes
Windows 98
yes
Windows NT 4.0 (Intel)
yes
Windows 2000
yes
Solaris
no
HP-UX
no
A compatible debugger is required to use the MultiTrace DLL. The AXD debugger
supplied in version 1.1 of ADS is suitable, as are debuggers supplied by third parties
that conform to the ARM RDI 1.51tx specification. A run controller, Multi-ICE for
example, is also required.
2-2
Copyright © 2001 ARM Limited. All rights reserved.
ARM DUI 0150A
Getting Started
2.1.2
Host hardware requirements
The minimum recommended hardware requirements for installing and running
MultiTrace are:
•
200MHz Pentium PC
•
system memory:
— 32MB RAM for Windows 95 and Windows 98
— 64MB RAM for Windows NT and Windows 2000.
•
CD-ROM drive (can be used across a network)
•
an OS supported graphics device capable of VGA resolution or better
•
parallel port
•
network card.
Disk space
If you wish to carry out a full installation of the software, up to 3MB of hard disk space
is required.
2.1.3
Target hardware requirements
MultiTrace supports processors containing ARM cores and the ETM. The board
containing the processor must have a trace port connector.
Caution
Target hardware running at high frequencies and not following the design guidelines
specified in Appendix B Designing the Target Board might exhibit irregularities in the
trace data. Typical symptoms of this are missed triggers, trace data synchronization
failures, and memory access failures. Ensure that your target hardware is capable of
running at the selected frequency.
ARM DUI 0150A
Copyright © 2001 ARM Limited. All rights reserved.
2-3
Getting Started
2.2
Connecting the MultiTrace hardware
This section explains how to set up the hardware for MultiTrace.
2.2.1
What you require
To set up the hardware you require the following items from the MultiTrace product kit:
•
A communications connection for configuring MultiTrace. This can be either:
—
An Ethernet connection.
—
The supplied serial cable and a free serial port on your PC. (This cable is
only used for configuration when an Ethernet connection is not available.)
•
The interface cable (a flat ribbon cable with a square Insulation Displacement
Connector (IDC)) socket at each end.
•
The MultiTrace interface unit (a small flat box with MultiTrace written on it).
•
The supplied power supply.
Caution
MultiTrace has been tested with the supplied power supply. Using another power
supply might cause overheating or damage to the power supply or MultiTrace
unit.
•
The trace probe. This is a small PCB that contains the interface circuits that buffer
the signals between the target board and the interface cable.
You must also provide the following items:
2-4
•
a computer with an Ethernet connection, running an operating system supported
by the MultiTrace DLL (see Table 2-1 on page 2-2)
•
some target hardware containing a device supported by MultiTrace (see Target
hardware requirements on page 2-3).
Copyright © 2001 ARM Limited. All rights reserved.
ARM DUI 0150A
Getting Started
2.2.2
Connection instructions
To connect the hardware together and configure the software:
1.
Ensure the debugger, TDT, Multi-ICE, and MultiTrace software is installed on the
host machine. For details, see Installing the MultiTrace software in the
MultiTrace Installation Guide and the installation guides provided with the
products.
2.
MultiTrace requires a TCP/IP network and must be allocated an IP address. The
default configuration for MultiTrace is to use auto-configure and a DHCP
assigned address. (Contact your system administrator for this address.)
3.
Connect the power supply cable from the mains power unit (5V) to the MultiTrace
power connector.
4.
Configure the MultiTrace unit using either an Ethernet or serial connection:
•
if you are using an Ethernet cable, follow the instructions in Configuring the
Ethernet interface on page 2-8 and Using the Ethernet Configuration
Utility, TPACONFIG.EXE on page 2-9
•
if you are using a serial cable, follow the instructions in Configuring the
Ethernet interface on page 2-8 and Using the Serial Configuration Utility,
STPACONFIG.EXE on page 2-14.
Note
Do not connect both the Ethernet and serial cables to the unit at the same time.
The unit will not operate. The MultiTrace unit can be configured and operated
over the serial cable, but performance is considerably decreased.
Note
You can either connect the MultiTrace box to an existing Ethernet network (as
shown in Figure 2-2 on page 2-6) or directly to the Ethernet connection on a
standalone PC (as shown in Figure 2-3 on page 2-7).
If you are connecting directly to a standalone PC, disable DHCP and set the
addresses manually. For standalone operation, you must use a crossover twisted
pair cable.
5.
Install the Multi-ICE hardware and software as described in the Multi-ICE
Installation Guide.
If your target board does not have separate trace and Multi-ICE sockets, use the
Multi-ICE socket on the trace probe as shown in Figure 2-1 on page 2-6.
ARM DUI 0150A
Copyright © 2001 ARM Limited. All rights reserved.
2-5
Getting Started
Figure 2-1 Multi-ICE connector on probe
6.
Connect one end of the Ethernet cable to a LAN and the other end of the cable to
the MultiTrace interface unit.
7.
Connect one end of the interface cable to the MultiTrace connector, and the other
end of the cable to the trace probe.
Plug the trace probe into the trace connector on the target board.
Host workstation
running AXD and TDT
Host workstation
running Multi-ICE server
Local Area Network
Network
cable
Network
cable
Parallel
port cable
10BaseT
etnernet cable
ICE interface unit
M
R
A
Multi
Mu
E
IC
M
R
A
DC power cable
to 5V PSU
Mul
ti
w
ie
lV
ea
R
lti
w
ie
lV
ce
ea
R
a
Tr
20-way ribbon
cable
Trace interface unit
Multi
Target board
60-way high
density ribbon cable
Target buffer
board
JTAG IDC socket
Trace Mictor socket
Figure 2-2 Remote operation
2-6
Copyright © 2001 ARM Limited. All rights reserved.
ARM DUI 0150A
Getting Started
Host workstation running
AXD and TDT
10BaseT Ethnernet
crossover cable
Parallel
port cable
ICE interface unit
M
R
A
Multi
Mu
w
ie
lV
E
ea
IC
R
lti
M
R
A
DC power cable
to 5V PSU
Mu
20-way ribbon
cable
R
e
w
ie
lV
ea
ac
Tr
lti
Trace interface unit
Multi
Target board
60-way high
density ribbon cable
JTAG IDC socket
Target buffer
board
Trace Mictor socket
Figure 2-3 Standalone operation
ARM DUI 0150A
8.
Configure your debugger and trace tools. Refer to the ARM Trace Debug Toolkit
User Guide and AXD User Guide for more details.
9.
Use your debugger to load an image and start a trace session.
Copyright © 2001 ARM Limited. All rights reserved.
2-7
Getting Started
2.3
Configuring the Ethernet interface
The parameters available for configuration are:
•
Network Type
•
IP Address
•
Subnet Mask
•
Default Gateway.
The Network Type specifies the speed (10Mb/sec or 100Mb/sec) and full/half duplex
nature of the network connection. You can set this manually or MultiTrace can be
instructed to auto-detect the network type.
If your network uses DHCP to automatically allocate IP addresses, you must enable
DHCP in the MultiTrace configuration. If your network uses fixed IP addresses, you
must obtain a new address and enter this into the MultiTrace configuration. If you do
not know your subnet mask and default gateway, ask your network administrator. These
parameters must be entered correctly if you are not using DHCP.
Note
If you are using Windows 95, Windows 98, or Windows NT, certain IP addresses are
not legal. You are recommended to avoid class A addresses (that is, ones of the form
63.0.0.0).
2.3.1
Using the MultiTrace host name with DHCP
When MultiTrace is shipped, it has its Network Type set to Auto-Detect and the TCP/IP
parameters obtained through a DHCP server. If your network supports this
configuration, the MultiTrace unit is ready to run out of the box.
If MultiTrace is configured to use DHCP, it obtains a new IP address each time it is
powered up. You can use the browser in the MultiTrace configuration dialog to locate
your MultiTrace unit on the network. Unfortunately, You must repeat this step every
time you power up the unit. There are two possible solutions to this problem, either:
2-8
•
Configure your DHCP server to always assign the same IP address to your
MultiTrace unit. Your can now leave the software configured to use this fixed IP
address.
•
Specify a unique host name for the MultiTrace unit. You can configure the
MultiTrace software to connect to this fixed host name. This requires integrated
DHCP and DNS systems on your network. Your network administrator can
provide further assistance.
Copyright © 2001 ARM Limited. All rights reserved.
ARM DUI 0150A
Getting Started
Note
The alternatives to locating your MultiTrace unit each time you log on might not be
possible on your network. Contact your network administrator for more information.
2.3.2
Using the Ethernet Configuration Utility, TPACONFIG.EXE
Follow the steps below to configure your MultiTrace unit:
1.
Start the Ethernet Configuration Utility from the Start menu. The window shown
in Figure 2-4 is displayed.
Figure 2-4 TPA Configuration
2.
Scan the local network for MultiTrace units. To do this either:
•
click the scan toolbar icon
•
select TPA → Scan from the main menu.
After a few seconds the TPAConfig window displays the MultiTrace units it has
discovered. The window should look like Figure 2-5.
Figure 2-5 Devices found
ARM DUI 0150A
Copyright © 2001 ARM Limited. All rights reserved.
2-9
Getting Started
3.
4.
In the case where the configuration utility finds several MultiTrace units, you
must identify which one you intend to change. There are several ways to do this:
•
The first column shows the Ethernet Address. Each MultiTrace unit has
label on it showing its Ethernet address. This can be matched against the
number displayed in the window.
•
The default Host Name (described in more detail in step 6) has the form
TPAxxxxxxxx where the xxxxxxxx is the serial number of MultiTrace unit.
This can be matched against the serial number displayed on the label on the
MultiTrace unit.
•
Select one of the MultiTrace units on screen by clicking on it. Now either
right mouse click and select Identify from the popup menu or select
TPA → Identify from the main menu. You can also click the Identify icon
on the toolbar.
The MultiTrace unit you selected flashes all its LEDs for several seconds.
Once you have the correct MultiTrace unit, you can proceed to change its
configuration.
To change the MultiTrace unit configuration:
a.
Either right mouse click and select Configure from the popup menu, select
TPA → Configure from the main menu (see Figure 2-6), or click the
Configure icon on the toolbar.
Figure 2-6 MultiTrace units configuration
5.
2-10
A dialog box is displayed allowing you to change the MultiTrace unit
configuration. The fields you can change depend on whether the DHCP check
box is checked (see Figure 2-7 on page 2-11).
Copyright © 2001 ARM Limited. All rights reserved.
ARM DUI 0150A
Getting Started
Figure 2-7 Configuration
6.
ARM DUI 0150A
If the DHCP checkbox is checked (the default) you can only change the Host
Name and the Ethernet Type. Follow the steps below to change these fields. If
The DHCP box is unchecked, proceed to step 7:
a.
Specify a unique Host Name for the MultiTrace unit. This name can be
used in the MultiTrace configuration dialog as an alternative to the IP
address (the IP address is not fixed if DHCP is enabled). This requires
integrated DHCP and DNS systems on your network. See also Using the
MultiTrace host name with DHCP on page 2-8.
b.
The current IP Address is displayed. This might be 0.0.0.0 if MultiTrace
has never acquired an IP address. You cannot alter this field.
c.
The current default gateway IP address is displayed in the Default
Gateway field. This might be 0.0.0.0 if MultiTrace has never acquired the
gateway IP address. You cannot alter the gateway.
d.
The Subnet field shows the current subnet mask. This might be
255.255.255.0 if MultiTrace has never acquired the gateway IP address. You
cannot alter this field.
e.
The Ethernet Address field shows the Ethernet address of the MultiTrace
unit. This field is fixed and cannot be altered. It is shown for information
only.
f.
The Ethernet Type field specifies an Ethernet speed indicates that
automatic frequency detection is used. In general, the field should be set to
Auto-Detect.
g.
Proceed to step 8 and set the Ethernet type.
Copyright © 2001 ARM Limited. All rights reserved.
2-11
Getting Started
7.
If the DHCP checkbox is unchecked, you can edit the IP Address, Default
Gateway, Subnet mask, and the Ethernet Type:
a.
If DHCP is disabled, a host name can only be assigned by a DNS server and
cannot be specified from the dialog.
b.
Enter the static IP address for your MultiTrace unit in the IP address field.
If you do not know what IP address to assign, contact your network
administrator.
Caution
IP addresses must be unique. This address must be assigned by your
network administrator.
8.
c.
Set the Default Gateway field to the IP address of the default gateway on
your network. If you do not know what IP address to input, contact your
network administrator. If your network does not have a gateway, or you will
only use MultiTrace within your local network segment, you can set this to
0.0.0.0.
d.
Enter the Subnet Mask for your local network segment. If you are unsure
what to enter, contact your network administrator.
e.
The Ethernet Address field shows the Ethernet Address of the MultiTrace
unit. This field is fixed and cannot be altered. It is shown for information
only.
MultiTrace unit supports connection to the following Ethernet types:
•
10Mb/sec half duplex
•
10Mb/sec full duplex
•
100Mb/sec half duplex
•
100Mb/sec full duplex.
In most network environments, MultiTrace can Auto Detect the ethernet type. If
MultiTrace refuses to communicate or selects the wrong type (see Status
indication on the LEDs on page 2-17) you might have to disable the Auto Detect
process and set the Ethernet type as required.
Caution
One of the columns in the window is entitled Active Connections. This shows
how many currently open connections there are to each MultiTrace unit. Do not
configure a MultiTrace unit that has any active connections.
If you try to change the configuration of a MultiTrace unit that has active
connections (at the time of the last scan), a warning will be displayed.
2-12
Copyright © 2001 ARM Limited. All rights reserved.
ARM DUI 0150A
Getting Started
9.
When you have finished making the changes, click the Configure button to save
the new configuration to the MultiTrace unit. The display line for the MultiTrace
unit shows gray while MultiTrace restarts and its new configuration is read.
10.
Follow the instructions in the ARM Trace Debug Tools guide, or your third-party
debugger guide, to configure the debugger to capture trace data. See Chapter 3
Using MultiTrace with the Trace Debug Tools for a condensed set of instructions.
Blind configuration
On some network configurations, the configuration utility might be unable to locate
your MultiTrace unit using the scan function. If you know the Ethernet address of your
MultiTrace unit, it is still possible to configure it.:
1.
Select TPA → Blind Configure from the main menu or click on the Blind
Configure toolbar icon.
2.
Complete the dialog box shown in Figure 2-8.
This is very similar to the standard configuration dialog with the exception that
you must manually fill in the Ethernet Address of the MultiTrace unit to
configure.
Figure 2-8 Configuration
ARM DUI 0150A
3.
After you complete the Ethernet Address, click the ID button to make MultiTrace
identify itself by flashing its LEDs for several seconds.
4.
When you have completed all relevant fields, press the Configure button to
configure and restart MultiTrace.
5.
After a few seconds you can verify that MultiTrace has restarted by clicking the
ID button again and verifying that it identifies itself.
Copyright © 2001 ARM Limited. All rights reserved.
2-13
Getting Started
6.
Press the Cancel button to dismiss the dialog and start another scan. Your
configured MultiTrace unit should now be displayed in the list of MultiTrace
units.
If MultiTrace does not identify itself, this suggests either a network routing problem
between the PC host and MultiTrace or an Ethernet Type incompatibility. In such cases,
connect MultiTrace using the supplied serial cable and configure use the serial
configuration program. See Using the Serial Configuration Utility, STPACONFIG.EXE.
2.3.3
Using the Serial Configuration Utility, STPACONFIG.EXE
The Serial Configuration Utility does a similar job to the Ethernet Configuration Utility
but uses a serial connection to a single MultiTrace unit. To configure MultiTrace:
1.
If it is present, remove the Ethernet cable from the MultiTrace unit.
2.
Connect the provided serial cable between your PC and the MultiTrace unit and
power up the MultiTrace unit.
3.
Start the Serial Configuration Utility from the Start menu. The dialog box in
Figure 2-9 is displayed.
Figure 2-9 Serial configuration dialog
2-14
Copyright © 2001 ARM Limited. All rights reserved.
ARM DUI 0150A
Getting Started
4.
Select the COM port that MultiTrace is connected to and then click the Read
Config button. The dialog then changes to show the current configuration similar
to one of the dialogs in Figure 2-10 on page 2-15 (depending on whether DHCP
is checked).
Figure 2-10 COM port
5.
Set the configuration fields for your device. Refer to step 6 in Using the Ethernet
Configuration Utility, TPACONFIG.EXE on page 2-9 for a description of the
fields. When you have finished editing the configuration, click the Write Config
button to update the configuration in the MultiTrace unit and restart it.
6.
Click the Read Config button.
If the error dialog box shown in Figure 2-11 is displayed, the configuration utility
did not receive a response from the MultiTrace unit. Either you have selected the
wrong COM Port or have an Ethernet cable plugged into the MultiTrace unit.
Figure 2-11 Timeout error
ARM DUI 0150A
Copyright © 2001 ARM Limited. All rights reserved.
2-15
Getting Started
If you selected a COM port to which a modem is connected, the dialog in
Figure 2-12 on page 2-16 might be displayed. Select the correct port and try
again.
Figure 2-12 Modem error
2-16
7.
Remove the serial cable and reattach the Ethernet cable.
8.
View the status LEDs to ensure that the device is performing correctly. See Status
indication on the LEDs on page 2-17.
9.
Follow the instructions in the ARM Trace Debug Tools guide, or your third-party
debugger guide, to configure the debugger to capture trace data. See Chapter 3
Using MultiTrace with the Trace Debug Tools for a condensed set of instructions.
Copyright © 2001 ARM Limited. All rights reserved.
ARM DUI 0150A
Getting Started
2.3.4
Status indication on the LEDs
The MultiTrace unit has five LEDs in total:
•
three on the top of the case
•
two on the Ethernet connector.
The two Ethernet LEDs have the following functions:
Yellow LED Shows Tx and Rx Ethernet activity.
Green LED Shows DHCP activity and the link speed. When DHCP activity is
underway the LED blinks. If the LED is mainly ON the link speed is
100Mb/sec, if it is mainly OFF the link speed is 10Mb/sec.
The three case LEDs have the following functions:
Red LED
When ON this indicates the trace buffer is full.
Yellow LED This LED momentarily lights to show when a record is written into the
trace buffer.
Green LED Shortly after power up, MultiTrace looks for either an Ethernet
connection or a serial connection. If it finds neither, it rapidly blinks this
LED until either the Ethernet cable or the serial cable is plugged in.
The first cable detected defines the communications link used. Following
the link detection, this LED lights steadily to indicate that MultiTrace is
functioning correctly.
If an operational failure occurs, this LED starts blinking a pattern to
indicate the failure. If one of these errors occur, you must power cycle the
MultiTrace unit to return it to an operational state. If the error persists,
contact your dealer.
ARM DUI 0150A
Copyright © 2001 ARM Limited. All rights reserved.
2-17
Getting Started
2-18
Copyright © 2001 ARM Limited. All rights reserved.
ARM DUI 0150A
Chapter 3
Using MultiTrace with the Trace Debug Tools
This chapter describes how to use MultiTrace with the ARM Extendable Debugger
(AXD) and the Trace Debug Tools (TDT). It contains the following sections:
•
Configuring MultiTrace on page 3-2
•
Performing a trace on page 3-7.
ARM DUI 0150A
Copyright © 2001 ARM Limited. All rights reserved.
3-1
Using MultiTrace with the Trace Debug Tools
3.1
Configuring MultiTrace
Follow the steps in this section to configure AXD to use MultiTrace:
1.
Start AXD and select the Multi-ICE target. Refer to the Multi-ICE manual for
details on target selection and configuration. Select a Multi-ICE server on either
the local computer or a computer connected to the network
2.
Configure Trace:
a.
Click on the Trace tab as shown in Figure 3-1.
Note
If the trace tab is not displayed, this indicates that your debugger does not
support trace. If you are using ARM ADS, you must install TDT before
using MultiTrace.
Figure 3-1 Trace tab
b.
3-2
Click Add and select the location of the MultiTrace DLL to add it to the list
of Trace Capture DLLs.
Copyright © 2001 ARM Limited. All rights reserved.
ARM DUI 0150A
Using MultiTrace with the Trace Debug Tools
c.
Click on Change location to display the Location dialog as shown in
Figure 3-2. To specify the location of your MultiTrace unit, either:
•
enter the IP address or host name of your MultiTrace unit in the
TCP/IP field and proceed to step i
•
use the Browse dialog as described in steps d and e below to locate
MultiTrace units.
Figure 3-2 TPA location
Note
If an Ethernet connection is not available, use the serial cable to connect
your MultiTrace unit. Select the RS232 button and the appropriate COM
port. Although full functionality is still available over the serial line, speed
will be significantly slower than Ethernet.
d.
If the address to your trace unit is not displayed as shown in Figure 3-2,
click Browse and select your trace unit from the list as shown in Figure 3-3.
Note
If an Ethernet connection fails, the subnet mask might be incorrectly set.
Use the Ethernet Configuration Utility to set the appropriate net mask for
your class of Ethernet. If in doubt, contact your system administrator.
ARM DUI 0150A
Copyright © 2001 ARM Limited. All rights reserved.
3-3
Using MultiTrace with the Trace Debug Tools
Figure 3-3 Select MultiTrace
e.
Select the MultiTrace unit from the list and click OK. Click OK to close
the Trace dialog.
Figure 3-4 MultiTrace unit selected
3-4
Copyright © 2001 ARM Limited. All rights reserved.
ARM DUI 0150A
Using MultiTrace with the Trace Debug Tools
f.
The capture mode settings are:
•
Multiplexed
•
4x4 bit with Single edge clock
•
Automatic Select Multiplexed.
If you use the Configure ETM dialog to change the port width, the
multiplexing also changes:
4-bit
Multiplexed 4x4 on single edge clock
8-bit
Multiplexed 8x2 on single edge clock
16-bit
Multiplexed 16x2 on single edge clock
Check Collect timestamp data to record timing for the instruction. If you
are capturing signals less than 100MHz and you require timestamps on
every trace record, you must modify the hardware configuration.
If you are capturing signals greater than 100MHz, you must use select Use
multiplexed modes.
Note
After this dialog exits, the system checks that the hardware and firmware
stored on the local disk are compatible. Contact your dealer for firmware
updates.
Figure 3-5 Configure hardware dialog
ARM DUI 0150A
Copyright © 2001 ARM Limited. All rights reserved.
3-5
Using MultiTrace with the Trace Debug Tools
g.
Check Automatic Mode Selection to allow TDT to set the port width
automatically. If you uncheck Automatic Mode Selection, you can select
any TPA mode from the pull down menu, however, this is only
recommended for advanced users.
Check or uncheck Collect timestamp data to enable or disable collecting
timestamp data.
h.
Click OK to close the Configure Hardware dialog.
i.
Click OK to close the Multi-ICE dialog (see Figure 3-4) and then click OK
to close the Choose Target dialog (see Figure 3-6).
Figure 3-6 Click OK to close dialog
3-6
Copyright © 2001 ARM Limited. All rights reserved.
ARM DUI 0150A
Using MultiTrace with the Trace Debug Tools
3.2
Performing a trace
Use the trace-enabled AXD debugger to monitor a process in real-time. Simplified
instructions are included in this section. Refer to the Trace Debug Toolkit User Guide
for detailed instructions.
To start a trace session:
1.
Start AXD and, if necessary, configure Multi-ICE and MultiTrace (see
Configuring MultiTrace on page 3-2).
2.
Display the Trace Window by selecting Processor Views → Trace → View
Trace. (If the menu option is not available, tracing has not been properly
configured.)
3.
Load the dhry.axf image for downloading to the processor under test. (Use
File → Load Image.)
4.
Specify the trace start conditions as shown in Figure 3-7.
Figure 3-7 Trigger conditions
5.
ARM DUI 0150A
Start program execution. For some programs, such as Dhrystone, you might have
to start program execution twice because of a breakpoint at main().
Copyright © 2001 ARM Limited. All rights reserved.
3-7
Using MultiTrace with the Trace Debug Tools
6.
To view the source code, right-click on the line in the Trace Window and select
Locate to Source (see Figure 3-8).
Figure 3-8 Locate code
3-8
Copyright © 2001 ARM Limited. All rights reserved.
ARM DUI 0150A
Using MultiTrace with the Trace Debug Tools
The line in the traced code and the corresponding source code line are highlighted
as shown in Figure 3-9 on page 3-9.
Figure 3-9 Source code
ARM DUI 0150A
Copyright © 2001 ARM Limited. All rights reserved.
3-9
Using MultiTrace with the Trace Debug Tools
3-10
Copyright © 2001 ARM Limited. All rights reserved.
ARM DUI 0150A
Appendix A
MultiTrace Interface Connections
This appendix describes and illustrates the MultiTrace pin connections. It contains the
following sections:
•
MultiTrace interface on page A-2
•
Trace signals on page A-5.
ARM DUI 0150A
Copyright © 2001 ARM Limited. All rights reserved.
A-1
MultiTrace Interface Connections
A.1
MultiTrace interface
This section describes the pin connections and lists any applicable notes for each pin.
MultiTrace supports 4, 8, and 16-bit data port widths with the high density target
connector described in Trace high density connector.
MultiTrace can capture the state of signals PIPESTAT[2:0], TRACESYNC and
TRACEPKT[n:0] at each rising edge of each TRACECLK or on each alternate rising
or falling edge. See Chapter 3 Using MultiTrace with the Trace Debug Tools for setting
capture options. Any unused TRACEPKT pins must be grounded on the target board.
A.1.1
Trace high density connector
MultiTrace provides a connection to the AMP Mictor connector. Figure A-1 shows the
target connector (AMP 2-767004-2 38 pin surface mount receptacles).
NC
2
1
NC
NC
4
3
NC
A TRACECLK
6
5
GND
DBGACK
8
7
DBGRQ
EXTRIG
10
9
NSRST
VTREF
12
11
TDO
Vsupply
14
13
RTCK
A7
16
15
TCK
A6
18
17
TMS
A5
20
19
TDI
A4
22
21
NTRST
A3
24
23
A15
A2
26
25
A15
A1
28
27
A13
A0
30
29
A12
TRACESYNC
32
31
A11
PIPESTAT2
34
33
A10
PIPESTAT1
36
35
A9
PIPESTAT0
38
37
A8
Figure A-1 Pin connections on target board
A-2
Copyright © 2001 ARM Limited. All rights reserved.
ARM DUI 0150A
MultiTrace Interface Connections
Table A-1 shows the pinouts in single ETM mode.
Table A-1 Connector signals
ARM DUI 0150A
Target board signal
Pin
Description
NC
1
No Connect
NC
3
No Connect
GND
5
Signal ground
DBGRQ
7
Debug request
NSRST
9
Open-collector output from the run control to the
target system reset
TDO
11
Test data output from target JTAG port
RTCK
13
Return test clock from the target JTAG port
TCK
15
Test clock to the run control unit from the JTAG
port
TMS
17
Test mode select from run control to the JTAG port
TDI
19
Test data input from run control to the JTAG port
NTRST
21
Active-low JTAG reset
Port A TRACEPKT[15]
23
The trace packet port. Unused packet port pins must
be set to ground on the target board.
Port A TRACEPKT[14]
25
The trace packet port
Port A TRACEPKT[13]
27
The trace packet port
Port A TRACEPKT[12]
29
The trace packet port
Port A TRACEPKT[11]
31
The trace packet port
Port A TRACEPKT[10]
33
The trace packet port
Port A TRACEPKT[9]
35
The trace packet port
Port A TRACEPKT[8]
37
The trace packet port
NC
2
No Connect
NC
4
No Connect
Port A TRACECLK
6
Clocks trace data on rising edge or both edges
Copyright © 2001 ARM Limited. All rights reserved.
A-3
MultiTrace Interface Connections
Table A-1 Connector signals (continued)
A-4
Target board signal
Pin
Description
DBGACK
8
Debug acknowledge from the test chip, High when
in debug state
EXTRIG
10
Optional external trigger signal to the ETM
VTREF
12
Signal level reference. This pin must be connected
to the supply voltage (between 1.0 and 3.3 V) on the
target board.
Vsupply
14
Supply voltage. This is not required for MultiTrace,
but this pin can supply power to the Multi-ICE unit
if it is connected to the probe.
Port A TRACEPKT[7]
16
The trace packet port
Port A TRACEPKT[6]
18
The trace packet port
Port A TRACEPKT[5]
20
The trace packet port
Port A TRACEPKT[4]
22
The trace packet port
Port A TRACEPKT[3]
24
The trace packet port
Port A TRACEPKT[2]
26
The trace packet port
Port A TRACEPKT[1]
28
The trace packet port
Port A TRACEPKT[0]
30
The trace packet port
Port A TRACESYNC
32
Start of branch sequence signal
Port A PIPESTAT[2]
34
RAM pipeline status
Port A PIPESTAT[1]
36
RAM pipeline status
Port A PIPESTAT[0]
38
RAM pipeline status
Copyright © 2001 ARM Limited. All rights reserved.
ARM DUI 0150A
MultiTrace Interface Connections
A.2
Trace signals
Data transfer is synchronized by the TRACECLK signal.
A.2.1
Signal levels
The maximum capacitance presented by the TPA at the trace port connector, including
all cabling and interfacing logic, is less than 15pF. The trace port lines have a matched
impedance of 68Ω.
The MultiTrace unit will operate with a target board that has a supply voltage range
from 1.0V to 3.3V. The signal level is determined by the voltage on the VTREF pin. This
pin must be supplied from the target board supply voltage.
A.2.2
Clock frequency
For capturing trace port signals synchronous to TRACECLK the TPA supports a
TRACECLK frequency of up to 200MHz. Figure A-2 and Table A-2 describe the
timing for TRACECLK.
Tperiod
Twh
Twl
Figure A-2 Clock waveforms
Table A-2 TRACECLK frequencies
ARM DUI 0150A
Parameter
Minimum
Period
Tperiod
5ns
Clock period
Twh
2ns
High pulse width
Twl
2ns
High pulse width
Copyright © 2001 ARM Limited. All rights reserved.
A-5
MultiTrace Interface Connections
A.2.3
Data setup and hold
Figure A-3 and Table A-3 show the setup and hold timing of the trace signals with
respect to TRACECLK.
TRACECLK
DATA
Tsh
Thh
Tsl
Thl
Half-rate
TRACECLK
Figure A-3 Data waveforms
Table A-3 Data setup and hold
Parameter
Minimum
Period
Tsh
2.5ns
Data setup high
Thh
1ns
Data hold high
Tsl
2.5ns
Data setup low
Thl
1ns
Data hold low
Note
The TPA supports half-rate clocking mode. Data is output on each edge of the
TRACECLK signal and TRACECLK (max) <= 100MHz. For half-rate clocking, the
setup and hold times at the Mictor connector must be observed.
A.2.4
Hot plugging
MultiTrace is not damaged if it is powered up when plugged into a unpowered target or
if a unpowered MultiTrace unit is plugged into a powered target.
If both the MultiTrace unit and the target are powered, no damage will occur to the
MultiTrace unit, but there might be damage to a (third-party) target system.
A-6
Copyright © 2001 ARM Limited. All rights reserved.
ARM DUI 0150A
Appendix B
Designing the Target Board
This appendix describes the properties of a target board that can be connected to
MultiTrace. It contains the following sections:
•
Overview of high-speed design on page B-2
•
Termination on page B-3
•
Probe dimensions and keep out areas on page B-6
•
Signal requirements on page B-7
•
Probe modelling on page B-8.
ARM DUI 0150A
Copyright © 2001 ARM Limited. All rights reserved.
B-1
Designing the Target Board
B.1
Overview of high-speed design
Failure to observe high speed design rules when designing a target system containing
an ARM ETM trace port can result in incorrect data being captured by MultiTrace.You
must give serious consideration to high-speed signals when designing the target system.
The signals coming from an ARM ETM trace port can have very fast rise and fall times,
even at relatively low frequencies. For example, a signal with a rise time of 1nS has an
effective knee frequency of 500MHz and a signal with a rise time of 500pS has an
effective knee frequency of 1GHz (fknee = 0.5/Tr).
These principles apply to all of the trace port signals (TRACEPKT[0:15],
PIPESTAT[0:2], TRACESYNC), but special care needs to be taken with
TRACECLK.
B.1.1
Avoid stubs
Stubs are short pieces of track that tee off from the main track carrying the signal to, for
example, a test point or a connection to an intermediate device. Stubs cause impedance
discontinuities that affect signal quality and must be avoided.
B.1.2
Minimize Signal Skew (Balancing PCB Track Lengths)
You must attempt to match the lengths of the PCB tracks carrying all of TRACECLK,
PIPESTAT, TRACESYNC and TRACEPKT from the ASIC to the mictor connector
to within approximately 0.5 inches (12.5mm) of each other. Any greater differences
directly impact the setup and hold time requirements.
B.1.3
Minimize Crosstalk
Normal high-speed design rules should be observed (that is, do not run dynamic signals
parallel to each other for any significant distance, keep them spaced well apart, use a
ground plane and so forth.) Particular attention must be paid to the TRACECLK signal.
If in any doubt, place grounds or static signals between the TRACECLK and any other
dynamic signals.
B.1.4
Use impedance matching and termination
Termination is almost certainly necessary, but there are some circumstances where it is
not needed. The decision is related to track length between the ASIC and the Mictor
connector (Termination on page B-3).
B-2
Copyright © 2001 ARM Limited. All rights reserved.
ARM DUI 0150A
Designing the Target Board
B.2
Termination
To calculate the maximum track length that can be used without termination, you must
know the following about your ASIC and PCB:
B.2.1
•
the rise time (Tr) of the signals coming off the ASIC
•
the impedance of the output drivers on the ASIC for the ETM signals
•
the propagation delay per inch of PCB track (Tpdt).
Example
The maximum track length without termination is given by:
Length(inches)
<
Tr(pS)
5 Tpdt(pS)
That is, the signal propagation delay from ASIC to the Mictor connector must be less
than one fifth of the signal rise time. This calculation allows for the 47pS delay of the
Mictor connector and the 96pS delay of the track from the Mictor to the input buffers
on the probe.
For a case where the signal rise time (Tr) is 1nS (1000pS) and the propagation delay of
the trace (Tpdt) is 160pS per inch (typical for a PCB made with FR4 laminate), L must
be less than 1000/(5 * 160). That is, L must be less than 1.25 inches. If the PCB trace
length from the ASIC to the Mictor connector is greater than 1.25 inches, you must use
termination.
B.2.2
Termination options
There are four termination options:
Matched impedance
Where available, the best termination scheme is to have the ASIC
manufacturer match the output impedance of the driver to the impedance
of the PCB track on your board. This produces the best possible signal.
Series (source) termination
This method requires a resistor fitted in series with signal. The resistor
value plus the output impedance of the driver must be equal to the PCB
track impedance.
ARM DUI 0150A
Copyright © 2001 ARM Limited. All rights reserved.
B-3
Designing the Target Board
DC parallel termination
This requires either a single resistor to ground or a pull-up/pull-down
combination of resistors (Thevenin termination), fitted at the end of each
signal and as close as possible to the Mictor connector. If a single resistor
is used, its value should be set equal to the PCB track impedance. If the
pull-up/pull-down combination is used, their resistance values must be
selected so that their parallel combination equals the PCB track
impedance.
Caution
At lower frequencies, parallel termination requires considerably more
drive capability from the ASIC than series termination and so, in practice,
DC parallel termination is rarely used.
AC parallel termination
This typically uses a resistor and capacitor in series to ground.
Caution
AC termination can only be used with signals with a 1:1 mark/space ratio
(DC balanced) and is not suitable for asymmetric signals such as the
TRACEPKT and PIPESTAT signals. AC termination is not
recommended.
B.2.3
Rules for series terminators
Series (source) termination is the most commonly used method. The basic rules are:
B-4
1.
The series resistor must be placed as close as possible to the ASIC pin (less than
0.5 inches)
2.
The value of the resistor must equal the impedance of the track minus the output
impedance of the output driver. So for example, a 60Ω PCB track driven by an
output with a 38Ω impedance, requires a resistor value of 22Ω.
3.
A source terminated signal is only valid at the end of the signal path. At any point
between the source and the end of the track, the signal appears distorted because
of reflections. Any device connected between the source and the end of the signal
path will therefore see the distorted signal and may not operate correctly. Care
must be taken not to connect devices in this way, unless the distortion will not
affect device operation.
Copyright © 2001 ARM Limited. All rights reserved.
ARM DUI 0150A
Designing the Target Board
B.2.4
PCB track impedance
Use the following formula only for microstrips (track on outer layer over a ground
plane) and 0.1 < w/h < 2 and 1 < Er < 15:
Impedance in Ohms
=
87 ln(5.98 h)
(Er + 1.41) (0.8 w + t)
Where:
h
w
t
Er
Height above ground plane (inches)
Track width (inches)
Trace thickness (inches)
Relative permittivity of substrate.
w
t
h
Ground plane
Figure B-1 Track impedance
As an example, the following track (in microstrip form) has an impedance of 64.08Ω:
h
0.005 inch height above ground
w
0.005 inch width track
t
0.0007 inch thickness (1/2 oz. copper)
Er
4.9 (FR4 laminate).
Note
As the track width increases, the impedance decreases.
ARM DUI 0150A
Copyright © 2001 ARM Limited. All rights reserved.
B-5
Designing the Target Board
B.3
Probe dimensions and keep out areas
Figure B-2 shows the probe attached to a target board.
Caution
The Mictor connector is not robust. It is recommended that the plastic shroud is fitted
around the target connector. This part is not supplied as standard with MultiTrace.
The Mictor connector support shroud is available from Agilent as part number
E5346 - 44701
0.36 in
9.1mm
1.81 in
46mm
MultiTrace
probe
0.52 in
13.2mm
2.59 in
66mm
2.59 in
66mm
0.39 in
10mm
1.06 in
26.9mm
1.06 in
26.9mm
1.26 in
32mm
Support shroud
(if used)
1.31 in
33.2mm
Target
board
Figure B-2 Probe dimensions
B-6
Copyright © 2001 ARM Limited. All rights reserved.
ARM DUI 0150A
Designing the Target Board
B.4
Signal requirements
Table B-1 lists the specifications that apply to the signals as seen at the Mictor
connector:
Table B-1
Signal
Value
Fmax
200MHz
Ts setup time (min.)
2.5nS
Th hold time (min.)
1nS
TRACECLK high pulse width (min.)
2nS
TRACECLK high pulse width (min.)
2nS
The signal waveform is shown in Figure B-3.
TRACECLK
DATA
Tsh
Thh
Tsl
Thl
Half-rate
TRACECLK
Figure B-3 Setup and hold
If both MultiTrace and the target are powered, plugging or unplugging the trace cable
does not damage or crash the MultiTrace system. It is not possible, however, to
guarantee similar immunity to any third party target system. You must, therefore, take
precautions such as pulling inputs and driving or making high Z outputs when Vsupply
is not present.
ARM DUI 0150A
Copyright © 2001 ARM Limited. All rights reserved.
B-7
Designing the Target Board
B.5
Probe modelling
For TRACECLK frequencies above 100MHz, it is recommended that modelling is
used. The characteristics for the MultiTrace probe are:
•
The Mictor connector can be viewed as a microstrip transmission line with 68Ω
impedance and 47pS propagation delay (Tpd).
•
Trace widths are 0.005 inch
•
Trace thickness is 0.0007 inch
•
Distance from track to ground plane is 0.005 inch
•
Trace lengths from Mictor to input buffers is 0.6 inch
•
Er = 4.9.
Use the IBIS model for the DM90LV048ATMTC device to model the input buffers.
This model is available on the National Semiconductor Corporation web site at
www.national.com.
B-8
Copyright © 2001 ARM Limited. All rights reserved.
ARM DUI 0150A
Glossary
ADS
See ARM Developer Suite.
ANSI
American National Standards Institute. An organization that specifies standards for,
among other things, computer software.
Angel
Angel is a program that enables you to develop and debug applications running on
ARM-based hardware. Angel can debug applications running in either ARM state or
Thumb state.
ARM Developer
Suite
A suite of applications, together with supporting documentation and examples, that
enable you to write and debug applications for the ARM family of RISC processors.
ARM eXtendable
Debugger
The ARM eXtendable Debugger (AXD) is the latest debugger software from ARM. It
enables you to make use of a debug agent in order to examine and control the execution
of software running on a debug target. AXD is supplied in both Windows and UNIX
versions.
AXD
See ARM eXtendable Debugger.
Debugger
An application that monitors and controls the execution of a second application. It is
usually used to find errors in the application program flow.
DLL
See Dynamic Linked Library.
ARM DUI 0150A
Copyright © 2001 ARM Limited. All rights reserved.
Glossary-1
Glossary
Dynamic Linked
Library
A collection of programs, any of which can be called when needed by an executing
program. A small program that helps a larger program communicate with a device, such
as a printer or keyboard, is often packaged as a DLL.
Embedded trace
macrocell
The logic inside the core that communicates details of program execution to the external
trace port.
Environment
The actual hardware and operating system that an application will run on.
ETM
See Embedded trace macrocell.
Host
A computer which provides data and other services to another computer. Especially, a
computer providing debugging services to a target being debugged.
ICE
See In Circuit Emulator.
Image
An executable file that has been loaded onto a processor for execution.
In Circuit Emulator
A device enabling access to and modification of the signals of a circuit while that circuit
is operating.
Joint Test Access
Group
The name of the standards group which created the IEEE 1149.1 specification.
JTAG
See Joint Test Access Group.
Multi-ICE
Multi-processor EmbeddedICE interface. ARM registered trademark.
Program image
See Image.
RDI
See Remote Debug Interface.
Remote Debug
Interface
RDI is an open ARM standard procedural interface between a debugger and the debug
agent. The widest possible adoption of this standard is encouraged.
Remote_A
A communications protocol used, for example, between debugger software such as
ARM eXtendable Debugger (AXD) and a debug agent such as Angel.
Target
The actual processor (real silicon or simulated) on which the application program is
running.
TDT
See Trace Debug Tools.
Trace Debug Tools
Software provided by ARM that allows, together with a TPA and Multi-ICE, real-time
tracing of program execution.
Trace port adaptor
A logic analyzer that can capture the details of program execution in real time.
MultiTrace is the ARM trace port adaptor.
TPA
See Trace port adaptor.
Glossary-2
Copyright © 2001 ARM Limited. All rights reserved.
ARM DUI 0150A
Index
The items in this index are listed in alphabetical order, with symbols and numerics appearing at the end. The
references given are to page numbers.
A
ARM
ADS 2-2
Debuggers 2-2
Developer Suite 2-2
Trace Debug Tools 3-1
AXD
configuring 3-2
starting 3-2
C
CE Declaration of Conformity ii
Clock
frequency A-5
setup A-6
TCK A-3
COM port
STPACONFIG 2-15
Configuration
blind 2-13
ARM DUI 0150A
capture 3-7
Connecting
Multi-ICE hardware 2-4
Connector
dimensions B-6
hot plugging A-6
pinouts A-3
D
Data
setup and hold A-6
Device
TPA 2-10
DHCP
selecting 2-11
Dialog
choose target 3-2
configure capture 3-7
configure trace 3-7
select Multi-ICE 3-2
STPACONFIG 2-14
TPACONFIG 2-9
trace 3-7
Disk usage 2-3
E
Electromagnetic conformity ii
Error
Comms failure 2-15
LED indication 2-17
Ethernet
crossover cable 2-5
frequency 2-12
ETM 2-3
F
FCC notice ii
Frequency
maximum A-5
Copyright © 2001 ARM Limited. All rights reserved.
Index-1
Index
H
P
Hard disk useage 2-3
Hardware
connecting 2-4
requirements 2-3
Host name
assigning 2-8
default 2-10
DHCP 2-11
Power
requirements 2-4
Probe
dimensions B-6
hot plugging A-6
modelling B-8
R
I
IP address
assigning 2-8
editing 2-12
L
LED
flashing 2-17
identifying unit 2-10
status 2-17
M
Microsoft Windows
versions 2-2
Multi-ICE
connector 2-5
installing 2-5
server 3-2
RDI
protocol 1-3
RealTrace
components 1-2
Requirements
hardware 2-3
power 2-4
software 2-2
TDT
installing 2-5
Termination
impedance B-3
Timestamps
collecting 3-6
TPACONFIG.EXE
TPA device 2-10
using 2-9
Trace
configuring 3-2
packet A-3
source code 3-8
starting 3-7
S
Signal
high-speed B-2
levels A-5
requirements B-7
synchronization A-5
Software requirements 2-2
Source
viewing 3-8
Status
LEDs 2-17
STPACONFIG.EXE
using 2-14
System requirements 2-2
N
Network
Ethernet 2-5
Notices, FCC ii
O
OEM licenses 1-4
Index-2
T
Target
board 1-4
connector A-2
designing B-2
PCB tracks B-5
probe B-6
requirements 2-3
termination B-3
Copyright © 2001 ARM Limited. All rights reserved.
ARM DUI 0150A