1
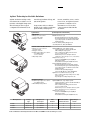
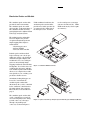
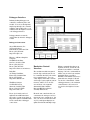
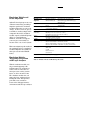
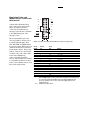
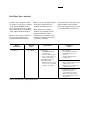
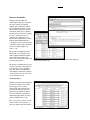
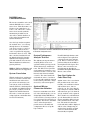
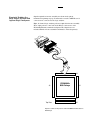
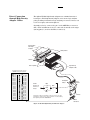
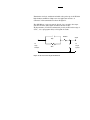
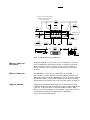
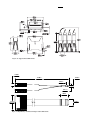
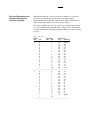
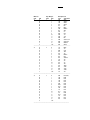
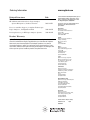
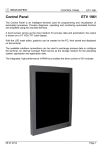
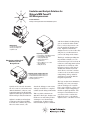
Emulation and Analysis Solutions for
Motorola/IBM PowerPC
603 Microprocessors
Product Overview
Debug and Integrate Real-Time Embedded Systems
JTAG Emulation
• Verify Interrupt Routines
• Debug Assembly Code
• Optimize Code
Logic Analysis Solution
• Perform Basic Signal Measurements
• Profile Hardware Operation
• Verify Signal Integrity
• Verify Conformance to
Specifications
• Exercise Microprocessor and
Other Hardware
• Debug Boot Code
Emulation and Analysis
Solutions for the
Design Team
Emulation Solution with Real-Time Trace
• Debug Hardware/Software Interaction
• Profile Hardware/Software Interaction
• Optimize System Performance
• Perform System Test
Quickly and accurately determine
the root cause of your team’s most
difficult hardware, software, and
system integration problems with
Agilent Technologies’ powerful emulation and logic analysis solutions.
Agilent’s emulation and analysis
solutions for the Motorola/IBM
PowerPC 603 combine the powerful tools of run control, code
download, debugger connections,
and logic analysis for a complete,
scalable system debug environment.
With a scalable solution from
Agilent Technologies, design team
members can customize product
offerings to meet their unique
requirements. Solutions range
from emulation probes combined
with the industry’s leading debuggers to emulation with real-time
trace to solve today’s most complex PowerPC 603 design problems. Agilent’s solutions are
designed to meet your needs today
and protect your investment as
your needs change in the future.
With logic analysis providing timing and state analysis, you can
monitor microprocessor activity in
relation to other important system
signals such as a PCI bus, other
microprocessors, or I/O devices.
Traditional emulation systems
don’t allow you to time-correlate
events across your entire system
using timing, analog, and state
analysis for your most difficult
integration problems.
The logic analyzer is nonintrusive,
allowing you to run your target
system at full speed. A system
trace, up to 4 M deep, can be combined with complex triggering to
find the toughest problems. The
microprocessor instruction set
execution can be correlated to
high-level source code with the
Agilent source correlation tool set.
2
Agilent Technologies Scalable Solutions
Agilent emulation and logic analysis solutions are scalable for each
member of the digital design team.
The following are three typical
configurations for firmware/soft-
ware debug, hardware debug, and
system integration.
Components of these solutions
include a logic analyzer, emulation
probe/module, analysis probe,
System Features
System Components and Functionality
JTAG Emulation
• Microprocessor run control
on your target system
• Debugger connection
• Emulation Probe: (see p. 3)
- Exceptional download speed and single stepping
- View and modify memory, view and modify registers
on your target system or evaluation board from the
debugger interface
• Connect to industry-leading debuggers from
Green Hills, Microtec, SDS, and WindRiver
Emulation Solution with Real-Time Trace
• Microprocessor run control on
your target system
• Debugger connection
• Real-time logic analysis trace solution:
- Assembly level trace
- Source code trace
• QFP probing solution
Logic Analysis Solution
• Real-time logic analysis trace solution:
- Assembly level trace
• QFP and PGA probing solutions
Microprocessor
inverse assembler, source correlation tool set, and optional system
performance analysis tool set.
Information on each of these
components is included in this
document.
• Agilent 16700A Series Logic Analysis System:
- Capture and analyze code flow and data flow
without halting the target system
- Time-correlate analog, timing, and state events
across your entire system
- Monitor microprocessor activity in relation to
system buses, other microprocessors, or I/O devices
• Analysis Probe: (see p. 11)
- Connect to PPC 603/603e target using 240-pin
QFP probing solution
- Disassemble trace listing into PPC 603 mnemonics
• Integrated Emulation Module: (see p. 3)
- Exceptional download speed and single stepping
- View and modify memory, view and modify registers
on your target system or evaluation board from the
debugger interface
- Connect to industry-leading debuggers
from Green Hills, Microtec, SDS, and WindRiver
• Agilent Source Correlation Tool Set: (see p. 10)
- Time-correlate acquired logic analysis trace to highlevel source code
- Step through in assembly or high-level code
• Agilent 16700A Series Logic Analysis System:
- Capture and analyze code flow and data flow without
halting the target system
- Time-correlate analog, timing, and state events
across your entire system
- Monitor microprocessor activity in relation to system
buses, other microprocessors, or I/O devices
• Analysis Probe: (see p. 11)
- Connect to PPC 603/603e target using 240-pin
QFP probing solution
- Disassemble trace listing into PPC 603 mnemonics
Package
Type
Microprocessor
Clock Speed
JTAG
Emulation
Emulation Solution
with Real-Time Trace
Logic Analysis
Solution
240-pin QFP
Up to 200 MHz
X
X
X
PPC 603e
240-pin QFP
Up to 200 MHz
X
X
X
PPC 603ei
Software only
Up to 200 MHz
X
X
X
PPC 603
Table 1: Emulation and Analysis Solutions for Motorola/IBM PowerPC 603 Microprocessors
3
Emulation Probe and Module
The emulation probe and module
provide the same functionality.
The emulation probe is a standalone product, as shown in figure 1.
The emulation module is an integrated plug-in for the Agilent 16700A
Series logic analysis systems.
Unlike traditional emulators, the
emulation probes and modules
provide more stable operation by
accessing only the debug pins of
the microprocessor. You don't
need a serial port on your target
system to download code. Unlike
ROM monitors, they don’t require
user memory.
The emulation probe and module
have been improved to provide
exceptional download speed and
single stepping. These improvements include:
- 32 bit microprocessor
- 100 Base TX LAN
- New scan-chain controller
Both the probe and the module
help you debug your code by providing run control, code download,
and memory/register display and
modification. You can control program execution through single
stepping, run/break, and set/modify
breakpoints. You can also run code
at full speed in the target. Agilent’s
new emulation probes and modules
allow you to complete these tasks
more quickly so you can bring your
products to market sooner.
Figure 1: Standalone Emulation Probe
An industry leading debugger can
be used to control both the
emulation probe and module.
Alternatively they can be controlled
by the emulation control interface
provided with the logic analyzer.
These interfaces are described on
page 4.
The emulation probe and module
can be controlled over your local
area network (LAN) by the debugger and connect to your target
through a 16-pin Berg style
connector, as shown in figure 4.
Figure 2: Agilent 16702A Logic Analysis System with Integrated Emulation Module
4
Debugger Interface
Industry-leading debuggers can
control the emulation probe and
module. You can set breakpoints,
single-step through code, examine
variables, and modify source code
variables from the high-level source
code debugger interface.
Debugger interfaces must be
ordered directly from the debugger
vendor.
Debugger Connections
Green Hills Software, Inc.
30 West Sola Street
Santa Barbara, CA 93101 USA
Phone: (805) 965-6044
http://www.ghs.com
Microtec, A Mentor Graphics
Company
880 Ridder Park Drive
San Jose, CA 95131 USA
Phone: (800) 950-5554
Phone: (408) 487-7000
http://www.mentor.com/microtec
Diab-SDS
323 Vintage Park Drive
Foster City, CA 94404 USA
Phone: 630-724-2520
http://www.diabsds.com
Figure 3: Emulation Control Interface
Emulation Control
Interface
WindRiver Systems
500 Wind River Way
Alameda, CA 94501 USA
Phone: 1-800-545-WIND
http://www.wrs.com
The emulation module integrated
into the logic analysis system can
be controlled directly by the emulation control interface. You can
easily display and modify contents
of microprocessor registers, system
memory, and I/O. You can also
view memory code segments
disassembled into familiar
Motorola/IBM PowerPC 603
assembly instructions.
Please check with your local
Agilent Test and Measurement
sales office or visit our web site at
http://www.agilent.com/find/las-data
for the current list of debugger
connections.
From the run control window you
can instruct the microprocessor to
run, break, reset, or single-step. You
also can choose whether the memory, I/O, and register displays are
updated for breaks and single steps.
Writing command files that set up
registers, memory, and I/O in your
system is easy with the command
language. Once the command file is
written, save it on the logic analyzer
hard disk. When you want to
initialize your hardware system to a
particular state, simply recall and
execute the command file. Unlike
a debugger interface, the emulation
control interface does not reference back to the high-level source
code.
5
Emulation Module and
Probe Migration
Agilent Technologies protects your
current investment by providing a
migration path for the emulation
modules and probes as your needs
change. To move from one processor family to another, simply order
a migration kit for the emulation
module or probe, which will provide
all the necessary hardware,
firmware, and cables to support
your new processor family at a
fraction of the cost of a new system.
This same migration path works for
the emulation probes or emulation
modules. Migration is available for
those processors in the E5900B
Series.
Emulation Module
Triggering Integration
with Logic Analyzer
With the emulation module, use
the powerful triggering of the
16700A Series logic analysis systems to halt on events such as
microprocessor activity, system
buses, or other external events.
The emulation module also can
trigger the logic analyzer when a
breakpoint is hit. This provides
powerful event correlation
between the debugger interface
environment and the logic analyzer.
Specification
Microprocessors
Supported
Description
Motorola Part Numbers
IBM Part Numbers(ƒ)
MPC 600AFExxxA, MPC 600AFExxxB
IBMxx EMPPC yyyyy, IBMxx EMPPC yyyyy,
IBMxx PPC yyyyy
Physical Connections Ethernet
Autosensing 10/100 Ethernet
RS-232
9600 Kbaud rate
Number of Breakpoints Virtually unlimited software breakpoints
or one hardware breakpoint
Physical Size
105 mm width x 151 mm depth x 40 mm height
Environmental
Temperature
Operating: 5 °C to +40 °C (+41 °F to + 104 °F)
Nonoperating: –40 °C to +70 °C (–40 °F to +158 °F)
Altitude
Operating: 4,600 m (15,000 ft)
Nonoperating: 4,600 m (15,000 ft)
Humidity
15% to 80% @ 40 °C for 24 hours
Regulatory Compliance EMC CISPR 11:1990/EN 55011:1991 Group 1, Class A
IEC 801-2:1991/EN 50082-1:1992 4 kV CD, 8 kV AD
IEC 801-3:1984/EN 50082-1:1992 3 V/m, (1 kHz 80% AM, 27-1 kMz )
IEC 801-4: 1988 / EN 50082-1:1992 0.RkV Sig lines, 1 kV Power lines
Safety Approvals
IEC 1010-1:1990
AMD 1:1992
UL 1244
CSA-C22.2 No. 231
(Series M-89)
Note ƒ: where xx = frequency, where yyyyy = Processor
Table 2: Emulation Probe and Module Specifications
6
Emulation Probe and
Module Target Connection
Information
A 16-pin male 2X8 header Berg
style connector is needed on the
target development board to
connect the PowerPC 603/e/ei
microprocessor interface assembly
to the JTAG debug port of the
microprocessor.
The header should be placed as
close as possible to the processor
to ensure signal integrity. TD0,
TD1, TCK, TMS, and /TRST signal
traces between the JTAG connector
and the PowerPC 603/e/ei must be
less than three inches. If these signals are connected to other nodes,
you must connect in a daisy chain
between the JTAG debug
connector and the PowerPC
603/e/ei. These signals are sensitive
to crosstalk and cannot be routed
next to active signals, such as clock
lines on the target board.
TD0
1
2
NC
TDI
TRST
NC
+3.3V
NC
TCK
TMS
0.1"
SRESET
HRESET
NC
NC
Key
CHECKSTOP 15
NC
16
GND
0.1"
Figure 4: Target Development Board Header Connector (Top View)
Header
PPC 600
Board
Pin No.
I/O
600
Resistor
1
Out
TD0
2
NC
3
In
TDI
1KΩ pulldown
4
In
TRST
10KΩ pullup
5
NC
6
Power*
1KΩ series
7
In
TCK
10KΩ pullup
8
NC
9
In
TMS
10KΩ pullup
10
NC
11
In
SRESET
10KΩ pullup
12
NC
13
In
HRESET
10KΩ pullup
14
KEY
15
Out
CHECKSTOP
1KΩ pullup
16
GND
Table 3. JTAG Interface Connections
*
The +POWER signal is sourced from the development board and is used
as a reference signal. It should be the power signal supplied to the
processor (either +3.3V or +5V). It does not supply power to the
emulation probe.
Note NC Refers to No Connect
7
Target System
Requirements for
PowerPC 603/e
(Please note the following is a partial list of requirements. Please
refer to the users manuals, for
more details.)
Mask Revision dd1
PPC603e silicon does not work in
debug mode with either cache
enabled.
Mask Revision dd3
PPC603 silicon can be used with
the emulation probe and module.
/QACK Signal
If a target does not use the /QACK
signal, the board must have a
1 KOhm pull down resistor to drive
this signal low.
Reset Signal
The HRESET SRESET, and TRST
signals from the JTAG connector
must be logically ORed with the
HREST, SRESET, and TRST signals
that connect to the processor on
the target system.
Unsupported Modes
The emulation probe and module
do not support any target systems
which:
• Use MMU for address translation
• Access devices that check parity
(PPC603 and PPC603e)
• Try to access TLB entries
Motorola MVME 160X, Ultra,
Atlas and Series E Target
Boards
These boards have an unpopulated
header location for installing the
16-pin connector. You must install
a 16-pin connector as described
earlier.
A resistor change is required to pull
QACK low. The 1KOhm resistor
that goes between the PPC603 and
the PPC105 must be changed to 10
ohm.
For the MVME1603 series PM603
module this resistor is R27 on the
8018F, 8019F, 8100F and 8101F artwork.
For the Atlas it is R42 on the Rev B
8115F artwork. For the Ultra, it is
R10 on the 8107D and later artwork.
These boards use DRTRY mode, so
the configuration entry "cf drty=on"
must be set on the emulation probe
and module if cache is enabled.
The configuration entry "cf reset =
runrom" also must be set.
Cogent CSB277
This board asserts AACK for more
than one clock cycle. For proper
disassembly, "Delayed-AACK" version of the inverse assembler must
be used with the logic analyzer.
Target System
Requirements for Other
PowerPC Processors
For PowerPC processors other
than the 603 and 603e, all target
requirements are described
in the "readme" files on the floppy
disks provided with the emulation
probe and module.
8
Real-Time Trace Analysis
Real-time trace analysis consists
of a physical connection to signals
on the Motorola/IBM PowerPC
603/e/ei microprocessors, acquisition of relevant data, and analysis
of the captured bus information.
Physical connection to the microprocessor is provided by the
probing solutions listed below.
MPC603
Microprocessor
PPC 603/e/ei
Either of the two probing solution
alternatives will provide trace
analysis on the PPC 603/e/ei.
For information on the data acquisition modules for the 16700A
Series logic analyzers, please refer
to related literature on page 24.
The real-time trace analysis
solutions are available for both
probing alternatives. These
include inverse assembly, source
correlation, and optional system
performance analysis.
Supported
Speed
Up to 200 MHz
Probing Solutions
Analysis Probe:
• PPC 603/603e 240-pin QFP
probing solution
• Inverse assembler included
• Access to all microprocessor
signals for logic analysis
Optional Mictor Connector
Solution for PPC 603/e:
• Mictor connectors designed
in target for access to critical
signals for logic analysis
Real-Time Trace
Solutions
Inverse Assembly:
• Disassembly of bus information
into PPC 603 microprocessor
mnemonics
• PPC 603 configuration files for
logic analyzers
Source Correlation:
• Time-correlation of acquired trace to
high-level source code
• Trigger and search through trace
in high-level source code
System Performance Analysis:
• Statistical performance
measurements on trace data
• State overview, state interval,
time interval, and time overview
measurements
Table 4: Real-Time Trace and Probing Alternatives
9
Inverse Assembler
Software provided with the
analysis probe quickly configures
the logic analyzer by labeling
address, data, and status signals
for the PPC 603 microprocessors.
The software includes an inverse
assembler, which gives you PPC
603 mnemonics in the trace listing
for easy correlation between
captured data and target code.
The inverse assembler also works
with the Agilent B4620B source
correlation tool set to provide time
correlation between the assemblylevel trace and the high-level
source code.
The inverse assembler provides
filters and color coding to show
and/or suppress different instructions such as data reads, data
writes, unexecuted prefetches, and
memory map regions.
Figure 5: Inverse Assembled Trace Time-Correlated to Source Code Using the
Source Correlation Tool Set
The inverse assembler has several
modes of operation, depending on
your microprocessor configuration. The inverse assembler provides PPC 603 mnemonics, but the
cache must be off to see all cycles
on the microprocessor.
Cache-On Trace
Agilent’s newest inverse assemblers
provide the ability to trace while
the microprocessor cache is
enabled. The logic analyzer samples branch messages, and reconstructs the program flow. This is
the only solution that guarantees
uninterrupted program execution
and never disables the cache.
The cache-on trace feature is available in version 1.42 or greater of
the logic analyzer system software.
Figure 6: Inverse Assembler Options
10
B4620B Source
Correlation Tool Set
The inverse assembler can be used
with the B4620B source correlation tool set. This allows time correlation of an acquired trace to
source code. The source correlation tool set uses the symbolic
information provided in your
object file to build a database of
source files, line numbers and
symbol information.
Once the logic analyzer acquires
the real-time trace, you can step
through the trace at assemblycode level or source-code level.
You can also easily locate the
cause of a problem by stepping
backward to the root cause. With
time-correlated analysis in both
the digital and analog domains,
Agilent Technologies provides
powerful solutions for your most
difficult hardware/software integration problems.
IEEE 695, Elf/Dwarf, Elf/Stabs and
ASCII symbol files are supported.
System Correlation
With the Agilent logic analysis systems, you can time-correlate bus
information from other microprocessors or bus interfaces in
your system, such as a PCI bus,
with the PPC 603. Analysis probes
are available for additional microprocessors. (Contact your local
Agilent Test and Measurement
sales office or visit our web site
at http://agilent.com/find/las-data
for more information).
Figure 7: Statistical Performance Information from the HP System
Performance Analysis Tool Set
System Performance
Analysis Tool Set
The Agilent system performance
analysis (SPA) tool set is an
optional software package for the
16700A Series logic analysis systems. The SPA tool set provides
such statistical performance measurements as state overview, state
interval, time interval, and time
overview. The same symbol file
used with the source correlation
tool set provides symbolic support
for the system performance analysis tool set, as shown in figure 7.
Optional Mictor
Connection Solution
If system constraints won’t allow
use of the analysis probe, you can
design high-density AMP Mictor
connectors into your target system
for connection to the microprocessor signals. The inverse assembler
can be ordered separately to
provide inverse assembly and
configuration files to set up the
logic analyzer.
Four E5346A high-density termination adapters are required for
connection to the logic analyzer
pods. Mictor connectors can be
purchased directly from AMP or
from Agilent Technologies. Five
Mictor connectors and recommended support shrouds are
included in the Agilent E5346-68701
Mictor connector kit.
Low-Cost Option for
Code-Flow Only
Agilent offers a low-cost solution
that provides much of the functionality of an emulation solution
with real-time trace, but at a
reduced cost. By connecting the
logic analyzer to only the address
and status bus, up to 68 channels
of logic analysis can be captured.
The real-time trace will still show
opcode disassembly because the
inverse assembler will read your
S-Record file instead of the data
bus. The tradeoff is that data
reads and writes will be displayed
with no value. Simply swap in
another logic analyzer card and
connect to the data bus if this
functionality is required.
11
PowerPC 603/603e
Analysis Probe
Pods Required
Eight, 16-channel logic analyzer
pods are required for inverse
assembly. These eight pods are
connected to four E5346A highdensity termination adapters
included with the analysis probe.
Five of these adapters are included
with the analysis probe. One additional adapter is included for the
other signals on the processor.
The analysis probe allows easy
connection of a logic analyzer to
your Motorola/IBM PowerPC
603/603e QFP target system for
real-time analysis. With the analysis probe solution, you don’t need
to design special debug connectors into your target system.
The Motorola/IBM PowerPC
603/603e analysis probe
consists of:
• Analysis probe board
• Inverse assembler and
configuration files
• 240-pin elastomeric probing
solution
• Five Agilent E5346A high-density
termination adapters
• User’s guide
Modes of Operation
Elastomeric Probing Solution
The elastomeric probing solution
included in the analysis probe
offers an inexpensive, rugged, and
easy-to-use probing solution for
the 240-pin QFP PowerPC
603/603e package. The probes
require a minimal “keep out” area
around the device, as shown in figure 14.
State Modes
In state-per-address or data-cycle
modes, the logic analyzer records
only those states in which one or
more of the strobes AACK,
ARTRY, TA, DRTRY, or TEA are
asserted. This mode filters wait
states and exposes the PowerPC
603/603e/603ei microprocessor’s
decoupled address and data buses.
A retainer is glued to the top of the
device, which ensures a solid connection to each pin of the device.
Five retainers, a locator tool, and
adhesive are included with each
probe adapter.
In state-per-clock mode, address,
data, and status are captured on
each CPU clock. This mode is useful in hardware validation and
analysis during system crashes.
Additional retainers and locator
tools may be ordered. E5363A option
201 offers a kit of five additional
retainers and adhesive. An additional locator tool is available as
E5363A option 202.
Probe Loading
• 10 pf on all signals
• 100 Kohms on all signals
Figure 8: Analysis Probe for the
PPC 603/603e
Timing Mode
Timing analysis is supported. All
microprocessor signals are
presented to the logic analyzer
unbuffered.
Logic Analyzers Supported
• Contact your Agilent field engineer for latest logic analyzer
information.
12
Passively Probing the
BGA Target System with
Agilent Logic Analyzers
Signals required for inverse assembly are shown in the pinout
information beginning on page 17 and must be routed to AMP Mictor 38
connectors for connection to the logic analyzer.
Eight, 16-channel logic analyzer pods are required for inverse assembly.
These eight pods are connected via the Mictor connectors to four
E5346A high-density termination adapters. The adapters are not
included with the inverse assembler and must be ordered separately.
J4
J3
PPC603/603e
BGA Package
J1
J2
Top View
J5
Figure 9: Connector Layout for a Motorola/IBM PowerPC 603/603e
BGA Target
13
Direct Connection
through High-Density
Adapter Cables
The Agilent E5346A high-density adapters use a minimal amount of
board space. Each high-density adapter connects two logic analyzer
pods, providing 32 channels of logic analysis per connector and access
to two clock pins, as shown in figure 10.
Grounds need to be connected to pin 3 of the AMP Mictor connector.
SCL, +5VDC and SDA are not to be connected electrically to the target
system (pins 1, 2, and 4 on the Mictor connector).
Probe cables
from logic
analyzer
Odd # probes
Labels*
High-density
adapter cable
Even # probes
Top view surface mount connector
AMP "Mictor 38" pin assignment
+5VDC
GND DC
CLK
D15
D14
D13
D12
D11
D10
D9
D8
D7
D6
D5
D4
D3
D2
D1
D0
1
3
5
7
9
11
13
15
17
19
21
23
25
27
29
31
33
35
37
2
4
6
8
10
12
14
16
18
20
22
24
26
28
30
32
34
36
38
SCL
SDA
CLK
D15
D14
D13
D12
D11
D10
D9
D8
D7
D6
D5
D4
D3
D2
D1
D0
E5346A
High-Density
Termination
Adapter
Label (both
sides)*
10 Pf
Pin 1
bevel
250Ω
RCR
90KΩ
* A package of labels is provided so that you can use your own
conventions to keep track of cable connections. For more labels,
order Agilent part number 01650-94310
Shroud
Mictor
connector
Figure 10. E5346A High-Density Termination Adapter
14
Termination for logic analysis is included at the probe tip of the E5346A
high-density termination adapter for easy application and use. A
schematic of this termination is shown in figure 11.
The AMP Mictor connector must be placed close enough to the target
system so that the stub length created is less than 1/5 the
Tr (bus risetime). For PC board material (er=4.9) and Zo in the range of
50-80Ω , use a propagation delay of 160 ps/inch of stub.
250 Ohm
Signal
10 pF
To
Logic
Analyzer
To
Target
System
90 K Ω
GND
Figure 11. RC Network for Signal Termination
15
0.050 in x 0.017 in (127 mm x 0.43 mm)
pad with 0.005 in (0.13 mm ) x 45°
corner chamfers typ 38
1.190 in
30.23 mm
Pin 1 chamfer
connector key
0.450 in
11.43 mm
∅
18 Spaces at
0.025 in (0.64 mm)
0.139 in
TYP
3.53 mm
0.093 in
2.36 mm
+ 0.003 in (0.08 mm)
or -0.001 in (0.02 mm)
Mounting holes for
support shroud
0.040 in
1.02 mm
∅ 0.032 in
0.81 mm
± 0.002 in (0.05 mm) plated
0.030 in
∅
0.76 mm
Mounting holes for
support shroud
0.100 in
TYP
2.54 mm
0.250 in
6.35 mm
0.996 in
25.30 mm
0.245 in
6.22 mm
0.276 in
7.01 mm
0.329 in
8.36 mm
0.400 in
10.16 mm
Figure 12. AMP Mictor Connector Dimensions
Mictor Connector
Placement
Placing the AMP Mictor connectors as close as possible to the signal
source will minimize stub length and ensure a reliable measurement.
Figure 9 shows the connector layout of J1-J5. J1-J4 are required for
inverse assembly, while J5 is optional for timing or state analysis of
I/O ports.
Mictor Connector
The AMP Mictor connectors are available directly from AMP
(PN 2-767004-2) or from Agilent Technologies (PN E5346-68701). The
Agilent Mictor kit contains five AMP Mictor connectors and five support
shrouds. The signals +5 V DC, SCL, and SDA are not used for probing
and should not be electrically connected to the target system. See figure 10.
Support Shroud
A support shroud (Agilent E5346-44701) is recommended to provide
additional strain relief between the E5346A adapter and the AMP Mictor
connector, as shown in figure 13. The shroud fits around the AMP
Mictor connector and requires two through-hole connections to the target board. Five shrouds are included with five AMP Mictor
connectors in the E5346-68701 kit.
16
Figure 13. Support Shroud Dimensions
0.450 in
11.44 mm
0.209 in
5.31 mm
17.500 in
444.50 mm
0.465 in
11.80 mm
0.271 in
6.89 mm
1.400 in
35.56 mm
2.393 in
60.77 mm
Figure 14. High-Density Termination Adapter Cable Dimensions
1.100 in
27.94 mm
17
Pin-out Information on
Required Signals for
Inverse Assembly
This table describes the connections for the four Mictor 38 connectors
necessary for compatibility with the inverse assembler and the
E5346A high-density termination adapter cables. This is intended to be a
guide for placing probing connectors on a target system.
For inverse assembly, the J1, J2, J3, and J4 connectors listed below must
be connected through the four high-density adapter cables. For simultaneous timing and state analysis for all signals, additional connectors must
be used.
Note: * - Active Low
Mictor 38
Conn.
Pin#
Logic Analyzer
Pod #
Bit#
Microprocessor
Pin#
Signal name
J1
38
1
0
P01
A31(LSB)
36
1
J15
A30
34
2
M01
A29
32
3
H16
A28
30
4
K02
A27
28
5
G15
A26
26
6
K01
A25
24
7
G13
A24
22
8
F04
A23
20
9
F16
A22
18
10
H03
A21
16
11
F15
A20
14
12
J02
A19
12
13
F14
A18
10
14
J01
A17
8
15
F13
A16
6
CLK
C09
SYSCLK
____________________________________________________________
J1
37
2
0
H02
A15
35
1
E16
A14
33
2
H01
A13
31
3
E15
A12
29
4
G02
A11
27
5
E13
A10
25
6
D04
A9
23
7
D16
A8
21
8
E02
A7
19
9
D15
A6
17
10
G01
A5
15
11
D14
A4
13
12
F02
A3
11
13
D13
A2
9
14
E04
A1
7
15
C16
A0(MSB)
5
CLK
____________________________________________________________
18
Mictor 38
Logic Analyzer
Microprocessor
Conn.
Pin#
Pod #
Bit#
Pin#
Signal name
J2
38
3
0
K04
ABB*
36
1
J04
ARTRY*
34
2
J03
QREQ*
32
3
L02
AACK*
30
4
L01
BG*
28
5
N01
DBG*
26
6
G04
DBWO*
24
7
F01
GBL*
22
8
E01
CI*
20
9
D02
WT*
18
10
A03
TC1
16
11
A02
TC0
14
12
B06
BR*
12
13
A06
CKSTP-OUT*
10
14
D08
CKSTP-IN*
8
15
A07
HRESET*
6
CLK
D03
QACK*
———————————————————————————————
J2
37
4
0
J14
DBB*
35
1
J13
TS*
33
2
B05
CSE1
31
3
H13
TEA*
29
4
H14
TA*
27
5
G16
DRTRY*
25
6
B15
INT*
23
7
B14
SRESET*
21
8
C14
TT3
19
9
B16
TT2
17
10
A15
TT1
15
11
B13
TT0
13
12
A14
TBST*
11
13
B12
TSIZ2
9
14
D10
TSIZ1
7
15
A13
TSIZ0
5
CLK
C15
TT4
______________________________________________________________
J3
38
5
0
R04
DL31(LSB)
36
1
T03
DL30
34
2
P04
DL29
32
3
T02
DL28
30
4
T01
DL27
28
5
R03
DL26
26
6
N04
DL25
24
7
NO3
DL24
22
8
P03
DL23
20
9
T13
DL22
18
10
N12
DL21
16
11
P13
DL20
14
12
N10
DL19
12
13
T14
DL18
10
14
R14
DL17
8
15
R16
DL16
6
CLK
____________________________________________________________
19
Mictor 38
Logic Analyzer
Microprocessor
Conn.
Pin#
Pod #
Bit#
Pin#
Signal name
J3
37
6
0
P15
DL15
35
1
P16
DL14
33
2
N14
DL13
31
3
N13
DL12
29
4
N15
DL11
27
5
N16
DL10
25
6
M13
DL9
23
7
M15
DL8
21
8
M16
DL7
19
9
L14
DL6
17
10
L13
DL5
15
11
L15
DL4
13
12
L16
DL3
11
13
K16
DL2
9
14
K15
DL1
7
15
K13
DL0(MSB)
5
CLK
H15
DBDIS*
———————————————————————————————
J4
38
7
0
T04
DH31(LSB)
36
1
T05
DH30
34
2
N05
DH29
32
3
R05
DH28
30
4
T06
DH27
28
5
R06
DH26
26
6
N06
DH25
24
7
P06
DH24
22
8
T07
DH23
20
9
R07
DH22
18
10
N07
DH21
16
11
T08
DH20
14
12
R08
DH19
12
13
N08
DH18
10
14
P08
DH17
8
15
T09
DH16
6
CLK
______________________________________________________________
J4
37
8
0
R09
DH15
35
1
T10
DH14
33
2
N09
DH13
31
3
P09
DH12
29
4
R10
DH11
27
5
T11
DH10
25
6
T12
DH9
23
7
R11
DH8
21
8
N11
DH7
19
9
P11
DH6
17
10
R12
DH5
15
11
R13
DH4
13
12
T15
DH3
11
13
R15
DH2
9
14
T16
DH1
7
15
P14
DH0(MSB)
5
CLK
____________________________________________________________
20
Mictor 38
Logic Analyzer
Microprocessor
Conn.
Pin#
Pod #
Bit#
Pin#
Signal name
J5
38
9
0
D09
PLL_CFG3
36
1
A09
PLL_CFG2
34
2
B09
PLL_CFG1
32
3
A08
PLL_CFG0
30
4
B10
LSSDMODE*
28
5
26
6
C10
TRST*
24
7
A11
TDI
22
8
B11
TMS
20
9
A12
TDO
18
10
A16
SMI
16
11
C13
MCP
14
12
B02
AP3
12
13
B03
AP2
10
14
B04
AP1
8
15
C01
AP0
6
CLK
———————————————————————————————
J5
37
10
0
R02
DP7
35
1
M04
DP6
33
2
P02
DP5
31
3
R01
DP4
29
4
L04
DP3
27
5
N02
DP2
25
6
L03
DP1
23
7
M02
DP0
21
8
C04
TLBISYNC*
19
9
C02
TBEN
17
10
D01
RSRV*
15
11
B01
CSE0
13
12
A05
DPE*
11
13
A04
APE*
9
14
D12
L2_TSTCLK
7
15
D11
L1_TSTCLK
5
CLK
C11
TCK
____________________________________________________________
21
Analysis Probe Mechanical Specifications
2.533 in
64.34 mm
2.188 in
53.81 mm
2.133 in
54.78 mm
0.434 in
11.02 mm
1.343 in
34.12 mm
1.212 in
30.78 mm
0.040 in
1.01 mm
Figure 15. PPC 603/e Analysis Probe Specifications
1.740 in
4.420 mm
0.189 in
4.80 mm
1.740 in
44.20 mm
Maximum height of components
in this area = 0.003 in (0.08 mm)
Maximum height of components
in this area = 0.472 in (12.0 mm)
0.199 in
5.04 mm
0.159 in
4.04 mm
Figure 16. Elastomeric Keep-Out Information
2.133 in
54.78 mm
22
System Configuration and Ordering Information
The table below shows the system
components you need to order and
what is included in each. For realtime trace, two alternatives are
available to fit your needs. The
solution product numbers do
not include logic analysis. The
16700A Series logic analysis systems must be ordered
separately.
Solution
If you want to configure or upgrade
your system with individual products, see page 23 for individual
product number information.
Products to Order
Included Components
JTAG Emulation
• PPC 603/e/ei Emulation Probe
• E5900B #060
• Debugger Connection
• Order directly from Green Hills,
Microtec, SDS, or WindRiver
Emulation Solution with Real-Time Trace
• 16700A Series
Logic Analysis System
• Refer to publication 5966-3148E
for logic analyzer configuration
• Contact your Agilent field
engineer for latest logic
analyzer information
• PPC 603/e Emulation
Using Analysis Probe
• E9487B #002
•
•
•
•
• PPC 603/e/ei Emulation
Using Mictor Probing
• E9487B #001
• Inverse Assembler
• Source Correlation Tool Set
• Emulation Module
PPC 603/e QFP Analysis Probe
Source Correlation Tool Set
Emulation Module
Inverse Assembler
• Four E5346A High-Density
Termination Adapters
• E5346-68701 Mictor
Connector Kit
• Debugger Connection
• Order directly from
Green Hills, Microtec, SDS,
or WindRiver
• Optional System Performance
Analyzer Tool Set
• B4600B
Logic Analysis Solution
• 16700A Series
Logic Analysis System
• Refer to publication 5966-3148E
for logic analyzer configuration
• Contact your Agilent field
engineer for latest logic
analyzer information
• PPC 603/e Logic Analysis
Solution Using Analysis Probe
• E9587A #002
• PPC 603/e QFP Analysis Probe
• Inverse Assembler
• PPC 603/e/ei Logic Analysis
Solution Using Mictor Probing
• E9587A #001
• Four E5346A High-Density
Termination Adapters
• E5346-68701 Mictor
Connector Kit
• Inverse Assembler
• Optional Source Correlation
Tool Set
• Optional System Performance
Analyzer Tool Set
• Optional Emulation Module
• B4620B
• B4600B
• E5901B #060
23
Individual Components Ordering Information
Description
Agilent Product
PPC 603/e/ei Emulation Probe
E5900B #060
PPC 603/e/ei Emulation Module
E5901B #060
PPC 603/e Analysis Probe
E9587A #002
PPC 603/e/ei Inverse Assembler Only
E9587A #001
Source Correlation Tool Set
B4620B
System Performance Analysis Tool Set
B4600B
High-Density Termination Adapter
E5346A
Mictor Connector Kit
E5346-68701
High-Density Right Angle Adapter
E5346-63201
High-Density Termination Adapter Support Shroud
E5346-44701
AMP Mictor Connector (order from AMP)
AMP PN 2-767004-2
Training and Consulting
Agilent Technologies has experienced Digital Systems Consultants who
can help you maximize the use of your emulation and analysis system
through training and consulting. Digital Systems Consultants are experienced in debugging complex digital hardware/software problems and
hardware/software integration.
Training can be delivered through scheduled courses, on-site classes, or
one-on-one consulting. Agilent Technologies has courses for the beginner as well as advanced users migrating from the Agilent 16500 Series
systems. Call 1-800-593-6632 in the U.S. for information about training
schedules and location or to register. For training offered in other countries and languages, consult the Test and Measurement education web
site: http://www.hp.com/go/tmeducation.
For consulting services, contact your local Test and Measurement sales
office. A digital systems consultant can help you solve tough digital debug
problems by showing you how to apply Agilent Technologies tools and
debug best practices. Topics covered can include:
• System Installation
• Complex Triggering
• Multiple Bus Analysis
• Source-Line Referencing
• System Performance Analysis
• Instrumenting Code to Solve Specific Issues
• Bus Signal Timing Analysis
• Signal Integrity Analysis
• 16700A/1660XA Networking
Topics related to the debug of
PowerPC 603 microprocessorbased targets can include:
• Instruction/Data Cache
Related Issues
• Checkstop Analysis
• Single and Multiple
Beat Bus Cycles
• Pipelining and Bursts
www.agilent.com
Ordering Information
Related Literature
Number
Pub.
For more information about Agilent Technologies test
and measurement products, applications, services,
and for a current sales office listing, visit our web
site: http://www.agilent.com/find/tmdir
HP 16600A and 16700A Series Logic Analysis
System Mainframes, Product Overview
5966-3107E
You can also contact one of the following centers
and ask for a test and measurement sales
representative.
Processor and Bus Support for Agilent Technologies
Logic Analyzers, Configuration Guide
5966-4365E
Probing Solutions for HP Logic Analysis Systems
5968-4632E
Product Warranty
Agilent Technologies hardware products are warranted against defects in
materials and workmanship for a period of one year from date of shipment.
Some newly manufactured Agilent Technologies products may contain
remanufactured parts, which are equivalent to new in performance. If you
send notice of defects during the warranty period, Agilent Technologies will
either repair or replace hardware products that prove defective.
United States:
Agilent Technologies
Test and Measurement Call Center
P.O. Box 4026
Englewood, CO 80155-4026
(tel) 1 800 452 4844
Canada:
Agilent Technologies Canada Inc.
5150 Spectrum Way
Mississauga, Ontario
L4W 5G1
(tel) 1 877 894 4414
Europe:
Agilent Technologies
European Marketing Organisation
P.O. Box 999
1180 AZ Amstelveen
The Netherlands
(tel) (31 20) 547 9999
Japan:
Agilent Technologies Japan Ltd.
Measurement Assistance Center
9-1, Takakura-Cho, Hachioji-Shi,
Tokyo 192-8510, Japan
(tel) (81) 426 56 7832
(fax) (81) 426 56 7840
Latin America:
Agilent Technologies
Latin American Region Headquarters
5200 Blue Lagoon Drive, Suite #950
Miami, Florida 33126
U.S.A.
(tel) (305) 267 4245
(fax) (305) 267 4286
Australia/New Zealand:
Agilent Technologies Australia Pty Ltd
347 Burwood Highway
Forest Hill, Victoria 3131
(tel) 1-800 629 485 (Australia)
(fax) (61 3) 9272 0749
(tel) 0 800 738 378 (New Zealand)
(fax) (64 4) 802 6881
Asia Pacific:
Agilent Technologies
19/F, Cityplaza One, 1111 King’s Road,
Taikoo Shing, Hong Kong, SAR
(tel) (852) 2599 7889
(fax) (852) 2506 9233
Technical data is subject to change
Printed in U.S.A.
5966-2868E
12/99