Download - PhylumTech
Transcript
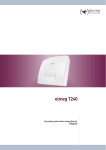
Produced under license of CONICET Argentina (©2013) For research purpose only Not for human diagnostic Data acquisition system WMicroTracker Hardware version: WMTK09-R01 Software version: WMTK V2.5 Rev.A (2013) This product is protected under international patents, owned by Argentinian National Research Council CONICET (P20060105084AR, PCT/IB2007/054628, US12515723 & EP2086408B1). All rights reserved. Any partial or total copy is not allowed, and will be subjected to law penalties. Product provided to use “As it is”. Not modifications allowed without CONICET permission. When the client acquires this product, the client understands and accepts these rules. For research purpose only. Not for human diagnostic. (©2013) Made in Argentina 1 WMicroTracker DATA ACQUISITION SYSTEM User Manual Software version: WMTK V2.5 Rev.A (2013) http://www.PhylumTech.com 2 INDEX: Preinstallation requirements 4 Overview 5 Introduction 5 About WMicroTracker 5 How it Works 5 Some system characteristics 6 Connection schematics 6 Packing list 7 Software description 8 Minimum requirements 8 Software installation 8 Starting the application 10 Main screen 10 Setup screen 15 Off-Line screen 22 Test DEVICE screen 26 Specifications 28 3 Preinstallation requirements... Thank you for acquiring our product. Please, read carefully this manual before proceeding, and save it for future reference. Equipment installation and setup requires the following items: - - 9V to 12V DC switching power supply with 1.5 Amps output (provided*). USB cable and O.S. drivers (Provided). IBM PC compatible with the following minimum requirements : Pentium II processor or above (>1GHz clock). 512Mb of RAM memory. 1 USB port available. DVD-ROM unit (optional) Windows XP 32bits (or higher) operative system. At least 200Mb of free HD space. Workbench space required for equipment installation: 22cmx28cmx9.1cm. Ambient free of vibrations and dust. Optimal temperature range: 10 to 28ºC**. Preferably low humidity (<50%). * Due to customs restrictions, in some countries the system might not come with the power supply. In those cases PhylumTech will provide de power supply from a local distributor. ** This range is for equipment functionality only; biological samples might have unique temperature requirements. 4 OVERVIEW Introduction Locomotor activity in animal models is a common parameter in disease studies and drug activity quantification. This readout has been widely used in Parkinson, Alzheimer and Huntington research, as well as a wide range of metabolic disorders, neurotoxicity, aging, circadian rhythms and novel drug discovery. About WMicroTracker WMicroTracker provides the capability to measure in an easy, fast and highly reproducible way the locomotor activity of small animals cultured in microtiter plates. This system is meant to be used in High Throughput Screening assays to evaluate the biological effects of potential compounds/drugs, RNAi/morpholino, as well as mutants studies in the model organisms Caenorhabditis elegans worms, Danio rerio (zebrafish) larvae, Xenopus laevis tadpoles, Anopheles sp. mosquitoes, and similar sized animals. On request software may be customized for larger size animals in 24, 12 and 6 wells plates. How it works WMicroTracker detects the animal movement through infrared microbeam, light scattering. Each microtiter well is crossed by at least one infrared microbeam, scanned more than 10 times per second. 5 The detected signal is digitally processed to calculate the amount of animal movement in a fix period of time. Some system characteristics: - 384 independent and simultaneous channel readouts. - Automatic calibration, real time data acquisition and monitor function. - 384 and 96 wells microtiter plates adaptors (also possible to use 6 to 24 wells plate on demand). - Different animal models capability: C. elegans, Drosophila sp., Danio rerio, Xenopus sp. tadpoles and similar sized organisms. - Phenotype automatic detection (customization on demand). - Low current consumption (<0.5Ampers) and insignificant heat emission. Connection schematic RS232 Port COMM LED USB Port Power supply 6 PACKING LIST The system includes the following accessories: Microplate reader system. 9V dc, 1.5Amp switching Power Supply. USB cable. Microplate format adapters: -384 wells -96 w. flat bottom -96 w. "U" shaped bottom. Acquisition Software CDROM. 7 SOFTWARE DESCRIPTION Software installation: Minimum requirements: - IBM PC compatible. CPU>1.0GHz, >512Mb RAM, >200Mb free space on HD (>10Gb free HD space recommended for real time data saving). - MS-Windows XP, Windows 7 and Windows 8. - USB port. - Screen resolution optimized to 1024x768pixels (minimum 800x600). Installation: 1) Insert WMicroTracker CD or download installation files from PhylumTech website (www.PhylumTech.com). 2) Connect the provided USB cable to the device and to a free USB port on your computer and execute "USBDriverInstaller.exe" from the USB driver folder. 3) Windows XP: Install the WMicroTracker acquisition Software from the Windows XP. Windows 7: Extract the ZIP file from the “wmicrotracker_win7_v25” folder into “c:\” and execute “Reg MSComm32.Ocx”. Windows 8: Extract the ZIP file from the “wmicrotracker_win8_v25” folder into “c:\”. 8 The following files will be copied to the HD: Installation package*: setup.exe wmtkr.cab setup.lst Application for Installing the setup Installation package System installation directives *Only for downloaded version. System files: wmtkr.exe wmt_help.pdf setup.dat threshld.dat groups.dat chgroup.dat status.dat w96f.dat w96u.dat w384.dat Main application help file Experimental setup * Channel threshold values * Groups names * Groups of channels * Channel status (enable/disable) * 384 channels setup for 96well flat bottom plate * 384 channels setup for 96well "U" shape plate * 384 channels setup for 384well plate * Runtime files com32.ocx Runtime for programming language * communication protocol library * * All this parameters are set by the Main Application; there is no need to access them directly. For detailed procedure, check System Check-Ups technical bulletin 9 Starting the application: When the application is started, the program checks the equipment communication and loads the setup file (if one has already been recorded). If any problem is detected, a message-box will appear. If no WMicroTracker equipment is connected, the system will report a COMM PORT ERROR and ask for the correct COMM PORT, pressing "enter" at the error pop-up will access the offline mode. IMPORTANT: It is recommended not to have other programs running in parallel in the computer while performing the acquisition, since it could interfere with data communication speed and DSP data processing. MAIN Screen The main screen is the first screen showed when the program starts in online mode. 10 In this windows the following buttons exists: “Play”, “Pause” y “Stop” Button: - “Play” : Starts the data acquisition lapse. A name for the current run will be requested for future reference. Acquisition lapse is configured in “Setup / Config” Tab. - "Pause" : Pauses the current acquisition lapse (the system does not keep track of the time it remains paused). - “Stop” : Stops the current data acquisition. During acquisition lapse, all analysis functions are disabled to prevent any possible interruptions in the communication. These commands will be enabled when the Acquisition is finished, stopped or paused. When the acquisition time is reached, the program stops automatically. “Report” : 11 This command will open the “Report Output” window. At this window it is possible to configure the file format of the experiment’s report. The report can be generated in TXT plain text format or in CSV text format which can be loaded by Microsoft Excel or almost any other spreadsheet application. The “output format” section allows choosing if activity time block will be presented in columns, rows or as a representation of the sensors array. Also the size of the time blocks to be reported. In the “Group Statistics” section it is possible to choose which statistics the report will contain. Standard Error, Standard Deviation and group size (N). Top plot: Activity Counts The top plot shows: Number of samples being acquired in the current time lapse. Temperature. Selected Channel (microbeam) activity. Selected Well activity*. Experimental group average activity**. 12 The algorithm used to detect locomotor activity must be selected in the "Setup" tab. When the acquisition finishes, it is possible to view the results using the command "Report" or working in the offline window. * If more than one microbeam (channel) crosses through one "Well", then the mathematical average of the channels will be calculated. ** Group activity is calculated as the average of the activity of the wells in that group. Bottom plot: Raw data The bottom plot shows the current Raw data for the selected channel sensor (red line) versus time. The locomotor activity detection threshold (blue/green line) is drawn below the Raw data. If the signal falls below the threshold it increments the activity counter. at the top plot. 13 Signal Threshold Zoom: It is possible to Zoom in and out the plot to view the data with further detail. Channels and Group list: Channels and Wells are sorted by experimental group (These Groups are generated from the “Setup" tab. The Well/channels are selected for display by double-clicking on the list or by pressing "Enter". Selected Well/channel Experimental Group Well/ Channels into the Group Note: When more than one microbeam crosses though one well (e.g. when 96 wells "flat bottom" or 24 wells plates are used), then a sub-index will be added to the Well name (.0, .1, .2, .3, etc). This sub-index corresponds to each of the microbeams crossing the well. 14 Tools Submenu: Tools options allow the user to adjust system functions. AutoCalibration tool Auto-Calibration and Auto-Zero allows to perform experiments directly, using a well-plate with animals and test solutions without blank-plate measurement. This option automatically calculates the best sensors configuration and the appropriate detection threshold. Briefly, the system applies a short algorithm to adjust detectors to linear range, and measures high frequency noise level to calculate the best threshold for animal movement detection. This setup is optimized for C.elegans worms and similar size organisms (0.1 to 1mm long). Lighting Control Tool* Light Control is used to set fixed Light/Darkness cycles for circadian rhythms experiments. Temperature Control Tool* Temperature control is used to set a fixed system temperature for Peltier cooled equipment. * This options are not available for all of the WMicroTracker range. SETUP screen (Experimental Configuration): 15 This tab is used to set acquisition parameters, experimental groups and microplate format. PROJECT “Rename”, “Load” y “Save”: Parameters and Configurations are saved for each new Project and maintained 16 for every run of said project until the user changes them (parameter changes does not alter raw data of previous runs). Data for each run is stored in the computer HD in separate folder within the project folder. Projects are identified by an ID number (automatically assigned) plus the name assigned by the user. In this way, subfolders will be saved into the main application folder starting with “p00001” for project number one, “p00002” for project two and so on. All data related to a specific project will be saved into these subfolders. For the first time the program is started the default project number p00000. - New Projects: Select “New…” in the "Setup" screen. If “Save...” is pressed, The system will ask you to upload current project, selecting "No" will also generate a new project. - Change Project Name: Select the “Rename” option and enter the new name. - Reading an existent Project: When the “Load…” button is press, a projects list will appear. It is possible to select the required project clicking on it. - Saving Data and modifications in the current project: Select “Save…” and confirm "Yes" to upload values into current project. Config sub-menu: The “Config” sub-menu allows choosing microplate format, acquisition lapse, and 17 locomotor activity detection algorithm. Well format: (Microtiter format) This option configures the type of well to use. After selection, the “Go” button loads the microplate file setup. 6 and 12 wells plates are also supported. NOTE: PLACE THE CORRECT ACRILYC ADAPTER ACCORDING TO MICROPLATE FORMAT SELECTION Acq Lapse (Acquisition time): This option configures the duration of the data acquisition for each run. Maximum 32000 minutes. DSP method (Activity detection algorithm): There are two Digital Signal Processing algorithms available, Default 1: 18 0_Threshold + Binary (First reported Algorithm. With filters) This option divides the data in fixed time blocks (by default this block size is = 30samples, and visualized each of the green or blue segments of the threshold line) If the signal falls any time within a block below the threshold (green and blue line) then the activity counter is incremented by 1. Threshold is calculated on every point of time On The Fly by the algorithm. 1_Threshold Average (Default algorithm for liquid and solid medium) In this option, every time the signal falls below threshold the activity counter is incremented. The threshold line is also calculated On The Fly at all times. NOTE: There’s a third detection algorithm design for very small organisms that don’t travel through the medium but this algorithms is only accessible after the run 19 is concluded. Groups sub-menu: The "Groups sub-menu" allows selecting the wells associated to an experimental group (biological or technical replicates). Groups are identified with a 3 digit number (from 000_ to 383_), plus the assigned name. When channels are loaded into a group, then, a new free group will appear into the list. The name of each group can be modified by double clicking in it from the list. The mean of all Channel/Wells associated to a group will be plotted in the main screen. However (if “the Save Real Time” option is enabled) all the data will remain separated in different files to enable future analysis. “CLEAR LIST” Button: Removes all channels from the group. “=>” button: Adds the selected channel to the current group. Clicking and dragging the cursor over the wells on the plate schematic below will also add them to the group. NOTE: Each well can only be assigned to one group and all channels associated with that well will be assigned to that group. “<=” button: Removes the selected channel from the current group. Right click on the wells from the plate schematic below will also remove them. “SET”: This drop-down menu has a list of preset group configurations described by the amount of rows and columns that each group will occupy on the plate. The 20 preset will be loaded upon selection after clicking the “Go…” button. NOTE: ALWAYS REMEMBER TO SET THE CORRECT WELL FORMAT IN THE “CONFIG” SUB-MENU BEFORE SETTING UP THE GROUPS. Output sub-menu: The “Output sub-menu” allows defining which data is going to be stored in hard disk files. Tools sub-menu: The “Tools sub-menu” allows defining which tools will be shown in the main window. 21 OFFLINE Screen: This tab allows reloading old projects, reading saved data and exporting it to text and graphic files. First it is necessary to select the Project to read, and the desired experiment: Once loaded the experiment, it's possible to plot the data pressing “Group Activity” or selecting the well number . The activity will be grouped by 30 minutes blocks. 22 To plot the activity, Activity Group and Channel to draw should be selected. It is possible to Export the Graph pressing the Right mouse button on the graphic. The Graph can be exported as an ASCII file or as a Windows Paint image. Report Button: This command will open the “Report Output” window. See Main Screen. Channel Signal: It is posible to save real time data from every run (see Output sub-menu), which will retain all the signal values stored for each channel. If real time data has been 23 saved then the “Channel Signal” option will plot in the screen the activity of the all the channels asociated to the selected well separetly. NOTE: The data will be loaded to memory in 25k sample blocks. It is possible to navigate through the run moving the slidder. Page changing could take some seconds while the data is loaded. Also it is possible to Export the data that is being displayed to Text (ASCII) or Graphic (Windows Paint) file by clicking the Right mouse button on the graphic. 24 Analyze This option performs a post-run threshold calculation (grey line) which usually provides more accurate noise and activity detection than the on the fly algorithm used during the run. At the bottom of the graphic, the numbers indicate how much activity exists in the corresponding time period for each channel in the selected well. To the right of the “Analyze” the size of the threshold and the detection method can be selected. NOTE: CHANGING THE TRESHOLD LEVEL WILL GREATLY ALTER THE RESULTS SO BEFORE SETING THIS PARAMETER PLEASE CONTACT PHYLUMTECH PERSONEL FOR FURTHER ASISTANCE. 25 Test DEVICE Screen: This screen can be used to test the working order of each one of the signal channels of the device. It can be accessed through the “File” menu. Before starting a test it should always be checked that there is no plate in the equipment and that the door is properly closed. After confirming the initiation of the test the Top Plot of the Main Screen will turn into a schematic of the sensor array displaying the received signal of each sensor, the color of each sensor displays the intensity of the signal, darker colors for lower signal and brighter colors for higher signal. It is not necessary for the signal of all the photoreceptors to be similar, the system performs an automatic calibration before and during every run to determine the appropriate rate between IR beam intensity and photoreceptors sensitivity. 26 At this point the system will begin a series of tests where it will set the microbeams emitters to maximum, minimum and medium levels for each sensor. If the system is working properly the color of the sensors on display should change accordingly. NOTE: It is possible to manually assess the working order of the sensors by opening the equipment door during the test. By doing so the tray of the device will block the IR beams turning the received signal to a minimum. If there is a communication problem between the equipment and the computer a message explaining so will be displayed on screen. To correct this problem the connection of the equipment to the computer and to the power supply should be checked. If neither one of this items fixes the problem then the WMicroTracker support team should be contacted. 27 SPECIFICATIONS Value MAX best MIN Unit Power supply Consumption Temperature operation range 15 15 40 9 8.5 20 4 Volts Wats °C Infrared wavelength Microbeam power Microbeam size Microbeam dispersion angle 25 150 COMMUNICATION PROTOCOL: protocol Configuration Maximum distance between PC and equipment 880 1 16 Nm mW/sr μm Grad USB or RS-232/USB adapter 115200bps, 8bits, 1stop, np 4m 28 If you have any comment or problem just contact us to info@phylumtech.com. Software and system updates available at www.PhylumTech.com 29 30


