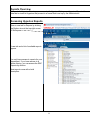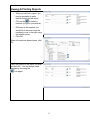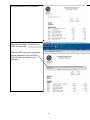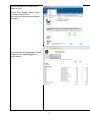
1
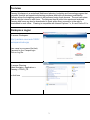
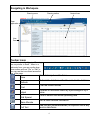
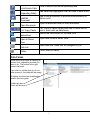
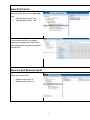
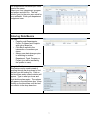
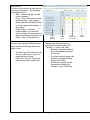
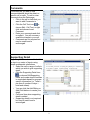
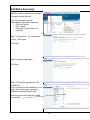
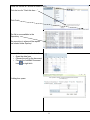
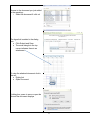
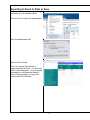
Hyperion Planning Public Sector Planning & Budgeting User Manual Budget & Planning office Division of Business and Financial Affairs Updated July 2014 Table of Contents Hyperion Planning Overview. ..................................................................................................................... 3 Workspace Logging_In……………………………………………………… ........................................ 3 Navigating Workspace………………………………………………………………… ........ 4 Toolbar Icons………………………………………………………………………………… 4 Data Forms Selecting a Web Form. ................................................................................................ 5 View Only Forms.......................................................................................................... 6 Expense and Revenue Input. ....................................................................................... 6 Entering Data Basics. .................................................................................................. 7 Using the Find Feature. ............................................................................................... 7 Form Colors. ................................................................................................................ 8 Copy, Paste & Spreading Data. ................................................................................... 8 Comments. .................................................................................................................. 9 Supporting Detail. ........................................................................................................ 9 Add/Edit Document ...................................................................................................... 10 Exporting to Excel to Print or Save .............................................................................. 13 Hyperion Reports Overview ...................................................................................................................... 14 Accessing Hyperion Reports ........................................................................................ 14 Viewing and Printing .................................................................................................... 15 2 Overview Planning Workspace is a centralized Web-based planning, budgeting and forecasting program that integrates financial and operational planning processes and improves business predictability. Planning allows the budgeting process to be performed using a web browser. The end user enters data through the internet in web forms. The data can then be pulled into reports and analyzed. Planning web forms can also be downloaded to Excel with a direct connection to the web or downloaded to work offline. Planning is compatible with Internet Explorer 7.x, 8.x and Firefox 3.5.x. Workspace Logon To access Workspace: http://yardarm.csuci.edu:19000/ workspace/index.jsp User name is your name (first.last). Password is your Campus login. Click on Log On. To access Planning: Select Navigate > Applications > Planning > CSUCI_PS or click here 3 Navigating in Workspace Planning menu Planning toolbar Content Area Open application View Pane Toolbar Icons The toolbar icons for Hyperion Planning are very similar to Excel. When in a web entry form, you can use the drop down menus such as “File” or “Edit” or you can use the icons listed across the top of the page Save Refresh Print Adjust Grid Spread Mass Allocate Cell Text Save data input on data forms Refresh the data form with data sorted in the database Print the current screen Increase or decrease values by a percentage or by a value Lock or unlock cells when spreading data Run a mass allocate calculation Add cell text (comments/detail) to a specific cell at any level in data forms 4 Lock/Unlock Cells Supporting Detail Add/Edit Document Open Document Cut, Copy, Paste Instructions Open in Smart View Task List Status Lock or unlock cells when spreading data Add detail that aggregates the cell value in data forms Add or edit documents to provide documentation for data in cells Open an attached Excel or Word document Cut, Copy or Paste values from one or more cells to one or more cells on data forms Shows the instructions for the data form Open data forms in Smart View Open task lists if task lists are assigned to you Check task list status Data Forms There are several forms in Planning to choose from, depending on what you want to do. The folders to the right contain the forms. If you click on a folder that you do not have access to, the folder will be empty. All folders and forms are explained in detail in this user guide. Folders are here Forms will be here 5 View Only Forms Click on Budget Managers: There are 2 forms here that allow you to view only data o View Actuals Current Year o View Budget Current Year You can view budget data or actual data in these web forms but you cannot make any changes here. Select your fund, department, program and project and click Go. Expense and Revenue Input Expense and Revenue Input Next Yr: There are 2 forms here. o Expense Input Next Yr o Revenue Input Next Yr 6 The Expense and Revenue Input forms function the same. Select your fund, department, program and project and click Go. The first column (gray) is the prior year actual for your reference. Enter your department budget and save. Entering Data Basics You can: o Page through Departments, Funds, Programs and Projects with a drop down bar o Click Go to switch to the intersection of members you chose. o Always save data changes prior to switching to another Department, Fund, Program or Project (you will be warned by the system to save). Using the Find feature: This feature can be used instead of scrolling through the drop down to find the item you are looking for. Click on the binoculars and a search window will appear. Type in what you know and click the binoculars again. The options will appear in the drop-down box. Keep clicking on the binoculars until the item you need is in the drop-down box 7 Form Colors: The colors of the cells in a web form act as primary information. The following are potential colors: o Blue – These cells are row and column headers. o Gray – These cells are read only and are locked. They contain Actual data from PeopleSoft data or are an upper level member of the outline. o Bright Yellow – Contains unsaved data. If you see this color it means, you have entered data in and have not saved it yet. o White – Open to be written in. You can copy and paste data between forms, between Planning & Excel, and within a form o Use the Copy & Paste buttons at the top of the form to copy and paste just like in Excel. o Use Ctrl+C & Ctrl+V for moving data around within a data form. Row & Column Headers Read only Data entered but not saved Spread data across months by entering your desired total in the “Quarter” or “Year Total” cells o Data will spread according to the profile already existing in the months. o If no data currently exists, the numbers will spread evenly across the months. o All data in a quarter can be removed by deleting the Quarter or Year Total value. 8 Write Access Comments Comments lets you add or view comments/details about the data in a specific cell or cells. To add or view comments from the Data page: o Click in the cell or cells that you want to add Comments to. o Click the Cell Text icon or choose Edit - Cell Text, or right click and choose Insert Comment. o Enter your comments and click on submit. You will now see a small blue triangle in your cell. o Comments are not required but may be useful and is encouraged. Supporting Detail Supporting Detail can be used to build an input or a series of inputs using simple mathematic calculations o Select the cell or range of cells to which you wish to give supporting detail. o Click the Supporting Detail icon or choose Edit/Supporting Detail and create simple formulas to create data based on program specific information (i.e. Travel = per diem X number of days + hotel and airfare). o You can click the Add Sibling or Add Child buttons to create your detail. o Cell turns blue when supporting detail is added. o Supporting detail is not required but may be useful and is encouraged. 9 Add/Edit a Document A supporting document or URL can be added to a cell to capture more detailed information about that cell. First, the document must be downloaded to the report repository o Click on Explore o File > Import o Choose the type of file to be imported Step 1. Choose File. You can browse for this. Click Open. Click Next Step 2. Accept default items Click Next Step 3. Choose Groups tab and click Update List. If you only want the file available to your group, choose the group you are in. Otherwise, choose Scenario Grp. Move the group over using the middle arrow button. 10 Leave the Access & Favorite as Inherit. Click the box for “Push this item…” Click Finish The file is now available in the Repository. (the repository is where all the reports are located under Explore) Now add the document to the data form. o Open the data form. o Choose the cell for the document o Choose the Add/Edit Document icon or right click A dialog box opens. 11 Browse to the document you just added to the repository. o Select the document & click ok The hyperlink is added to the dialog box. Click Submit and Save The small triangle in the top corner indicates there is an attachment To view the attached document click in the cell. Right click Open Document A dialog box opens to save or open the file and the document displays 12 Exporting to Excel to Print or Save You can export your data form to Excel and work on your numbers offline. Click on Tools > Export as Spreadsheet Save the downloaded File Open the file in Excel Note: You cannot add cell text or supporting detail in Excel. You can only work on data displayed. You can create calculations in cells and the data will load to Planning when you copy and paste it back into Planning. 13 Reports Overview All reports for Hyperion Planning are accessed with Hyperion Workspace. Hyperion Reports take data that is stored in Hyperion and present in a format that is set up by the Administrator. Accessing Hyperion Reports Open a new tab for Reports by clicking the Explore icon at the top-right corner of Workspace A new tab and a list of available reports appear. You only have access to reports for your department. If you have access to a whole division, you can access the SBC Reports by division. Most reports come with a brief description. 14 Viewing & Printing Reports Double Click on a report and it will open. o When you click on a report, you may be prompted to enter specific criteria for this report. o Click on the to select a member (or type in your criteria) o Drill down to the member you would like to see and move the member(s) over to the right using the middle arrows. o Click OK. When all criteria has been chosen, click OK. Verify the criteria for the report you want and click OK. You can always make changes by choosing the icon again. 15 The report defaults to PDF preview. Hyperion allows you to change view after report has been run from PDF to HTML or vice versa. When in HTML view, you can change the any dimension in the Grid POV (Point of View) by clicking on the dimension. 16 Hyperion allows you to export your report to Excel Choose File > Export > Excel > FullyFormatted Grid and Text (be sure your internet browser allows pop-ups) Your document is downloaded to Excel where you can make changes to it and/or save it. 17 Notes 18 Notes 19