1
MS4630B
Network Analyzer
Operation Manual
Vol.1
Panel Operation
10th Edition
For safety and warning information, please read this
manual before attempting to use the equipment.
Keep this manual with the equipment.
ANRITSU CORPORATION
Document No.: M-W1534AE-10.0
Safety Symbols
To prevent the risk of personal injury or loss related to equipment malfunction, Anritsu Corporation uses the following
safety symbols to indicate safety-related information. Ensure that you clearly understand the meanings of the
symbols BEFORE using the equipment. Some or all of the following symbols may be used on all Anritsu
equipment. In addition, there may be other labels attached to products that are not shown in the diagrams in this
manual.
Symbols used in manual
DANGER
This indicates a very dangerous procedure that could result in serious injury or
death if not performed properly.
WARNING
This indicates a hazardous procedure that could result in serious injury or death if
not performed properly.
CAUTION
This indicates a hazardous procedure or danger that could result in light-to-severe
injury, or loss related to equipment malfunction, if proper precautions are not taken.
Safety Symbols Used on Equipment and in Manual
The following safety symbols are used inside or on the equipment near operation locations to provide information
about safety items and operation precautions. Ensure that you clearly understand the meanings of the symbols
and take the necessary precautions BEFORE using the equipment.
This indicates a prohibited operation.
symbolically in or near the barred circle.
The prohibited operation is indicated
This indicates an obligatory safety precaution.
indicated symbolically in or near the circle.
The obligatory operation is
This indicates a warning or caution. The contents are indicated symbolically in or
near the triangle.
This indicates a note. The contents are described in the box.
These indicate that the marked part should be recycled.
MS4630B
Network Analyzer
Operation Manual Vol.1 Panel Operation
10
17
November 1998 (First Edition)
December 2007 (10th Edition)
Copyright © 1998-2007, ANRITSU CORPORATION.
All rights reserved. No part of this manual may be reproduced without the prior written permission of the
publisher.
The contents of this manual may be changed without prior notice.
Printed in Japan
ii
For Safety
WARNING
1. ALWAYS refer to the operation manual when working near locations
at which the alert mark shown on the left is attached. If the advice in
the operation manual is not followed there is a risk of personal injury
or reduced equipment performance. The alert mark shown on the
left may also be used with other marks and descriptions to indicate
other dangers.
2. IEC 61010 Standard
The IEC 61010 standard specifies four categories to ensure that an
instrument is used only at locations where it is safe to make
measurements. This instrument is designed for measurement
category I (CAT I). DO NOT use this instrument at locations
specified as category II, III, or IV as defined below.
Measurement category I (CAT I):
Secondary circuits of a device that is not directly connected to a
power outlet.
Measurement category II (CAT II):
Primary circuits of a device that is directly connected to a power outlet,
e.g., portable tools or home appliance.
Measurement category III (CAT III):
Primary circuits of a device (fixed equipment) to which power is
supplied directly from the distribution panel, and circuits running from
the distribution panel to power outlet.
Measurement category IV (CAT IV):
Building service-line entrance circuits, and circuits running from the
service-line entrance to the meter or primary circuit breaker
(distribution panel).
Electric Shock
3. To ensure that the instrument is earthed, always use the supplied 3pin power cord, and insert the plug into an outlet with an earth
terminal. If power is supplied without earthing the equipment, there
is a risk of receiving a severe or fatal electric shock or causing
damage to the internal components.
iii
For Safety
WARNING
iv
Repair
4. This equipment cannot be repaired by the operator. DO NOT attempt
to remove the equipment covers or unit covers or to disassemble
internal components.
Only qualified service personnel with a
knowledge of electrical fire and shock hazards should service this
equipment. There are high-voltage parts in this equipment presenting
a risk of severe injury or fatal electric shock to untrained personnel. In
addition, there is a risk of damage to precision components.
Calibration
5. The performance-guarantee seal verifies the integrity of the equipment.
To ensure the continued integrity of the equipment, only Anritsu service
personnel, or service personnel of an Anritsu sales representative,
should break this seal to repair or calibrate the equipment. If the
performance-guarantee seal is broken by you or a third party, the
performance of the equipment cannot be guaranteed. Be careful not
to break the seal by opening the equipment or unit covers.
Falling Over
6. This equipment should always be positioned in the correct manner.
If the cabinet is turned on its side, etc., it will be unstable and may be
damaged if it falls over as a result of receiving a slight mechanical
shock.
Always set up the equipment in a position where the power switch
can be reached without difficulty.
Battery Fluid
7. DO NOT short the battery terminals and never attempt to disassemble
the battery or dispose of it in a fire. If the battery is damaged by any of
these actions, the battery fluid may leak. This fluid is poisonous.
DO NOT touch the battery fluid, ingest it, or get in your eyes. If it is
accidentally ingested, spit it out immediately, rinse your mouth with
water and seek medical help. If it enters your eyes accidentally, do
not rub your eyes, rinse them with clean running water and seek
medical help. If the liquid gets on your skin or clothes, wash it off
carefully and thoroughly.
LCD
8. This instrument uses a Liquid Crystal Display (LCD). DO NOT subject
the instrument to excessive force or drop it. If the LCD is subjected to
strong mechanical shock, it may break and liquid may leak.
This liquid is very caustic and poisonous.
DO NOT touch it, ingest it, or get in your eyes. If it is ingested
accidentally, spit it out immediately, rinse your mouth with water and
seek medical help. If it enters your eyes accidentally, do not rub
your eyes, rinse them with clean running water and seek medical help.
If the liquid gets on your skin or clothes, wash it off carefully and
thoroughly.
For Safety
CAUTION
Fuse Replacement
1. Always remove the mains power cable from the power outlet before
replacing blown fuses. There is a risk of electric shock if fuses are
replaced with the power cable connected. Always use new fuses of
the type and rating specified on the rear panel of the instrument.
There is a risk of fire if a fuse of a different rating is used.
T5.0A indicates a time-lag fuse.
Cleaning
2. Keep the power supply and cooling fan free of dust.
• Clean the power inlet regularly. If dust accumulates around the
power pins, there is a risk of fire.
Keep
the cooling fan clean so that the ventilation holes are not
•
obstructed. If the ventilation is obstructed, the cabinet may
overheat and catch fire.
3. NEVER touch parts to which the label shown on the left is attached.
These parts are hotter than 55°C and there is a risk of receiving a
burn.
Check Terminal
4. Never input a signal of more than the indicated value between the
measured terminal and ground. Input of an excessive signal may
damage the equipment.
v
For Safety
CAUTION
Replacing Memory
Back-up Battery
This equipment uses a Poly-carbomonofluoride lithium battery to backup
the memory. This battery must be replaced by service personnel when
it has reached the end of its useful life; contact the Anritsu sales section
or your nearest representative.
Note: The battery used in this equipment has a maximum useful life of
7 years. It should be replaced before this period has elapsed.
External
Storage Media
This equipment uses memory cards as external storage media for
storing data and programs.
If this media is mishandled or becomes faulty, important data may be lost.
To prevent this chance occurrence, all important data and programs
should be backed-up.
Anritsu will not be held responsible for lost data.
Pay careful attention to the following points.
• Never remove the memory card from the instrument while it is being
accessed.
• The memory card may be damaged by static electric charges.
• The back-up battery in SRAM memory cards has a finite life.
Replace the battery periodically. For details, refer to the explanation
on the memory card later in this manual.
• Anritsu has thoroughly tested all external storage media shipped with
this instrument. Users should note that external storage media not
shipped with this instrument may not have been tested by Anritsu, thus
Anritsu cannot guarantee the performance or suitability of such media.
Use in a residential
environment
This instrument is designed for an industrial environment.
In a residential environment this instrument may cause radio interference
in which case the user may be required to take adequate measures.
vi
Equipment Certificate
Anritsu Corporation certifies that this equipment was tested before
shipment using calibrated measuring instruments with direct traceability
to public testing organizations recognized by national research
laboratories, including the National Institute of Advanced Industrial
Science and Technology, and the National Institute of Information and
Communications Technology, and was found to meet the published
specifications.
Anritsu Warranty
Anritsu Corporation will repair this equipment free-of-charge if a
malfunction occurs within one year after shipment due to a manufacturing
fault, under the condition that this warranty is void when:
• The fault is outside the scope of the warranty conditions described in
the operation manual.
• The fault is due to mishandling, misuse, or unauthorized modification
or repair of the equipment by the customer.
• The fault is due to severe usage clearly exceeding normal usage.
• The fault is due to improper or insufficient maintenance by the
customer.
• The fault is due to natural disaster including fire, flooding, earthquake,
etc.
• The fault is due to use of non-specified peripheral equipment,
peripheral parts, consumables, etc.
• The fault is due to use of a non-specified power supply or in a nonspecified installation location.
In addition, this warranty is valid only for the original equipment
purchaser. It is not transferable if the equipment is resold.
Anritsu Corporation shall assume no liability for injury or financial loss of
the customer due to the use of or a failure to be able to use this equipment.
Anritsu Corporation Contact
In the event that this equipment malfunctions, contact an Anritsu Service
and Sales office. Contact information can be found on the last page of
the printed version of this manual, and is available in a separate file on
the CD version.
vii
Notes On Export Management
This product and its manuals may require an Export License/Approval by
the Government of the product's country of origin for re-export from your
country.
Before re-exporting the product or manuals, please contact us to confirm
whether they are export-controlled items or not.
When you dispose of export-controlled items, the products/manuals need
to be broken/shredded so as not to be unlawfully used for military purpose.
viii
Crossed-out Wheeled Bin Symbol
Equipment marked with the Crossed-out Wheeled Bin Symbol complies
with council directive 2002/96/EC (the “WEEE Directive”) in European
Union.
For Products placed on the EU market after August 13, 2005, please
contact your local Anritsu representative at the end of the product's
useful life to arrange disposal in accordance with your initial contract and
the local law.
ix
CE Conformity Marking
Anritsu affixes the CE conformity marking on the following product(s) in
accordance with the Council Directive 93/68/EEC to indicate that they
conform to the EMC and LVD directive of the European Union (EU).
CE marking
1. Product Model
Model:
MS4630B Network Analyzer
2. Applied Directive
EMC:
LVD:
Directive 2004/108/EC
Directive 2006/95/EC
3. Applied Standards
• EMC:Emission: EN 61326-1: 2006 (Class A)
Immunity:EN 61326-1: 2006 (Table 2)
IEC 61000-4-2 (ESD)
IEC 61000-4-3 (EMF)
IEC 61000-4-4 (Burst)
IEC 61000-4-5 (Surge)
IEC 61000-4-6 (CRF)
IEC 61000-4-8 (RPFMF)
IEC 61000-4-11 (V dip/short)
Performance Criteria*
B
A
B
B
A
A
B, C
*: Performance Criteria
A: During testing, normal performance within the
specification limits.
B: During testing, temporary degradation, or loss of
function or performance which is self-recovering.
C: During testing, temporary degradation, or loss of
function or performance which requires operator
intervention or system reset occurs.
x
Harmonic current emissions:
EN 61000-3-2: 2006 (Class A equipment)
• LVD: EN 61010-1: 2001 (Pollution Degree 2)
4. Authorized representative
Name:
Address, city:
Country:
Loic Metais
European Quality Manager
ANRITSU S.A. France
16/18 Avenue du Québec SILIC 720 Zone de
Courtaboeuf
91951 Les Ulis Cedex
France
xi
C-tick Conformity Marking
Anritsu affixes the C-tick mark on the following product(s) in accordance
with the regulation to indicate that they conform to the EMC framework
of Australia/New Zealand.
C-tick marking
1. Product Model
Model:
MS4630B Network Analyzer
2. Applied Standards
EMC:Emission: EN 61326-1: 2006 (Class A equipment)
xii
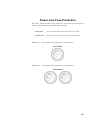
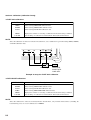
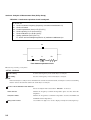
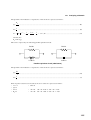
Power Line Fuse Protection
For safety, Anritsu products have either one or two fuses in the AC power
lines as requested by the customer when ordering.
Single fuse:
A fuse is inserted in one of the AC power lines.
Double fuse:
A fuse is inserted in each of the AC power lines.
Example 1: An example of the single fuse is shown below:
Fuse Holder
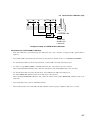
Example 2: An example of the double fuse is shown below:
Fuse Holders
xiii
xiv
About This Manual
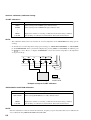
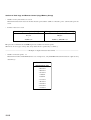
Lineup of Operation Manuals
Two different Operation Manuals (Vol. 1 and Vol. 2) come standard with the MS4630B. Refer to these manuals as
required.
Vol.1
MS4630B
Lineup of Operation
Manuals
Panel Operation
Remote Operation
Vol.2
(GPIB and PTA Remote Control)
Panel Operation:
This manual provides general information about the MS4630B
and detailed information about preparations before use, and
panel operations excluding automatic measurement such as performance tests.
Remote Operation (GPIB Control and PTA Control):
This manual explains IEEE488.2-based GPIB remote control as
the MS4630B conforms to IEEE488.2.
This manual also explains PTA, a function for programming
high-speed control and processing using a high-level language
PTL. It is performed by the personal computer incorporated in
the MS4630B, promoting automatic measurement along with
the GPIB.
I
Table of Contents
For Safety ...........................................................
iii
About This Manual ................................................
I
Section 1
1.1
1.2
1.3
1.4
1.5
Product Overview ..................................................................
Organization of This Manual .................................................
System Configuration ............................................................
Application Parts and Peripheral Devices .............................
Specifications ........................................................................
Section 2
2.1
2.2
2.3
2.4
2.5
4.1
4.2
4.3
4.4
II
2-2
2-3
2-6
2-7
2-10
Basic Operations .............................. 3-1
Turning ON the Power ...........................................................
Displaying the Self-Test Result .............................................
Data Displayed on the Screen ...............................................
Presetting ..............................................................................
Symbols .................................................................................
List of Soft Key Menu Functions ...........................................
The Basics of Key Operations ...............................................
Section 4
1-2
1-3
1-4
1-5
1-6
Preparations before Use .................. 2-1
Environmental Conditions of Installation Site ........................
Safety Measures ....................................................................
Mounting on a Rack and Stacking with Other Units ..............
Preparations to Make before Turning ON the Power ............
Notes on Handling Storage Medium .....................................
Section 3
3.1
3.2
3.3
3.4
3.5
3.6
3.7
Introduction ...................................... 1-1
3-2
3-4
3-6
3-9
3-10
3-12
3-14
Selecting Measurement Items
(Channels Group) ............................. 4-1
Selecting a Measurement Channel (Menu) ...........................
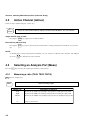
Active Channel (Active) .........................................................
Selecting an Analysis Port (Meas) ........................................
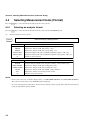
Selecting Measurement Items (Format) ................................
4-2
4-4
4-4
4-6
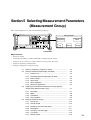
Section 5
5.1
5.2
5.3
5.4
Setting a Frequency (Frequency, Span) ...............................
Settings Related to Input/Output (Out/Input) .........................
Improving the S/N Ratio and Setting an Delay .....................
Aperture (Group Delay Measurement) (Avg) ........................
Settings Related to Sweep ....................................................
Section 6
6.1
6.2
6.3
6.4
6.5
8.1
8.2
8.3
8.4
9.1
9.2
9.3
6-2
6-3
6-5
6-8
6-9
7-2
7-5
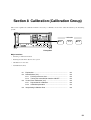
Calibration (Calibration Group) ....... 8-1
Explanation ............................................................................
Normalization (X-S) ...............................................................
Vector Errors Calibration (Cal) ..............................................
Interpolating Calibration Data ................................................
Section 9
5-7
5-10
Marker (Marker Group)..................... 7-1
Setting, Moving, and Displaying Markers (Marker) ...............
Useful Marker Functions (Fctn) .............................................
Section 8
5-2
5-3
Display (Display Group)................... 6-1
Active Trace (Active) .............................................................
Setting a Scale (Scale) ..........................................................
Setting the Display Screen (Trace) .......................................
Displaying All Items at the Touch of a Key (Display All) .......
Turning the Backlight ON/OFF (Backlight ON/OFF) .............
Section 7
7.1
7.2
Selecting Measurement Parameters
(Measurement Group) ...................... 5-1
8-2
8-3
8-4
8-9
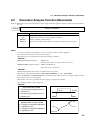
Analysis of Measurement Data
(Utility Group) ................................... 9-1
Filter Analysis Function (Filter) ..............................................
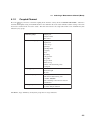
Resonator Analysis Function (Resonator) ............................
Limit Test (Limit) ....................................................................
9-2
9-5
9-8
III
Section 10 Hard Copy and Remote Control
(Copy/Memory Group) ..................... 10-1
10.1 Outputting a Hard Copy of Screen Data (Copy) ...................
10.2 Making Settings Related to the Hard Copy and ....................
Remote Control (Copy Control, Local) ..................................
10.3 Save/Recall ...........................................................................
10-2
10-2
10-6
Section 11 System .............................................. 11-1
11.1 Switching between Marker Setting Modes
(Frequency/Point) ..................................................................
11.2 Selecting an Impedance Measurement Method
(Bridge/Transfer Method) ......................................................
11.3 Setting the Date and Time .....................................................
11.4 Checking Options ..................................................................
11.5 Setting a Display Color ..........................................................
11.6 Displaying a Self-test Result .................................................
11-2
11-2
11-3
11-3
11-4
11-4
Section 12 Measurements .................................. 12-1
12.1
12.2
12.3
12.4
12.5
Analyzing a Network ..............................................................
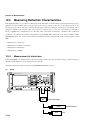
Basics of Measurement .........................................................
Measuring Transfer Characteristics ......................................
Measuring Reflection Characteristics ....................................
Measuring Transfer and Reflection Characteristics
Simultaneously (Option 12) ...................................................
12.6 Measuring a Filter ..................................................................
12.7 Measuring a Resonator .........................................................
12-2
12-6
12-7
12-16
12-24
12-27
12-29
Section 13 Performance Tests ........................... 13-1
13.1 Cases where Performance Tests are Required ....................
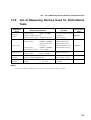
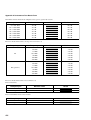
13.2 List of Measuring Devices Used for Performance Tests .......
13.3 Performance Test ..................................................................
13-2
13-3
13-4
Section 14 Maintenance ..................................... 14-1
14.1 Cleaning the Cabinet .............................................................
14.2 Notes on Storage ...................................................................
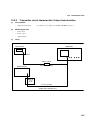
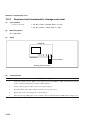
14.3 Repackaging and transporting the System to Return ...........
IV
14-2
14-3
14-4
Appendixes....................................................... App-1
Appendix A Performance Test Result Form ...................................
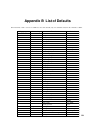
Appendix B List of Defaults .............................................................
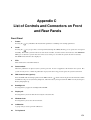
Appendix C List of Controls and Connectors on Front and
Rear Panels .................................................................
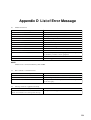
Appendix D List of Error Message ..................................................
Appendix E Example of Settings for Video Plotter VP1500 II ........
A-1
B-1
C-1
D-1
E-1
V
VI .
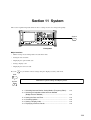
Section 1 Introduction
This section provides a brief overview of the product and explains the manual structure, system configuration, application
parts, peripheral devices, and specifications of this system.
1.1
1.2
1.3
1.4
1.5
Product Overview ......................................................................
Organization of This Manual .....................................................
System Configuration ................................................................
1.3.1 Standard configuration...................................................
1.3.2 Options ..........................................................................
Application Parts and Peripheral Devices .................................
Specifications ............................................................................
1-2
1-3
1-4
1-4
1-4
1-5
1-6
1-1
Section 1 Introduction
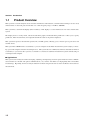
1.1
Product Overview
This system is a network analyzer used to measure transmission and reflection (external reflection bridges are also used)
characteristics of electronic parts and circuits over a wide frequency range of 10 Hz to 300 MHz.
This system has a 6.5-inch flat display (640 × 480 dots). This display is a color LCD based on an active matrix drive
system.
The display shows a soft key menu, various measurement graphs, and measurement parameters to allow you to specify
parameters, make measurements, and output measurement results to the printer and plotter.
This system incorporates measurement ports R, TA, and TB (option), allowing you to measure port-to-port ratios and
absolute levels.
This system has a GPIB interface as standard, so you can configure an automatic measurement system easily by connecting a personal computer and other measuring devices. This system also has a PTA (Personal Test Automation) function
as standard, so you can use this system as a controller to construct an automatic measurement system without using an
external personal computer.
■ Applications
This system can be widely used when developing, adjusting, and inspecting electronic parts and devices in the communications market (for mobile and optical communications, etc.) and the AV market (for high-quality TVs and satellite
broadcasting). Especially, the macro analysis function for filters and piezoelectric resonators facilitates and accelerates
measurements.
1-2
1.2
1.2
Organization of This Manual
Organization of This Manual
This manual consists of 14 sections and five appendixes. These sections and appendixes are briefly described below.
Section
Section 1
Introduction
Section 2
Preparations before Use
Section 3
Basic Operations
Section 4
Section 5
Selecting Measurement
Items
Selecting Measurement
Parameters
Section 6
Displays
Section 7
Markers
Section 8
Calibrations
Analysis of measurement
data
Hard copy and Remote
Section 10
control
Section 9
Section 11 System
Section 12 Measurements
Section 13 Performance tests
Section 14 Maintenance
Appendix A
Appendix B
Appendix C
Appendix D
Appendix E
Description
This section provides a brief overview of the product. It also explains the
manual structure, system configuration, application parts, and specifications of this system.
This section explains the safety measures and preparations that must be
made before using (turning on) this system.
This section explains basic operations to the operators who use this system
for the first time.
This section explains to select measurement items.
This section explains to set measurement conditions.
This section explains to set the measurement waveforms for easy observation.
This section explains to read the measurement data by the marker and
explains other marker functions.
This section explains to calibrate the measurement system for eliminating
errors.
This section explains the analysis of filter and resonator and the limit test.
This section explains to output a hard copy of screen data to the printer and
save/recall measurement conditions and to set the GPIB remote control etc.
This section explains the important setting which is not frequently changed
of this equipment.
This section explains the typical measurement.
This section explains the measuring devices, setup, and procedures for
performance tests.
This section explains daily maintenance, long-period storage, repackaging,
and transportation.
Performance Test Result Form
List of Defaults
List of Control and Connectors on Front and Rear Panels
Type and Contents of the Error Message
Example of Settings for Video Plotter VP1500 II
1-3
Section 1 Introduction
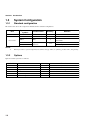
1.3
System Configuration
1.3.1
Standard configuration
The table below shows the components included in the standard configuration.
Item
Main unit
Accessories
Type name*1 or
symbol*1
MS4630B
Product name*1
Quantity*1
Network analyzer
Power cord
1
1
F0013
Fuse
2
W1534AE
W1535AE
Operation
Manuals
1 set
Remarks
Two 5 A fuses, for AC line
T5 A250V
Panel Operation
Remote Operation
NOTE:
*1
When you order a system component, let us know its type name (or symbol), product name, and quantity.
1.3.2
Options
Options for this system are as follows:
Option No.
01
02
10
12
13
14
1-4
Product name
PMC interface
RS-232C, Centronics interface
Output attenuator
3-ch receiver
High stability reference oscillator
3-branch output
Quantity
1
1
1
1
1
1
Remarks
FUJISOKU memory card interface
0 to 70 dB, Variable in steps of 10 dB
1.4
1.4
Application Parts and Peripheral Devices
Application Parts and Peripheral Devices
The table below lists the application parts and peripheral devices for the MS4630B. All are optionally available.
Application Parts and Peripheral Devices
Type name*1
or symbol*1
J0007
J0008
P0005
P0006
P0007
P0008
P0009
J0079
J0395
B0334C
B0329C
B0331C
B0333C
MC3305A
MC3306A
VP-1500II
Z0047
62BF50
62B50
62BF75
62B75
MA2201A
MA2202A
MA2203A
MA2301A
MA2302A
MA2303A
MA2204A
MA2403A
MA414A
MA1506A
MA4605A
ME010 Seriese
NOTE:
*1
Product name*1
GPIB connection cable, 1 m
GPIB connection cable, 2 m
Memory card (32K bytes)
Memory card (64K bytes)
Memory card (128K bytes)
Memory card (256K bytes)
Memory card (512K bytes)
Fixed attenuator for high power
Fixed attenuator for high power
Carrying case
Protection cover
Front handles
Rack mount kit
PTA keyboard
PTA keyboard
Video plotter
Paper for UA-455A
Reflection bridge
Reflection bridge
Reflection bridge
Reflection bridge
Reflection bridge
Reflection bridge
Reflection bridge
Reflection bridge
Reflection bridge
Reflection bridge
Impedance probe
Impedance probe
Impedance measuring kit
π-circuit fixture
Impedance convesion adapter
test fixture
Remarks
408JE-101
408JE-102
BS32F1-C-172,
Battery life: About 5 years
BS64F1-C-173,
Battery life: About 5 years
BS128F1-C-174, Battery life: About 4.3 years
BS256F1-C-1175, Battery life: About 2.2 years
BS512F1-C-1176, Battery life: About 1.1 years
DC to 8 GHz, 30 dB, 25 W
DC to 9 GHz, 30 dB, 30 W
With protection cover and casters
A set of two handles
JIS type
ASCII type
A set of 5 rolls
10 to 1000 MHz, BNC-P, 50 Ω, unbalance
10 to 1000 MHz, BNC-J, 50 Ω, unbalance
10 to 1000 MHz, BNC-J, 75 Ω, unbalance
10 to 1000 MHz, BNC-P, 75 Ω, unbalance
10 Hz to 250 kHz, 600 Ω, balance, MA214 terminal
10 Hz to 250 kHz, 600 Ω, balance, MA214 terminal
10 Hz to 250 kHz, 900 Ω, balance, MA214 terminal
2 kHz to 2 MHz, 75 Ω, balance, MA214 terminal
2 kHz to 2 MHz, 135 Ω, balance, MA214 terminal
2 kHz to 2 MHz, 150 Ω, balance, MA214 terminal
30 Hz to 300 kHz, 2 Ω to 1 MΩ
30 kHz to 30 MHz, 2 Ω to 1 MΩ
for MA2403A
DC to 125 MHz, for resonator mesurement
DC to 300 MHz, 50 Ω : 75 Ω unbalance
PIN, AMD, chip inductor, etc.
When you order a product, lest us know its type name (or symbol), product name, and quantity.
1-5
Section 1 Introduction
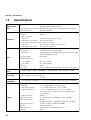
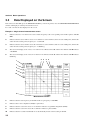
1.5
Specifications
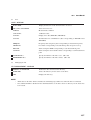
Measurement
item
Frequency
Input
Transmission characteristic (measurement of ratios):
Magnitude, phase, and group delay
Reflection/impedance characteristics: Magnitude and phase (An external transducer is also used.)
Level characteristic:
Absolute magnitude
Range:
10 Hz to 300 MHz
Resolution:
0.01 Hz
Accuracy (standard)
Aging rate:
≤±10–6/day (15 min. after power-on)
Temperature characteristic: ≤±5 × 10⁻⁶ (0 to 50˚C)
Accuracy (Option 13: High-stability reference resonator)
Aging rate:
≤±2 × 10⁻⁸/day (24 hours after power-on)
Temperature characteristic: ≤±5 × 10⁻⁸/day (0 to 50˚C)
Number of channels
Standard:
2 (R, TA), Option 12: 3 (R, TA, TB)
Impedance:
Switchable between 50 Ω and 1MΩ (between 75 Ω and 1 MΩ
when the MA4605A is used)
Input range (IRG):
0/+20 dBm
Maximum input power
AC: +20 dBm
DC: ±2.2 V (50 Ω)
AC: 0 dBm
DC: ±20 V (1 M Ω)
Connector:
BNC-J
Probe source:
+12 ±1 V, 100 mA (with a circuit for protection against shorts)
Average noise
level
≤–120 dBm (RBW : 1 kHz, 1 to 300 MHz), ≤–110 dBm (RBW : 1 kHz, 80 kHz to 1 MHz)
Cross talk
Between channels:
≥120 dB (80 kHz to 300 MHz), ≥110 dB (to 80 kHz)
Between transmitter and receiver circuits:
≥125 dB
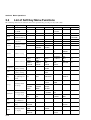
Resolution
bandwidths
3, 10, 30, 100, 300, and 500 Hz, 1, 2, 3, 4, 5, 10, and 20 kHz, and automatically set bandwidth
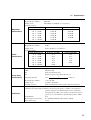
Output level range
Output A:
Output B (standard):
Output B (Option 14):
Output
Output resolution:
Output level accuracy:
Output level linearity:
Output level deviation:
Step error:
Output impedance:
Connector:
1-6
0 to +21 dBm, Option 10: –70 to +21 dBm
–6 to +15 dBm , Option 10: –76 to +15 dBm
–9.5 to +11.5 dBm, Option 10: –79.5 to +11.5 dBm
(take 6 dB from above value, when uses with MA4605A
75 ohm adapter)
0.01 dB
≤±1.0 dB (Frequency: 100 MHz, A output: +10 dBm)
≤0.5 dB
(at 0 dBm, Frequency: 100 MHz, A output: 0 to +21 dBm)
≤1.5 dB (A output: +10 dBm at 100 MHz)
±0.5 dB (option 10)
50 Ω (75 Ω when the MA4605A is used)
BNC-J
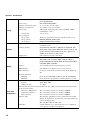
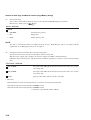
1.5
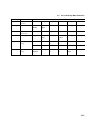
Magnitude
measurement
Phase
measurement
Group delay
measurement
Calibration
Specifications
Measurement range:
≥120 dB
Measurement resolution:
0.001 dB
Display scale:
0.01 dB/div to 50 dB/div (1-2-5 sequence)
Dynamic accuracy
10 kHz to 300 MHz
80 kHz to 100 MHz
Level relative to IRG
±0.2 dB
±0.2 dB
0 to –10 dB
±0.05 dB
±0.05 dB
–10 to –60 dB
±0.30 dB
±0.10 dB
–60 to –70 dB
±1.00 dB
±0.30 dB
–70 to –80 dB
±4.00 dB
±1.20 dB
–80 to –90 dB
–
±4.00 dB
–90 to –100 dB
Measurement range:
Measurement resolution:
Display scale:
Dynamic accuracy
Level relative to IRG
0 to –10 dB
–10 to –60 dB
–60 to –70 dB
–70 to –80 dB
–80 to –90 dB
–90 to –100 dB
±180˚
0.001˚
0.01 to 50˚/div (1-2-5 sequence)
Measurement range:
DRG:
∆θ:
∆F:
1 ps to 400 ms
∆θ/(360 × ∆F)
Phase measurement range
Frequency span × Smoothing aperture (%)
80 kHz to 100 MHz
±1.5˚
±0.3˚
±0.8˚
±2.0˚
±6.0˚
±20.0˚
10 kHz to 300 MHz
±1.5˚
±0.3˚
±2.0˚
±6.0˚
±20.0˚
–
2
× 100 (%)
number of measurement points
Measurement resolution:
2.78 × 10⁻⁵/∆F
Display scale:
1 ps/div to 50 ms/div
Dynamic accuracy:
Phase measurement accuracy/(360 × Aperture frequency)
Calibration type: RESPONSE, 1PORT, 1PATH 2PORT, RESPONSE/ISOLATION, π-NET
Calibration data interpolation: When the measurement frequency or number of measuremenpoints is changed, new calibration data can be obtained by
interpolation according to the old data (except when a log frequency is set or the number of measurement points is 1001).
Normalization:
X-S
Electric length correction range:
0 to ±999999.9999999 m, Resolution: 100 nm
Phase offset range:
±180˚
Smoothing aperture:
20 to
1-7
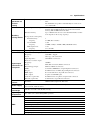
Section 1 Introduction
Frequency sweep:
Sweep
Display
Marker
Trace data
computation
1-8
Level sweep:
Number of measured points:
Number of breakpoints:
Sweep time:
LIN (CENTER/SPAN, START/STOP),
LOG (START/STOP)
LIN (START/STOP/STEP)
11, 21, 51, 101, 251, 501, 1001
Any number between 1 and 1001
150 us/point, 38 ms/250 points, all sweep (RBW: 20 kHz,
normalization, 1 trace)
1 ms to 27.5 h
Setting range:
Sweep function
Sweep range:
All sweep or partial sweep (between markers), List sweep
Sweep control:
REPEAT/SINGLE, STOP/CONT
Sweep trigger:
INT/EXT (RISE, FALL, LEVEL)
Maximum number of screens displayed:
2 channels, 4 traces
Analysis formats:
LOG MAG (M), PHASE (P), DELAY (D), M/P, M/D, LIN
MAG (LIN), LIN/P, LIN/D, REAL(R), IMAG (I), R/I, Z, Z/θ,
Q, Z/Q, POLAR, VSWR, IMPD (Z∠θ, Rs/Ls, Q/D, R+jx),
ADMT (Y∠θ, Rp/Lp, Cp, Q/D, G+jB)
Display unit:
640 × 480 dots, 6.5-inch, color LCD
Marker function:
NORMAL MKR, ∆MKR, 0MKR, MKR→MAX, MKR→
MIN, MKR→CF, ∆→SPAN, MKR→+PEAK, MKR→–
PEAK, MKR TRACK+PEAK, MKR TRACK–PEAK, MKR
CHANGE, MKR→OFFSET
Setting:
Set each marker position with a frequency or point.
Multi-marker:
A maximum of ten markers can be set for each trace.
Filter functions:
F0, IL, pass band (L, R), attenuation band (L, R), Ripple, Q,
SF
Resonator functions
RESON1:
Fr, Fa, Zr ,Za (0 PHASE) and Fm, Fn, Fm, Fn (MAX/MIN)
RESON2:
Fs, Fr, Fa, Zr, Za, Q, equivalent constants (R1, L1, C1, CO)
Averaging function
System:
SUM, MAX, MIN
Number of times:
1 to 1000
Measurement data memory (Each memory has up to 1001 points and has the same data format
as the anarysis format.)
Main trace (MT) memory: Two for channel 1 and two for channel 2 (XMEM)
Calibration S memory:
Two for channel 1 and two for channel 2 (SMEM)
Image memory:
Two for channel 1 and two for channel 2 (IMEM)
Subtrace (ST):
The following computations can be performed between MT
and ST. (Computations are performed on the data which is the
same as the display data.)
MT→ST, MT = MT–ST, MT = ST
Limit line:
A single limit line or a segment (10) can be set. Judgement
can be passed according to the limit line.
1.5
Measurement
parameter automatic
setting
Resolution bandwidth and sweep time:
Data storage and fetching:
Function memory
Auxiliary
storage device
Hard copy
Input/output
connectors on
rear panel
Specifications
The resolution bandwidth is automatically set for the set sweep
time.
The minimum sweep time is automatically set for the set receive bandwidth.
Able to store the measuring conditions, measurement data, calibration data and PTA application program in the internal
memory, FD and PMC and fetch them.
Up to 100 functions (however, the maximum number of functions depends on the storage capacity)
Storage device and capacity
Internal memory:
1
Capacity:
512 KB (Non-volatile)
3.5-inch FDD:
1 unit
Capacity:
720 KB (2 DD), 1.44 MB (2 HD), MS-DOS format
PMC (Option 01):
1 slot
Capacity:
32 to 512 KB
Hard copy output to video plotte, printer and FD
Reference resonator input
Frequency:
5/10 MHz –10 ppm
Level:
≥0.7 Vp-p (AC connection)
Input impedance:
50 Ω (BNC-J connector)
Reference resonator output
Frequency:
10 MHz
Level:
TTL (DC connection, BNC-J connector)
External trigger input:
TTL level (BNC-J connector)
GPIB:
Conforms to IEEE488.2 (24-pin Amphenol connector)
I/O port:
Parallel interface for PTA (36-pin Amphenol connector)
RGB output:
For external monitor (15-pin D-sub connector)
Video output:
Separate (round DIN 8-pin)
Centronics (option 02):
Parallel interface for printer (25-pin D-sub connector)
RS-232C (option 02):
Serial interface (9-pin D-sub connector)
External
control
Standard:
Power supply
100 to 110/200 to 240 VAC (—15/10%, max. 250 V, auto switching between 100 V and 200V),
47.5 to 63 Hz, ≤180 VA (max.)
Dimensions
and weight
Operating
temperature
EMC
GPIB and PTA, Option 02: RS-232C
426 (W) × 177 (H) × 451 (D) mm, ≤15 kg
0 to +50°C (+4 to 50°C during FDD operation)
Conducted disturbance:
Radiation disturbanc:
Harmonic Current Emission:
Electrostatic Discharge:
Electromagnetic Field Immunity:
Fast Transient / Burst:
Surge:
Conducted RF:
Voltage Dips / Short Interruptions:
EN 61326-1: 2006 (Class A)
EN 61326-1: 2006 (Class A)
EN 61000-3-2: 2006 (Class A)
EN 61326-1: 2006 (Table 2)
EN 61326-1: 2006 (Table 2)
EN 61326-1: 2006 (Table 2)
EN 61326-1: 2006 (Table 2)
EN 61326-1: 2006 (Table 2)
EN 61326-1: 2006 (Table 2)
1-9
Section 1 Introduction
1-10 .
Section 2 Preparations before Use
This section explains the safety measures that must be taken before using the system and the preparations that must also
be made before using the system. These safety measures must be taken to protect the human body and equipment. The
preparations that must be made before use include installation of this system in a rack, piling up this system along with
other units, protective grounding, fuse replacement, and storage medium handling. For how to connect the GPIB cable
and set addresses, see the Operation Manual (GPIB Remote Control).
2.1
2.2
2.3
2.4
2.5
Environmental Conditions of Installation Site ............................
2-2
2.1.1 Places to avoid ..............................................................
2-2
2.1.2 Distance from fan...........................................................
2-2
Safety Measures .......................................................................
2-3
2.2.1 General safety measures related to power supply ........
2-3
2.2.2 Maximum operation level of input terminals ..................
2-4
2.2.3 When the fun stops ........................................................
2-5
Mounting on a Rack and Stacking with Other Units ..................
2-6
2.3.1 Mounting on a rack ........................................................
2-6
2.3.2 Stacking with other units ................................................
2-6
Preparations to Make before Turning ON the Power ................
2-7
2.4.1 Connecting the Power Cord ..........................................
2-8
2.4.2 Replacing fuses .............................................................
2-9
Notes on Handling Storage Medium ......................................... 2-10
2.5.1 Floppy disk (FD) ............................................................ 2-11
2.5.2 Plug-in memory card (PMC) .......................................... 2-13
2-1
Section 2 Preparations before Use
2.1
Environmental Conditions of Installation Site
2.1.1
Places to avoid
This system operates normally within the ambient temperature range of 0 to 50 ˚C(4 to 50 ˚C ,when Floppy disc drive is
operating). To get the most from this system, avoid using it in the following places:
•
Place exposed to strong vibrations
•
Humid or dusty place
•
Place exposed to direct sunlight
•
Place exposed to active gases
To assure stable operation for an extended period, it is recommended that the system be used in a place where the supply
voltage fluctuates little.
CAUTION
Using this unit at room temperatures after using or leaving it at low temperatures for a long period could cause the internal circuits to short because of
condensation.
To prevent this, be sure to turn ON the POWER switch after the system has
been allowed to dry fully.
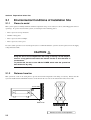
2.1.2
;
;;;
Distance from fan
This system has a fan on the back panel to prevent the internal temperature from rising excessively. Ensure that the
system is installed with a minimum clearance of 10 cm from the rear vent to the wall, another unit, and so forth.
10 cm or more
Built-in fan
Do not use in the vertical position
2-2
2.2
2.2
Safety Measures
Safety Measures
This section explains the safety measures that must be taken to prevent personal and system damage and interruption of
system operation.
2.2.1
General safety measures related to power supply
WARNING
• Before turning ON the power:
Always establish a protective ground. Turning ON the
power without establishing a protective ground could cause
electric shock which might result in severe injury or loss of
life. Also check the supply voltage. If a high voltage exceeding the specified value is applied, system damage or a fire
could result.
• While turning ON the power:
During maintenance, it is sometimes necessary to check or
adjust the inside of the system with the upper, lower, or side
cover open. Touching a high voltage circuit inside the system carelessly could cause electric shock which might result in severe injury or loss of life. Ask qualified service personnel to perform maintenance.
2-3
Section 2 Preparations before Use
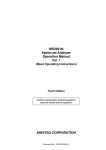
2.2.2
Maximum operation level of input terminals
The maximum operation level of the input terminals of this system is +20 dBm. Do not exceed this level. The maximum
output level of the output terminals is 21 dBm (A output).
CAUTION
The maximum operation level of the input terminals of this system is +20 dBm.
Supplying a signal exceeding this level could burn the input ATT and input
mixer.
is a symbol used to alert operators to a specific operating procedure that, if
not followed, may result in severe damage to the operators and system.
If supplying a signal including direct current component could burn the internal circuit.
These signal could not be measured. Take out direct current component of the
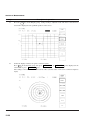
signal before measure it.
MS4630B
Network Analyzer
10Hz–300MHz
Channels
1
Menu
F1
Meas
Shift
Marker
2
Active
Marker
Format
Fctn
7
8
9
BS
4
5
6
MHz
µsec
1
2
3
kHz
msec
mm
•
+/–
Preset
F2
Measurement
Frequency
Span
F3
System
Avg
Remote
Sweep
Out/Input
0
sec
Enter m
F4
Calibration
Utility
Copy/Memory
Control
Limit
Local
F5
Cal
PTA
A
F6
Scale
Backlight Off
Battery
Busy
Display All
X→S
X–S
Filter
Resonator
Active
Trace
Probe
Source
Window Close
Outputs
PMC
Save/
Recall
Copy
Display
B
Keyboard
A (Opt B)
B
R
+12V
100mA
Inputs
TA
TB
Max +20dBm
R
Inputs
TA
Max +20dBm
2-4
TB
2.2
2.2.3
Safety Measures
When the fun stops
WARNING
The device has a fan installed at the rear panel to prevent the interior temperature from rising excessively. When the fan stops for some reasons, the temperature within the unit frame rise to such an extent that it may cause a fire.
For this reason, the device displays a message on the screen warning against
the stoppage of the fan at the rear panel (See (3) message concerning the device abnormality of Appendix D Error Message). When this message is displayed, immediately turn off the power of the device and take out the power
cord from the power outlet. As the unit frame is considered to have reached a
high temperature in this instance, take due precautions when handling it.
2-5
Section 2 Preparations before Use
2.3
Mounting on a Rack and Stacking with Other Units
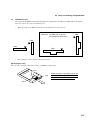
2.3.1
Mounting on a rack
To mount this system in a rack, a rack mount kit B0333C (option) is required. Mount the system according to the
illustration included in the rack mount kit.
2.3.2
Stacking with other units
To pile up this system and other units with the same width and depth, use linkage plates B0332 (option) for secure
linkage.
As these linkage plates are provided with an auto lock mechanism, the upper and lower units are locked automatically.
2-6
2.4
2.4
Preparations to Make before Turning ON the Power
Preparations to Make before Turning ON the Power
This system operates normally from a 100 Vac +10/–15 % power source. AC power must be supplied after taking
measures to prevent the following:
•
•
•
Injury and loss of life resulting from electric shock
Damage to internal circuits which results from abnormal voltage
Troubles resulting from ground current
The WARNING and CAUTION on the rear panel are used for safety related information to prevent the risk of the
operator's injury.
CAUTION
NO OPERATOR SERVICEABLE PARTS INSIDE.
REFER SERVICING TO
QUALIFIED PERSONNEL.
FOR CONTINUED FIRE
PROTECTION REPLACE
ONLY WITH SPECIFIED
TYPE AND RATED FUSE.
WARNING
CAUTION
Users should not repair the system.
Never open covers and disassemble internal parts. To perform
maintenance, call Anritsu service
personnel, who have undergone
specific training and are thoroughly
acquainted with fire and electric
shocks. Touching a high voltage
circuit inside the system carelessly
could cause electric shock which
might result in severe injury or loss
of life, or it could damage precision
parts.
Be sure to replace fuses
with ones of the specified
type and rating. Using
fuses of a different type or
rating could cause a fire.
Observe the precautions given on the following pages.
2-7
Section 2 Preparations before Use
2.4.1
Connecting the Power Cord
Check that the POWER switch on the front panel is turned off (switched to the (O) side).
Insert the power plug into an outlet, and connect the other end to the power inlet on the rear panel. To ensure that the
instrument is grounded, always use the supplied 3-pin power cord, and insert the plug into an outlet with a ground
terminal. (2) Grounding using a conversion adapter
WARNING
If the power cord is connected without the instrument grounded, there is a risk
of receiving a fatal electric shock. In addition, the peripheral devices connected to the instrument may be damaged.
When connecting to the power supply, DO NOT connect to an outlet without a
ground terminal. Also, avoid using electrical equipment such as an extension
cord or a transformer.
CAUTION
If an emergency arises causing the instrument to fail or malfunction, disconnect the instrument from the power supply by either turning off the POWER
switch on the front panel (switch to the (O) side), or by pulling out the power
cord or the power inlet.
When installing the instrument, place the instrument so that an operator may
easily operate the POWER switch.
If the instrument is mounted in a rack, a power switch for the rack or a circuit
breaker may be used for power disconnection.
2-8
2.4
2.4.2
Preparations to Make before Turning ON the Power
Replacing fuses
WARNING
•
Replacing a fuse with the power on could cause electric shock. Before
replacing a fuse, turn OFF the POWER switch and unplug the power cord
from the wall outlet.
•
Turning ON the power without establishing a protective ground could
cause electric shock.
An abnormal AC supply voltage could damage the internal circuits. After
replacing a fuse, establish the protective ground by one of the methods
explained before, make sure the AC supply voltage is normal, then turn ON
the POWER switch.
CAUTION
If you do not have a spare fuse, use a fuse of the same type and voltage and
current ratings as those of the blown fuse.
•
A fuse of a different type or rating could make it difficult to remove or attach, cause poor contact or delayed blowing.
•
A fuse with too high a voltage or current rating may not blow and thus
cause a fire upon reoccurrence of a fault.
Two 5 A fuses come standard with the system as shown in Section 1.3.1.
Set these fuses in the fuse holders.
If a fuse is blown due to any problem, determine and remedy the cause before replacing the fuse.
Then, replace the fuse following the procedure below.
Step
Operation
1
Set the POWER switch on the front panel to the
wall outlet.
(OFF) position, then unplug the power cord from the
2
Turning the fuse holder cap counterclockwise with a standard screwdriver allows you to remove it along
with the fuse.
3
Remove the fuse from the fuse cap and insert a spare fuse into it (any end first).
4
Replace the fuse cap in the fuse holder and tighten it by turning it clockwise with a standard screwdriver.
2-9
Section 2 Preparations before Use
2.5
Notes on Handling Storage Medium
CAUTION
Do not remove a storage medium, such as a plug-in memory card or floppy
disk, while it is being accessed. While a storage medium is being accessed,
the BUSY lamp is lit. If a storage medium is removed while it is being accessed, the data recorded on it could be destroyed.
This system uses a floppy disk (or an optional plug-in memory card) to store setting data and programs.
Abusing a storage medium could erase the data on it. It is recommended that backup copies of important data be created.
We assume no responsibility for loss of the data stored on storage media.
Notes on handling floppy disks and the plug-in memory card are provided in the following section.
2-10
2.5
2.5.1
Notes on Handling Storage Medium
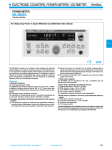
Floppy disk (FD)
This section explains how to handle 3.5-inch floppy disks, a storage medium used in this system.
Front
Rear
Fig. 2-1
(1)
3.5-inch floppy disk
Handling notes
The plastic case of a 3.5-inch floppy disk has a shutter, which protects the surface of the internal disk. When the
floppy disk is set in the floppy disk drive, the shutter opens automatically, exposing part of the internal disk. Do
not touch (slide) the shutter.
Observe the following precautions:
(a) When the LED on the floppy disk drive is lit, never remove the floppy disk. If removed, the data on it could
be destroyed or the floppy disk drive could break.
(b) Do not touch the magnetic disk surface with a finger or any object.
(c) Do not leave floppy disks in a dusty or humid place.
(d) Do not place floppy disks near a magnetic object.
(e) Do not leave floppy disks in a place exposed to direct sunlight or near a heater.
(f) Store floppy disks in a place where the temperature is 4 to 53 °C and the humidity is 8 to 90 % (take measures
against condensation, as necessary).
2-11
Section 2 Preparations before Use
(2)
Write protect switch
A 3.5-inch floppy disk has a write protect tab so that its contents are not modified or deleted by mistake. To turn
ON write-protection, slide the write protect tab in the direction of the arrow as shown below. (If an attempt is
made to write data with write-protection on, an error will result.)
Fig. 2-2
(3)
Write protect switch of 3.5-inch floppy disk
Setting and removing a 3.5-inch floppy disk
To set a floppy disk in the floppy disk drive, insert it in the direction of the arrow with the top surface left until it
clicks.
To remove a floppy disk from the floppy disk drive, press the EJECT button. Make sure the LED is OFF before
removing the floppy disk.
EJECT button
Shift
Shift
7
8
9
BS
4
5
6
MHz
µsec
1
2
3
kHz
msec
mm
System
0
8
9
BS
4
5
6
MHz
µsec
1
2
3
kHz
msec
mm
•
+/–
System
•
+/–
sec
Enter m
0
Copy/Memory
Control
Copy
Fig. 2-3
sec
Enter m
Copy/Memory
Control
Save/
Recall
Front
2-12
7
Copy
Save/
Recall
Rear
Setting and removing a 3.5-inch floppy disk
LED lamp
2.5
2.5.2
Notes on Handling Storage Medium
Plug-in memory card (PMC)
This section explains the following points about the plug-in memory card. (hereafter called the PMC)
• Inserting in the slot in the main unit
• Handling notes
• Handling the cap
• Loading and replacing a battery
• Using the write protect switch
(1)
Inserting the PCM into the slot in the main unit
CAUTION
Inserting the PCM by force could damage the electrodes. Insert it properly as
shown below.
MS4630B
Network Analyzer
10Hz–300MHz
Channels
1
Menu
F1
Meas
Shift
Marker
2
Active
Marker
Format
Fctn
7
8
9
BS
4
5
6
MHz
µsec
1
2
3
kHz
msec
mm
•
+/–
Preset
F2
Measurement
Frequency
Span
F3
System
Avg
Remote
Sweep
Out/Input
0
sec
Enter m
F4
Calibration
Utility
Copy/Memory
Control
Limit
Local
F5
Cal
PTA
F6
Scale
Backlight Off
Battery
Busy
Display All
X→S
X–S
Filter
Resonator
Active
Trace
Probe
Source
Window Close
Outputs
Keyboard
PMC
Save/
Recall
Copy
Display
A
B
A (Opt B)
B
R
+12V
100mA
Inputs
TA
TB
Max +20dBm
Battery
Busy
PMC
PLUG-IN MEMORY CARD
1)
Hold the PMC with the surface marked
with a green triangle up.
2)
Holding the PMC horizontally, align the
triangle printed on the PMC with the
triangle printed on the front panel of
the main unit.
3)
Slowly insert the PMC straight into the
slot until it stops.
(PMC)
SRAM
Note:
Inserting the PCM by force could damage the connector.
Insert the PMC into the slot in the main unit properly as mentioned above.
2-13
Section 2 Preparations before Use
(2)
Notes on handling the PMC
(a) Do not subject the PMC to strong shock by dropping or bending it.
(b) Do not expose it to water.
(c) Do not expose it to high temperature, high humidity, or direct sunlight.
(d) Do not insert tweezers or the like into the PMC connector.
(e) Protect the PMC connector from dust.
(f) Do not insert any unspecified PMC into the PMC slot.
(g) 128-KB, 256-KB, and 512-KB plug-in memory cards are shipped with a battery that is not loaded. Load it
before use.
(h) Lives of batteries at room temperatures are listed below. When the battery has been used up, the data stored in
the PMC disappears. Replace the battery before it is used up. On the back of the PMC a “Battery replacement
schedule” section is provided. Immediately after loading a new battery, enter the scheduled battery replacement date in this section according to the table below.
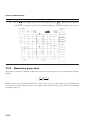
PMC形名
BS32F1-C-172
BS64F1-C-173
BS128F1-C-174
BS256F1-C-1175
BS512F1-C-1176
Memory
capacity
32 KB
64 KB
128 KB
256 KB
512 KB
Battery life
Battery
CAUTION
●電池寿命
(32Kバイト)
:約5年(常温)
About 5 years
About 5 years
About 4.3 years
About 2.2 years
About 1.1 years
Battery life:About 5 years
(at room temperature)
BR2325
●機器電源をONにして,
プラグイン状態で電池を交換して
ください。
Battery replacement must be done by inserting
the card into the instrument while the power is on.
●電池はBR2325を使用してください。
Use only BR2325 battery.
●強いショックを与えたり,
折り曲げないこと。
Do not drop or bend.
●高温高湿・直射日光にさらさないこと。
Do not expose to extreme temperature
or wetness.
Immediately after loading a new
battery, enter the scheduled battery replacement date in this section.
次回電池交換予定日
Battery replacement Schedure
Date :
ANRITSU CORP.
MADE IN JAPAN
When the red “Battery” lamp lights up, this indicates that the battery voltage is too low. Replace the battery as soon as
possible.
2-14
2.5
(3)
Notes on Handling Storage Medium
Handling the cap
The cap prevents the PMC from being inserted upside down or right side left. Usually, use the PMC with the cap attached.
However, remove the cap in the following cases:
•
When the shape of the PMC insertion slot in the main unit is as shown below:
Reference: The PMC with a cap can
be inserted into these slots.
PMC
PMC
PMC
PMC
•
The cap must be removed when replacing the battery.
C
A
U
TI
O
N
[Removing the cap]
The cap can be removed easily with its back (“CAUTION” is printed) up.
Cap
While raising the Cap slightly (up to the
position indicated by the dotted line),
slide it in the direction of the arrow.
Tab
2-15
Section 2 Preparations before Use
(4)
Loading and replacing a battery
■ Loading a battery initially (SRAM only)
Do not forget to load the enclosed lithium battery before using the PMC. When loading the battery, place the
PMC with its back (“CAUTION” is printed) up.
Remove the cap from the PMC.
2)
Unlock the battery holder and
draw out the battery holder.
3)
Put the battery in the battery
holder with the + mark up.
4)
Insert the battery holder into the
slot in the PMC, lock it, then
attach the cap.
Battery
C
A
U
TI
O
N
1)
Battery holder
LO
CK
Battery holder lock
LOCK
LOCK
UNLOCK
LOCK
Cap
■ Replacing the battery (SRAM only)
Replace the battery while the system is powered on and with the PMC set in the system.
If a battery is replaced while the system power is OFF or the PMC is removed from the system, the data stored
in the PMC could disappear.
Step
1
2
3
4
5
6
7
2-16
Operation
Have a lithium battery ready.
Turn ON the system.
Remove the cap from the PMC and insert the PMC into the PMC slot (align the green triangle with the
triangle on the front panel of the main unit).
Unlock the battery holder.
Draw out the battery holder and replace the battery with a new one.
Insert the battery holder into the PMC and lock the battery holder.
Remove the PMC from the slot and attach the cap.
2.5
Notes on Handling Storage Medium
1)
Turn ON the POWER switch.
2)
Insert the PMC as mentioned on page 2-13.
3)
Place your finger nail in the groove in the battery
holder and draw out the battery holder.
4)
Put a new battery (BR2325) in the battery holder
and insert the battery holder into the PMC.
PMC slot in main unit
LO
CK
PMC (Plug-in Memory Card)
Battery holder
Battery (BR2325)
(+ mark down)
■ Locking the battery holder
To lock the battery holder, slide the LOCK switch to the left using a ballpoint pen or the like.
LOCK Switch
LOCK
Battery holder
(5)
Using the write protect switch (SRAM only)
The write protect switch is factory-set at the OFF position. To turn ON write-protection, slide the write protect
switch to the ON position using a ballpoint pen or the like.
If write-protection can be turned ON by software, keep the write protect switch set at the OFF position.
Protedted
ON
PROTECT
Not Protected
ON
PROTECT
2-17
Section 2 Preparations before Use
2-18.
Section 3 Basic Operations
This section explains the basic operations of this network analyzer for operators who use it for the first time.
Note that this section covers only the basic operations which are necessary to quickly and easily check the status of the
basic operations and performance of this system.
For advanced operations, see Sections 4 and later.
3.1
3.2
3.3
3.4
3.5
3.6
3.7
Turning ON the Power ...............................................................
Displaying the Self-Test Result .................................................
Data Displayed on the Screen ...................................................
Presetting ..................................................................................
Symbols .....................................................................................
List of Soft Key Menu Functions ................................................
The Basics of Key Operations ...................................................
3.7.1 Hard keys (master keys) ................................................
3.7.2 Soft keys ........................................................................
3.7.3 Operation windows ........................................................
3.7.4 Operations to Perform in Windows ................................
3.7.5 Channels and Traces ....................................................
3-2
3-4
3-6
3-9
3-10
3-12
3-14
3-14
3-14
3-14
3-15
3-16
3-1
Section 3 Basic Operations
3.1
Turning ON the Power
Before turning ON the system, establish a protective ground according to Section 2.2 and then plug the enclosed power
cord into the wall outlet.
WARNING
Turning ON the power without establishing a protective ground could cause
electric shock which might result in severe injury or loss of life. If you do not
have a 3-pole (ground-type, 2-pole) wall outlet, be sure to connect the FG terminal on the rear panel or the ground terminal of the enclosed power cord to
the ground level before turning ON the system.
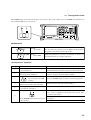
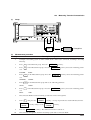
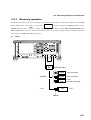
Std Osc
Ext
Input(5/10MHz)
(50Ω,≥7Vp-p)
Buffer
Output(10MHz)
(TTL Level)
Ext Trigger
(TTL Level)
Centronics
∼LINE Input 47.5-63HZ,150VA Max
100-240V
T 5.0A
RS232C
WARNING
CAUTION
∼LINE Input 47.5-63HZ,150VA Max
100-240V
T 6.3A
Module Bus
PTA I/O Port
RGB
Separate
Video
GPIB
SH1 AH1 T6 L4 SR1 RL1
PPO DC1 DT1 C1-4 C24 E2
Rear panel
Frame ground (FG) terminal: To prevent electric shock,
connect this terminal to the
ground level.
CAUTION
An abnormal AC supply voltage could damage the internal circuits.
Before turning ON the system, make sure that the AC supply voltage as specified (nominal value +10/–15 %, 250 V or lower).
3-2
3.1
Turning ON the Power
The POWER switch is located at the position shown below. The l and o marks above the POWER switch indicate the
power ON and OFF states, respectively.
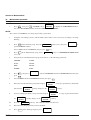
MS4630B
Network Analyzer
10Hz–300MHz
Channels
1
Menu
F1
Meas
Shift
Marker
2
Active
Marker
Format
Fctn
7
8
9
BS
4
5
6
MHz
µsec
1
2
3
kHz
msec
mm
•
+/–
Preset
F2
Measurement
Frequency
Span
F3
System
Avg
Remote
Sweep
Out/Input
0
sec
Enter m
F4
Calibration
Utility
Copy/Memory
Control
Limit
Local
F5
Cal
PTA
Scale
Backlight Off
Battery
Busy
Display All
X→S
A
F6
X–S
Filter
Resonator
Active
Trace
Probe
Source
Window Close
Outputs
PMC
Save/
Recall
Copy
Display
B
Keyboard
A (Opt B)
B
R
+12V
100mA
Inputs
TA
TB
Max +20dBm
Front panel
POWER switch
Power ON
When the pushbutton is pressed so that it is in the lowered position, the system is powered. Power is supplied to all circuits in
the system. The system is then ready for use.
Power OFF
When the pushbutton is pressed a second time so that it is in
the raised position, the system is turned off.
<Initial power-on sequence>
Step
1
2
3
4
5
Operation
Connect the FG terminal on the rear panel
to the ground level.
Measure the AC supply voltage at the wall
outlet using an AC voltmeter.
Set the POWER switch on
the front panel to the OFF
position.
Insert the jack at one end of the power
cord into the AC inlet on the rear panel.
Insert the plug at the other end of the power cord into the wall outlet.
6
Set the POWER switch on the front panel
to the l position.
Remarks
When you plug a 3-pole power cord with a ground terminal,
the FG terminal need not be connected to the ground level.
The measured value must be with +10/–15 % of the rated
voltage. In Japan, the rated voltage is 100 V.
Press the POWER switch so that it is in the raised position.
Insert the power cord jack as far as it will go.
Press the POWER switch so that it is in the lowered position. Power is supplied to all circuits in the system. The
system is ready for use.
The display goes on, showing the self-test result. (See the
next page.)
The fan on the rear panel starts rotating to expel hot air.
3-3
Section 3 Basic Operations
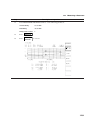
3.2
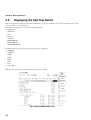
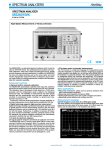
Displaying the Self-Test Result
This system performs a self-test on the internal hardware at power-on and displays the result on the display screen along
with the software version information.
The following modules are tested and the result is displayed:
• MAIN CPU
• DISP CPU
• DSP
• LOCAL
• OUTPUT
• RECEIVER (R)
• RECEIVER (TA)
• RECEIVER (TB/opt)
Information about the versions of the following software is displayed:
• OVERALL
• SYSTEM
• MAIN
• DISP
• MEAS
• DSP
• PTA
• PTA USER
Example: The output section is faulty and other sections are normal.
SELF TEST INFORMATION screen
3-4
3.2
NOTE:
1.
Displaying the Self-Test Result
If the self-test result shows any problem or nothing is displayed on the screen, contact Anritsu for repair.
The contact addresses and telephone numbers are given at the end of this manual.
When you contact Anritsu for repair, please provide the following information:
•
•
•
2.
Model and serial number indicated on the rear panel
Symptom
Name of the person in charge and telephone number
Turning on the power with the Preset key pressed down allows you to reset the backup data stored in the
internal memory to the settings on shipping.
If backup data has been destroyed due to an incidental problem and therefore the machine does not start
operating after power-on, following the above procedure may start the machine.
3-5
Section 3 Basic Operations
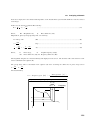
3.3
Data Displayed on the Screen
If the self-test result is OK, press the WINDOW CLOSE key on the front panel to close the SELF TEST INFORMATION
window and display an ordinary measurement screen.
Let’s take a look at the data displayed on the screen.
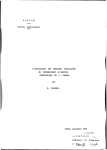
Example 1: Single channel measurement screen
1
Indicates that trace A of channel 1 is active and the frequency at the corresponding active marker point is 150.005
MHz.
2
Indicates that the active marker of trace A of channel 1 is active marker 0, that it is at the 250th point, and that the
value measured at this point (frequency) is –13.5915 dB.
3
Indicates that the active marker of trace B of channel 1 is active marker 0, that it is at the 250th point, and that the
value measured at this point (frequency) is –17.0609 deg.
4
The waveform display scale of trace A of channel 1 is calibrated in 10 dB and the line marked with ▲ indicates
–50.000 dB.
5
The waveform display scale of trace B of channel 1 is calibrated in 50 dB and the line marked with ▲ indicates
0.000 deg.
1
2
3
5
4
7
8
9
10
6
Measurement screen 1
6
Indicates that the start frequency is 10 kHz and the stop frequency is 300 MHz.
7
Indicates that a ratio computation (TA/R) is performed.
8
Indicates that the waveform of trace A of channel 1 indicates a logarithmic magnitude (MAG).
9
Indicates that the waveform of trace B of channel 1 indicates a phase (PHA).
10
Indicates that the resolution bandwidth is set automatically and the current setting is 20 kHz.
3-6
3.3
Data Displayed on the Screen
Example 2: Dual channel measurement screen
1
Indicates that trace A of channel 1 is active and the frequency at the corresponding active marker point is 150.005
MHz.
2
Indicates that the active marker of trace A of channel 1 is active marker 0, that it is at the 250th point, and that the
value measured at this point (frequency) is –0.0020 dB.
3
Indicates that the active marker of trace B of channel 1 is active marker 0, that it is at the 250th point, and that the
value measured at this point (frequency) is –72 ps.
4
The waveform display scale of trace A of channel 1 is calibrated in 10 dB and the line marked with ▲ indicates
–50.000 dB.
5
The waveform display scale of trace B of channel 1 is calibrated in 100 ns and the line marked with ▲ indicates
0.000 us.
6
Indicates that the start frequency of channel 1 is 10 kHz and the stop frequency is 300 MHz.
7
Indicates that a ratio computation (TA/R) is performed in channel 1.
8
Indicates that the waveform of trace A of channel 1 indicates a logarithmic magnitude (MAG).
9
Indicates that the waveform of trace B of channel 1 indicates a group delay (DLY).
10
Indicates that the resolution bandwidth of channel 1 is set automatically and the current setting is 20 kHz.
11
Indicates that calibration is performed in channel 1.
1
2 3
5
4
7
8
9
10
11
6
12
17
14
13
15
18
19
20
16
Measurement screen 2
3-7
Section 3 Basic Operations
12
Indicates that the active marker of trace A of channel 2 is active marker 0, that it is at the 250th point, and that the
value measured at this point (frequency) is –13.5819 dB.
13
Indicates that the active marker of trace B of channel 2 is active marker 0, that it is at the 250th point, and that the
value measured at this point (frequency) is –16.9570 ps.
14
The waveform display scale of trace A of channel 2 is calibrated in 10 dB and the line marked with ▲ indicates
–50.000 dB.
15
The waveform display scale of trace B of channel 2 is calibrated in 50 deg. and the line marked with ▲ indicates
0.000 us.
16
Indicates that the start frequency of channel 2 is 10 kHz and the stop frequency is 300 MHz.
17
Indicates that a ratio computation (TA/R) is performed in channel 2.
18
Indicates that the waveform of trace A of channel 2 indicates a logarithmic magnitude (MAG).
19
Indicates that the waveform of trace B of channel 2 indicates a group delay (DLY).
20
Indicates that the resolution bandwidth of channel 2 is set automatically and the current setting is 20 kHz.
3-8
3.4
3.4
Presetting
Presetting
Pressing the ( Preset ) key and selecting “Yes” from the soft key menu resets the measurement parameters of this system to
default values (see Appendix B), excluding the following parameters:
(1)
GPIB interface conditions
•
•
•
•
•
(2)
Printer/plotter parameters
•
•
•
•
(3)
Active Port
Copy Device
GPIB Address
Form Feed
Save/recall parameter
•
(4)
GPIB My Address
Control Function
Enable Register All
Terminator
Time Out
Drive
Other system parameters
•
•
•
Marker setting mode
Impedance measurement method
Screen color
Table 3-4
Preset
Yes
------
Function
Performs initialization.
NOTE:
Turning on the power with the Preset key pressed down allows you to reset the backup data stored in the internal
memory to the settings on shipping.
If backup data has been destroyed due to an incidental problem and therefore the machine does not start operating
after power-on, following the above procedure may start the machine.
3-9
Section 3 Basic Operations
3.5
Symbols
Symbol
0MKR
A
ADM
ADMT
AUTO
AVG
B
BS
CAL
CALC
CF
CH1
CH2
CNT
CONT
deg
DIR
DLY
EL
EXT
Fctn
FREQ
FREQ−TB
F1 to F6
GND
IL
IMAG
IMP
IMPD
ISLN
I/F
LEVEL−TB
LIN
LIN
LOG
LOGMAG
MAG
MAX
MEAS
MIN
MK
3-10
FULL
Zero Marker
Output A
Admitance
Admitance
Automatic Setting
Averaging for S/N Improvement
Output B
Back Space
Calibration
Calculate
Center Frequency
Channel 1
Channel 2
Center Frequency
Sweep Continue
Degree
Directry
Delay
Electric length
External
Function
Frequency
Frequency Table
Function Keys No.1 to 6
Ground
Insertion Loss
Imaginary part
Impedance
Impedance
Isolation
Interface
Level Table
Linear
Linear Magnitude
Logarithmic
Logarithmic Magnitude
Logarithmic Magnitude
Maximum
Measure
Minimum
Marker
3.5
Symbol
MKR
MP
MSG
MT
NWA
OFS
OSC
OSL
PHA
PMC
PARAM
PRMS
PTA
R
RB
RBW
RCL
REAL
REF
RESON
RESP
RPL
RSV
RTL
SEPA
SPAN
ST
STA
St d
STO
SWT
TA
TB
TRK
UNL
UNT
VSWR
ΔMKR
Symbols
FULL
Marker
Measurement Point
Message
Main Trace
Network Analyzer
Offset
Oscillator
Open-Short-Load
Phase
Plug-in Memory Card
Paramater
Paramaters
Personal Test Automation
Reference port
Resolution Bandwidth
Resolution Bandwidth
Recall
Real Part
Reference
Resonator
Response
Ripple
Request Service
Return to Local
Separated type Video Signal
Frequency Span
Sub Trace
Start Frequency
Standard
Stop Frequency
Sweep Time
Test Port A
Test Port B
Tracking
Unlisten
Untalk
Voltage Standing Wave Ratio
∆Marker
3-11
Section 3 Basic Operations
3.6
List of Soft Key Menu Functions
The following table lists the functions that can be performed by pressing soft keys (F1 to F6):
Panel key
Preset
Local
PTA
Menu
Meas
Format
Marker
Fctn
Frequency
Span
Avg
Major function
Initialization
Setting related
to GPIB
PTA function
Measurement
channel selection
Analysis port
selection
Analysis format
selection
Marker setting
Marker function
Center/start frequency setting
Span/stop frequency setting
Setting related
to S/N improvement
Sweep
Setting related
to sweep
Out/input
Setting related
to input/output
Cal
Scale
Trace
3-12
Soft key menu
YES
GPIB
←
RS232C
←
CH1
CH2
CH1&CH2
TA/R
TA
LOGMAG
POLAR
ON
TB/R
TB
PHASE
IMPD
CHART
SCROLL
TB/TA
R
DELAY
ADMT
CHART
OFF
NORMAL
ΔMKR
0MKR
MK→
MAX
MKR→
+PEAK
CENTER
MK→
MIN
MKR→
-PEAK
START
HARD
←COPY
No
MKR→
CF
TRK
+PEAK
LOG
START
STOP
LOG
STOP
SMOOTH- DELAY
ING
APERTURE
REPEAT
SINGLE
LIST
SWEEP
LIST
POWER
LIST
SWEEP
EDIT
setup
RANGETA
*****
RANGETB
*****
SPAN
AVERAGE
Setting related
to calibration
Display scale set- AUTO
ting
SCALE
SPLIT
Setting related
DISP
to display
SUB
TRACE
STOP
/CONT
LIST
SWEEP
GUARD
POWER
←SWEEP
RANGE-R
MAG&PHA MAG&DLY
VSWR
more
←
REF MKR COUPLED
No
MAKER
MKR
MKR
CHANGE
LIST
∆→SPAN
MK→
OFS
TRK
TRK OFF
-PEAK
RBW
SWEEP
TIME
*****
OUTPUT
A/B
INPUT
←IMPD
*****
SCALE
OFFSET
OFS LINE
STORAGE
OVER
WRITE
MT = ST
GRID
←
MT =
MT-ST
AVERAGE
FORMAT
←
setup
←
FULL/MKR
COUPLED
CHANNEL
etc
etc
etc
etc
etc
etc
etc
etc
etc
etc
etc
REF
IMPD
setup
←
EL
etc
CAL ON
DISPLAY
MT→ST
←ITEM
etc
etc
3.6
Panel key
Filter
Limit
Resonator
Major function
Filter analysis
function
Limit test setting
List of Soft Key Menu Functions
Soft key menu
ANALYSIS
LINE
ENTRY
←
ANALYSIS
Resonator analysis function
Hard copy setting GPIB
SETUP
←
LIMIT
TEST
SETUP
←
Control
RS232C
(Opt)
←
Save/Recall Saving/recalling INDEX RCL RECALL
setting
←
TEXT SAVE TITLE
←
←
System parameter USER
System
CLOCK
setting
←
PRESET
←
BEEP
RESON1
RESON2
SAVE
←
HARD
COPY
←
MANAGE
←
BIT MAP
←
DRIVE
←
etc
etc
OPTION
←
COLOR
←
SELF
TEST
←
3-13
Section 3 Basic Operations
3.7
The Basics of Key Operations
Three types of keys are used to operate the MS4630B Network Analyzer.
3.7.1
Hard keys (master keys)
Pressing hard keys (master keys) on the front panel performs the associated functions and displays a soft key menu.
Pressing marker keys and hard keys in the Measurement section allows you to enter numeric values such as measurement
conditions.
NOTE:
Usually, use numeric keys or the rotary knob to enter numeric values.
3.7.2
Soft keys
A soft key menu appears at the right of the LCD.
Pressing the soft key (F1 to F6) corresponding to a desired menu option performs the associated function.
NOTE:
When there are two or more menu pages, the top label of each menu page indicates a menu page number (e.g., 1/2).
Since the system has a menu learning function, pressing a hard key allows you to access the menu page that you
accessed most recently.
3.7.3
Operation windows
Keys for displaying windows.
Selecting a menu label containing “←” displays an operation window (hereafter simply called a window).
Setting items that are rarely changed and items that require you to select many parameters are displayed in these windows.
GPIB
Indicates that selecting this key displays a window.
3-14
3.7
3.7.4
(1)
The Basics of Key Operations
Operations to Perform in Windows
Selecting setting items
A reverse cursor appears in the window.
Move the reverse cursor to the setting item you want to change.
Reverse cursor
A character string or value displayed in reverse video can be changed now.
Move the reverse cursor to the setting item you want to change.
To move the reverse cursor, use the arrow keys below the rotary knob.
UP and DOWN arrow keys:
Move the reverse cursor to the preceding or next setting item.
LEFT and RIGHT arrow keys:
Moves the reverse cursor to the preceding or next option in a
setting item.
Indicates that this item is a setting item. To move the reverse cursor to another setting item use the UP and DOWN arrow
keys.
GPIB MY ADDRESS
:
[
1]
CONTROL FUNCTION:
1. DEVICE
2. CONTROLLER
ENABLE REGISTER ALL
1. OFF
2. ON
TERMINATER (for TALKER)
1. LF&EOI
2. CR/LF&EOI
TIME OUT
[
20 sec]
ACTIVE PORT for HARD COPY
1. GPIB
2. RS232C
3. CENTRONICS
To move the reverse cursor to another option in a setting item, use the LEFT and RIGHT arrow keys.
The underlined options are current choices.
(2)
Making a new setting take effect
1) Numeric value
Move the reverse cursor to a desired setting item, then enter a numeric value with numeric keys or rotary knob.
2) Option
Move the reverse cursor to a desired option, then press the Enter key or move the reverse cursor to another
option.
Only when an item is enclosed in < > can you move the cursor and make the choice take effect at the same time
by entering the item number using numeric keys.
When an item takes effect, it is underlined.
3-15
Section 3 Basic Operations
(3)
Closing a window
You can close a window by one of the following methods:
•
Press another hard key.
•
Press the
•
Move the reverse cursor to the upper right corner of the window and press the Enter key.
(If the window is in a deep layer, the window in a layer which is one layer shallower than the current will
appear.)
3.7.5
Window Close
under the soft key.
Channels and Traces
This system has two measurement channels: channel 1 (CH1) and channel 2 (CH2).
“Channel” refers to a set of internal hardware resources necessary for performing measurements. For example, settings of
a measurement frequency and an analysis port are included in the settings of a channel. Since there are two channels, two
measurements can be performed using one measuring device. *1
One channel has two traces: trace A (TR_A) and trace B (TR_B).
“Trace” refers to the displayed result of measurement performed in a channel. Two traces appear only when a measurement result is displayed with respect to two parameters such as “magnitude” and “phase,” allowing you to make various
settings for each trace.
For example, a marker setting is included in a trace setting.
As stated above, this system allows you to obtain a maximum of four traces for two channels. *2
NOTE:
*1
*2
3-16 .
When a channel contains only one hardware resource, two measurements cannot be performed at the same
time. They must be performed one at a time (e.g., frequency, then output level).
However, the limit test function may come under certain restrictions (See 6.3.1).
Section 4
Selecting Measurement Items (Channels Group)
This section explains how to operate keys for selecting measurement items. These keys are in the Channels section on the
front panel.
MS4630B
Channels
Network Analyzer
10Hz–300MHz
Channels
1
F1
Meas
Shift
Marker
2
Menu
Active
Marker
Format
Fctn
1
7
8
9
BS
4
5
6
MHz
µsec
1
2
kHz
msec
mm
2
Preset
F2
Measurement
Frequency
Span
F3
3
System
Avg
Remote
Sweep
Out/Input
0
•
+/–
sec
Enter m
Menu
Active
Meas
Format
F4
Calibration
Utility
Copy/Memory
Control
Limit
Local
F5
Cal
PTA
X→S
A
F6
Backlight Off
Display All
Filter
Resonator
Copy
Display
B
Scale
Battery
Busy
X–S
Active
Trace
Probe
Source
Window Close
Outputs
Keyboard
PMC
Save/
Recall
A (Opt B)
B
R
+12V
100mA
Inputs
TA
TB
Max +20dBm
Front panel
Major functions
• Measurement channels (CH1, CH2)
•
Selection of active channel
•
Setting of analysis port
•
Selection of analysis (display) format
4.1
4.2
4.3
4.4
Selecting a Measurement Channel (Menu) ...............................
4.1.1 Selecting a measurement channel ................................
4.1.2 Coupled Channel ...........................................................
Active Channel (Active) .............................................................
Selecting an Analysis Port (Meas) ............................................
4.3.1 Measuring a ratio (TA/R, TB/R, TB/TA) .........................
4.3.2 Measuring a level (TA, TB, R) .......................................
4.3.3 Notes on level measurement .........................................
Selecting Measurement Items (Format) ....................................
4.4.1 Selecting an analysis format ..........................................
4.4.2 Selecting an impedance marker display mode ..............
4.4.3 Selecting an admittance marker display mode ..............
4.4.4 Phase offset ...................................................................
4-2
4-2
4-3
4-4
4-4
4-4
4-5
4-5
4-6
4-6
4-7
4-8
4-8
4-1
Section 4 Selecting Measurement Items (Channels Group)
4.1
Selecting a Measurement Channel (Menu)
Menu
Set a measurement channel.
MENU
CH1
CH2
CH1&CH2
--COUPLED
CHANNEL
4.1.1
Press the
4-2
Description of function
Selects CH1 as a measurement channel.
Selects CH2 as a measurement channel.
Selects CH1 and CH2 as measurement channels (Dual channel measurement.)
Couples measurement conditions of CH1 and CH2 (when set ON.)
Selecting a measurement channel
Menu
key and select a measurement channel from the soft key menu.
4.1
4.1.2
Selecting a Measurement Channel (Menu)
Coupled Channel
Press the Menu key and select a channel coupling mode from the soft key menu “COUPLED CHANNEL.” When the
channels are coupled, setting an interlinked item for the channel in the active status will also result in setting of the same
item for the channel in the non-active status. The table below shows the setup items which can be interlinked by this
function by key group.
Channels group
Measurement group
Display group
Calibration group
Utility group
Analysis port
Analysis format
Phase offset
Frequency
Output level
Power sweep
Input range
Input impedance
Averaging
RBW
Smoothing
Delay aperture
Sweep time
Sweep control
Marker sweep
Number of measurement points
Break point
Active trace
Electrical length
Sub-trace
CAL ON/OFF
CAL element data fetching start
Normalize ON/OFF
Start of fetching of the reference data for
normalization
Filter analysis function
Resonator analysis function
The Marker, Copy & Memory and System groups have no target functions.
4-3
Section 4 Selecting Measurement Items (Channels Group)
4.2
Active Channel (Active)
Select an active channel using the “Active” key
1
2
Select an active channel whose settings (measurement conditions, etc.) are effective.
Active
Single channel (CH1 or CH2)
B
A
Pressing the
Active
key toggles between CH1 and CH2.
Dual channel (CH1 and CH2)
A
Pressing the
B
Active
key selects a channel (active channel) whose settings (measurement conditions, etc.) are effec-
tive.
NOTE:
A channel whose settings (measurement conditions, etc.) are effective is called an active channel. The lamp lit
A
above the
4.3
Press the
4.3.1
Meas
B
Active
key indicates the active channel.
Selecting an Analysis Port (Meas)
Meas
key and select an analysis port from the soft key menu.
Measuring a ratio (TA/R, TB/R, TB/TA)
Select an analysis port.
Meas
Select an analysis port.
MEAS (1/2)
TA/R
TB/R
TB/TA
--etc.
4-4
Description of function
Measures the ratio (TA/R) of the signal input to input port R to the signal input to input port TA.
Measures the ratio (TB/R) of the signal input to input port R to the signal input to input port TB.
Measures the ratio (TB/TA) of the signal input to input port TA to the signal input to input port TB.
Switches to the next menu.
4.3
4.3.2
Selecting an Analysis Port (Meas)
Measuring a level (TA, TB, R)
MEAS (2/2)
TA
TB
R
--etc.
Description of function
Measures the level of the signal input to input port TA.
Measures the level of the signal input to input port TB.
Measures the level of the signal input to input port R.
Returns to the previous menu.
NOTE:
The input port TB is an optional unit.
When this unit is not installed, setting related to input port TB cannot be made.
The setting of analysis format and display scale can be made independently for each analysis port selected.
4.3.3
Notes on level measurement
When TA, TB, or R is selected, meaningful waveform data is not displayed if an analysis format other than LOGMAG
and LINMAG is selected.
The phase of signal is not measured on the level measurement, then the function which needs the phase information
(Averaging and CAL except Normalize) is not operated.
4-5
Section 4 Selecting Measurement Items (Channels Group)
4.4
Selecting Measurement Items (Format)
Press the
4.4.1
Press the
(1)
Format
key to select measurement items from the soft key menu.
Selecting an analysis format
Format
key to select measurement items from the soft key menu and MORE window.
Selection using the soft key menu.
Format
Select an analysis (display) format.
Format (1/2)
LOG MAG
PHASE
DELAY
MAG & PHA
MAG & DLY
etc.
Format (2/2)
POLAR
IMPD CHART
ADMT CHART
VSWR
more
etc.
Description of function (unit)
Displays the analysis result with a logarithmic magnitude. (dB)
Displays the analysis result with a phase. (deg)
Displays the analysis result with a group delay. (sec)
Displays the analysis result with a logarithmic magnitude and phase. (dB), (deg)
Displays the analysis result with a logarithmic magnitude and group delay. (dB), (sec)
Switches to the next menu.
Description of function (unit)
Displays the analysis result with a polar chart (polar coordinates). (unit less number)∠(deg)
Displays the analysis result with an impedance chart.
Displays the analysis result with an admittance chart.
Displays the analysis result with VSWR. (unit less number)
Displays the window for selecting another format.
Returns to the previous menu.
NOTE :
• For the unit of measure of marker display values, see IMPD MKR FORMAT and ADMT MKR FORMAT.
The same waveform as that of the POLAR format is displayed.
• No correct measurement result can be obtained for the analysis format of group delay with the horizontal axis
being the logarithm frequency (LOG).
4-6
4.4
(2)
Selecting Measurement Items (Format)
Selection using the window.
Select other analysis format.
key
Effective key: Ten-key, rotary knob
-MORE- WINDOW
FORMAT:
01.<LIN MAG>
Displays the linear magnitude (unit less number).
02.<LIN & PHA>
Displays both the linear magnitude and phase (unit less number), (deg).
03.<LIN & DLY>
Displays both the linear magnitude and group delay (unit less number), (sec).
04.<REAL>
Displays the real number component (unit less number).
05.<IMAG>
Displays the imaginary number component (unit less number).
06.<REAL & IMAG>
Displays the real and imaginary number components (unit less number), (unit
less number).
07.<LOGZ>
Displays the impedance in logarithm (Ω).
08.<LOGZ & θ>
Displays the impedance and impedance phase (Ω), (deg).
09.<Q>
Displays Q (unit less number).
10.<LOGZ & Q>
Displays the impedance in logarithm and Q (Ω), (unit less number).
IMPD MKR FORMAT for IMPD CHART:
ADMT MKR FORMAT for ADMT HART:
PHASE OFFSET:
Note:
Enter two-digit numeric to make a selection using the ten-key.
Example) Enter “0” and “7” to select LOG Z.
Pressing the Enter key is not required when using the ten-key for data entry.
4.4.2
Selecting an impedance marker display mode
When the analysis format is “IMPD CHART”, set the display mode of the marker value.
Effective key: Rotary knob
key
MORE- WINDOW
FORMAT~
IMPD MKR FORMAT for IMPD CHART:
Z∠θ:
The absolute value and phase angle of impedance
Rs/Ls, Cs:
Equivalent series resistance and equivalent series inductance, or equivalent
series capacity
Q/D:
Q and tan δ of the resonance circuit
ADMT MKR FORMAT for ADMT CHART:~
PHASE OFFSET:~
4-7
Section 4 Selecting Measurement Items (Channels Group)
4.4.3
Selecting an admittance marker display mode
When the analysis format is “ADMT CHART”, set the display mode of the marker value.
Effective key: Rotary knob
key
-MORE- WINDOW
FORMAT~
IMPD MKR FORMAT for IMPD CHART:~
ADMT MKR FORMAT for ADMT CHART:
Y∠θ:
The absolute value and phase angle of admittance
Rp/Lp, Cp:
Equivalent parallel resistance and equivalent parallel inductance, or
equivalent parallel capacity
Q/D:
Q and tan δ of the resonance circuit
PHASE OFFSET:~
4.4.4
Press the
Phase offset
Format
key and set an offset value in the MORE window.
Effective key: Ten-key, rotary knob
-MORE- WINDOW
FORMAT~
IMPD MKR FORMAT for IMPD CHART:~
ADMT MKR FORMAT for ADMT CHART:~
PHASE OFFSET:
When the format is “PHASE” or the impedance phase is “θ,” set a phase
offset.
Setting range:
±180 deg
4-8 .
Section 5 Selecting Measurement Parameters
(Measurement Group)
This section explains how to select measurement parameters.
MS4630B
Network Analyzer
10Hz–300MHz
Channels
1
Menu
F1
Meas
Measurement
Shift
Marker
2
Active
Format
Marker
Fctn
7
8
9
BS
4
5
6
MHz
µsec
1
2
3
kHz
msec
mm
Preset
F2
Measurement
Frequency
Span
F3
Frequency
Span
System
Avg
Remote
Sweep
Out/Input
0
•
+/–
sec
Enter m
F4
Calibration
Utility
Copy/Memory
Control
Limit
Local
F5
Cal
PTA
Scale
Backlight Off
Battery
Busy
Display All
X→S
A
F6
X–S
Filter
Resonator
Active
Trace
Probe
Source
Window Close
Outputs
PMC
Save/
Recall
Copy
Display
B
Keyboard
A (Opt B)
B
R
+12V
100mA
Inputs
TA
TB
Avg
Sweep
Out/Input
Max +20dBm
Front panel
Major functions
• Frequency setting
• Averaging, smoothing, resolution bandwidth, and delay aperture setting
• Setting of sweep control, sweep time, number of sweep points, list sweep
• Setting of input range and impedance
• Setting of output power and power sweep
5.1
5.2
5.3
5.4
Setting a Frequency (Frequency, Span) ...................................
Settings Related to Input/Output (Out/Input) .............................
5.2.1 Output level....................................................................
5.2.2 Switching between output ports A and B .......................
5.2.3 Power sweep .................................................................
5.2.4 Input range ....................................................................
5.2.5 Input impedance ............................................................
5.2.6 Reference impedance ...................................................
Improving the S/N Ratio and Setting an Delay Aperture
(Group Delay Measurement) (Avg) ...........................................
5.3.1 Averaging ......................................................................
5.3.2 RBW ..............................................................................
5.3.3 Smoothing......................................................................
5.3.4 Delay aperture ...............................................................
Settings Related to Sweep ........................................................
5.4.1 Sweep time ....................................................................
5.4.2 Sweep control ................................................................
5.4.3 Number of measurement points ....................................
5.4.4 Breakpoints ....................................................................
5.4.5 Sweep by external trigger ..............................................
5.4.6 List sweep ......................................................................
5.4.7 Marker sweep ................................................................
5-2
5-3
5-3
5-4
5-4
5-5
5-5
5-6
5-7
5-7
5-8
5-8
5-9
5-10
5-10
5-10
5-11
5-11
5-12
5-13
5-19
5-1
Section 5 Selecting Measurement Parameters (Measurement Group)
5.1
Setting a Frequency (Frequency, Span)
Set a measurement frequency using the
Effective key: Ten-key, rotary knob
Frequency
Frequency
and
Span
keys.
Set a center or start frequency.
FREQ
CENTER
START
LOG START
Description of function
Selects the center span setting mode, allowing you to set a center frequency.
(0 to 300 MHz)
Selects the start-stop setting mode, allowing you to set a start frequency.
(0 to 300 MHz)
Selects the log frequency setting mode, allowing you to set a log start frequency. *1
----
Span
Set a frequency span or stop frequency.
SPAN
SPAN
STOP
LOG STOP
Description of function
Selects the center span setting mode, allowing you to set a frequency span.
(0 to 300 MHz)
Selects the start-stop setting mode, allowing you to set a stop frequency.
(0 to 300 MHz)
Selects the log frequency setting mode, allowing you to set a log stop frequency. *1
----
NOTE:
*1
5-2
In the log frequency setting mode, frequencies that can be set are 10 Hz, 100 Hz, 1 kHz, 10 kHz, 100 kHz,
1 MHz, 10 MHz, 100 MHz, and 300 MHz.
A frequency range can be set independently for each setting mode.
5.2
5.2
Settings Related to Input/Output (Out/Input)
Press the
Out/Input
key and make input-/output-related settings using the soft key menu and window.
Out/Input
Set an output power level and input range.
5.2.1
(1)
Settings Related to Input/Output (Out/Input)
Output level
Setting of the output level
Use the soft key menu shown below to set the output level.
Effective key: Ten-key, rotary knob
OUTPUT (1/2)
POWER
setup
POWER
SWEEP
OUTPUT A/B
-etc.
Function Detail
Enables setting of the output level. *1
Switches the display to the next menu.
NOTE:
*1 The output level depends on the output level related setting shown below. See NOTE 1 of 5.2.1 (2).
(2)
Output level related setting
Use the soft key menu or the window shown below to execute the output level related setting.
Effective key: Ten-key, rotary knob
OUTPUT (1/2)
POWER
setup
POWER
SWEEP
OUTPUT A/B
-etc.
Function Detail
Displays the window to exevute other output level related setting. *1
Switches the display to the next menu.
-OUTPUT PWR SETUP- WINDOW
SOURCE POWER:
Allows you to set the internal signal source level. (0 to +21 dBm)
OUTPUT ATT:
Allows you to set the attenuation of the output attenuator (optional unit).
This is not displayed when no optional unit is installed.
OFFSET:
Allows you to set the apparent offset of the output power.
The actual output power does not change.
5-3
Section 5 Selecting Measurement Parameters (Measurement Group)
NOTE:
*1 •
•
5.2.2
Press the
The relationship among the above values can be expressed as follows (when output port A is selected):
Output power = (Source power) – (Output attenuation) + (Offset)
When output port B (2-branch output) is selected, 6 dB is subtracted from the output power. When output
port B (3-branch output : option 14) is selected, 9.5 dB is subtracted from the output power.
When the output attenuator (optional unit) is not installed, the output attenuation is assumed to be 0 dB.
Switching between output ports A and B
Out/Input
key and select OUTPUT A/B from the following soft key menu to switch between output ports A and B:
OUTPUT (1/2)
POWER
setup
POWER
SWEEP
OUTPUT A/B
-etc.
5.2.3
Description of function
Allows you to switch between output ports A and B (branch outputs) on the front panel.
Switches to the next menu.
Power sweep
Press the Out/Input key and select POWER SWEEP from the following window:
Effective key: Ten-key, rotary knob
OUTPUT (1/2)
POWER
setup
POWER
SWEEP
OUTPUT A/B
-etc.
Description of function
Displays the window for setting power sweep.
Switches to the next menu.
-POWER SWEEP- WINDOW
POWER SWEEP:
Turns ON/OFF power sweep.
START POWER:
Allows you to set the output power at the sweep start frequency.
END POWER:
Allows you to set the output power at the sweep stop frequency.
STEP:
Allows you to set an output power change step.
The start power changes to the stop power in specified steps.
5-4
5.2
Settings Related to Input/Output (Out/Input)
STOP POWER
STEP
START POWER
5.2.4
Input range
Press the Out/Input key and make the settings related to the input range using the following soft key menu and window.
Effective key: Ten-key, rotary knob
INPUT (2/2)
RANGE-TA
RANGE-TB
RANGE-R
INPUT IMPD
REF IMPD
etc.
Description of function
Allows you to set the input range of input port TA. (0/+20 dBm) *1
Allows you to set the input range of input port TB. (0/+20 dBm) *1
Allows you to set the input range of input port R. (0/+20 dBm) *1
Returns to the previous menu.
NOTE:
Input port TB is an optional unit. When it is not installed, settings related to input port TB cannot be made.
*1 Input impedance is 1 MΩ, use 0 dBm range.
5.2.5
Input impedance
Press the Out/Input key and set an input impedance using the following soft key menu and window:
Effective key: Ten-key, rotary knob
key
INPUT (2/2)
RANGE-TA
RANGE-TB
RANGE-R
INPUT IMPD
REF IMPD
etc.
Description of function
Displays the window for setting an input impedance.
Returns to the previous menu.
-INPUT IMPEDANCE- WINDOW
IMPEDANCE(TA)
IMPEDANCE(TB)
IMPEDANCE(R)
Set the input impedance of each input port to 50/75 Ω or 1 MΩ.
The 75 Ω input requires a conversion adapter (MA4605A).
5-5
Section 5 Selecting Measurement Parameters (Measurement Group)
5.2.6
Reference impedance
Press the Out/Input key and select REF IMPD from the following soft key menu to set the reference impedance:
Effective key: Ten-key, rotary knob
INPUT (2/2)
RANGE-TA
RANGE-TB
RANGE-R
INPUT IMPD
REF IMPD
etc.
5-6
Description of function
Allows you to set a reference impedance. (0.1 to 10000.0 Ω)
Returns to the previous menu.
5.3 Improving the S/N Ratio and Setting an Delay Aperture (Group Delay Measurement)(Avg)
5.3
Press
Improving the S/N Ratio and Setting an Delay
Aperture (Group Delay Measurement) (Avg)
Avg
key and make settings using the following soft key menu and window:
Avg
Set averaging, smoothing, delay, aperture, and resolution bandwidth.
5.3.1
Press the
Averaging
Avg
key and make averaging-related settings using the following soft key menu and window:
(1)
Set the frequency of sweep required to exevute the averaging process.
Effective key: Ten-key, rotary knob
AVG
AVERAGE No
SMOOTHING
DELAY
APERTURE
RBW
AVERAGE
FORMAT
--
(2)
Description of function
Allows you to set a number of sweeps to be performed for averagingn (1 to 1000.)
Displays the window for setting an averaging type.
Set the type of the averaging process.
Effective key: Ten-key, rotary knob
key
-AVG FORMAT- WINDOW
AVERAGE TYPE
SUM:
Averages measured points for each sweep. *1
MAX:
Holds the maximum measured point. (MAX HOLD) *2
MIN:
Holds the minimum measured point. (MIN HOLD) *2
NOTE:
*1
*2
Real parts and imaginary parts of measured values as vector quantity are averaged as many times as the
number of measurement to get real part data and imaginary part data.
When the analysis port is TA, TB, or R (level measurement), the signal phase cannot be measured properly,
resulting in an indefinite average and abnormal operation.
The measured value whose absolute value is maximum (minimum) is used as a vector quantity.
Normal operation is assured if the analysis port is TA, TB, or R (level measurement).
5-7
Section 5 Selecting Measurement Parameters (Measurement Group)
5.3.2
RBW
Set the resolution bandwidth.
Effective key: Ten-key, rotary knob
AVG
AVERAGE No
SMOOTHING
DELAY
APERTURE
RBW
AVERAGE FORMAT
--
Description of function
Allows you to set a resolution bandwidth. *1
NOTE:
*1 One of the following values can be set for “RBW”:
3 Hz, 10 Hz, 30 Hz, 100 Hz, 300Hz, 500 Hz, 1 kHz, 2 kHz, 3 kHz, 4 kHz, 5 kHz, 10 kHz, 20 kHz, and AUTO
In the RBW auto-setting mode, the measurable minimum resolution bandwidth is automatically selected according to the current sweep time.
To automatically set the RBW, type [0] and [Enter].
5.3.3
Smoothing
Execute the moving average process required to smooth the waveform.
Effective key: Ten-key, rotary knob
AVG
AVERAGE No
SMOOTHING
DELAY
APERTURE
RBW
AVERAGE FORMAT
--
Description of function
Performs moving averaging for smoothing waveforms (0 to 50%.)
NOTE:
The measurement result around the start and stop frequencies, for which the moving averaging process cannot be
performed, is displayed as invalid data.
The invalid data is usually displayed at the bottom of the screen.
However, if the analysis format is POLAR, IMPD CHART, or ADMT CHART, the invalid data is displayed at the
center of a circle.
5-8
5.3 Improving the S/N Ratio and Setting an Delay Aperture (Group Delay Measurement)(Avg)
5.3.4
Delay aperture
Set the aperture for the group delay measurement.
Effective key: Ten-key, rotary knob
AVG
AVERAGE No
SMOOTHING
DELAY
APERTURE
RBW
AVERAGE
FORMAT
--
Description of function
Allows you to set an aperture for delay (group) delay measurement. *1
NOTE:
*1 Specify an aperture with a ratio (%) to the frequency span. The setting range is from 0.2 % to 20 %. The
minimum value and resolution depend on the following expression:
Minimum value and resolution = 2/(Number of measure points) *100 (%)
NOTE:
The group delay measurement is calculated using the measurement data obtained at the two measurement points
specified in the delay aperture parameter.
Therefore, the measurement result is displayed only for frequencies at which these two measurement points can
co-exist. Since this condition is not met around the start and stop frequencies, the result is displayed as invalid
data.
This invalid data becomes the minimum value of the measurement data.
5-9
Section 5 Selecting Measurement Parameters (Measurement Group)
5.4
Press the
Settings Related to Sweep
Sweep
key and make settings related to sweep using the displayed soft key menus and windows.
Sweep
5.4.1
Set sweep control, sweep time, and the number of sweep points.
Sweep time
Press the Sweep key and select SWEEP TIME from the soft key menu to set a sweep time.
Effective key: Ten-key, rotary knob
SWEEP (1/2)
REPEAT
SINGLE
STOP/CONT
SWEEP TIME
setup
etc
•
Description of function
Allows you to set a sweep time (0 to 27.5 hours.)
To specify “AUTO” for “SWEEP TIME,” enter 0 (sec).
When AUTO is specified for “SWEEP TIME,” the fastest sweep time is automatically set according to the current
RBW, number of sweep points, and number of traces.
5.4.2
Press the
Sweep control
Sweep
key and make settings related to sweep control using the displayed soft key menu and window.
SWEEP (1/2)
REPEAT
SINGLE
STOP/CONT
SWEEP TIME
setup
etc
5-10
Description of function
Sweeps repetitively.
Sweeps only once.
Stops (STOP) or restarts (CONT) sweeping.
5.4
5.4.3
Settings Related to Sweep
Number of measurement points
Press the Sweep key and specify a number of measurement points using the displayed soft key menu and window.
Effective key: Ten-key, rotary knob
SWEEP (1/2)
REPEAT
SINGLE
STOP/CONT
SWEEP TIME
setup
etc
Description of function
Displays the window for setting sweep control parameters.
-SETUP- WINDOW
MEASURE POINTS:
Set the number of measure points. Specify one of 11, 21, 51, 101, 251, 501,
and 1001.
BREAK POINTS:
~
TRIGGER SOURCE:
~
EXT TRIGGER:
~
EXT TRIGGER SLOPE:
~
5.4.4
Breakpoints
Press the Sweep key and make sweep-related settings using the displayed soft key menu and window.
Effective key: Ten-key, rotary knob
SWEEP (1/2)
REPEAT
SINGLE
STOP/CONT
SWEEP TIME
setup
etc
Description of function
Displays the window for setting sweep control parameters.
-SETUP- WINDOW
MEASURE POINTS:
~
BREAK POINTS:
Set the number of points at which sweep is interrupted. (1 to 1001)
TRIGGER SOURCE:
~
EXT TRIGGER:
~
EXT TRIGGER SLOPE:
~
5-11
Section 5 Selecting Measurement Parameters (Measurement Group)
5.4.5
Press the
Sweep by external trigger
Sweep
key and make sweep-related settings using the displayed soft key menu and window.
Effective key: Ten-key, rotary knob
SWEEP (1/2)
REPEAT
SINGLE
STOP/CONT
SWEEP TIME
setup
etc
key
Description of function
Displays the window for setting sweep control parameters.
-SETUP- WINDOW
MEASURE POINTS:
~
BREAK POINTS:
~
TRIGGER SOURCE:
Specify an event (trigger) that causes sweep to start.
When an internal trigger is specified, the next sweep is started by an event
that occurs in the system. When an external trigger is specified, the next
sweep is started by the control signal input to the EXT TRIG IN terminal.
EXT TRIGGER:
Specify a type of sweep started by an external trigger.
NORMAL:
Sweeps only once when an event is caused by the control signal.
STEP:
Measures one point when an event is caused by the control signal.
STATE:
Stops or restarts sweep according to the state of the control signal.
Low level input: Stop High level input: Restart
EXT TRIGGER SLOPE:
Specify an edge (leading or trailing) of the control signal that causes an
event.
5-12
5.4
5.4.6
Settings Related to Sweep
List sweep
What is list sweep?
The device stores in itself the measurement conditions corresponding to the measurement points on the frequency axis
(horizontal axis) in the measurement screen, as data tables. In the actual sweep measurement, the device refers to the data
in these tables to set the conditions.
There are the following four types of data tables that store such measurement conditions:
•
•
•
•
Frequency data table
Level data table (used at the time of power sweep)
RBW data table
User wait data table
NOTE:
These data tables exist independently for each measurement channel.
If both measurement channels are to be used in the same measurement conditions, i.e., if the coupled channel
function is turned ON, only the data tables for the active channel are used for the measurement.
If a measurement parameter is changed, a value calculated inside the device according to the value of the said measurement parameter is reflected in these data tables.
If, for example, a frequency parameter such as the center frequency or the frequency span is set, a calculation is carried
out based on these frequency parameters to equalize the frequency intervals between the measurement points in the case
of linear sweep, the result of which is reflected at each point in the frequency data table.
Thus, changing the measurement parameters normally creates these data tables. However, regardless of the values of
these measurement parameters, you can change the measurement condition at any given point in a data table to carry out
the measurement.
List sweep refers to sweeping according to a condition that a user has arbitrarily set for each measurement point by
changing the said condition data in a data table.
The user does not need to set whether list sweep is done or not.
Modifying, changing, and registering data in the data table edit screen (LIST SWEEP EDIT menu) will cause the sweep
to be performed using the new measurement conditions in the next measurement.
These data tables can be saved to or recalled as files from auxiliary storage media such as floppy disks, internal memory,
and memory cards.
5-13
Section 5 Selecting Measurement Parameters (Measurement Group)
The following explains the details of measurement condition data tables.
(1)
Frequency data table
A frequency data table stores the data of measurement frequencies corresponding to each measurement point (Xaxis).
Normally, when a measurement parameter related to frequencies such as the center frequency or the frequency
span is set, the data for all the measurement points at that time is automatically created inside the device.
(2)
Level data table
A level data table stores the data of output power corresponding to each measurement point (Y-axis).
The data in this table is used to carry out power sweep.
Normally, when a measurement parameter related to the power sweep function is set, the data for all the measurement points at that time is automatically created inside the device.
(3)
RBW data table
A RBW data table stores the RBW values corresponding to each measurement point.
Normally, when a measurement parameter such as RBW and the sweep time is set, the data for all the measurement points at that time is automatically created based on the same RBW value.
(4)
User wait table
A user wait table stores the user wait time corresponding to each measurement point.
Normally, when a measurement parameter such as the sweep time and RBW is set, the wait time elapsing between
switching the measurement frequency at each measurement point and starting the measurement is set as the same
value for between all the measurement points.
The user wait function allows you to set any additional wait time for any given point in addition to the preset wait
time.
All the initial values of the user wait time are set to 0 seconds.
NOTE:
Changing a measurement parameter automatically updates the contents of these data tables that generally store the
measurement conditions. Therefore, changing a data table for the purpose of list sweep and then setting a related
measurement parameter again will update the data tables.
To prevent these tables from being updated when a measurement parameter is set, use the F3: LIST SWEEP
GUARD function in the SWEEP (2/2) menu.
5-14
5.4
SWEEP (2/2)
LIST SWEEP
LIST
LIST SWEEP
EDIT
LIST SWEEP
GUARD
-FULL/MKR
etc.
Settings Related to Sweep
Description of function
Displays the contents of tables of measurement conditions for list sweep in a list.
Returns to the previous menu.
-LIST SWEEP LIST- WINDOW
<< LIST SWEEP TABLE (CH*) >>
Point
Frequency
RBW
User Wait
POWER
0
10.000 000kHz
20kHz
0us
**********
1
20.000 000kHz
20kHz
0us
**********
2
30.000 000kHz
20kHz
0us
**********
•
•
•
•
•
•
•
•
•
•
•
•
•
•
•
Description of display contents
The measurement condition tables for list sweep are displayed in a list for each measurement point number.
Point:
Indicates the measurement point number on the frequency axis in the measurement screen. The leftmost point of the
screen represents Point 0. The rightmost point of the screen represents (the number of measurement points - 1).
To check the number of measurement points, press the F5: Setup key in the SWEEP (1/2) menu to open a window.
The initial value of the number of measurement points is 501.
Frequency:
Indicates the measurement frequency corresponding to each measurement point.
RBW:
Indicates the RBW (resolution bandwidth) corresponding to each measurement point.
User Wait:
Indicates the user wait time corresponding to each measurement point.
5-15
Section 5 Selecting Measurement Parameters (Measurement Group)
Power:
Indicates the output power corresponding to each measurement point.
This item is used if the power sweep function is turned ON. Otherwise, this item indicates ******** and cannot be
changed.
Description of operation
The list screen, when brought up, shows the data entry area, “LIST CURRENT POINT:” (in which a numeric value can
be entered) at the bottom.
This data entry area shows the current point (the measurement point number at which the measurement conditions can be
changed).
The current point also matches the measurement point number enclosed inside a square
in the list screen.
Use the data knob, Up/Down keys, and ten-key pad to change the current point. Then, the indication in the list screen
changes according to this change.
The current point may be set in the range from 0 through 1000.
5-16
5.4
SWEEP (2/2)
LIST SWEEP
LIST
LIST SWEEP
EDIT
LIST SWEEP
GUARD
-FULL/MKR
etc.
Settings Related to Sweep
Description of function
Brings up a window to change the contents of tables of measurement conditions
for list sweep.
Returns to the previous menu.
-LIST SWEEP EDIT- WINDOW
POINT:
Sets the current point.
CURRENT FREQUENCY:
Registers the frequency at the current point.
STEP:
Adds the frequency set in this item (the increment) to the frequency at the
current point, and registers it as the frequency at the next point.
The frequencies up to the one shown in the “END” item below can be repetitiously registered in the same way. (NOTE 1)
END:
Specifies the last frequency in the repetitious registration described above.
RBW:
Registers the RBW at the current point.
The RBW is not automatically specified.
USER WAIT:
Registers the user wait time at the current point.
0.01msec to 7200sec
POWER:
Registers the output power at the current point.
This registration is enabled only when the power sweep is turned ON.
ENTRY:
Updates the data tables according to the registered conditions.
NOTE1:
If the “STEP” frequency is set to 0 Hz, only the frequency at the current point is updated.
NOTE:
Unless the update is performed after the conditions are registered, the registered contents are not reflected in the
data tables.
5-17
Section 5 Selecting Measurement Parameters (Measurement Group)
The following describes the various ways of performing the update.
1. REPLACE
Replaces the condition at the current point with a new ones.
2. INSERT
Inserts a new condition at the current point. The old data at the current point as well as the data at any following points
is accordingly moved down.
The data at the final point will be discarded.
3. DELETE
Deletes the data at the current point. The data at any following points is accordingly moved up.
The data at the new final point is set to the same value as the data at the old final point.
4. READY
Indicates that the device is ready to perform the edit.
SWEEP (2/2)
LIST SWEEP
LIST
LIST SWEEP
EDIT
LIST SWEEP
GUARD
-FULL/MKR
etc.
Description of function
Prevents the measurement condition tables for list sweep from being updated
even if the measurement parameters are changed.
Returns to the previous menu.
LIST SWEEP GUARD function
ON: Does not update the measurement condition tables even if the measurement parameters are changed.
The screen shows “GUARD ON”.
OFF: Updates the measurement condition tables accordingly if the measurement parameters are changed (Initial state).
5-18
5.4
5.4.7
Settings Related to Sweep
Marker sweep
Press the SWEEP switch to display the software key menu to switch between marker sweep and full sweep.
SWEEP (2/2)
LIST SWEEP
LIST
LIST SWEEP
EDIT
LIST SWEEP
GUARD
-FULL/MKR
etc.
Description of function
Switches between full-band sweep (FULL) and marker sweep (MKR).
Returns to the previous menu.
The marker sweep sweeps the frequency band between the active and reference markers.
5-19
Section 5 Selecting Measurement Parameters (Measurement Group)
5-20 .
Section 6 Display (Display Group)
This section explains various functions for displaying easy-to-read measurement waveforms.
MS4630B
Network Analyzer
10Hz–300MHz
Channels
1
Menu
F1
Meas
Shift
Marker
2
Active
Format
Marker
Fctn
7
8
9
BS
4
5
6
MHz
µsec
1
2
3
kHz
msec
mm
•
+/–
Preset
F2
Measurement
Frequency
Span
F3
A
System
Avg
Remote
Sweep
Out/Input
0
sec
Enter m
F4
Calibration
Utility
Copy/Memory
Control
Limit
Local
F5
Cal
F6
Scale
Backlight Off
Battery
Busy
Display All
X→S
X–S
Filter
Resonator
Active
Scale
Trace
Probe
Source
Window Close
Outputs
Keyboard
PMC
Save/
Recall
Copy
Display
B
A
PTA
A (Opt B)
B
Display
B
R
Active
Trace
+12V
100mA
Inputs
TA
TB
Max +20dBm
Front panel
Major functions
• Setting a trace scale
•
Setting trace and scale grid display types
•
Selecting display items
•
Subtrace function
6.1
6.2
6.3
6.4
6.5
Active Trace (Active) .................................................................
Setting a Scale (Scale) ..............................................................
6.2.1 Scale ..............................................................................
6.2.2 Offset .............................................................................
6.2.3 Offset line.......................................................................
6.2.4 Auto scale ......................................................................
6.2.5 Setting an electric length ...............................................
Setting the Display Screen (Trace) ...........................................
6.3.1 Split display....................................................................
6.3.2 Waveform storage .........................................................
6.3.3 Waveform overwrite .......................................................
6.3.4 Selecting a display grid ..................................................
6.3.5 Selecting the items to display or clear ...........................
6.3.6 Subtrace ........................................................................
Displaying All Items at the Touch of a Key (Display All) ............
Turning the Backlight ON/OFF (Backlight ON/OFF) .................
6-2
6-3
6-3
6-3
6-4
6-4
6-4
6-5
6-5
6-5
6-6
6-6
6-7
6-8
6-8
6-9
6-1
Section 6 Display (Display Group)
6.1
Active Trace (Active)
A
Press the
A
B
key to select an active trace.
Active
B
Select a trace whose settings are effective (active trace).
Active
You can use this key only when two traces are displayed for one measurement channel.
A
Pressing the
6-2
B
Active
key toggles between A (trace A) and B (trace B).
6.2 Setting a Scale (Scale)
6.2
Setting a Scale (Scale)
Press the
Scale
key to make scale-related settings.
Scale
6.2.1
Set the scale of the displayed trace.
Scale
Press the Scale key and select AUTO SCALE or SCALE from the soft key menu to set the screen scale.
Effective key: Ten-key, rotary knob
SCALE
AUTO SCALE
SCALE
OFFSET
OFS LINE
EL
--
NOTE:
•
•
6.2.2
Description of function
Automatically sets a Y-axis scale best suited to the measurement data.
Allows you to set a Y-axis scale (display magnification) manually.
When two traces are displayed for one measurement channel, a scale and an offset can be set for each trace.
The settings made for the active trace are made effective.
If the analysis format is LOGZ, the width of Y-axis is set in decade units (1, 2, 4, 5, 8, or 10 decades).
Offset
Press the Scale key and select OFFSET from the soft key menu to set a screen display offset.
Effective key: Ten-key, rotary knob
key
SCALE
AUTO SCALE
SCALE
OFFSET
OFS LINE
EL
--
NOTE:
•
•
•
•
Description of function
Allows you to set a Y-axis offset (display bias) manually.
When two traces are displayed for one measurement channel, a scale and an offset can be set for each trace.
The settings made for the active trace are made effective.
If the analysis format is LOGZ, a scale can be set from 1 mΩ to 100 M Ω in one to ten steps.
An offset can be set by
or
key (except LOGZ). It can be changed one tenth step of Y-axis width by each
press of the key.
If the analysis format is POLAR, IMPD CHART, or ADMT CHART, an offset cannot be set.
6-3
Section 6 Display (Display Group)
6.2.3
Offset line
Press the Scale key and select OFS LINE from the soft key menu to set a reference line for screen display offset.
Effective key: Ten-key, rotary knob
SCALE
AUTO SCALE
SCALE
OFFSET
OFS LINE
EL
--
Description of function
Allows you to set a reference line for offset.
NOTE:
A reference line is fixed at the bottom line if analysis format is LOGZ.
6.2.4
Press the
Auto scale
Scale
key and select AUTO SCALE from the soft key menu to set a scale and offset automatically.
SCALE
AUTO SCALE
SCALE
OFFSET
OFS LINE
EL
--
Description of function
Allows you to set a Y-axis scale best suited to the measurement data.
NOTE:
The auto scale is disabled if the analysis format is LOGZ.
6.2.5
Setting an electric length
Press the Scale key and select EL from the soft key menu to set an electric length.
Effective key: Ten-key, rotary knob
SCALE
AUTO SCALE
SCALE
OFFSET
OFS LINE
EL
--
6-4
Description of function
Allows you to set a calibration value used to calibrate electric lengths.
6.3
6.3
Press the
Setting the Display Screen (Trace)
Trace
Trace
key to make the setting related to the display screen.
Set a trace display type and scale grid display type, select display items, and make subtrace-related settings.
6.3.1
Press the
Split display
Trace
key and select SPLIT DISP from the soft key menu to display split views.
TRACE (1/2)
SPLIT DISP
STORAGE
OVER WRITE
GRID
DISPLAY
ITEM
etc.
NOTE:
*1 •
•
•
•
6.3.2
Press the
Setting the Display Screen (Trace)
Description of function
Displays a screen split into upper and lower views. *1
Switches to the next menu.
When one trace is displayed for one channel, the display screen cannot be split.
When the screen display is split is the one channel, two traces mode, trace A is displayed in the upper half
and trace B is displayed in the lower half.
When traces are displayed for two channels, traces of channel 1 are shown in the upper view and traces of
channel 2 are shown in the lower view.
If the screen display is not split when at least three waveform are displayed, this will disable the use of the
limit test function.
Waveform storage
Trace
key and select STORAGE from the soft key menu to turn ON/OFF the waveform storage function.
TRACE (1/2)
SPLIT DISP
STORAGE
OVER WRITE
GRID
DISPLAY
ITEM
etc.
Description of function
Allows you to turn ON/OFF the waveform storage function.
Switches to the next menu.
6-5
Section 6 Display (Display Group)
6.3.3
Press the
Waveform overwrite
Trace
key and select OVER WRITE from the soft key menu to turn ON/OFF the waveform overwrite function.
TRACE(1/2)
SPLIT DISP
STORAGE
OVER WRITE
GRID
DISPLAY
ITEM
etc.
6.3.4
Description of function
Allows you to turn ON/OFF the waveform overwrite function.
Switches to the next menu.
Selecting a display grid
Press the Trace key and select GRID from the soft key menu to select a grid type.
Effective key: Ten-key, rotary knob
key
TRACE (1/2)
SPLIT DISP
STORAGE
OVER WRITE
GRID
DISPLAY
ITEM
etc.
Description of function
Displays the window for selecting a grid type.
Switches to the next menu.
-GRID- WINDOW
GRID TYPE:
Select a scale grid display type.
ALL:
Displays the frame and all vertical/horizontal lines.
CENTER:
Displays the frame and only vertical/horizontal center lines.
FRAME:
Displays only the frame.
6-6
6.3
6.3.5
Setting the Display Screen (Trace)
Selecting the items to display or clear
Press the Trace key and select the items to display or clear using the following soft key menu and window.
Select an item to be deleted on the window. The selected item constitutes the deletion target.
TRACE (1/2)
SPLIT DISP
STORAGE
OVER WRITE
GRID
DISPLAY
ITEM
etc.
Description of function
Displays the window to select the displayed item.
Switches to the next menu.
Effective key: Ten-key, rotary knob
key
-DISPLAY ITEM- WINDOW
SELECT ITEM:
01.<SETUP-A>
A line to display the marker value, scale value and other data of Trace A.
02.<SETUP-B>
A line to display the marker value, scale value and other data of Trace B.
03.<MEAS PRMS>
Selection to display the measuring conditions such as the analysis for mat and
RBW (common to Trace A and B).
04.<FREQUENCY>
A line (lines) to display the range of the frequencies measured.
05.<MENU>
Soft key menu
06.<SWEEP MKR>
Sweep marker (common to Trace A and B).
07.<CHART-A>
Grid to display Trace A.
08.<CHART-B>
Grid to display Trace B.
09.<TRACE-A>
Measured waveform of Trace A.
10.<TRACE-B>
Measured waveform of Trace B.
11.<MARKER-A>
Marker of Trace A.
12.<MARKER-B>
Marker of Trace B.
13.<TOP LINE>
The single uppermost line to display the active channel, date and other infor
mation.
NOTE:
• Executing setting for individual channels is disabled. Channels 1 and 2 are always coupled when displayed
or deleted.
• The “Display All” key enables switching between “Display of All Items” and “Display of Only Items Selected
by This Setting”.
6-7
Section 6 Display (Display Group)
6.3.6
Press the
Subtrace
Trace
key and make subtrace-related settings using the following soft key menu.
TRACE (2/2)
SUB TRACE
MT→ST
MT = ST
Description of function
Turns ON/OFF the subtrace function.
Copies all data from the main trace to the subtrace.
Copies data from the main trace to the subtrace for each measurement point.
Subtracts the subtrace data from the measurement data for each measurement
point and stores the result as main trace data.
MT = MT-ST
-etc
NOTE:
•
•
•
•
•
6.4
Returns to the previous menu.
The active trace is the main trace and the inactive trace is the subtrace.
When ANALYSIS FORMAT requiring two traces per channel is selected, the subtrace function cannot be
performed.
When PHASE is selected as an analysis format, the result value is converted to a value which is between –180˚
and +180˚.
When MT=MT–ST is selected after selecting MT→ST or MT=ST with the smoothing function ON, smoothing
is performed for the result of MT–ST.
If a subtrace waveform is recalled from a floppy disk, internal memory, or PMC, the MT-ST function cannot be
performed again using the recalled data.
Displaying All Items at the Touch of a Key (Display All)
Display all key
MS4630B
Network Analyzer
10Hz–300MHz
Channels
1
Menu
F1
Meas
Shift
Marker
2
Active
Format
Marker
Fctn
7
8
9
BS
4
5
6
MHz
µsec
1
2
3
kHz
msec
mm
Preset
F2
Measurement
Frequency
Span
F3
Display All
System
Avg
Remote
Sweep
Out/Input
0
•
+/–
sec
Enter m
F4
Calibration
Utility
Copy/Memory
Control
Limit
Local
F5
Cal
PTA
Scale
Backlight Off
Battery
Busy
Display All
X→S
A
F6
X–S
Filter
Resonator
Active
Trace
Probe
Source
Window Close
Outputs
PMC
Save/
Recall
Copy
Display
B
Keyboard
A (Opt B)
B
R
+12V
100mA
Inputs
TA
TB
Max +20dBm
Front panel
Major function
• Clearing selected items
NOTE:
The items selected in the DISPLAY window brought up from the TRACE menu will be cleared.
6-8
6.5
6.5
Turning the Backlight ON/OFF (Backlight ON/OFF)
Turning the Backlight ON/OFF (Backlight ON/OFF)
Backlight Off key
MS4630B
Network Analyzer
10Hz–300MHz
Channels
1
Menu
F1
Meas
Shift
Marker
2
Active
Format
Marker
Fctn
7
8
9
BS
4
5
6
MHz
µsec
1
2
3
kHz
msec
mm
Preset
F2
Measurement
Frequency
Span
F3
Backlight Off
System
Avg
Remote
Sweep
Out/Input
0
•
sec
Enter m
+/–
F4
Calibration
Utility
Copy/Memory
Control
Limit
Local
F5
Cal
PTA
Scale
Backlight Off
Battery
Busy
Display All
X→S
A
F6
X–S
Filter
Resonator
Active
Trace
Probe
Source
Window Close
Outputs
PMC
Save/
Recall
Copy
Display
B
Keyboard
A (Opt B)
B
R
+12V
100mA
Inputs
TA
TB
Max +20dBm
Front panel
Major function
Backlight Off
• Pressing the
key toggles the backlight ON and OFF.
6-9
Section 6 Display (Display Group)
6-10.
Section 7 Marker (Marker Group)
This section explains how to use markers when reading measured values from measurement waveforms.
MS4630B
Marker
Network Analyzer
10Hz–300MHz
Channels
1
Menu
F1
Meas
Shift
Marker
2
Active
Marker
Format
Fctn
7
8
9
BS
4
5
6
MHz
µsec
1
2
3
kHz
msec
mm
Preset
F2
Measurement
Frequency
Span
F3
Marker
System
Avg
Remote
Sweep
Out/Input
0
•
+/–
sec
Enter m
F4
Calibration
Utility
Copy/Memory
Control
Limit
Local
F5
Cal
PTA
A
F6
Scale
Backlight Off
Battery
Busy
Display All
X→S
X–S
Filter
Resonator
Display
B
Active
Trace
Probe
Source
Window Close
Outputs
PMC
Save/
Recall
Copy
Keyboard
A (Opt B)
B
R
+12V
100mA
Inputs
TA
Fctn
TB
Max +20dBm
Front panel
Major functions
• Setting/moving markers
•
Setting multimarker/marker list
•
Setting various marker modes
•
Performing MKR→*** functions
7.1
7.2
Setting, Moving, and Displaying Markers (Marker) ...................
7.1.1 Setting and moving markers ..........................................
7.1.2 Displaying a special marker
(delta marker, zero marker, or marker list) ....................
Useful Marker Functions (Fctn) .................................................
7.2.1 Moving a marker (MAX, MIN, ±PEAK, tracking) ............
7.2.2 Setting measurement conditions using marker positions
(MKR → CF, ∆ → SPAN, MKR → OFS) .......................
7-2
7-2
7-4
7-5
7-5
7-5
7-1
Section 7 Marker (Marker Group)
7.1
Setting, Moving, and Displaying Markers (Marker)
7.1.1
Setting and moving markers
Press the
Marker
key and set and move markers using the soft key menus below.
Marker
(1)
Set/move a marker and set a display mode.
Moving the active marker and setting a new marker.
•
Press the Marker key to enable move of the active marker.
Effective key: Ten-key, rotary knob
•
key
Every time the ON key of the soft key menu is pressed, a new marker is generated (up to 10 new markers). The
active marker will shift to the newly generated marker.
MARKER (1/2)
ON
SCROLL
OFF
REF MKR No
COUPLED
MARKER
etc.
Description of function
Enables move of the active marker or setting of a new marker, and move of
the marker.
Switches to the next menu.
NOTE:
Allows you to move the marker by
of the key.
(2)
key. The marker is moved one tenth of the Y-axis width by each press
Switching the active marker.
Every time the SCROLL key of the soft key menu is pressed, the active markers among preset markers are selected
in sequence.
MARKER (1/2)
ON
SCROLL
OFF
REF MKR No
COUPLED
MARKER
etc.
7-2
Description of function
Selects the active markers in sequence.
Switches to the next menu.
7.1
(3)
Setting, Moving, and Displaying Markers (Marker)
Deleting the marker.
Delete a marker selected as the active marker.
MARKER (1/2)
ON
SCROLL
OFF
REF MKR No
COUPLED
MARKER
etc.
(4)
Description of function
Deletes a marker selected as the active marker.
Switches to the next menu.
Setting the reference marker.
Set the reference marker using the marker No.
Effective key: Ten-key, rotary knob
MARKER (1/2)
ON
SCROLL
OFF
REF MKR No
COUPLED
MARKER
etc.
(5)
Description of function
Sets the reference marker using the marker No. (0 to 9).
Switches to the next menu.
Coupling the marker.
Execute setting of whether to interlink the marker positions between Trace A and B.
MARKER (1/2)
ON
SCROLL
OFF
REF MKR No
COUPLED
MARKER
etc.
(6)
Description of function
Executes setting of whether to interlink the marker positions between Trace A
and B. (ON/OFF)
Switches to the next menu.
Replacing the active and reference markers.
MARKER (1/2)
ON
SCROLL
OFF
REF MKR No
COUPLED
MARKER
etc.
Description of function
Replaces the active and reference markers.
Switches to the next menu.
7-3
Section 7 Marker (Marker Group)
7.1.2
Press the
Displaying a special marker (delta marker, zero marker, or marker
list)
Marker
key and switch the indicated value of the marker using the soft key menus below.
MARKER (2/2)
NORMAL
∆MKR
0MKR
MKRCHANGE
MKRLIST
etc.
Description of function
Select a normal marker.
Selects a delta marker.
Selects a zero marker.
Replaces the active and reference markers.
Displays a maker list (when set ON.)
Returns to the previous menu.
(1)
NORMAL MARKER mode:
Displays the active marker value as it is.
(2)
DELTA MARKER mode:
Obtains the difference between the active marker and reference marker.
(3)
ZERO MARKER mode:
Stores the active marker value detected at depression of the “ZERO
MARKER” key, then obtains the difference between the active marker value
and the stored values.
(4)
MKRLIST:
Displays a maximum of 10 markers set for the active channel. These ten markers are automatically selected following the rule below.
Priority
Marker
1
Active marker on active trace
2
Active marker on inactive trace
3
Inactive marker (lower marker number) on active trace
4
Inactive marker (lower marker number) on inactive trace
5
Inactive marker (higher marker number) on active trace
6
Inactive marker (higher marker number) on inactive trace
NOTE:
When the MKRLIST display is selected, traces only for the active channel can be displayed. The results of ∆ MKR
and 0 MKR cannot be displayed as the MKRLIST. All of these are displayed in the NORMAL MARKER mode.
7-4
7.2
7.2
Press the
7.2.1
Useful Marker Functions (Fctn)
Fctn
key and perform various marker functions using the soft key menus below.
Moving a marker (MAX, MIN, ±PEAK, tracking)
Fctn
7.2.2
Useful Marker Functions (Fctn)
Perform a marker function.
FUNCTION (1/2)
MKR→MAX
MKR→MIN
MKR→CF
∆→SPAN
MKR→OFS
etc.
Description of function
Moves the marker to the maximum value on the waveform.
Moves the marker to the minimum value on the waveform.
FUNCTION (2/2)
MKR→+PEAK
MKR→–PEAK
TRK+PEAK
TRK–PEAK
TRK OFF
etc.
Description of function
Moves the marker to the highest peak on the waveform.
Moves the marker to the lowest peak on the waveform.
Moves the marker to the highest peak of the waveform after each sweep (Tracking.)
Moves the marker to the lowest peak of the waveform after each sweep (Tracking.)
Turns OFF the tracking function.
Returns to the previous menu.
Switches to the next menu.
Setting measurement conditions using marker positions
(MKR → CF, ∆ → SPAN, MKR → OFS)
FUNCTION (1/2)
MKR→MAX
MKR→MIN
MKR→CF
∆→SPAN
MKR→OFS
etc.
Description of function
Sets the marker frequency to the center frequency.
Sets the delta marker value (difference in frequency) to the frequency span.
Sets the offset so that the marker moves to the offset line.
Switches to the next menu.
7-5
Section 7 Marker (Marker Group)
7-6 .
Section 8 Calibration (Calibration Group)
This section explains the calibration which is necessary to eliminate errors in the values measured by the measuring
system.
MS4630B
Network Analyzer
10Hz–300MHz
Channels
1
Menu
F1
Meas
Shift
Marker
2
Active
Format
Marker
Fctn
7
8
9
BS
4
5
6
MHz
µsec
1
2
3
kHz
msec
mm
Preset
F2
Measurement
Frequency
Span
F3
Calibration
System
Avg
Remote
Sweep
Out/Input
0
•
+/–
sec
Enter m
F4
Calibration
Utility
Copy/Memory
Control
Limit
Local
F5
Cal
PTA
F6
Scale
Backlight Off
Battery
Busy
Display All
X→S
A
X–S
Filter
Resonator
Active
Probe
Source
Outputs
Keyboard
Cal
Trace
Window Close
PMC
Save/
Recall
Copy
Display
B
A (Opt B)
B
R
X→S
X–S
+12V
100mA
Inputs
TA
TB
Max +20dBm
Front panel
Major functions
• Selecting a calibration method
•
Fetching measurement data into the system
•
Calculation of error data
•
Normalization (X-S)
8.1
8.2
8.3
8.4
Explanation ................................................................................
Normalization (X-S) ...................................................................
8.2.1 Fetching reference data .................................................
8.2.2 Turning the normalization function ON/OFF ..................
Vector Errors Calibration (Cal) ..................................................
8.3.1 Preparation for calibration .............................................
8.3.2 Calibration procedure ....................................................
Interpolating Calibration Data ....................................................
8-2
8-3
8-3
8-3
8-4
8-4
8-5
8-9
8-1
Section 8 Calibration (Calibration Group)
8.1
Explanation
This system supports the following two methods of correcting errors in the values measured by the measuring system:
Normalization
Vector error calibration
These methods have both advantages and disadvantages, so you must select either method according to your purpose.
Let’s take a look at the differences between these two methods.
Features of normalization
The normalize calibration method finds the difference between the waveform data displayed on the screen and the reference data obtained in advance. This operation is performed on the waveform displayed on the screen after it is processed
to the analysis format (e.g., amplitude and phase), and not on the measured signals (vector with magnitude and phase
angle).
Features of vector error calibration method
A device with known characteristics is measured by a measuring system, the measured value is compared with the logical
value to obtain the error in the value measured by the measuring system, then this error is corrected. This calculation is
performed for the measured signal (vector quantity) which has not been converted to a waveform. This method is further
classified into some methods depending on the type of the error to be corrected.
The greatest difference is that the calculation is performed before or after conversion of measurement data to a display
waveform. The vector error calibration method does not require recalibration if the waveform display mode is changed
(e.g., from MAG to MAG/PHASE). On the other hand, the normalization method requires recalibration. Generally, the
vector error calibration is more complicated and requires more time and effort than the normalization method.
8-2
8.2
8.2
Normalization (X-S)
8.2.1
Fetching reference data
X→S
Normalization (X-S)
Fetch the reference data for normalization.
•
The normalization method displays the difference between the reference data stored in the system and the data obtained by actually carrying out a sweep measurement.
•
The difference is obtained for the scalar data obtained after processing data into the selected analysis format (MAG,
PHASE, DELAY, etc.). The reference data is also stored as scalar data.
NOTE:
•
•
•
8.2.2
X–S
When PHASE is selected as an analysis format (PHASE, θ), the result value is converted to a value which is
between –180˚ and +180˚.
This function can be used for simple calibration of frequency responses.
Pressing this key starts the uptake sweep of reference data and, after the sweep is completed, turns the normalize calibration ON. In the following sweep and thereafter, the calibrated measurement waveform is displayed.
Turning the normalization function ON/OFF
Turn ON/OFF the normalization function.
NOTE:
Turning the normalization function ON, “S” is displayed on the left side of the display as showing this condition.
Turning the normalize function OFF does not delete the reference data taken into the device. Changing the measurement conditions or recalling a file from a floppy disk, internal memory, or PMC turns the normalize function
OFF. The normalize function is performed independently for each measurement channel. Therefore, to use the
normalize function for both of the measurement channels, the reference data must be read for each of the channels.
8-3
Section 8 Calibration (Calibration Group)
8.3
Press the
Vector Errors Calibration (Cal)
Cal
key and set and carry out vector error calibration.
Cal
8.3.1
Select a calibration method, fetch calibration data, and make error calculations.
Preparation for calibration
•
The soft key menu to be displayed depends on the calibration method used.
•
To set a calibration method, press the
displayed window.
(Setup) key to display a window and select “CAL METHOD” from the
F5
-SETUP- WINDOW
CAL METHOD:
Display the window for selecting a calibration method and setting a
THROUGH LINE characteristic.
CONNECTOR PARAMETER:
Display the window for setting OPEN STD and SHORT STD characteristics.
-CAL METHOD- WINDOW
CAL METHOD:
Select a calibration method.
THROUGH LINE:
Set the offset length of the through line to be used.
-CONNECTOR PARAMETER-
WINDOW
OPEN:
Set the characteristic of the open device to be used.
SHORT:
Set the characteristic of the short device to be used.
8-4
8.3
8.3.2
Vector Errors Calibration (Cal)
Calibration procedure
(1)
Set up the measuring system using various calibration tools (THROUGH LINE, OPEN STD, SHORT STD,
LOAD STD, etc.)
(2)
Start fetching the calibration data.
Calibration data states are indicated by the following messages in menus.
“Default”:
Calibration data has not been fetched into the system completely.
“Measuring”:
Calibration data is being fetched.
“Created”:
Calibration data has been fetched.
Error calculations are performed using the calibration data fetched into the system by pressing the
(3)
F6
key
(CAL ON key).
(4)
When error calculations are complete, the CAL lamp lights up (CAL ON state) and the calibrated measurement
result is obtained after each of the succeeding sweeps.
NOTE:
•
•
•
Pressing the Cal key with CAL ON selected extinguishes the CAL lamp and produces the CAL OFF state.
The CAL OFF state is also produced when recalibration is required due to a change in measurement condition.
Select CAL ON/OFF for each channel irrespective of the coupled channel state.
<RESPONSE calibration>
RESPONSE
RESPONSE
---SETUP
CAL ON
Description of function
Starts fetching THROUGH LINE calibration data.
Displays the window for selecting a calibration method and setting conditions.
Starts calculating error calibration data and turns ON the calibration/measurement function.
NOTE:
Since this calibration is related to transfer measurement, only the frequency response data is vector-calibrated
using the through line.
Probe
Source
Outputs
A (Opt B)
B
R
+12V
100mA
Inputs
TA
TB
Max +20dBm
SWR Bridge
OPEN STD.
SHORT STD.
LOAD STD.
Example of setup for RESPONSE calibration
8-5
Section 8 Calibration (Calibration Group)
<1PORT OSL calibration>
1PORT OSL
OPEN
SHORT
LOAD
SETUP
CAL ON
Description of function
Starts fetching OPEN STD calibration data.
Starts fetching SHORT STD calibration data.
Starts fetching LOAD STD calibration data.
Displays the window for selecting a calibration method and setting conditions.
Starts calculating error calibration data and turns ON the calibration/measurement function.
NOTE:
Since this calibration is related to reflection measurement, vector calibration is performed using OPEN, SHORT,
or LOAD calibration data.
Probe
Source
Outputs
A (Opt B)
B
R
+12V
100mA
Inputs
TA
TB
Max +20dBm
SWR Bridge
OPEN STD.
SHORT STD.
LOAD STD.
Example of setup for 1PORT OSL calibration
<1PATH 2PORT calibration>
1PATH 2PORT
OPEN
SHORT
LOAD
THRU
SETUP
CAL ON
Description of function
Starts fetching OPEN STD calibration data.
Starts fetching SHORT STD calibration data.
Starts fetching LOAD STD calibration data.
Starts fetching THROUGH LINE calibration data.
Displays the window for selecting a calibration method and setting conditions.
Starts calculating error calibration data and turns ON the calibration/measurement function.
NOTE:
Since this calibration is related to transfer/reflection measurement, only forward characteristics (excluding the
load matching error) are vector-calibrated for 12TERM.
8-6
8.3
Probe
Source
Outputs
A (Opt B)
B
+12V
100mA
Inputs
TA
R
Vector Errors Calibration (Cal)
TB
Max +20dBm
THROUGH LINE
SWR Bridge
OPEN STD.
SHORT STD.
LOAD STD.
Example of setup for 1PATH 2PORT calibration
Precautions for 1PATH 2PORT calibration
• Since this calibration is performed using the calibration data on two channels, an input port TB (optional unit) is
required.
•
Select CH1 & CH2 (dual channel measurement) as measurement channels and set on “COUPLED CHANNEL.”
•
Use measurement CH1 for reflection measurement. Select TA/R as the CH1-side analysis port.
•
To obtain (sweep) OPEN, SHORT, or LOAD calibration data, select CH1 as the active channel.
When obtaining LOAD calibration data, obtain the transmission-side (CH2) LOAD data at the same time.
•
Use measurement CH2 for transfer measurement. Select TB/R as the CH2-side analysis port.
To obtain THROUGH calibration data, select CH2 as the active channel.
When obtaining THROUGH calibration data, obtain the reflection-side (CH2) THROUGH calibration data at the
same time.
•
Select CAL ON (sweep start) for individual channels.
•
When calibrate CH2, select CAL ON both CH1 and CH2, otherwise proper calibration will not be executed.
8-7
Section 8 Calibration (Calibration Group)
<PI NET calibration>
PI-NET
OPEN
SHORT
--SETUP
CAL ON
NOTE:
•
•
Description of function
Starts fetching transfer OPEN (open) calibration data.
Starts fetching transfer SHORT (through) calibration data.
Displays the window for selecting a calibration method and setting conditions.
Starts calculating error calibration data and turns ON the calibration/measurement function.
This calibration method is used to measure the resonator impedance in the TRANSFER mode using a pi network jig.
To measure the resonator impedance using a pi network jig, set “IMPD MEASUREMENT” to “TRANSFER”
in “F1:USER PRESER” in the system menu (displayed by pressing SHIFT + 0 (SYSTEM)). In addition, press
the Out/Input key, select “F6:etc.” to display “F5:REFIMPD”, and set the reference impedance to the impedance
of the pi network jig.
Probe
Source
Outputs
A (Opt B)
B
R
+12V
100mA
Inputs
TA
TB
Max +20dBm
Pi network jig
OPEN STD.
SHORT STD.
Example of setup for PI NET calibration
<RESPONSE & ISOLATION calibration>
RESP&ISLN
RESPONSE
ISOLATION
--SETUP
CAL ON
Description of function
Starts fetching THROUGH LINE calibration data.
Starts fetching ISOLATION (cross talk) calibration data.
Displays the window for selecting a calibration method and setting conditions.
Starts calculating error calibration data and turns ON the calibration/measurement function.
NOTE:
Since this calibration is related to transfer measurement, frequency response data and isolation (cross talk) data are
vector-calibrated using THROUGH LINE and LOAD STD.
8-8
8.4
8.4
Interpolating Calibration Data
Interpolating Calibration Data
If the measurement frequency range and measurement point are changed after completion of vector error calibration, it is
common practice to create new calibration data to obtain a correct calibration result. With this system, however, press
from the soft key menu after setting a new frequency and point compares the old one with the new one
CAL ON
to create calibration data for the new frequency and point, allowing you to obtain a calibration result which is close to the
calibration result obtained using new calibration data.
NOTE:
If a new frequency is not included in the old frequency range, the result of calibration for the new frequency may
become incorrect.
Or, “ I ” is indicated on the left side of the display, because the data is not interpolated by the latest calibration.
8-9
Section 8 Calibration (Calibration Group)
8-10 .
Section 9 Analysis of Measurement Data
(Utility Group)
This section explains three analysis functions supported by this system: filter analysis, resonator analysis, and limit test.
MS4630B
Network Analyzer
10Hz–300MHz
Channels
1
Menu
F1
Meas
Shift
Marker
2
Active
Format
Marker
Fctn
7
8
9
BS
4
5
6
MHz
µsec
1
2
3
kHz
msec
mm
•
+/–
Preset
F2
Measurement
Frequency
Span
F3
Utility
Limit
System
Avg
Remote
Sweep
Out/Input
0
sec
Enter m
F4
Calibration
Utility
Copy/Memory
Control
Limit
Local
F5
Cal
F6
Scale
Backlight Off
Battery
Busy
Display All
X→S
X–S
Filter
Resonator
Active
Filter
Trace
Probe
Source
Window Close
Outputs
Keyboard
PMC
Save/
Recall
Copy
Display
B
A
PTA
A (Opt B)
B
R
Resonator
+12V
100mA
Inputs
TA
TB
Max +20dBm
Front panel
Major functions
• Filter analysis function
•
Resonator analysis function
•
Limit Test (Judging trace data according to standard line)
9.1
9.2
9.3
Filter Analysis Function (Filter) ..................................................
Resonator Analysis Function (Resonator) .................................
Limit Test (Limit) ........................................................................
9-2
9-5
9-8
9-1
Section 9 Analysis of Measurement Data (Utility Group)
9.1
Filter Analysis Function (Filter)
Limit
Press the
Filter
key and set and perform the filter analysis function using the displayed soft key menu and window.
Limit
Analyze a filter.
Filter
FILTER
ANALYSIS
SETUP
-----
NOTE:
•
•
•
•
Description of function
Allows you to turn ON/OFF the filter analysis function.
Displays the window for setting analysis conditions.
A filter analysis is performed for each sweep and the analysis result is displayed.
If an analysis result cannot be obtained, 0 is displayed.
This function cannot be performed when the frequency setting mode is LOG.
The following parameters are analyzed:
BW1: X1 dB down bandwidth
BW2: X2 dB down bandwidth
∆FL1: Low bandwidth at X1 dB down point
(∆FL1 = (Nominal center frequency) – (Low frequency of X1 dB down point))
∆FR1: High bandwidth at X1 dB down point
(∆FR1 = (Nominal center frequency) – (Low frequency of X1 dB down point))
∆FL2: Low bandwidth at X2 dB down point
(∆FL2 = (Nominal center frequency) – (Low frequency of X2 dB down point))
∆FR2: High bandwidth at X2 dB down point
(∆FR2 = (Nominal center frequency) – (Low frequency of X2 dB down point))
IL:
Insertion loss
F0: Filter center frequency (F0 = (FL1 + FR1)/2)
Q:
Q value ( Q=
FL1 × FR1
)
BW1
SF: Shape factor (SF = BW2/BW1)
RPL: Ripple
9-2
9.1
Filter Analysis Function (Filter)
Effective key: Ten-key, rotary knob
-SETUP- WINDOW
FILTER CF:
Set the nominal center frequency of the filter to analyze.
NOTE:
When 0 Hz is set or the set frequency is not included in the measurement band, an analysis is carried out assuming
that the current center frequency is the nominal center frequency.
REF FOR IL CALC:
Set the reference point used to obtain the insertion loss.
FILTER CF:
Nominal center frequency
MAX VALUE:
Maximum value in band
BW REF:
Set the reference point used to obtain an X* dB down bandwidth.
FILTER CF:
Nominal center frequency
MAX VALUE:
Maximum value in band
X1 dB DOWN:
Set an X1 dB value.
X2 dB DOWN:
Set an X2 dB value.
RPL SEARCH START:
Set a ripple detection start frequency.
RPL SEARCH EN:
Set a ripple detection end frequency.
RPL RESOLUTION:
Set the minimum difference in level between the positive peak and the
negative peak that allows a ripple to be detected.
Waveform fluctuations smaller than the specified level are not regarded as a ripple.
FREQ DISP DIGITS:
Set a number of digits to be used to display an analysis result (frequency).
9-3
Section 9 Analysis of Measurement Data (Utility Group)
FILTER CF (Nominal center frequency)
IL
RPL
X1 dB
X2 dB
BW1
∆FL1
∆FR1
BW2
∆FL2
FL2 FL1
∆FR2
F0
FR1 FR2
REF FOR INSERTION LOSS = FILTER CF
REF FOR XdB DOWN BW = Analysis parameter for FILTER CF
Example of analysis result
Filter analysis result
9-4
9.2
9.2
Resonator Analysis Function (Resonator)
Resonator Analysis Function (Resonator)
Press the
Resonator
key and set and perform the resonator analysis function using the displayed soft key menu and window.
Resonator
Analyze a resonator.
RESONATOR
ANALYSIS
setup
RESON 1
RESON 2
---
NOTE:
•
•
•
•
•
Description of function
Allows you to turn ON/OFF the resonator analysis function.
Displays the window for setting analysis conditions.
Selects a simple evaluation mode.
Selects a total evaluation mode (analysis of equivalent constants of crystal resonator.)
A resonator analysis is performed for each sweep and the analysis result is displayed.
If an analysis result cannot be obtained, 0 is returned.
This function can be performed only under the following conditions:
“RESON1”:
ZERO PHASE analysis method:
LOG Z & θ
(Z and both θ = Trace-A and θ = Trace-B are used.)
MIN/MAX IMPD analysis method: LOG Z or LOG Z & θ
(The active trace is analyzed.)
“RESON2”:
LOG Z and θ (Z and both θ = Trace-A and θ = Trace-B are used.)
This function can be performed when “IMPD MEASUREMENT” is set to “TRANSFER.”
If X-S, SUB TRACE, and SMOOTHING are performed, values of R1, C0, C1, L1, and Q are analyzed assuming these processes are not performed.
This function can not be performed when the frequency setting mode is LOG.
The following analysis result is displayed:
“RESON1”
Fr:
Zr:
Fa:
Za:
-ZERO PHASE analysis methodLow frequency when impedance phase is 0
Impedance at Fr
High frequency when impedance phase is 0
Impedance at Fa
-MIN/MAX IMPD analysis methodFn: Frequency at maximum impedance
Zn: Impedance at Fn
Fm: Frequency at minimum impedance
Zm: Impedance at Fm
(Fr,Zr)
(Fa,Za)
(Fn, Zn)
(Fm, Zm)
9-5
Section 9 Analysis of Measurement Data (Utility Group)
“RESON2”: A 4-element equivalent circuit is analyzed.
Fr, Zr, Fa, Za
Fs: Series resonance frequency (frequency at maximum conductance G)
R1: Series resistance
CO: Parallel capacitance (C0=C1×Fr2/(Fa2–Fr2))
C1: Series capacity (C1=1/(2πFs×Q×R1))
L1: Series inductance (L1=Q×R1/(2πFs))
Q: Quality coefficient (Q=Fs/(F2–F1))
F1 and F2 are low and high frequencies at (maximum conductance)/2.
C0
C1
L1
R1
Four-element equivalent circuit
Effective key: Ten-key, rotary knob
-SETUP- WINDOW
START FREQ:
Sets the start frequency of the band subject to analysis.
END FREQ:
Sets the end frequency of the band subject to analysis.
NOTE:
If the band subject to analysis is not included in the current measurement band, an analysis is carried out assuming
that the current measurement band is the band subject to analysis.
EVALUATION METHOD FOR RESON1:
Select an analysis method used when “RESON1” is selected.
ZERO PHASE:
Obtains the frequency at which the impedance phase becomes 0 and the
impedance.
MIN/MAX IMPD:
Obtains the frequencies at which the impedance becomes maximum and
minimum and the impedances.
FREQ DISP DIGITS
Set a number of digits to be used to display an analysis result (frequency).
9-6
9.2
Resonator Analysis Function (Resonator)
Example of analysis result (RESON2)
9-7
Section 9 Analysis of Measurement Data (Utility Group)
9.3
Press
Limit Test (Limit)
Shift
Limit
+
Filter
keys and set and perform the limit test function using the displayed soft key menu and window.
Shift
+
Limit
Test the trace data according to the standard line.
Filter
LIMIT
LINE ENTRY
TEST
BEEP
----
NOTE:
•
•
•
•
•
•
9-8
Description of function
Displays the window for entering a standard line.
Tests the trace data according to the standard line.
Makes the setting for issuing a beep when the test result is "FAIL."
When the standard line (or part of it) is outside the set frequency range, trace data cannot be tested properly.
Trace data is tested according to the standard line after each sweep.
The entered standard line data is calculated as the standard data corresponding to all sweep points under the
measurement conditions set when the TEST function was turned ON and the calculation result is stored in the
system.
When the standard line cannot be compared with the measurement waveform due to a change in measurement
condition, this function is turned OFF.
Turning ON the test function again calculates the standard data again under the new conditions.
If the standard line is outside the set frequency range, trace data cannot be tested properly.
If the screen display is not split when at least three waveforms are displayed, this will disable the use of the
limit test function.
If the analysis format is LOGZ, the limit test is disabled.
9.3
Limit Test (Limit)
-LINE ENTRY- WINDOW
LIMIT TYPE:
Set a standard line type.
SINGLE:
Sets data that can be represented only by a y-coordinate. The data is constant for all frequencies.
SEGMENT:
Sets data with a combination of (f0, y0) and (f1, y1). (Max. 10 segments)
SINGLE
SEGMENT
(f1, y1)
y→
(f0, y0)
Frequency
Frequency
[UPPER LIMIT ENTRY]:
Displays the window for entering the upper limit standard line data.
[
Displays the window for clearing the upper limit standard line data.
CLEAR]:
[LOWER LIMIT ENTRY]:
Displays the window for entering the lower limit standard line data.
[
Displays the window for clearing the lower limit standard line data.
CLEAR]:
-UPPER (LOWER) LIMIT DEFINE- WINDOW (SINGLE)
UPPER (LOWER) LIMIT-Y:
Set the y value of the upper (lower) standard value.
-UPPER (LOWER) LIMIT CLEAR- WINDOW (SINGLE)
[CLEAR]:
Clear the upper (lower) standard value.
When cleared, the maximum value (or the minimum value for LOWER) is
used as the standard value.
-UPPER (LOWER) LIMIT ENTRY- WINDOW (SEGMENT)
SEGMENT:
START
END
Set the number of the segment to enter.
-X:
Set the f0 value of the upper (lower) limit standard value.
-Y:
Set the y0 value of the upper (lower) limit standard value.
-X:
Set the f1 value of the upper (lower) limit standard value.
-X:
Set the y1 value of the upper (lower) limit standard value.
9-9
Section 9 Analysis of Measurement Data (Utility Group)
-UPPER (LOWER) LIMIT CLEAR- WINDOW (SEGMENT)
SEGMENT
START
END
[CLEAR]
9-10 .
Set the number of the segment to clear.
-X:
Set the f0 value of the upper (lower) limit standard value.
-Y:
Set the y0 value of the upper (lower) limit standard value.
-X:
Set the f1 value of the upper (lower) limit standard value.
-X:
Set the y1 value of the upper (lower) limit standard value.
Clear the standard value of the specified segment number.
Section 10 Hard Copy and Remote Control
(Copy/Memory Group)
This section explains how to output a hard copy and save/recall measurement conditions and result onto/from the floppy
disk.
MS4630B
Network Analyzer
10Hz–300MHz
Channels
1
Menu
F1
Meas
Shift
Marker
2
Active
Format
Marker
Fctn
7
8
9
BS
4
5
6
MHz
µsec
1
2
3
kHz
msec
mm
•
+/–
Preset
F2
Measurement
Frequency
Span
F3
Copy/Memory
Control
System
Avg
Remote
Sweep
Out/Input
0
sec
Enter m
F4
Calibration
Utility
Copy/Memory
Control
Limit
Local
F5
Cal
PTA
F6
Scale
Backlight Off
Battery
Busy
Display All
X→S
A
X–S
Filter
Resonator
Active
Probe
Source
Window Close
Keyboard
Copy
Trace
Outputs
PMC
Save/
Recall
Copy
Display
B
A (Opt B)
B
R
+12V
100mA
Inputs
TA
Save/
Recall
TB
Max +20dBm
Front panel
Major functions
• Performing and controlling the hard copy function
•
Saving/recalling measurement data and conditions
•
Entering a title label
10.1 Outputting a Hard Copy of Screen Data (Copy) ........................
10.2 Making Settings Related to the Hard Copy and
Remote Control (Copy, Control, Local) .....................................
10.2.1 Copy Control key ...........................................................
10.2.2 Local key........................................................................
10.3 Save/Recall ...............................................................................
10-2
10-2
10-2
10-5
10-6
10-1
Section 10 Hard Copy and Remote Control (Copy/Memory Group)
10.1
Outputting a Hard Copy of Screen Data (Copy)
Control
Starts outputting a hard copy to the printer or FD.
Copy
•
The lamp is lit while hard copy data is being output.
•
Pressing this key stops the output of a hard copy.
•
Remote printing via the GPIB, RS232C, or Centronics interface or the Separate Video terminal can be controlled.
RS232C and centronics interfaces are optional.
•
To control copying via the GPIB or RS232C interface, place this system in the “controller” state.
•
When an error message is displayed on the screen resulting from the hard copy related operations, see (2) External
interface related errors of Appendix D Error Message.
10.2
Making Settings Related to the Hard Copy and
Remote Control (Copy Control, Local)
10.2.1
Copy Control key
Shift
+
Control
Set the conditions related to external interfaces and hard copy.
Copy
CONTROL
GPIB
RS232C
-HARD COPY
BIT MAP
--
NOTE:
•
•
•
10-2
Description of function
Displays the window for making GPIB-related settings.
Displays the window for making RS232C-related settings.
Displays the window for making settings related to the hard copy.
Displays the window for making the settings related to bit-mapped image data.
This menu is the same as the menu displayed by pressing the Local key.
RS232C-related settings are valid only when the optional unit is installed.
To output a hard copy, the “CONTROL FUNCTION” of the specified interface must be set to “CONTROLLER” (except when the VIDEO OUT or Centronics interface is used).
10.2
(1)
Making Settings Related to the Hard Copy and Remote Control (Copy, Control, Local)
GPIB related setting
Effective key: Ten-key, rotary knob
-GPIB- WINDOW
GPIB MY ADDRESS:
Set the GPIB address of this system.
CONTROL FUNCTION:
Switch between the GPIB DEVICE and CONTROLLER modes of this system.
ENABLE REGISTER ALL:
Set the GPIB enable register.
TERMINATER:
Set a terminator code used to output data from this system to the outside.
TIME OUT:
Set the maximum transmission/reception wait time when this system is in
the CONTROLLER mode. Setting 0 second causes the system to wait for
transmission/reception for ever.
ACTIVE PORT:
Set the control interface used to output data (copy output). (This setting
cannot be made when an optional unit is not installed.)
NOTE:
It is impossible to set CONTROL FUNCTION to “DEVICE” for both GPIB and RS232C interfaces.
(2)
RS232C related setting
Effective key: Ten-key, rotary knob
-RS232C- WINDOW
CONTROL FUNCTION:
Switch between the DEVICE and CONTROLLER modes of this system.
DEVICE MODE:
Allows you to set measurement conditions and so forth of this system by
entering the GPIB command from an external unit.
CONTOLLER MODE:
Allows you to control an external device (printer).
TERMINATER:
Set a terminator code used to output data from this system to the outside.
TIME OUT:
Set the maximum transmission/reception wait time when this system is in
the CONTROLLER mode. Setting 0 second causes the system to wait for
transmission/reception for ever.
BAUD RATE:
Set a baud rate.
DATA BITS:
Set a data length.
STOP BIT:
Set a stop bit length.
PARITY:
Make settings related to parity bits.
10-3
Section 10 Hard Copy and Remote Control (Copy/Memory Group)
(3)
Hard copy related setting
Effective key: Ten-key, rotary knob
-HARD COPY- WINDOW
COPY DEVICE:
Set the hard copy output device or output data format.
1. VIDEO OUT:
Selects the video plotter connected to the Separate Video terminal on the
rear panel of the system.
2. ESC/P:
Performs control through the GPIB, RS232C, or Centronics interface and
selects an ESC/P printer.
3. HP:
Performs control through the GPIB, RS232C, or Centronics interface and
selects a HP printer.
4. FD:
Select the mode in which the screen image data is copied to the FD in the
bit-map format.
GPIB ADDRESS:
Set the GPIB address of the copy destination.
FORM FEED:
Make settings related to form feed (excluding VIDEO OUT).
ACTIVE PORT:
Set the control interface used to output data (copy output). (This setting
cannot be made when an optional unit is not installed.)
(4)
Settings related to bit-mapped image data
-BIT MAP- WINDOW
•
COLOR TYPE:
Select a bit-mapped data color.
1. MONOCHROME:
Outputs monochrome (black-and-white) data.
2. COLOR:
Outputs 8-bit (256-color) color data.
COMPRESSION:
Turns on/off data compression. (Effective only for color data)
COPY No.:
Specify the number of the file to copy to the FD (0000-9999). When copying is completed, the file number is updated automatically.
File name extension
Files output to the FD are assigned the following file name extensions:
.bmp : Data has not been compressed.
.rle
: Data has been compressed.
•
File name
The file name format is as follows:
yyddnnnn.bmp (or rle)
yy
: Month of file creation (01 to 12)
dd
: Day of file creation (01 to 31)
nnnn : Four-digit file number (0000 to 9999)
10-4
10.2
•
Making Settings Related to the Hard Copy and Remote Control (Copy, Control, Local)
Directory
Files are created under the ¥MS4630¥ directory.
NOTE:
•
•
10.2.2
If a file of the same file name already exists on the FD, it is overwritten.
The file created on the FD with a file name extension .bmp or .rle cannot be deleted.
Local key
Remote
Local
Cancel the remote state of the GPIB.
Major functions
• Returning to local
•
Making settings related to external interfaces
NOTE:
The menus and the associated functions are the same as those of the
Control
Copy
key.
10-5
Section 10 Hard Copy and Remote Control (Copy/Memory Group)
10.3
Save/
Recall
•
(1)
Save/Recall
Save/recall trace data and measurement conditions in/from an auxiliary storage device.
SAV/RCL (1/2)
INDEX RCL
RECALL
SAVE
MANAGE
DRIVE
etc.
Description of function
Recalls data according to the title label of a file.
Recalls data by entering a file number (00 to 99.)
Displays the window for setting the item and file number to save.
Displays the window for managing files.
Displays the window for selecting a storage.
Switches to the next menu.
SAV/RCL (2/2)
TEXT SAVE
TITLE
---etc.
Description of function
Displays the window for saving the measured waveform as character-string data.
Displays the window for entering and displaying a title label.
Returns to the previous menu.
When an error message is displayed on the screen resulting from operations such as Save and Recall, see (1) Media
related errors of Appendix D Error Message.
Index recall
Recall the index using the title label of the file as the keyword.
-INDEX RECALL- WINDOW
FILE NO & TITLE
Displays the saved file numbers and title labels in a table form.
If there is no file, “UNUSED” is displayed.
When TITLE is set off, “(space)” is displayed.
NOTE:
•
•
(2)
10-6
Select a desired file using the
or
key, then press the Enter key.
Numbers of files that can be recalled by selecting “INDEX RCL” are 00 to 09.
Recall
Directly recall the index by entering the file No. (00 to 99).
Effective key: Ten-key
Performing the recall turns the calibration and normalize functions OFF.
10.3
(3)
Save/Recall
Save
-SAVE- WINDOW
(4)
DATA SIZE:
Display the data size of the item selected to be saved.
CH1 (CH2) SAVE ITEM:
Select an item to save.
PARAM:
Measurement conditions
CAL-DATA:
Calibration data
X-DATA:
Display trace data (TRACE-A, TRACE-B)
S-DATA:
Standard data for normalization (data corresponding to TRACE-A and
TRACE-B)
FREQ-TB:
Frequency table (frequency data corresponding to measurement points)
LEVEL-TB:
Level table corresponding to measurement points used power sweep
RBW-TB:
Table storing the RBWs corresponding to each measurement point
WAIT-TB:
Table storing the user wait time values corresponding to each measurement
point
SAVE FILE No?:
Specify the number of the file to save. (00 to 99)
DELETE FILE No?:
Specify the number of the file to delete. (00 to 99)
Managing the file
-FILE MANAGEMENT- WINDOW
FORMAT & MAKE DIR:
Formats the drive and creates the directory.
MAKE DIR:
Creates the directory for the device on the drive.
DIR:
Displays the directory.
NOTE:
•
•
All the data on the drive which constitutes the formatting target will be lost when the drive is formatted.
Save and Recall will be disabled for the unformatted drive or the drive where no directory for the device has
been created.
10-7
Section 10 Hard Copy and Remote Control (Copy/Memory Group)
(5)
Selecting the drive
Select a drive which will constitute the target of Save, Recall and File Management operations.
Effective key: Ten-key, knob
F5
key
-DRIVE- WINDOW
DRIVE:
1. INT MEN:
Internal memory (Note)
2. FD:
Floppy disk
3. PMC:
Plug in memory card
NOTE:
The drive is not formatted when it is shipped from the factory. Formatting the drive in accordance with the
explanations of (4) Managing the file above is required.
(6)
Saving the measured waveform data as character-string data
Save the measured waveform (trace) on the FD as character-string data.
This data can be output only to the FD. (It cannot be output to the PMC or internal memory.)
Calibration data, S-memory data, and measurement conditions (parameters) cannot be saved as character-string
data.
-TEXT SAVE- WINDOW
•
CH1 X-MEM:
Select/cancel the CH1-side measured waveform as the item to save as character-string data.
CH2 X-MEM:
Select/cancel the CH2-side measured waveform as the item to save as character-string data.
SAVE:
Specify a file number and save the file on the FD.
File name
When SAVE is executed, the following files are created for each measurement channel:
CH1-side measured waveform data file: C1XMEM**.CSV
CH2-side measured waveform data file: C2XMEM**.CSV
** stands for a specified file number (00-99).
10-8
10.3
•
Save/Recall
Types of data to be saved
In the case of single trace (one measured waveform), one type of array data is saved for each measurement channel. In
the case of dual trace (two measured waveforms), two types of array data are saved. Suppose two types of array data
are defined as XA(*) and XB(*), then they will be saved according to the table shown below.
Array data elements range from 0 to the number of measure points minus 1.
Measurement format
LOG MAG
PHASE
DELAY
MAG & PHASE
MAG & DELAY
POLAR
IMPEDANCE CHART
ADMITTANCE CHART
VSWR
LINEAR MAG
LIN & PHASE
LIN & DELAY
REAL
IMAGINARY
REAL & IMAGINARY
LOG Z
LOG Z & θ
Q
LOG Z & Q
Array data XA(*)
LOG MAG measurement data
PHASE measurement data
DELAY measurement data
LOG MAG measurement data
LOG MAG measurement data
X-data of displayed waveform (*1)
X-data of displayed waveform (*1)
X-data of displayed waveform (*1)
VSWR measurement data
LIN MAG measurement data
LIN MAG measurement data
LIN MAG measurement data
REAL measurement data
IMAGIGNARY measurement data
REAL measurement data
Data of displayed waveform (*3)
Data of displayed waveform (*3)
Q measurement data
Data of displayed waveform (*3)
Array data XB(*)
---------------------------------------------------------------------------------------------------------PHASE measurement data
DELAY measurement data
Y-data of measured waveform (*2)
Y-data of measured waveform (*2)
Y-data of measured waveform (*2)
----------------------------------------------------------------------PHASE measurement data
DELAY measurement data
----------------------------------------------------------------------IMAGINARY measurement data
-----------------------------------θ measurement data
-----------------------------------Q measurement data
NOTE:
When two measured waveforms are displayed using the subtrace function, two types array data (XA(*) and
XB(*)) are used.
NOTE:
*1
*2
*3
Value of the real part of the complex data in the circular chart.
Value of the imaginary part of the complex data in the circular chart.
The relationship between the displayed waveform data (XA(*)) and impedance (Z) is as follows.
Z (Ω) =10 (XA(*)/10) / 1000
10-9
Section 10 Hard Copy and Remote Control (Copy/Memory Group)
•
Number of array data items to be saved
Measurement data items between the first measure point and the (number of measure point - 1)th measure point are
saved.
•
Format of data to be saved
One type of array data (XA(*))
XA(0)LF
XA(1)LF
•
X(MEP-1)LF
Two types of array data (XA(*) and XB(*))
XB(0)LF
XB(0)LF
•
X(MEP-1), XB(MEP-1)LF
LF represents a terminal code and MEP represents a number of measure points.
When there are two types of array data, array data items are separated by a comma (,).
-------------------------------------------- Example of output in character data format -------------------------------------------•
Number of measure points: 11
Measurement format: LOG MAG (In the case of single trace, only LOG MAG measurement data is output as array
data XA(*).)
Each LOG MAG
measurement data
- 68.1109LF
- 60.8254LF
- 50.9415LF
- 36.1592LF
- 9.5055LF
- 0.9984LF
- 15.2513LF
- 40.1975LF
- 54.9796LF
- 65.4744LF
- 73.5688LF
10-10
10.3
•
Number of measure points: 11
Measurement format: LOG MAG and PHASE (In the case of dual trace, LOG MAG measurement data is output as
array data XA(*) and PHASE measurement data is output as array data XB(*).)
XA(*): Each LOG MAG
measurement data
- 68.1109
- 60.8254
- 50.9415
- 36.1592
- 9.5055
- 0.9984
- 15.2513
- 40.1975
- 54.9796
- 65.4744
- 73.5688
(7)
Save/Recall
XB(*): Each PHASE
measurement data
166.2703LF
160.9476LF
155.3348LF
138.2429LF
59.1865LF
173.1146LF
- 64.6413LF
- 124.2295LF
- 139.9966LF
- 148.1749LF
- 153.6706LF
Entering the title
STEP1:
STEP2:
STEP3:
STEP4:
Moves the cursor to the character you wish to enter selected from the Character List, using the ten-key or
the rotary knob.
Pressing the Enter key here completes the entry of a character.
Repeat the above operations for the rest of required characters.
When a character string you wish to enter as a title is completed, use the
key to move the cursor to
EXECUTE and press the Enter key.
Now, the title entry has been completed.
10-11
Section 10 Hard Copy and Remote Control (Copy/Memory Group)
10-12 .
Section 11 System
This section explains important functions whose settings need not be changed frequently.
MS4630B
Network Analyzer
10Hz–300MHz
Channels
1
Menu
F1
Meas
Shift
Marker
2
Active
Format
Marker
Fctn
7
8
9
BS
4
5
6
MHz
µsec
1
2
3
kHz
msec
mm
Preset
F2
Measurement
Frequency
Span
F3
System
System
Avg
Remote
Sweep
Out/Input
0
•
+/–
sec
Enter m
F4
Calibration
Utility
Copy/Memory
Control
Limit
Local
F5
Cal
PTA
Scale
Backlight Off
Battery
Busy
Display All
X→S
A
F6
X–S
Filter
Resonator
Active
Trace
Probe
Source
Window Close
Outputs
PMC
Keyboard
0
Save/
Recall
Copy
Display
B
A (Opt B)
B
R
+12V
100mA
Inputs
TA
TB
Max +20dBm
Front panel
Major functions
• Marker setting mode and impedance measurement mode
•
Setting the date and time
•
Displaying the optional unit state
•
Setting a display color
•
Displaying the self-test result
Press the
System
0
key and make various settings using the displayed soft key and menu.
Shift
+
System
Make other system settings and display states.
0
11.1 Switching between Marker Setting Modes (Frequency/Point) ...
11.2 Selecting an Impedance Measurement Method
(Bridge/Transfer Method) ..........................................................
11.3 Setting the Date and Time .........................................................
11.4 Checking Options ......................................................................
11.5 Setting a Display Color ..............................................................
11.6 Displaying a Self-test Result .....................................................
11-2
11-2
11-3
11-3
11-4
11-4
11-1
Section 11 System
11.1
Switching between Marker Setting Modes
(Frequency/Point)
Effective key: Ten-key, rotary knob
SYSTEM
USER
PRESET
CLOCK
OPTION
COLOR
SELF TEST
--
key
Description of function
Allows you to set a marker setting mode and an impedance measurement mode.
-USER PRESET- WINDOW
MKR SETTING MODE:
Set a position/frequency marker.
IMPD MEASURMENT:
~
11.2
Selecting an Impedance Measurement Method
(Bridge/Transfer Method)
Effective key: Ten-key, rotary knob
SYSTEM
USER
PRESET
CLOCK
OPTION
COLOR
SELF TEST
--
key
Description of function
Allows you to set a marker setting mode and an impedance measurement mode.
-USER PRESET- WINDOW
MKR SETTING MODE:
~
IMPD MEASUREMENT:
REFLECTION:
Select a method of measuring impedance using reflection (bridge).
TRANSFER:
Select a method of measuring impedance using transfer (pi circuit jig).
11-2
11.4
11.3
Checking Options
Setting the Date and Time
Effective key: Ten-key
SYSTEM
USER
PRESET
CLOCK
OPTION
COLOR
SELF TEST
--
Description of function
Allows you to set the clock.
-CLOCK- WINDOW
DATE:
Set the Gregorian year, month, and day (yy/mm/dd).
TIME:
Set the hour, minute, and second (hh:mm:ss) based on the 24-hour system.
11.4
Checking Options
SYSTEM
USER
PRESET
CLOCK
OPTION
COLOR
SELF TEST
--
Description of function
Display installation states of optional units.
-OPTION- WINDOW
OPTION:
Display installation states of optional units.
INPUT TBch:
Input port TB
OUTPUT ATT (ELECTRICAL) :
Output attenuator (electrical) (not used now).
OUTPUT ATT (MECHANICAL) :
Output attenuator (mechanical).
OUTPUT DIVIDER:
2-/3-branch output
REF OSC (10 MHZ):
Highly stable reference resonator
PMC DRIVE:
PMC (Plug-in Memory Card)
RS232C/CENTRONICS I/F:
RS232C/Centronics interface
ACCESORY:
Indicates connection states of accessories.
75 Ω ADAPTER:
75 Ω conversion adapter (MA4605A)
11-3
Section 11 System
11.5
Setting a Display Color
Effective key: Ten-key, rotary knob
SYSTEM
USER
PRESET
CLOCK
OPTION
COLOR
SELF TEST
--
Description of function
Allows you to set a display color.
-COLOR- WINDOW
PLANE:
Select an item whose color is to be changed.
COLOR No:
Specify a color with a number (0 to 15).
11.6
Displaying a Self-test Result
SYSTEM
USER
PRESET
CLOCK
OPTION
COLOR
SELF TEST
--
Description of function
Excutes the self diagnosis and displays the results.
-SELF-TEST- WINDOW
This executes the self diagnosis of the equipment interior and displays the result.
11-4 .
Section 12 Measurements
This section gives typical examples of measurements of transfer and reflection characteristics and impedance. For the
calibration to be performed before measurements, see Section 8. For key operations, see Sections 3-7.
All operation procedures covered in this section must start with presetting. Defaults of typical parameters are listed
below. For details on other defaults, see the List of Defaults in Appendix B.
•
Measurement channel .................................... CH1
•
Analysis port .................................................. TA/R
•
Analysis forma ............................................... LOGMAG
•
Number of measurement points .................... 501
•
RBW .............................................................. AUTO
•
Sweep Time ................................................... AUTO
•
Output port ..................................................... B output
•
Output power ................................................. –6 dBm
12.1 Analyzing a Network ..................................................................
12.1.1 Transfer characteristics .................................................
12.1.2 Reflection characteristics ...............................................
12.2 Basics of Measurement .............................................................
12.3 Measuring Transfer Characteristics ..........................................
12.3.1 Measurement of logarithmic magnitude: Single trace ...
12.3.2 Measuring a magnitude and phase simultaneously:
Dual trace ......................................................................
12.3.3 Measuring a group delay ...............................................
12.3.4 Measuring impedance using a transfer method ............
12.4 Measuring Reflection Characteristics ........................................
12.4.1 Measurement of return loss ...........................................
12.4.2 Measuring a reflection coefficient ..................................
12.4.3 Measuring impedance ...................................................
12.5 Measuring Transfer and Reflection Characteristics
Simultaneously (Option 12) .......................................................
12-2
12-2
12-4
12-6
12-7
12-7
12-9
12-10
12-13
12-16
12-16
12-18
12-21
12-24
12.6 Measuring a Filter ...................................................................... 12-27
12.7 Measuring a Resonator ............................................................. 12-29
12-1
Section 12 Measurements
12.1
Analyzing a Network
The network analyzer analyzes a network by measuring its transfer and reflection characteristics using a sine wave.
Transfer characteristics are represented by Etr/Ein (Etr means a transmission voltage and Ein means an input voltage) and
reflection characteristics are represented by Ere/Ein (Ere means a reflection voltage and Ein mean an input voltage). The
transfer and reflection characteristics of the network can be obtained by measuring the ratio between Etr and Ein magnitudes, ratio between Ere and Ein magnitudes, the difference in phase between Etr and Ein, and the difference in phase
between Ere and Ein.
In addition to the basic items, such as an magnitude and phase, that represent transfer and reflection characteristics of a
network, the items listed below which are obtained from the basic items are used. When combined with a reflection
bridge, this system can measure transfer and reflection characteristic. When not combined with a reflection bridge, this
system can measure only transfer characteristics.
Transfer characteristics:
Magnitude
Phase
Group delay time
Transfer coefficient
Impedance
Admittance
Reflection characteristics:
Magnitude
Phase
Reflection coefficient
VSWR
Impedance
Admittance
12.1.1
Transfer characteristics
ER
RO
RO
RO
RO
DUT (device under test)
Measurement of transfer characteristics
12-2
ET
12.1
Analyzing a Network
In the above figure, RO is the characteristic impedance of the measurement system and ER and ET are reference and test
end voltages.
In this case, the transfer coefficient K is found by
ET
K = K ・e jφ = E
................................................................................................................ (A)
R
Where,
|K|: Magnitude ratio,
φ:
Phase difference (rad)
Magnitude A, phase φ, and group delay time τ are found by
A = 20 log10 | K |
(dB) ............................................................................................................ (B)
360
φ
2π
(deg) ............................................................................................................ (C)
θ=
1 ・Δθ
∼ − Δφ
Δω = − 360 Δf
Where,
θ:
∆θ:
(S) .............................................................................................................. (D)
Phase (deg),
ω:
Angular frequency (rad/s)
Phase difference (rad), ∆f: Frequency difference (Hz)
The magnitude and phase are measured directly and displayed on the screen. The absolute value of the transfer coefficient is calculated from equation (B).
The group delay time is calculated from equation (D) after obtaining the difference in phase Dq between
Δf
Δf
f 0+
,f 0 −
.
2
2
∆f is determined by
Δf=(Frequency span[Hz])×
(Delay aperture[%])
100
Aperture setting for group delay time measurement
(f2−f0)
f0 f1 f2
Frequency
∆f
θ0
∆θ
θ2
θ
12-3
Section 12 Measurements
12.1.2
Reflection characteristics
ER
RO
RO
Reflection bridge
RO
RO
ET
DUT
Measurement of reflection characteristics
In the above figure, RO is the characteristic impedance of the measurement system and ER and ET are reference and test
end voltages.
In this case, the reflection coefficient Γ is found by
ET
Γ= Γ ・e jφ = E
................................................................................................................ (A)
R
Where,
| Γ | : Magnitude ratio,
φ:
Phase difference (rad)
The return loss is expressed as follows:
δ = 20 log | Γ |
(dB) ............................................................................................................ (B)
θ=
360
φ
2π
(deg) ............................................................................................................ (C)
The return loss and phase are measured directly and displayed on the screen. The absolute value of the reflection coefficient is calculated from equation (B).
Using the reflection coefficient Γ, the impedance and admittance are found by
Z x = Z x e jθ’=
1+Γ
・ R O = R x + jXx ................................................................................................... (D)
1–Γ
RX = Re (ZX)
XX = Im (ZX)
This is expressed by the following series equivalent circuit:
RX
L=XX/ω
RX
Series equivalent circuit (impedance)
12-4
C=1/XX•ω
12.1
Analyzing a Network
The Q and D of the inductance or capacitance of this circuit are expressed as follows:
Q=
D=
XX
RX
................................................................................................................................................................ (E)
1
.................................................................................................................................................................. (F)
Q
Yx = Yx e jθ”=
1–Γ 1
1
・
=
Z x 1+Γ R O = Gx + jB x ........................................................................................ (G)
GX = Re (YX)
BX = Tm (YX)
This can be expressed by the following parallel equivalent circuit:
R=I/GX
R=I/GX
L=I/BX•ω
C=BX•ω
Parallel equivalent circuit (admittance)
The Q and D of the inductance or capacitance of this circuit are expressed as follows:
Q=
D=
GX
BX
................................................................................................................................................................ (H)
1
................................................................................................................................................................... (I)
Q
When negative resistances are measured, the above values are expressed as follows:
• |Γ|>1
• GX < 0
• Q<0
• D<0
• | Z | ∠θ’ 90˚ < θ’ <180˚ or –90˚ > θ’ > –180˚
• RX<0
• | Y | ∠θ” 90˚ < θ” <180˚ or –90˚ > θ” > –180˚
12-5
Section 12 Measurements
12.2
Basics of Measurement
This section explains important basic items that must be set in addition to measurement items.
(1)
Dynamic range
(a) Dynamic range
A dynamic range is defined from the maximum input level to the average noise level. “Maximum input level”
does not mean the absolute maximum rating specified for protecting the system but it means the maximum
input level specified for maintaining the linearity of the receiver circuit (i.e., input range of each reception
port). To make measurements accurately, a sufficient dynamic range must be allocated for the DUT and the
highest possible part of the dynamic range must be used.
(b) Output power and input attenuator
To use the highest possible part of the dynamic range, adjust the output power to the input range when measuring an ordinary passive circuit. When measuring a passive circuit which requires a large insertion loss and
wide dynamic range, increase the output power to the maximum so that overload does not occur. However,
the output level must be lowered to the input range when calibrating the measuring system.
For a DUT which has a gain (e.g., amplifier), the output power must be lowered below the input attenuator
level by the gain. If the input range of the receiver circuit is exceeded, the OVER message lamp lights.
Reduce the test port power or increase the input range.
(c) Resolution bandwidth (RBW)
The average noise level of the receiver circuit is determined by the resolution bandwidth (RBW). The resolution bandwidth must be selected according to the dynamic range.
(2)
Sweep time and number of measurement points
(a) Sweep time
The narrower the resolution bandwidth, the longer the sweep time. Normally, an optimum sweep time is
automatically set according to the resolution bandwidth.
(b) Number of measurement points
Short sweep times are required, for example, when adjusting a DUT. You can select the number of measurement points out of 11, 21, 51, 101, 251, 501, and 1001. To reduce the sweep time, decrease the number of
measurement points.
12-6
12.3
12.3
Measuring Transfer Characteristics
Measuring Transfer Characteristics
Transfer characteristics are the most basic measurement items used for network analysis. Using a band pass filter with a
center frequency of 90 MHz, carry out the following measurements:
•
•
•
Measurement of logarithmic magnitude: Single trace
Simultaneous measurement of magnitude and phase: Dual trace
Measurement of impedance by transfer method
12.3.1
Measurement of logarithmic magnitude: Single trace
When measuring the logarithmic magnitude, select LOGMAG as an analysis format. When this format is selected, the Xaxis represents frequencies and the Y-axis represents magnitude ratios in dB.
(1)
Setup
MS4630B
Network Analyzer
10Hz–300MHz
Channels
1
Menu
F1
Meas
Shift
Marker
2
Active
Marker
Format
Fctn
7
8
9
BS
4
5
6
MHz
µsec
1
2
3
kHz
msec
mm
•
+/–
Preset
F2
Measurement
Frequency
Span
F3
System
Avg
Remote
Sweep
Out/Input
0
sec
Enter m
F4
Calibration
Utility
Copy/Memory
Control
Limit
Local
F5
Cal
F6
Scale
Backlight Off
Battery
Busy
Display All
X→S
X–S
Filter
Resonator
Active
Trace
Probe
Source
Window Close
Outputs
PMC
Save/
Recall
Copy
Display
B
A
PTA
Keyboard
A (Opt B)
B
R
+12V
100mA
Inputs
TA
TB
Max +20dBm
DUT
Through line
12-7
Section 12 Measurements
(2)
Measurement procedure
Step
Description of operation
1
Configure a measuring system to which a DUT (device under test) is connected, according to the Setup
Drawing.
2
Press
eter:
3
4
Out/Input
POWER:
0 dB
Press
eter:
in the Measurement group. Press the
Frequency
POWER
soft key and set the following param-
CENTER
soft key and set the following param-
CENTER:
90 MHz
Press
in the Measurement group and set the following parameter:
Span
SPAN:
12-8
in the Measurement group. Press the
100 kHz
5
Disconnect the DUT from the measuring system and connect a through line.
6
Press
7
Disconnect the through line from the measuring system and reconnect the DUT.
8
Press Scale in the Display group. Using soft keys, adjust the scale and offset so that the trace waveform
is displayed at the optimum position on the screen.
X→S
to perform normalization. (The
X→S
key lamp lights.)
12.3
12.3.2
Measuring Transfer Characteristics
Measuring a magnitude and phase simultaneously: Dual trace
Measure the magnitude in the analysis format, MAG & PHA mode.
Trace A indicates the logarithmic magnitude and trace B indicates the phase.
(1)
Setup
MS4630B
Network Analyzer
10Hz–300MHz
Channels
1
F1
Shift
Marker
2
Menu
Meas
Active
Marker
Format
Fctn
7
8
9
BS
4
5
6
MHz
µsec
1
2
3
kHz
msec
mm
•
+/–
Preset
F2
Measurement
Frequency
Span
F3
System
Avg
Remote
Sweep
Out/Input
0
sec
Enter m
F4
Calibration
Utility
Copy/Memory
Control
Limit
Local
F5
Cal
X→S
PTA
A
F6
Display All
Filter
Resonator
Save/
Recall
Copy
Display
B
Scale
Backlight Off
Battery
Busy
X–S
Active
Trace
Probe
Source
Window Close
Outputs
Keyboard
PMC
A (Opt B)
B
R
+12V
100mA
Inputs
TA
TB
Max +20dBm
Through line
DUT
(2)
Measurement procedure
Step
Description of operation
1
Configure a measuring system to which a DUT (device under test) is connected, according to the Setup
Drawing.
2
Press
3
Press Out/Input in the Measurement group. Press the
eter:
POWER:
0 dBm
POWER
soft key and set the following param-
4
Press Frequency in the Measurement group. Press the
eter:
CENTER: 90 MHz
CENTER
soft key and set the following param-
5
Press
Format
Span
SPAN:
in the Channels group. Press the MAG & PHA soft key.
in the Measurement group and set the following parameter:
100 kHz
6
Disconnect the DUT from the measuring system and connect a through line.
7
Press
8
Disconnect the through line from the measuring system and reconnect the DUT.
9
Make sure the A lamp on
X→S
to perform normalization. (The
A
X–S
lamp lights.)
B
Active
in the Display group is lit, then press
Scale
. Using soft keys, adjust the
scale and offset so that the trace A waveform (magnitude) is displayed at the optimum position on the
screen.
12-9
Section 12 Measurements
Step
Description of operation
A
10
Press
B
Active
in the Display group to turn on the B lamp, then press
Scale
. Using soft keys, adjust the
scale and offset so that the trace B waveform (phase) is displayed at the optimum position on the screen.
12.3.3
Measuring a group delay
Group delay τ is obtained by calculating the difference in phase between the aperture frequency and ∆f from the following
equation:
τ=
1
2π
Δθ
Δf
On this system, do not specify ∆f directly but specify a delay aperture (ratio (%) to the frequency span). To minimize the
measurement error, make settings so that the best resolution and the maximum delay can be obtained at the minimum
smoothing aperture (%).
12-10
12.3
(1)
Measuring Transfer Characteristics
Setup
MS4630B
Network Analyzer
10Hz–300MHz
Channels
1
Menu
F1
Meas
Shift
Marker
2
Active
Marker
Format
Fctn
7
8
9
BS
4
5
6
MHz
µsec
1
2
3
kHz
msec
mm
•
+/–
Preset
F2
Measurement
Frequency
Span
F3
System
Avg
Remote
Sweep
Out/Input
0
sec
Enter m
F4
Calibration
Utility
Copy/Memory
Control
Limit
Local
F5
Cal
PTA
F6
Scale
Backlight Off
Battery
Busy
Display All
X→S
X–S
Filter
Resonator
Save/
Recall
Copy
Display
B
A
Active
Trace
Probe
Source
Window Close
Outputs
Keyboard
PMC
A (Opt B)
B
R
+12V
100mA
Inputs
TA
TB
Max +20dBm
Through line
DUT
(2)
Measurement procedure
Step
Description of operation
1
Configure a measuring system to which a DUT (device under test) is connected, according to the Setup
Drawing.
2
Press
3
Press Out/Input in the Measurement group. Press the
eter:
POWER:
0 dBm
POWER
4
Press Frequency in the Measurement group. Press the
eter:
CENTER: 90 MHz
CENTER
5
Press
Format
Span
SPAN:
6
Press
eter:
RBW:
in the Channels group. Press the
DELAY
soft key.
soft key and set the following param-
soft key and set the following param-
in the Measurement group and set the following parameter:
50 kHz
Avg
in the Measurement group. Press the
RBW
soft key and set the following param-
1 kHz
7
Disconnect the DUT from the measuring system and connect a through line.
8
Press
Cal
, then press the
RESPONSE
soft key. A sweep is performed to obtain CAL data, then the
-default-
RESPONSE
RESPONSE
soft key changes to the -createdsoft key.
-defaultCAL ON
9
Press the
soft key. The calibration function is turned on.
10
Disconnect the through line from the measuring system and reconnect the DUT.
12-11
Section 12 Measurements
Step
11
Description of operation
Press
Scale
DELAY
in the Measurement group. Pressing the APERTURE soft key allows you to enter a
smoothing aperture value.
To minimize the measurement error, enter the minimum value (%) which will maximize the peak values
(marked with
) on the waveform.
12
Press Scale in the Display group. Using soft keys, adjust the scale and offset so that the trace waveform
is displayed at the optimum position on the screen.
NOTE:
The minimum smoothing aperture value and the setting resolution depend on the number of measurement points.
12-12
12.3
12.3.4
Measuring Transfer Characteristics
Measuring impedance using a transfer method
This system can measure impedance using two methods: a method by which a reflection characteristic is measured using
a reflection bridge and a method by which a transfer characteristic is measured. This section explains the procedure for
measuring impedance using the latter method (transfer method).
When the transfer method is used, a pi network jig is used normally. Let’s measure the impedance of the 1 µH inductance
using a pi network jig whose measurement terminal impedance is 12.5 Ω and obtain the R-L (or C) series equivalent
constant.
(1)
Setup
MS4630B
Network Analyzer
10Hz–300MHz
Channels
1
Menu
F1
Meas
Shift
Marker
2
Active
Marker
Format
Fctn
7
8
9
BS
4
5
6
MHz
µsec
1
2
3
kHz
msec
mm
•
+/–
Preset
F2
Measurement
Frequency
Span
F3
System
Avg
Remote
Sweep
Out/Input
0
sec
Enter m
F4
Calibration
Utility
Copy/Memory
Control
Limit
Local
F5
Cal
PTA
A
F6
Scale
Backlight Off
Battery
Busy
Display All
X→S
X–S
Filter
Resonator
Active
Trace
Probe
Source
Window Close
Outputs
PMC
Save/
Recall
Copy
Display
B
Keyboard
A (Opt B)
B
R
+12V
100mA
Inputs
TA
TB
Max +20dBm
Pi network jig
DUT
12-13
Section 12 Measurements
(2)
Measurement procedure
Step
1
Description of operation
Press
Shift
, then press
USER
PRESET
Press the
System
0
(SYSTEM) on the numeric keypad.
soft key and select TRANSFER (transfer method) for IMPD MEASURE-
MENT.
NOTE:
The contents of SYSTEM do not change if presetting is performed.
2
Configure a measuring system to which a DUT (device under test) is connected, according to the Setup
Drawing.
3
Press Format in the Channels group. Press the
pedance chart).
4
Press
etc.
and set the following parameter:
REFERENCE IMPEDANCE:
Press Avg in the Measurement group. Press
RBW: 1 kHz
6
Press
Frequency
8
Span
RBW
and set the following parameter:
1 MHz
in the Measurement group and set the following parameter:
50 MHz
setup
soft key.
←
Select CAL METHOD from the CALIBRATION window, then press
Press
Cal
, then press the
9
Select PI-NET from the CAL METHOD window, then press
10
Disconnect the DUT from the measuring system.
Press
the
11
Cal
, then press the
OPEN
-default-
OPEN
-default-
soft key changes to the
SHORT
-default-
soft key changes to the
CAL ON
Enter
Enter
.
.
soft key. A sweep is performed to obtain CAL data, then
OPEN
-created-
Connect a jumper pin (0 Ω) to the pi network and press
the
SHORT
-created-
soft key.
OPEN
-default-
. A sweep is performed and
soft key.
12
Press the
13
Disconnect the jumper pin from the measuring system and reconnect the DUT.
12-14
REF IMPD ,
in the Measurement group. Using a soft key, set the following parameter:
START:
Press
STOP:
soft key once, press
12.5 Ω
5
7
etc.
in the Measurement group. Press the
Out/Input
soft key once to select IMPD CHART (im-
soft key. The calibration function is turned on.
12.3
Step
Measuring Transfer Characteristics
Description of operation
14
Press Marker in the Marker group and adjust the marker to the frequency at which impedance is to be
measured. The impedance at the marker point is displayed as “_Ω_deg”.
15
Change the marker value to the R-L (or C) series equivalent constant.
Press
16
Format
in the Channels group, then press the ←
more
soft key.
Select Rs/Ls or Cs for IMPD MKR FORMAT for IMPD CHART in the FORMAT window, then press the
“Enter” key.
The marker will change to “_Ω/_H(or F)”.
12-15
Section 12 Measurements
12.4
Measuring Reflection Characteristics
If the input impedance of a test device is different from the impedance of the measuring system when incident energy is
applied to the input terminal on the test device, part of the energy is reflected. The ratio of the reflected energy to the
incident energy is called a reflection coefficient, providing the standard for reflection measurement. For example, calculating the logarithm of the absolute value of the reflection coefficient gives a return loss. If a reflection coefficient is
known, a VSWR can be calculated from (1 + Absolute value of reflection coefficient)/(1 - Absolute value of reflection
coefficient). To calibrate the reflection measurement result, 1PORT OSL calibration can be used in addition to RESPONSE calibration. Let’s carry out the following measurements using a band pass filter with a center frequency of 90
MHz:
•
Measurement of return loss
•
Measurement of reflection coefficient
•
Measurement of impedance
•
Measurement of VSWR
12.4.1
Measurement of return loss
Select a LOGMAG as an analysis format. When this format is selected, the ratio of reflected energy to incident energy is
measured in dB, allowing you to read the return loss directly.
In the measurement procedure described below, RESPONSE calibration is used.
(1)
Setup
MS4630B
Network Analyzer
10Hz–300MHz
Channels
1
Menu
F1
Meas
Shift
Marker
2
Active
Marker
Format
Fctn
7
8
9
BS
4
5
6
MHz
µsec
1
2
3
kHz
msec
mm
•
+/–
Preset
F2
Measurement
Frequency
Span
F3
System
Avg
Remote
Sweep
Out/Input
0
sec
Enter m
F4
Calibration
Utility
Copy/Memory
Control
Limit
Local
F5
Cal
PTA
A
F6
Scale
Backlight Off
Battery
Busy
Display All
X→S
X–S
Filter
Resonator
Active
Trace
Probe
Source
Window Close
Outputs
PMC
Save/
Recall
Copy
Display
B
Keyboard
A (Opt B)
B
R
+12V
100mA
Inputs
TA
TB
Max +20dBm
Reflection bridge
OPEN
DUT
12-16
Openterminator
DUT
12.4
(2)
Measuring Reflection Characteristics
Measurement procedure
Step
Description of operation
1
Configure a measuring system to which a DUT (device under test) is connected, according to the Setup
Drawing.
2
Press
Frequency
in the Measurement group. Press the
eter:
CENTER:
CENTER
soft key and set the following param-
90 MHz
3
Press
SPAN:
4
Press Avg in the Measurement group. Press the
eter:
RBW: 1 kHz
5
Disconnect the DUT from the measuring system and connect a open terminator.
Press
the
Span
Cal
in the Measurement group and set the following parameter:
100 kHz
, then press the
RBW
soft key and set the following param-
RESPONSE
soft key. A sweep is performed to obtain CAL data, then
-default-
RESPONSE
RESPONSE
soft
key
changes
to
the
soft key.
-default-created-
CAL ON
6
Press the
soft key. The calibration function is turned on.
7
Disconnect the open terminator from the measuring system and reconnect the DUT.
8
Press the Scale key in the Display group. Using soft keys, adjust the scale and offset so that the trace
waveform is displayed at the optimum position on the screen.
12-17
Section 12 Measurements
12.4.2
Measuring a reflection coefficient
When measuring a reflection coefficient, select a LIN MAG format and polar coordinate graph. In the LIN MAG mode,
the ratio of reflected energy to incident energy is measured linearly, allowing you to read the absolute value of the
reflection coefficient directly. The polar coordinate graph allows the complex reflection coefficient Γ=ρ∠θ (ρ = absolute
value of reflection coefficient, θ = phase angle) to be measured at the same time. Since the polar coordinate system does
not have a frequency axis, use the marker to read frequencies. In the measurement procedure described below, 1PORT
OSL calibration is used.
(1)
Setup
MS4630B
Network Analyzer
10Hz–300MHz
Channels
1
Menu
F1
Meas
Shift
Marker
2
Active
Marker
Format
Fctn
7
8
9
BS
4
5
6
MHz
µsec
1
2
3
kHz
msec
mm
•
+/–
Preset
F2
Measurement
Frequency
Span
F3
System
Avg
Remote
Sweep
Out/Input
0
sec
Enter m
F4
Calibration
Utility
Copy/Memory
Control
Limit
Local
F5
Cal
PTA
A
F6
Scale
Backlight Off
Battery
Busy
Display All
X→S
X–S
Filter
Resonator
Active
Trace
Probe
Source
Window Close
Outputs
PMC
Save/
Recall
Copy
Display
B
Keyboard
A (Opt B)
B
R
+12V
100mA
Inputs
TA
TB
Max +20dBm
Reflection bridge
• Standard
OPEN
Open terminator
SHORT
Short terminator
LOAD
50Ω
• DUT
12-18
DUT
Load
(50-ohm terminator)
DUT
12.4
(2)
Measuring Reflection Characteristics
Measurement procedure
Step
Description of operation
1
Configure a measuring system to which a DUT (device under test) is connected, according to the Setup
Drawing.
2
Press
Format
Press the
in the Measurement group, then press the “more” soft key.
etc.
Select “<LIN MAG>” as a format, then press
3
Press
Frequency
Press
SPAN:
5
Press
Span
Avg
Press
to open the FORMAT window.
.
CENTER
soft key and set the following param-
90 MHz
in the Measurement group and set the following parameter:
100 kHz
RBW
in the Measurement group. Press the
eter:
RBW:
6
Enter
in the Measurement group. Press the
eter:
CENTER:
4
more
soft key once and press ←
soft key and set the following param-
1 kHz
Cal
, then press the ←
setup
soft key.
Select CAL METHOD from the CALIBRATION window, then press
Enter
.
7
Select 1PORT OSL from the CAL METHOD window, then press
8
Disconnect the DUT from the measuring system and connect an open terminator.
Press
the
Cal
, then press the
OPEN
-default-
OPEN
-default-
soft key changes to the
Enter
.
soft key. A sweep is performed to obtain CAL data, then
OPEN
-created-
SHORT
-default-
soft key.
9
Connect a short terminator and press
10
Connect a load (50 Ω terminator) and press
11
Press the
12
Disconnect the open terminator from the measuring system and reconnect the DUT.
CAL ON
.
LOAD
-default-
.
soft key. The calibration function is turned on.
12-19
Section 12 Measurements
Step
13
Description of operation
Press the
Scale
key in the Display group. Using soft keys, adjust the scale and offset so that the trace
waveform is displayed at the optimum position on the screen.
14
12-20
Switch the display format to the polar coordinate format.
Press Format in the Channels group, then press
. If
is not displayed on the
POLAR
POLAR
current screen, press
once.
etc.
The readings of the active marker are measured values (absolute value of reflection coefficient and phase
angle).
12.4
12.4.3
Measuring Reflection Characteristics
Measuring impedance
Measure the impedance of the device consisting of both resistance and reactance components and display it in the IMPD
more
, then press the ←
soft key to display the FORMAT window. In the
FORMAT window, select “1. Z∠θ”, “2. Rs/Ls”, Cs”, “3. Q/D”, or “4. R+jX” from the IMPD MARKER FORMAT for
IMPD CHART menu. Then, the result of measurements at the active marker appears. In the measurement procedure
described below, 1PORT OSL calibration is used.
format (Smith chart). Press
(1)
Format
Setup
MS4630B
Network Analyzer
10Hz–300MHz
Channels
1
Menu
F1
Meas
Shift
Marker
2
Active
Marker
Format
Fctn
7
8
9
BS
4
5
6
MHz
µsec
1
2
3
kHz
msec
mm
•
+/–
Preset
F2
Measurement
Frequency
Span
F3
System
Avg
Remote
Sweep
Out/Input
0
sec
Enter m
F4
Calibration
Utility
Copy/Memory
Control
Limit
Local
F5
Cal
PTA
F6
Scale
Backlight Off
Battery
Busy
Display All
X→S
X–S
Filter
Resonator
Active
Trace
Probe
Source
Window Close
Outputs
PMC
Save/
Recall
Copy
Display
A
B
Keyboard
A (Opt B)
B
R
+12V
100mA
Inputs
TA
TB
Max +20dBm
Reflection bridge
• Standard
OPEN
Open terminator
SHORT
Short terminator
LOAD
50Ω
DUT
• DUT
Load
(50-ohm terminator)
DUT
SMA(M)
12-21
Section 12 Measurements
(2)
Measurement procedure
Step
1
Description of operation
Shift
Press
Press the
, then press
USER
PRESET
System
0
(SYSTEM) on the numeric keypad.
soft key and select REFLECTION (reflection method) for IMPD MEASURE-
MENT.
NOTE:
The contents of SYSTEM do not change if presetting is performed.
2
Configure a measuring system to which a DUT (device under test) is connected, according to the Setup
Drawing.
3
Press
4
Using the keys in the Measurement group and soft keys, set the following parameters:
CENTER:
90 MHz
5
Format
SPAN:
100 kHz
RBW:
1 kHz
Press
Cal
etc.
in the Channels group. Press the
, then press the ←
setup
soft key once to select
soft key.
Select CAL METHOD from the CALIBRATION window, then press
Enter
.
6
Select 1PORT OSL from the CAL METHOD window, then press
7
Disconnect the DUT from the measuring system and connect an open terminator.
Press
the
Cal
, then press the
OPEN
-default-
OPEN
-default-
soft key changes to the
Enter
.
soft key. A sweep is performed to obtain CAL data, then
OPEN
-created-
SHORT
-default-
soft key.
8
Connect a short terminator and press
9
Connect a load (50 Ω terminator) and press
10
Press the
11
Disconnect the open terminator from the measuring system and reconnect the DUT.
12
Press
Format
CAL ON
12-22
.
LOAD
-default-
.
soft key. The calibration function is turned on.
in the Channels group, then press ←
current screen, press
IMPD CHART .
etc.
once.
more
. If ←
more
is not displayed on the
12.4
Step
13
Measuring Reflection Characteristics
Description of operation
In the FORMAT window, select “1. Z∠θ”, “2. Rs/Ls”, Cs”, “3. Q/D”, or “4. R+jX” from the IMPD
MARKER FORMAT for IMPD CHART menu. Then, the result of measurements at the active marker
appears.
1. Z∠θ ................... Absolute value of impedance/phase angle of impedance
2. Rs/Ls, Cs ........... Series resistance/series inductance or series capacitance
3. Q/D .................... Q/tan δ of resonator circuit
4. R + jX ................ Impedance resistance/reactance
The readings of the active marker are measured values (absolute value of reflection coefficient and phase
angle).
12-23
Section 12 Measurements
12.5
Measuring Transfer and Reflection Characteristics
Simultaneously (Option 12)
When this system is equipped with option 12 (3-channel receiver), connecting a reflection bridge to this system allows
you to measure both transfer and reflection characteristics of the DUT at the same time.
Select CH1&CH2 (Dual CH measurement) as the measurement channel. Measure the reflection characteristic on the
CH1 side. Measure the transfer characteristic on the CH2 side. As the output of the reflection bridge is connected to the
reception port TA and the output of the DUT is connected to the reception port TB, the analysis port of CH1 must be
connected to TA/R and the analysis port of CH2 must be connected to TB/R.
(1)
Setup
MS4630B
Network Analyzer
10Hz–300MHz
Channels
1
Menu
F1
Meas
Shift
Marker
2
Active
Marker
Format
Fctn
7
8
9
BS
4
5
6
MHz
µsec
1
2
3
kHz
msec
mm
•
+/–
Preset
F2
Measurement
Frequency
Span
F3
System
Avg
Remote
Sweep
Out/Input
0
sec
Enter m
F4
Calibration
Utility
Copy/Memory
Control
Limit
Local
F5
Cal
PTA
A
F6
Scale
Backlight Off
Battery
Busy
Display All
X→S
X–S
Filter
Resonator
Active
Trace
Probe
Source
Window Close
Outputs
PMC
Save/
Recall
Copy
Display
B
Keyboard
A (Opt B)
B
R
+12V
100mA
Inputs
TA
TB
Max +20dBm
Through line
THROUGH
Reflection bridge
DUT
OPEN
Open terminator
SHORT
Short terminator
LOAD
50Ω
12-24
Load
(50-ohm terminator)
12.5
(2)
Measuring Transfer and Reflection Characteristics Simultaneously (Option 12)
Measurement procedure
Step
Description of operation
1
Configure a measuring system to which a DUT (device under test) is connected, according to the Setup
Drawing.
2
Press
3
Make sure the CH1-side lamp on the
Menu
in the Channel group, then press CH1 & CH2 .
B
A
nels group, then press
TA/R
Active
Meas
B
Active
to turn on the CH1-side lamp.
B
A
4
Press
5
Press
6
Using the keys in the Measurement group and soft keys, set the following parameters:
7
Active
Trace
to turn on the CH2-side lamp (to activate CH2), press
, then press
Meas
90 MHz
SPAN:
100 kHz
RBW:
1 kHz
setup
, then press ←
.
Select CAL METHOD from the CALIBRATION window, then press the
.
Cal
Enter
key.
8
Select 1PATH 2PORT from the CAL METHOD window, then press the
9
Press
10
Disconnect the DUT from the measuring system and connect an open terminator.
A
Enter
key.
B
Active
Press
the
TB/R
in the Display group, then press SPLIT DISP .
CENTER:
Press
key in the Chan-
.
A
When the CH2-side lamp is lit, press
key is lit (CH1 is active), press the
Cal
in the Channels group to activate CH1.
, then press the
OPEN
-default-
OPEN
-default-
soft key. A sweep is performed to obtain CAL data, then
soft key changes to the
SHORT
-default-
11
Connect a short terminator and press
12
Connect a load (50-Ω terminator) and press
13
Press
A
OPEN
-created-
soft key.
.
LOAD
-default-
.
B
Active
in the Channels group to activate CH2.
Disconnect the DUT, connect a through line, and press
CAL ON
A
soft key, press
THRU
-default-
B
14
Press the
15
The calibration function is turned on.
Disconnect the through line and reconnect the DUT.
Active
, then press
.
CAL ON
(for both CH1 and CH2).
12-25
Section 12 Measurements
Step
16
Description of operation
Press the Scale key in the Display section. Using soft keys, adjust the scale and offset so that the trace
waveform is displayed at the optimum position on the screen.
NOTE:
To use the 1PATH 2PORT calibration method, be sure to perform the following operations:
•
•
•
•
•
•
12-26
Select CH1 & CH2 (dual channel measurement) as measurement channels and set on “COUPLED CHANNEL.”
Select TA/R as the CH1-side analysis port to measure the reflection characteristic.
Select TB/R as the CH2-side analysis port to measure the transfer characteristic.
To obtain OPEN, SHORT, or LOAD calibration data, select CH1 as the active channel. To obtain THROUGH
calibration data, select CH2 as the active channel.
Select CAL ON (calibration start) for individual channels.
Select CAL ON both CH1 and CH2.
12.6
12.6
Measuring a Filter
Measuring a Filter
You can measure a filter using the filter analysis function, a feature of this system.
Measure a 90-MHz band pass filter to analyze the following:
•
Bandwidth at a 3 dB down point from 90 MHz
•
Bandwidth at a 40 dB down point from 90 MHz
•
Insertion loss at 90 MHz
•
Center frequency of filter
•
Q value
•
Shape factor
(1)
Setup
MS4630B
Network Analyzer
10Hz–300MHz
Channels
1
Menu
F1
Meas
Shift
Marker
2
Active
Marker
Format
Fctn
7
8
9
BS
4
5
6
MHz
µsec
1
2
3
kHz
msec
mm
•
+/–
Preset
F2
Measurement
Frequency
Span
F3
System
Avg
Remote
Sweep
Out/Input
0
sec
Enter m
F4
Calibration
Utility
Copy/Memory
Control
Limit
Local
F5
Cal
F6
Scale
Backlight Off
Battery
Busy
Display All
X→S
X–S
Filter
Resonator
Active
Trace
Probe
Source
Window Close
Outputs
A (Opt B)
Keyboard
PMC
Save/
Recall
Copy
Display
B
A
PTA
B
R
+12V
100mA
Inputs
TA
TB
Max +20dBm
DUT
(2)
Through line
Measurement procedure
Step
Description of operation
1
Configure a measuring system to which a DUT (device under test) is connected, according to the Setup
Drawing.
2
Using the keys in the Measurement group and soft keys, set the following parameters:
3
CENTER:
90 MHz
SPAN:
RBW:
100 kHz
1 kHz
Disconnect the DUT from the measuring system and connect a through line.
Press
the
Cal
, then press the
RESPONSE
soft key. A sweep is performed to obtain CAL data, then
-default-
RESPONSE
RESPONSE
soft key changes to the -createdsoft key.
-default-
12-27
Section 12 Measurements
Step
Description of operation
CAL ON
4
Press the
soft key. The calibration function is turned on.
5
Disconnect the through line and reconnect the DUT.
6
Press
7
In the FILTER ANALYSIS window, set the following parameters:
Limit
Filter
in the Utility group, then press ←
FILTER CF:
90 MHz
REF for IL CALC:
FILTER CF
BW REF:
FILTER CF
X1dB DOWN:
3 dB
X2dB DOWN:
40 dB
RPL SEARCH START: 89.995 MHz
RPL SEARCH END: 90.005 MHz
RPL RESOLUTION: 0.020 dB
FREQ DISP DIGITS: 6
8
12-28
Press
ANALYSIS
ON/OFF
to set it on.
setup
.
12.7
12.7
Measuring a Resonator
Measuring a Resonator
You can measure a resonator using the resonator analysis function, a feature of this system.
Using a pi network jig whose measurement terminal impedance is 12.5 Ω, measure a 20 MHz crystal resonator to analyze
the following:
•
Resonance frequency and impedance (Fr, Zr)
•
Antiresonance frequency and impedance (Fa, Za)
•
Series resonance frequency (Fs)
•
Four-element equivalent circuit (R1, C1, L1, C0)
•
Q
(1)
Setup
MS4630B
Network Analyzer
10Hz–300MHz
Channels
1
Menu
F1
Meas
Shift
Marker
2
Active
Marker
Format
Fctn
7
8
9
BS
4
5
6
MHz
µsec
1
2
3
kHz
msec
mm
•
+/–
Preset
F2
Measurement
Frequency
Span
F3
System
Avg
Remote
Sweep
Out/Input
0
sec
Enter m
F4
Calibration
Utility
Copy/Memory
Control
Limit
Local
F5
Cal
F6
Scale
Backlight Off
Battery
Busy
Display All
X→S
X–S
Filter
Resonator
Active
Trace
Probe
Source
Window Close
Outputs
PMC
Save/
Recall
Copy
Display
B
A
PTA
Keyboard
A (Opt B)
B
R
+12V
100mA
Inputs
TA
TB
Max +20dBm
Pi network jig
DUT
12-29
Section 12 Measurements
(2)
Measurement procedure
Step
1
Description of operation
USER
PRESET to display the USER PRESET window,
then select TRANSFER (transfer method) for IMPD MEASUREMENT.
Shift
Press
, then press
System
0
(SYSTEM). Press
NOTE:
The contents of SYSTEM do not change if presetting is performed.
2
Configure a measuring system to which a DUT (device under test) is connected, according to the Setup
Drawing.
3
Press
Format
etc.
in the Channels group. Press the
open the FORMAT window.
Select <LOG Z & θ> for FORMAT, then press the
soft key once, then press ←
etc.
Press Out/Input in the Measurement group. Press
to 12.5 Ω.
5
Using the keys in the Measurement group and soft keys, set the following parameters:
6
20 MHz
SPAN:
100 kHz
RBW:
300 kHz
POWER:
0 dBm
Press
Cal
press
Enter
, then press ←
setup
once to set REFERENCE IMPEDANCE
. Select CAL METHOD from the CALIBRATION window, then
.
7
Select PI NET from the CAL METHOD window, then press
8
Disconnect the DUT from the pi network and press
OPEN
-default-
data, then the
9
SHORT
-default-
soft key changes to the
soft key changes to the
CAL ON
SHORT
-created-
10
Press the
11
Disconnect the jumper pin and reconnect the DUT.
12
Press
12-30
Resonator
Enter
OPEN
-default-
Connect a jumper pin (0 Ω) to the pi network and press
the
to
key.
Enter
4
CENTER:
more
.
. A sweep is performed to obtain CAL
OPEN
-createdSHORT
-default-
soft key.
. A sweep is performed and then
soft key.
soft key. The calibration function is turned on.
in the Utility group, then press ←
setup
.
12.7
Step
13
Measuring a Resonator
Description of operation
In the RESONATOR ANALYSIS window, set the following parameters:
START FREQ:
19.95 MHz
ENDFREQ:
20.05 MHz
FREQ DISP DIGITS:
8
14
Press
15
Press
RESON2 .
ANALYSIS
ON/OFF
to set it on.
12-31
Section 12 Measurements
12-32 .
Section 13 Performance Tests
This section explains the measuring devices, setup, and procedures for performing performance tests.
13.1 Cases where Performance Tests are Required ........................
13.2 List of Measuring Devices Used for Performance Tests ...........
13.3 Performance Test ......................................................................
13.3.1
Reference resonator frequency stability ...................
13.3.2
Transmitter circuit characteristic:
Output frequency ......................................................
13.3.3
Transmitter circuit characteristic:
Output level accuracy ...............................................
13.3.4
Transmitter circuit characteristic:
Output level linearity .................................................
13.3.5
Transmitter circuit characteristic:
Output level deviation ...............................................
13.3.6
Transmitter circuit characteristic:
Output level step error (option 10) ............................
13.3.7
Receiver circuit characteristic: Average noise level ....
13.3.8
Receiver circuit characteristic: Cross talk .................
13.3.9
Receiver circuit characteristic:
Magnitude dynamic accuracy ...................................
13.3.10 Receiver circuit characteristic:
Phase dynamic accuracy ..........................................
13-2
13-3
13-4
13-4
13-6
13-7
13-8
13-9
13-11
13-12
13-13
13-15
13-17
13-1
Section 13 Performance Tests
13.1
Cases where Performance Tests are Required
Performance tests are performed, as part of the preventive maintenance, to prevent the system performance from being
impaired.
Performance tests must be performed after acceptance inspection, periodic inspection, or repair.
After acceptance inspection, periodic inspection, or repair, perform the following performance tests:
•
Reference resonator frequency stability
•
Transmitter circuit characteristic: Output frequency
•
Transmitter circuit characteristic: Output level accuracy
•
Transmitter circuit characteristic: Output level linearity
•
Transmitter circuit characteristic: Output level deviation
•
Transmitter circuit characteristic: Output level step error (option 10)
•
Receiver circuit characteristic:
Average noise level
•
Receiver circuit characteristic:
Cross talk
•
Receiver circuit characteristic:
Magnitude dynamic accuracy
•
Receiver circuit characteristic:
Phase dynamic accuracy
Performance tests you think important must be periodically conducted as preventive maintenance. The recommended
periodic test cycle is 1 year.
If a performance test result indicates any unconformity to the specifications, contact our Service Department.
13-2
13.2
13.2
List of Measuring Devices Used for Performance
Tests
Measuring
device
Frequency
counter
Power meter
Power sensor
Audio analyzer
Standard
attenuator
Frequency
standard
List of Measuring Devices Used for Performance Tests
Required performance *1
Frequency range:
10 Hz to 300 MHz
Number of display digits: 10
External reference input: 10 MHz can be input.
Main unit accuracy:
±0.002 dB
Frequency range:
100 kHz to 300 MHz
(depends on the power
sensor type)
Frequency range:
100 kHz to 300 MHz
Measurement power range: –10 to +20 dBm
Measurement power range: –10 to +20 dBm
Frequency range:
10 Hz to 100 kHz
Attenuator having calibration accuracy traced to
domestic standard (10 dB/0.01 dB)
Frequency:
10 MHz
Stability:
1 × 10⁻⁹ or less
Test item
Recommended
device
Reference resonator frequency stability
MF1603A
Output frequency
Output level accuracy
ML4803A
Output level linearity
Output level deviation
Magnitude dynamic accuracy
MA4601A
Phase dynamic accuracy
Output level deviation
Magnitude dynamic accuracy
Phase dynamic accuracy
Reference resonator frequency stability
NOTE:
Some of performance requirements to check for the specified test items are listed.
13-3
Section 13 Performance Tests
13.3
Performance Test
Before conducting a performance test, warm up the DUT and measuring devices for at least 30 minutes unless otherwise
specified. To obtain the most accurate result, the test must be conducted at room temperature, the AC supply voltage must
not fluctuate greatly, and there must be no problem associated with noise, vibration, dust, and moisture.
It is recommended that the performance test result be entered in the Performance Test Result Form shown in Appendix A.
13.3.1
Reference resonator frequency stability
Test the internal reference resonator for frequency stability.
Measure the frequency change (aging rate) after power-on and the temperature change (temperature stability) relative to
the ambient temperature.
(1)
Test standards
■ Reference resonator
(2)
• Output frequency:
10 MHz
<Standard>
• Aging rate:
±1 × 10⁻⁶/day or less (15 minutes after power-on)
• Temperature characteristic:
±5 × 10⁻⁶ or less (0 to 50 ˚C)
<Option13>
• Aging rate:
±2 × 10⁻⁸/day or less (24 hours after power-on)
• Temperature characteristic:
±5 × 10⁻⁸/day or less (0 to 50 ˚C)
Measuring devices
•
•
(3)
Frequency counter
Frequency standard:
±1 × 10⁻⁹/day or less
Setup
Frequency standard
Buff.output(10 MHz)
OUTPUT
Frequency counter
Main unit (rear panel)
FREQ STD.
10 MHz IN
INPUT
Reference resonator frequency stability test
13-4
13.3
(4)
Performance Test
Test procedure
Aging rate:
This measurement must be performed in a place where the ambient temperature is 23 ± 3 ˚C and there is no vibration.
Step
Description of operation
1
Turn on the DUT.
2
Measure frequency using a frequency counter 15 minutes (standard) or 24 hours (option 13) after poweron.
3
Measure frequency using a frequency counter 24 hours after the above measurement.
4
Calculate the aging rate from:
Aging rate = {(Second measured value) – (First measured value)}/(First measured value)
Temperature characteristic: This measurement must be performed using a vibration-free thermostatic oven.
Step
Description of operation
1
Place only the DUT in the thermostatic oven and keep the temperature in the oven at 25 ˚C.
2
Turn on the DUT and wait until its internal temperature becomes stable (about 1.5 hours after the temperature in the over becomes constant).
3
Measure frequency using a frequency counter.
4
Set the oven temperature to 50 ˚C.
5
When the oven temperature and the internal temperature of the DUT become stable, measure frequency
using a frequency counter.
6
Calculate the temperature characteristic from the following equation:
Temperature characteristic = {(Value measured at 50 ˚C) – (Value measured at 25 ˚C)}/(Value measured
at 25 ˚C)
7
(5)
Set the oven temperature to 0 ˚C and repeat steps 5 and 6.
Note
The reading of the frequency counter may include an error of ±1 count.
13-5
Section 13 Performance Tests
13.3.2
Transmitter circuit characteristic: Output frequency
The network analyzer supplies the same synthesizer local signals to the input and output circuits to measure the output
frequency interlocked with the input frequency. The input frequency can be obtained by measuring the output frequency.
(1)
Test standard
•
(2)
Output frequency range:
10 Hz to 300 MHz (0.01-Hz resolution)
Measuring device
•
(3)
Frequency counter
Setup
MS4630B
Ext. input (rear panel)
Frequency counter
OUTPUT A
FREQ STD.
10 MHz OUTPUT
INPUT
Output frequency test
(4)
Test procedure
Step
(5)
Description of operation
1
Set the span to 0 Hz, output port to port A, and output level to +6 dBm.
2
Set the center frequency to a desired value.
3
Make sure that the reading of the frequency counter equals th eset value.
4
Perform measurements by changing the center frequency.
Note
The reading of the frequency counter may include an error of ±1 count.
13-6
13.3
13.3.3
(1)
Transmitter circuit characteristic: Output level accuracy
Test standard
•
(2)
Performance Test
Output level accuracy:
±1 dB or less (100 MHz frequency, A output, at +10 dB)
Measuring devices
•
•
Power meter
Power sensor
Power meter
MS4630B
INPUT
OUTPUT A
T
6 dB ATT
Power sensor
Output level accuracy test
(3)
Setup
(4)
Test procedure
Step
Description of operation
1
Zero-adjust the power meter and adjust the sensor sensitivity.
2
Set the center frequency of this system to 100 MHz, span to 0 Hz, output port to port A, and output level to
+10 dBm.
3
Set the calibration coefficient of the power meter sensor to read the output level.
13-7
Section 13 Performance Tests
13.3.4
(1)
Transmitter circuit characteristic: Output level linearity
Test standard
•
(2)
Output level linearity:
±0.5 dB or less (A output, 100 MHz frequency, 0 dBm reference, at 0 to +21
dBm)
Measuring devices
•
•
(3)
Power meter
Power sensor
Setup
Power meter
MS4630B
INPUT
OUTPUT A
T
6 dB ATT
Power sensor
Output level linearity test
(4)
Test procedure
Step
13-8
Description of operation
1
Zero-adjust the power meter and adjust the sensor sensitivity.
2
Set the center frequency of this system to 100 MHz, span to 0 Hz, output port to port A, and output level to
+10 dBm.
3
Set the calibration coefficient of the power meter sensor to read the output level. The reading becomes the
reference value.
4
Set the output level of this system to 0 dBm.
5
Read the output level using a power meter. Find the output level linearity from the following equation:
Output level linearity [dB]= (Measured value – Output level setting) – (Value measured at +10 dBm – 10)
6
Measure the output level linearity by increasing the output level of this system up to +21 dBm in increments of 1 dB.
13.3
13.3.5
(1)
Output level deviation:
±1.5 dB or less (A output, at +10 dBm, 100 MHz reference)
Measuring devices
•
•
•
(3)
Transmitter circuit characteristic: Output level deviation
Test standard
•
(2)
Performance Test
Power meter
Power sensor
Audio analyzer
Setup
Power meter
MS4630B
INPUT
Power sensor
OUTPUT A
(100 kHz-300 MHz)
Audio analyzer
50 Ω
(10 Hz-100 kHz)
Output level deviation test
13-9
Section 13 Performance Tests
(4)
Test procedure
100 kHz to 300 MHz test: This test must be performed using a power meter.
Step
Description of operation
1
Zero-adjust the power meter and adjust the sensor sensitivity.
2
Set the center frequency of this system to 100 MHz, span to 0 Hz, output port to port A, and output level to
+10 dBm.
3
Set the calibration coefficient of the power meter sensor to read the output level. The reading becomes the
reference value.
4
Set the center frequency of this system to a desired value.
5
Set the calibration coefficient of the power meter sensor and read the output level. Find the output level
deviation from the following equation:
Output level deviation = (Output level) – (Output level at 100 MHz)
6
Repeat steps 4 and 5 by changing the frequency.
10 kHz to 100 MHz test: This test must be performed using an audio analyzer.
10 kHz to 100 MHz test: This test must be performed using an audio analyzer.
Step
Description of operation
1
Set the span of this system to 0 Hz, output port to port A, and output level to +10 dBm.
2
Set the center frequency of this system to a desired value between 10 Hz and 100 kHz.
3
Using an audio analyzer, measure the output voltage. Find the output level deviation from the following
equation:
Output level [dBm] = 10*log (Measured value [Vrms] 2/50 [Ω] /0.001 [W])
4
The difference between the above output level and the output level measured at 100 MHz in the “100 kHz
to 300 MHz” test gives the output level deviation.
5
Repeat steps 2 to 4 by changing the center frequency of this system.
13-10
13.3
13.3.6
Performance Test
Transmitter circuit characteristic: Output level step error (option 10)
The output level step error test can be performed only when option 10 is provided.
(1)
Test standard
•
(2)
Output level step error:
±0.5 dB (option 10)
Measuring device
None (MS4630B)
(3)
Setup
MS4630B
OUTPUT A
INPUT R
Output level step error test
(4)
Test procedure
Step
Description of operation
1
Set the start frequency of this system to 10 kHz, stop frequency to 300 MHz, level measurement mode to R,
RBW to 100 Hz, and output port to port A.
2
Set the output level to 0.00 dBm and execute X-S CAL.
3
Set the output level to –0.01 dBm and measure the maximum deviation of the measurement waveform
from 0 dBm.
Find the output level step error from the following equation:
Output level step error [dB] = Maximum deviation [dB] – 0.01 [dB]
4
Measure the maximum deviations by repeating steps 2 and 3 with the output level changed as follows:
–10.00 → –10.01 dBm, –20.00 → –20.01 dBm, ..., –60.00 → –60.01 dBm
13-11
Section 13 Performance Tests
13.3.7
(1)
Test standard
•
(2)
Receiver circuit characteristic: Average noise level
Average noise level:
≤–120 dBm (1 MHz to 300 MHz, RBW: At 1 kHz)
≤–110 dBm (80 kHz to 1 MHz, RBW: At 1 kHz)
Measuring device
None (MS4630B)
(3)
Setup
MS4630B
OUTPUT A
50 Ω terminator
Average noise level test
(4)
Test procedure
Step
Description of operation
1
Set the span of this system to 0 Hz, level measurement port to TA, RBW to 1 kHz, and smoothing aperture
to 50 %, and then terminate the TA with a 50 Ω terminator.
2
Set the center frequency of this system to the target frequency.
3
Read the marker value. The reading becomes the average noise level.
4
Repeat steps 2 and 3 by changing the center frequency.
5
When reception port TB (option 12) is provided, select level measurement port TB and repeat steps 1 to 4.
13-12
13.3
13.3.8
(1)
Receiver circuit characteristic: Cross talk
Test standard
•
Cross talk:
Between channels:
Between transmitter and receiver circuits:
(2)
Performance Test
≥120 dB (80 kHz to 300 MHz)
≥110 dB (10 Hz to 80 kHz)
≥125 dB
Measuring device
None (MS4630B)
(3)
Setup
MS4630B
20 dB ATT (Connect
when measuring cross
talk between transmitter
and receiver circuits)
50 Ω terminator
T
Cross talk test
13-13
Section 13 Performance Tests
(4)
Test procedure
Cross talk between channels
Step
Description of operation
1
Connect output A and R of this system.
2
Set the start frequency of this system to 10 kHz, stop frequency to 300 MHz, RBW to 3 Hz, output port
to port A, output level to 0 dBm, and analysis port to TA/R.
Set SMOOTHING to 1%.
3
Execute a single sweep and obtain the maximum value by performing the MKR→MAX function.
The marker value [dB] multiplied by (–1) gives the cross talk between R and TA.
4
When reception port TB (option 12) is provided, select TB/R and repeat step 3.
Cross talk between transmitter and receiver circuits
Step
Description of operation
1
Connect output A and R of this system via a 20 dB ATT.
2
Set the start frequency of this system to 10 kHz, stop frequency to 300 MHz, RBW to 3 Hz, output port
to port A, output level to +20 dBm, and analysis port to TA/R.
Set SMOOTHING to 1%.
3
Execute a single sweep and obtain the maximum value by performing the MKR MAX function.
The marker value [dB] multiplied by (–1) plus 20 [dB] gives the cross talk between the transmitter and
receiver circuits.
4
When reception port TB (option 12) is provided, select TB/R and repeat step 3.
13-14
13.3
13.3.9
(1)
Receiver circuit characteristic: Magnitude dynamic accuracy
Test standards
•
Magnitude dynamic accuracy:
Level relative to input range
0
–10
–60
–70
–80
–90
(2)
to
to
to
to
to
to
–10 dB
–60 dB
–70 dB
–80 dB
–90 dB
–100 dB
Frequency
80 kHz to 100 MHz
10 kHz to 300 MHz
≤±0.20 dB
≤±0.20 dB
≤±0.05 dB
≤±0.05 dB
≤±0.30 dB
≤±0.10 dB
≤±1.00 dB
≤±0.30 dB
≤±4.00 dB
≤±1.20 dB
–
≤±4.00 dB
Measuring device
•
(3)
Performance Test
Standard attenuator:
Attenuator with standard calibration accuracy (10 dB/0.01 dB)
Setup
MS4630B
Power meter
Power sensor
10 dB ATT T
Standard T
attenuator
10 dB or 20 dB ATT
P-ATT
Magnitude dynamic accuracy test
(4)
Operation procedure
Step
Description of operation
1
Set the span of this system to 0 Hz, RBW to 30 Hz, output port to B, analysis port to TA/R, R’s input range
to 20 dBm, TA’s input range to 0 dBm, and smoothing aperture to 10 %.
2
Connect the B output and the input side of the standard attenuator and connect the output side of the
standard attenuator to the power meter via a 10 dB ATT.
3
Set the center frequency of this system to the target frequency.
4
Set the standard attenuator to 0 dB and adjust the output level so that the power meter reads 0 dBm.
13-15
Section 13 Performance Tests
Step
Description of operation
5
Disconnect the power meter, connect it to the TA, and set the standard attenuator to 10 dB.
6
Press “X→S” to perform normalization.
7
Set the standard attenuator to 0 dB.
8
Perform a single sweep to read the marker value. The reading becomes measurement data A0.
9
Set the standard attenuator to 20 dB and 30 dB, and perform step 8 repeatedly to obtain measurement data
A20 and A30.
Relationships between measurement data and standards are as follows:
Measurement
data
A0
A20
A30
Standard
attenuator
0 dB
20 dB
30 dB
Value relative
to input range
0 dB
20 dB
30 dB
Standard
80 kHz to 100 MHz
≤±0.20 dB
≤±0.05 dB
≤±0.05 dB
10 kHz to 300 MHz
≤±0.20 dB
≤±0.05 dB
≤±0.05 dB
10
Replace the reception-side 10 dB ATT with the 20 dB ATT, and connect the transmitter circuit to the
standard attenuator via a 10 dB ATT.
11
Set the standard attenuator to 10 dB.
12
Perform a single sweep to read the marker value.
Calculate K from the following equation:
K = (Marker value ) – A30
13
Set the standard attenuator to 20 dB.
14
Perform a single sweep to read the marker value.
Find B20 from the following equation:
B20 = (Marker value ) – K
15
Set the standard attenuator to 30 dB, 40 dB, 50 dB, 60 dB, 70 dB, and 80 dB, and perform step 14 repeatedly to obtain B30, B40, B50, B60, B70, and B80.
Relationships between measurement data and standards are as follows:
Measurement
data
B20
B30
B40
B50
B60
B70
B80
Standard
attenuator
20 dB
30 dB
40 dB
50 dB
60 dB
70 dB
80 dB
Value relative
to input range
40 dB
50 dB
60 dB
70 dB
80 dB
90 dB
100 dB
Standard
80 kHz to 100 MHz
≤±0.05 dB
≤±0.05 dB
≤±0.05 dB
≤±0.10 dB
≤±0.30 dB
≤±1.20 dB
≤±4.00 dB
10 kHz to 300 MHz
≤±0.05 dB
≤±0.05 dB
≤±0.05 dB
≤±0.30 dB
≤±1.00 dB
≤±4.00 dB
–
16
Repeat steps 2 to 15 by changing the frequency.
17
When reception port TB (option 12) is provided, select TB/R and repeat steps 2 to 15.
13-16
13.3
(5)
Performance Test
Note
When the measurement frequency is low (100 kHz or lower), the calibration value of the standard attenuator may
not match the test result due to a large attenuation quantity of the standard attenuator. To prevent this, insert a 50ohm 1:1 transformer on the output side of the standard attenuator to separate the ground.
13.3.10 Receiver circuit characteristic: Phase dynamic accuracy
(1)
Test standard
•
Phase dynamic accuracy:
Level relative to input range
0
–10
–60
–70
–80
–90
to
to
to
to
to
to
–10 dB
–60 dB
–70 dB
–80 dB
–90 dB
–100 dB
Frequency
10 kHz to 300 MHz
80 kHz to 100 MHz
≤±1.5 deg
≤±1.5 deg
≤±0.3 deg
≤±0.3 deg
≤±2.0 deg
≤±0.8 deg
≤±6.0 deg
≤±2.0 deg
≤±20.0 deg
≤±6.0 deg
–
≤±20.0 deg
(2)
Measuring device
•
Standard attenuator: Attenuator with standard calibration accuracy (10 dB/0.01 dB)
(3)
Setup
MS4630B
Power meter
Power sensor
Power divider
Standard attenuator
P-ATT
Phase dynamic accuracy test
13-17
Section 13 Performance Tests
(4)
Operation procedure
Step
Description of operation
1
Set the span of this system to 0 Hz, RBW to 30 Hz, output port to A, analysis port to TA/R, analysis format
to PHASE, R’s input range to 0 dBm, TA’s input range to 0 dBm, and smoothing aperture to 10 %.
2
Set the center frequency of this system to the target frequency.
3
Connect either output of the power divider to the power meter, set the standard attenuator to 0 dB, and
adjust the output level so that the power meter reads 0 dBm.
4
Disconnect the power meter, connect it to the TA, and set the standard attenuator to 10 dB.
5
Press “X→S” to perform normalization.
6
Set the standard attenuator to 0 dB.
7
Perform a single sweep to read the marker value. The reading becomes measurement data P0.
8
Set the standard attenuator to 20 dB, 30 dB, 40 dB, 50 dB, 60 dB, 70 dB, 80 dB, 90 dB, and 100 dB, and
perform step 7 repeatedly to obtain measurement data P20, P30, P40, P50, P60, P70, P80, P90, and P100.
Relationships between measurement data and standards are as follows:
Measurement
data
P0
P20
P30
P40
P50
P60
P70
P80
P90
P100
(5)
Standard
attenuator
0 dB
20 dB
30 dB
40 dB
50 dB
60 dB
70 dB
80 dB
90 dB
100 dB
Value relative
to input range
0 dB
20 dB
30 dB
40 dB
50 dB
60 dB
70 dB
80 dB
90 dB
100 dB
Standard
80 kHz to 100 MHz
≤±1.5 deg
≤±0.3 deg
≤±0.3 deg
≤±0.3 deg
≤±0.3 deg
≤±0.3 deg
≤±0.8 deg
≤±2.0 deg
≤±6.0 deg
≤±20.0 deg
10 kHz to 300 MHz
≤±1.5 deg
≤±0.3 deg
≤±0.3 deg
≤±0.3 deg
≤±0.3 deg
≤±0.3 deg
≤±2.0 deg
≤±6.0 deg
≤±20.0 deg
–
9
Repeat steps 2 to 8 by changing the frequency.
10
When reception port TB (option 12) is provided, select TB/R and repeat steps 2 to 8.
Note
When the measurement frequency is low (100 kHz or lower), the calibration value of the standard attenuator may
not match the test result due to a large attenuation quantity of the standard attenuator. To prevent this, insert a 50ohm 1:1 transformer on the output side of the standard attenuator to separate the ground.
13-18 .
Section 14 Maintenance
This section explains daily maintenance, long-period storage, repackaging, and transportation.
14.1 Cleaning the Cabinet .................................................................
14.2 Notes on Storage ......................................................................
14.2.1 Precautions for storage .................................................
14.2.2 Recommended storage conditions ................................
14.3 Repackaging and transporting the System to Return ................
14.3.1 Repackaging ..................................................................
14.3.2 Transportation ...............................................................
14-2
14-3
14-3
14-3
14-4
14-4
14-4
14-1
Section 14 Maintenance
14.1
Cleaning the Cabinet
Before cleaning the cabinet, be sure to turn off the POWER switch and unplug the power cord from the wall outlet. Clean
the cabinet in the following manner:
•
Wipe the cabinet with a dry, soft cloth.
•
If the cabinet is severely stained, the system has been used in a dusty place, or the system is to be stored for a long
period, wipe the cabinet with a soft cloth damped with synthetic detergent. Next, wipe it with a dry, soft cloth.
•
If you find loose parts, secure them tightly using specified tools.
CAUTION
Do not use benzine, thinner, and alcohol to clean the cabinet.
If used, the paint could be damaged or the cabinet could be discolored or deformed.
14-2
14.2
14.2
Notes on Storage
Notes on Storage
This section gives notes on storing the system for a long period or time.
14.2.1
Precautions for storage
(1)
Remove dust, fingerprints, and other stains.
(2)
Do not store the system in the following places:
(a) Place exposed to direct sunlight or dusty place
(b) Humid place where condensation occurs
(c) Place exposed to active gas or acid
(d) Place where the following temperature and humidity ranges are exceeded:
• Temperature:
Higher than 60 ˚C or lower than –20 ˚C
• Humidity:
90 % or higher
14.2.2
Recommended storage conditions
When the system is stored for a long period, the following environmental conditions must also be satisfied in addition to
the conditions in Section 14.2.1 above:
•
•
•
Temperature: ................ 0 to 30 ˚C
Humidity: ..................... 40 to 80 %
The temperature and humidity must not vary greatly within a day.
14-3
Section 14 Maintenance
14.3
Repackaging and transporting the System to Return
When returning the system to Anritsu for repair, follow the precautions given below.
14.3.1
Repackaging
Use the original packing material. To use other packing material, observe the following precautions:
(1)
Wrap the system with a plastic bag or sheet.
(2)
Get a corrugated cardboard box, crate, or aluminum box which is large enough to put cushioning material around
the system.
(3)
Put the system in the box along with cushioning material so that it does not move in the box.
(4)
Close the box securely with packing string, adhesive tape, or bands.
14.3.2
Transportation
When transporting the system, avoid vibration as much as possible and satisfy the storage conditions given in Section
14.2.2.
14-4 .
Appendixes
Appendix A Performance Test Result Form ......................................
Appendix B List of Defaults ...............................................................
Appendix C List of Controls and Connectors on Front and
Rear Panels ...................................................................
Appendix D List of Error Message .....................................................
Appendix E Example of Settings for Video Plotter VP1500 II
(Manufactured by SEIKOSYA) .......................................
A-1
B-1
C-1
D-1
E-1
App.-1
Appendixes
App-2 .
Appendix A Performance Test Result Form
Before performing a performance test, copy the form shown here. After completion of the performance test, enter the
result in the form.
A-1
Appendix A Performance Test Result Form
Test place:
Report No.
Date
Person in charge
System name: MS4630B network analyzer
Serial No.
Ambient temperature
Supply frequency
Hz
Supply voltage
V
Remarks:
˚C
Relative humidity
%
Reference resonator frequency stability
Aging rate
Frequency measured 15
minutes or 24 hours
(option 13) after power-
Frequency measured
24 hours later
[MHz]
Aging rage
Maximum value
[MHz]
[ppm]
[MHz]
[MHz]
[MHz]
Temperature characteristic
[ppm]
Reference
[ppm]
±1×10⁻⁶/Day
±2×10⁻⁸/Day
(option 13)
Temperature characteristics
Outside temperature
Frequency
0˚C
25˚C
50˚C
Maximum value
±5×10⁻⁶/Day
±5×10⁻⁸/Day
(option 13)
Transmitter circuit characteristic: Output frequency (15.3.2)
Setting
1 kHz
10 kHz
100 kHz
1 MHz
10 MHz
100 MHz
150 MHz
200 MHz
250 MHz
300 MHz
Result
Transmitter circuit characteristic: Output level accuracy (15.3.3)
Setting
Frequency
100 MHz
A-2
Output level
+10 dBm
Minimum value
–0.5 dB
Result
Maximum value
+0.5 dB
Performance Test Result Form
Transmitter circuit characteristic: Output level linearity (15.3.4)
Setting
Frequency
Output level
+21 dBm
+20 dBm
+19 dBm
+18 dBm
+17 dBm
+16 dBm
+15 dBm
+14 dBm
+13 dBm
+12 dBm
+11 dBm
+10 dBm
+9 dBm
+8 dBm
+7 dBm
+6 dBm
+5 dBm
+4 dBm
+3 dBm
+2 dBm
+1 dBm
0 dBm
100 MHz
Minimum value
Result
–0.5 dB
–0.5 dB
–0.5 dB
–0.5 dB
–0.5 dB
–0.5 dB
–0.5 dB
–0.5 dB
–0.5 dB
–0.5 dB
–0.5 dB
–0.5 dB
–0.5 dB
–0.5 dB
–0.5 dB
–0.5 dB
–0.5 dB
–0.5 dB
–0.5 dB
–0.5 dB
–0.5 dB
–0.5 dB
Maximum value
+0.5 dB
+0.5 dB
+0.5 dB
+0.5 dB
+0.5 dB
+0.5 dB
+0.5 dB
+0.5 dB
+0.5 dB
+0.5 dB
+0.5 dB
+0.5 dB
+0.5 dB
+0.5 dB
+0.5 dB
+0.5 dB
+0.5 dB
+0.5 dB
+0.5 dB
+0.5 dB
+0.5 dB
+0.5 dB
Transmitter circuit characteristic: Output level deviation (15.3.5)
Setting
Frequency
10 Hz
100 Hz
1 kHz
10 kHz
100 kHz
1 MHz
10 MHz
50 MHz
100 MHz
150 MHz
200 MHz
250 MHz
300 MHz
Output level
+10 dBm
Minimum value
–1.5 dB
–1.5 dB
–1.5 dB
–1.5 dB
–1.5 dB
–1.5 dB
–1.5 dB
–1.5 dB
–1.5 dB
–1.5 dB
–1.5 dB
–1.5 dB
–1.5 dB
Result
Reference
Maximum value
+1.5 dB
+1.5 dB
+1.5 dB
+1.5 dB
+1.5 dB
+1.5 dB
+1.5 dB
+1.5 dB
+1.5 dB
+1.5 dB
+1.5 dB
+1.5 dB
+1.5 dB
A-3
Appendix A Performance Test Result Form
Transmitter circuit characteristic: Output level step error (option 10) (15.3.6)
Output level
0→–0.01 dBm
–10→–10.01 dBm
–20→–20.01 dBm
–30→–30.01 dBm
–40→–40.01 dBm
–50→–50.01 dBm
–60→–60.01 dBm
Minimum value
–0.5 dB
–0.5 dB
–0.5 dB
–0.5 dB
–0.5 dB
–0.5 dB
–0.5 dB
Result
Maximum value
+0.5 dB
+0.5 dB
+0.5 dB
+0.5 dB
+0.5 dB
+0.5 dB
+0.5 dB
Result
Maximum value
–110 dB
–110 dB
–120 dB
–120 dB
–120 dB
–120 dB
–120 dB
–110 dB
–110 dB
–120 dB
–120 dB
–120 dB
–120 dB
–120 dB
Receiver circuit characteristic: Average noise level (15.3.7)
Reception port
TA
TB (option12)
Frequency
81 kHz
990 kHz
1.1 MHz
10.1 MHz
99 MHz
199 MHz
299 MHz
81 kHz
990 kHz
1.1 MHz
10.1 MHz
99 MHz
199 MHz
299 MHz
Receiver circuit characteristic: Cross talk (15.3.8)
Between channels
Reception port
TA
TB (option12)
Minimum value
120 dB
120 dB
Result
Minimum value
120 dB
120 dB
Result
Between transmitter and receiver circuits
Reception port
TA
TB (option 12)
A-4
Performance Test Result Form
Receiver circuit characteristic: Magnitude dynamic accuracy (15.3.9)
Setting
Value relative to
Frequency
input level
0 dB
–20 dB
–30 dB
–40 dB
–50 dB
10.1 kHz
–60 dB
–70 dB
–80 dB
–90 dB
–100 dB
0 dB
–20 dB
–30 dB
–40 dB
–50 dB
81 kHz
–60 dB
–70 dB
–80 dB
–90 dB
–100 dB
0 dB
–20 dB
–30 dB
–40 dB
–50 dB
99 MHz
–60 dB
–70 dB
–80 dB
–90 dB
–100 dB
0 dB
–20 dB
–30 dB
–40 dB
–50 dB
299 MHz
–60 dB
–70 dB
–80 dB
–90 dB
–100 dB
Minimum value
–0.20 dB
–0.05 dB
–0.05 dB
–0.05 dB
–0.05 dB
–0.05 dB
–0.30 dB
–1.00 dB
–4.00 dB
–
–0.20 dB
–0.05 dB
–0.05 dB
–0.05 dB
–0.05 dB
–0.05 dB
–0.10 dB
–0.30 dB
–1.20 dB
–4.00 dB
–0.20 dB
–0.05 dB
–0.05 dB
–0.05 dB
–0.05 dB
–0.05 dB
–0.10 dB
–0.30 dB
–1.20 dB
–4.00 dB
–0.20 dB
–0.05 dB
–0.05 dB
–0.05 dB
–0.05 dB
–0.05 dB
–0.30 dB
–1.00 dB
–4.00 dB
–
Result
Maximum value
0.20 dB
0.05 dB
0.05 dB
0.05 dB
0.05 dB
0.05 dB
0.30 dB
1.00 dB
4.00 dB
–
0.20 dB
0.05 dB
0.05 dB
0.05 dB
0.05 dB
0.05 dB
0.10 dB
0.30 dB
1.20 dB
4.00 dB
0.20 dB
0.05 dB
0.05 dB
0.05 dB
0.05 dB
0.05 dB
0.10 dB
0.30 dB
1.20 dB
4.00 dB
0.20 dB
0.05 dB
0.05 dB
0.05 dB
0.05 dB
0.05 dB
–0.30 dB
–1.00 dB
–4.00 dB
–
A-5
Appendix A Performance Test Result Form
Receiver circuit characteristic: Phase dynamic accuracy (15.3.10)
Setting
Value relative to
Frequency
input level
0 dB
–20 dB
–30 dB
–40 dB
–50 dB
10.1 kHz
–60 dB
–70 dB
–80 dB
–90 dB
–100 dB
0 dB
–20 dB
–30 dB
–40 dB
–50 dB
81 kHz
–60 dB
–70 dB
–80 dB
–90 dB
–100 dB
0 dB
–20 dB
–30 dB
–40 dB
–50 dB
99 MHz
–60 dB
–70 dB
–80 dB
–90 dB
–100 dB
0 dB
–20 dB
–30 dB
–40 dB
–50 dB
299 MHz
–60 dB
–70 dB
–80 dB
–90 dB
–100 dB
A-6 .
Minimum value
–1.5 deg
–0.3 deg
–0.3 deg
–0.3 deg
–0.3 deg
–0.3 deg
–2.0 deg
–6.0 deg
–20.0 deg
–
–1.5 deg
–0.3 deg
–0.3 deg
–0.3 deg
–0.3 deg
–0.3 deg
–0.8 deg
–2.0 deg
–6.0 deg
–20.0 deg
–1.5 deg
–0.3 deg
–0.3 deg
–0.3 deg
–0.3 deg
–0.3 deg
–0.8 deg
–2.0 deg
–6.0 deg
–20.0 deg
–1.5 deg
–0.3 deg
–0.3 deg
–0.3 deg
–0.3 deg
–0.3 deg
–2.0 deg
–6.0 deg
–20.0 deg
–
Result
Maximum value
1.5 deg
0.3 deg
0.3 deg
0.3 deg
0.3 deg
0.3 deg
2.0 deg
6.0 deg
20.0 deg
–
1.5 deg
0.3 deg
0.3 deg
0.3 deg
0.3 deg
0.3 deg
0.8 deg
2.0 deg
6.0 deg
20.0 deg
1.5 deg
0.3 deg
0.3 deg
0.3 deg
0.3 deg
0.3 deg
0.8 deg
2.0 deg
6.0 deg
20.0 deg
1.5 deg
0.3 deg
0.3 deg
0.3 deg
0.3 deg
0.3 deg
2.0 deg
6.0 deg
20.0 deg
–
Appendix B List of Defaults
When channels 1 and 2 or traces A and B have the same default, only one default is written in the “Default” column.
Key group
Channels
Master key
Menu
Active
Meas
Format
measurement
Frequency
Span
Out/input
Avg
Sweep
Function
Measurement channel
Coupled channel
Active channel
Analysis port
Analysis format
Impedance marker value
Admittance marker value
Phase offset
Frequency setting mode
Start frequency
Center frequency
LOG start freq.
Stop frequency
Span frequency
LOG stop freq.
Output port
output power
Source power
Output ATT (opt.)
Output offset
Power sweep
Start level
Stop level
Step level
TA range
TB range
R range
TA impedance
TB impedance
R impedance
Reference impedance
Averaging count
Averaging type
RBW
Smoothing
Delay aperture
Sweep time
Sweep mode
Full/MKR sweep
Number of measurement points
Breakpoint
Default
CH1
ON
CH1
TA/R
LOGMAG
Z∠θ
Y∠θ
0.000 deg
Start/Stop
10 kHz
150 MHz
10 kHz
300 MHz
100 MHz
300 MHz
output B
–6.00 dBm
0.00 dBm
0.00 dB
0.00 dB
OFF
0.00 dBm
0.00 dBm
0.00 dBm
0 dBm
0 dBm
0 dBm
50/75 Ω
50/75 Ω
50/75 Ω
50.0 Ω
1 (OFF)
SUM
AUTO
0 % (OFF)
0.4 %
AUTO
Repeat sweep
Full sweep
501
1001
B-1
Appendix B
Key group
Display
Master key
Sweep
Active
Scale
Trace
Marker
Marker
Calibration
Fctn
X-S
Cal
Utility
Copy&Memory
Filter
Resonator
Limit
Copy control
Save/Recall
System
B-2
System
Function
Sweep trigger source
External trigger mode
External trigger slope
Active trace
Scale
Offset
Offset line
Electric length
Split display
Waveform storage
Waveform overwrite
Display grid
Display/erase item
Subtrace
Marker
Active marker
Marker value
Reference marker
Coupled marker
Marker list display
Marker Tracking
Normalization
Calibration method
Through line offset length
Open offset length
Short offset length
CAL ON/OFF
Filter analysis function
Resonator analysis function
Limited test
GPIB My address
Control Function
Enable Register All
Terminater
Time Out
Active Port
Copy device
GPIB Address
Form Feed
Save Item
Drive
Marker setting mode
Impedance measurement method
Screen color
Default
Internal
Normal
Rising
Trace A
See Table 1
See Table 1
See Table 1
0.00 mm
OFF
OFF
OFF
ALL
See Table 2
OFF
Marker 0: ON
0
Normal
0
ON
OFF
OFF
OFF
Response
0.00 mm
0.00 mm
0.00 mm
OFF
OFF
OFF
OFF
1
Device
OFF
CR/LF&EOI
20 sec
GPIB
Video out
17
ON
PARAM
FD
Point
Transfer
See Table 3
List of Defaults
Table 1 Scale, offset, an offset line defaults by analysis format
min = Minimum resolution
Analysis format
LOGMAG
PHASE
DELAY
POLAR
IMPD
ADMT
VSWR
LINMAG
REAL
IMAGE
LOG Z
θ
Q
Scale default
10 dB
50 deg
min × 100000
min × 100000
min × 100000
min × 100000
min × 100000
min × 100000
min × 100000
min × 100000
5 decade
50 deg
min × 100000
Offset default
–50.000 dB
0.000 deg
0 sec
0
0
0
1.000
0
0
0
1Ω
0.000 deg
0
Offset line default
5 (Center)
5 (Center)
5 (Center)
5 (Center)
5 (Center)
5 (Center)
10 (Bottom)
5 (Center)
5 (Center)
5 (Center)
10 (Bottom)
5 (Center)
10 (Bottom)
Table 2 Display/erase item defaults
The items which are set ON can be erased or displayed by pressing the “Display All” key.
Item
Setup-A
Setup-B
Meas PRMS
Frequency
Menu
Sweep MKR
Chart-A
Chart-B
Trace-A
Trace-B
Marker-A
Marker-B
Top Line
Default
ON
ON
ON
OFF
OFF
ON
OFF
OFF
OFF
OFF
ON
ON
ON
B-3
Appendix B
Table 3
Screen color defaults
Screen name
Back Ground
Menu
Window
Chart-A
Chart-B
Trace-A
Trace-B
Marker-A
Marker-B
Limit-A
Limit-B
Storage
PTA
Error message
B-4 .
Screen No.
Background
Screen 15
Screen 4
Screen 13
Screen 14
Screen 8
Screen 9
Screen 5
Screen 6
Screen 10
Screen 11
Screen 12
Screen 7
Screen 1
Color default
Dark black
White
Blue
Dark white
Dark white
Green
Yellow
Light blue
Violet
Dark green
Dark yellow
Red
White
Red
Appendix C
List of Controls and Connectors on Front
and Rear Panels
Front Panel
1
Preset:
Pressing the
2
Preset
key initializes all measurement parameters excluding some backup parameters.
Local:
Pressing the Local key stops remote control performed through the GPIB, allowing you to operate the front panel
manually. When this system is locked out of the local controller, it cannot return to the local state. The REMOTE
LED goes on when the system enters the remote state and it goes out when the system enters the local state.
The GPIB-related menu is also displayed.
3
PTA:
This switch turns on the PTA function.
19
Power switch:
When the pushbutton is depressed, the system is powered. Power is supplied to all circuits in the system. The
system is ready for use. When the pushbutton is projected after being pressed again, the system is turned off.
20
PMC insertion slot (option):
Insert the PMC with the triangle printed on the PMC with the
mark on the front panel of the main unit. While
the PMC is being accessed, the Busy lamp is lit. When the battery incorporated in the PMC is nearly used up, the
Battery lamp lights up.
16
Backlight off:
Pressing this key toggles the backlight ON and OFF.
17
Display all:
Pressing this key between all items and only the selected items.
18
Window close:
Pressing this key closes the current window.
12
Calibration:
A group of keys used to perform calibration.
23
To Keyboard:
C-1
Appendix C
This connector is used to connect the keyboard for PTA.
13
Display:
A group of keys for the screen display.
24
Outputs:
A measurement signal output connector.
25
Inputs:
A measurement signal input connector.
26
Probe source:
This connector is used to supply power to an external application device.
15
Copy/Memory:
A group of keys used to create hard copies and save/recall data.
21
FD insertion slot:
Insert a floppy disk into this slot. While the data on the floppy disk is being accessed, the LED is lit.
7
Shift:
Pressing this key enables the functions (shift functions) displayed in blue.
6
TEN key:
A key group consisting of 16 keys. Generally, it is called a ten keypad. The 16 keys include numeric keys, a unit
key, and a BS (backspace) key. Twelve numeric keys represent digits 0 to 9, decimal point (.), plus and minus
signs. A unit key is used to set a distance, time (delay), or frequency. A unit of measure is selected depending on
the function for which you are entering data now. Pressing the unit key completes data input. To complete input
of data which is not followed by a unit of measure, press the ENTER key. Use the BS key to correct typos.
5
Arrow keys:
< and > keys have the following functions:
•
•
•
C-2
Pressing the < key moves the reverse cursor to the left.
Pressing the > key moves the reverse cursor to the right.
When the Marker key is depressed, pressing the < key moves the active marker to the left (the active marker
moves in 1/10 steps each tie the < key is pressed). Pressing the > key moves the active marker to the right.
List of Controls and Connectors on Front and Rear Panels
4
Knob:
The ENTRY knob is used to vary the data displayed in the entry response area continuously. It is also used to
perform the following functions:
•
•
•
11
Turning the knob counterclockwise moves the cursor to the left and turning it clockwise moves the cursor to
the right.
When the Marker key is depressed, turning the knob counterclockwise moves the active marker to the left and
turning it clockwise moves the active marker to the right.
When the Scale menu is selected, turning the knob clockwise changes the vertical scale in 1-2-5 steps and
turning it counterclockwise changes the vertical scale in 5-2-1 steps.
Measurement:
A group of keys used to set measurement conditions.
10
Maker:
A group of keys used to handle the marker.
9
Channels:
A group of keys used to select measurement items.
8
Soft keys:
Most keys on the front panel have a soft key menu. Pressing the soft key (F1 to F6) corresponding to a desired
menu option performs the associated function.
22
LCD Display:
A 640-by-480-dot, 6.5-inch, color LCD.
Back Panel
29
Module Bus:
An extended bus connector used to control an external device (compatible with the Anritsu module bus).
30
PTA I/O Port:
This port is used to control an external device by the PTA function or to control PTA from outside. Control signals
are all negative. Control must be programmed using a PTL language.
31
RGB:
Use this connector to connect a color monitor with a analog RGB Input connector.
32
Separate Video:
Use this connector to create a hard copy using a plotter with a Separate Video Signal Input connector.
33
GPIB:
When using GPIB, connect an external device (personal computer, etc.) to this connector.
37
FG:
To prevent electric shock, connect this terminal (frame ground terminal) to the ground level.
C-3
Appendix C
38
Fuse:
A fuse holder containing two 5-A fuses. The symbol “T” stands for a pre-arcing time/current characteristic,
indicating that there is a time lag before the fuse blows. These fuses conform to the IEC standard. For details, see
the IEC Pub 127 sheet.
39
Line input:
An AC inlet into which the enclosed power cord is inserted. The ground wire of the 3-core power cord is grounded
to the ground terminal when the power cord is plugged into this AC inlet.
34
RS232C (option):
Use this port to connect an external device having an RS232C port.
35
Centronics (option):
Use this port to connect an external device having a Centronics port.
36
FAN:
A fan used to prevent the internal temperature from rising excessively. Ensure that the system is installed with a
minimum clearance of 10 cm from the rear vent to the wall.
27
Ext. Trigger:
The trigger input connector when the start trigger of sweep is external. The signal level is TTL.
28
FAN:
•
•
C-4
Ext: The reference signal input connector when the external reference oscillator is used. The internal reference
oscillator is used when the external signal is not supplied.
Buffer: The reference signal output connector through the buffer.
22
MS4630B
8
9
10
11
4
5
6
7
21
Network Analyzer
10Hz–300MHz
Channels
1
F1
Shift
Marker
2
Menu
Active
Marker
Meas
Format
Fctn
7
8
9
BS
4
5
6
MHz
µsec
1
2
3
kHz
msec
mm
•
+/–
Preset
1
F2
Measurement
Frequency
Span
F3
System
Avg
Remote
Sweep
Out/Input
0
sec
Enter m
F4
Calibration
2
Utility
Copy/Memory
Control
Limit
Local
F5
Cal
PTA
3
A
F6
Scale
Backlight Off
Battery
Busy
Display All
X→S
X–S
Filter
Resonator
Save/
Recall
Copy
Display
B
Active
15
Trace
Probe
Source
Window Close
Outputs
A (Opt B)
Keyboard
PMC
B
+12V
100mA
Inputs
TA
R
26
TB
Max +20dBm
19
20
16
17
18
12
Fig.C-1
23
13
24
14
25
Front Panel
C-5
Appendix C
C-6
27
28
36
Std Osc
Buffer
Output(10MHz)
(TTL Level)
Ext
Input(5/10MHz)
(50Ω,≥7Vp-p)
Ext Trigger
(TTL Level)
Centronics
35
RS232C
WARNING
34
CAUTION
∼LINE Input 47.5-63HZ,150VA Max
100-240V
T 5A
Module Bus
29
PTA I/O Port
30
RGB
31
Separate
Video
GPIB
SH1 AH1 T6 L4 SR1 RL1
PPO DC1 DT1 C1-4 C24 E2
32
33
39
37
38
Fig.C-2 Back Panel
C-7
Appendix C
C-8 .
Appendix D List of Error Message
(1)
Media related error
Error Detail
Error Message
MISSING MEDIA
NOT FORMATED
DIFFERENT FORMATTING
MEDIA PROTECTED
INVALID MEDIA
MEDIA FULL
FILE NOT FOUND
DIFFERENT MEDIA TYPE
UNDIFINED FILE
MEDIA ERROR
DIFFERENT VERSION
NO DATA
Please Select FD
Media (Note) has not been mounted.
Media (Note) has not been formatted.
The type of formatting is different.
Media is write protected.
Media (Note) is broken.
The media memory is full.
A file is not found.
The media (Note) type is different.
The file to be defined has not been registered.
Other error
A file saved by a new version equipment was attempted to
be loaded by an older version equipment.
No data to save.
Select a floppy disk drive.
NOTE:
Media refers to an internal memory, FD or PMC.
(2)
Error related to external interface
Error Message
PORT NOT CONTROLLER
DEVICE NOT CONNECTED
TIMEOUT ERROR
(3)
Error Detail
Cannot execute because GPIB or RS-232 is not controller.
No device (printer) is connected to GPIB.
The specified time has elapsed, but there was no response
from other party.
Message related to equipment anomaly
Error Message
CAUTION FAN IS STOPPING
Entire screen flashes in red along with message.
Error Detail
Back panel fan is stopped.
D-1
Appendix D
D-2.
Appendix E Example of Settings for
Video Plotter VP1500 II
(Manufactured by SEIKOSYA)
The following table lists the settings (examples) of the plotter used to output the separate video signal of the MS4630B
network analyzer to the VP1500 II video plotter.
Set the following items in this order according to the operation manual of this plotter.
VP1500 II Mode No.
01
02
03
07
04
08
09
10
11
12
13
14
15
16
Function name
Initial setting
Signal type
Scanning method
Print direction
Sampling clock
Resolution
Reverse video
Lateral trimming
Longitudinal trimming
Width of image
Height of image
Length of recording paper
Top margin
Left margin
Setting value
000 (OFF)
002 (Separate video)
001 (Non-interlace)
002 (Lateral)
001 (External clock)
000 (Normal)
001 (Reverse)
000 (0 dot)
000 (0 raster)
112 (112mm)
506 (506 rasters)
106 (106mm)
016 (16mm)
010 (10mm)
E-1
Appendix E
E-2 .