1
Model 1191-I
Data Collection Platform
User’s
Manual
Rev. A
All Weather Inc. • 1165 National Drive • Sacramento, CA 95834 • USA • 800.824.5873 • www.allweatherinc.com
Copyright © 2015, All Weather, Inc.
All Rights Reserved. The information contained herein is proprietary and is provided solely for the
purpose of allowing customers to operate and/or service All Weather, Inc. manufactured equipment
and is not to be released, reproduced, or used for any other purpose without written permission of
All Weather, Inc.
Throughout this manual, trademarked names might be used. Rather than put a trademark (™)
symbol in every occurrence of a trademarked name, we state herein that we are using the names only
in an editorial fashion and to the benefit of the trademark owner, and with no intention of
infringement. All Weather, Inc. and the All Weather, Inc. logo are trademarks of All Weather, Inc.
Disclaimer
The information and specifications described in this manual are subject to change without notice.
All Weather, Inc.
1165 National Drive
Sacramento, CA 95834
Tel.: (916) 928-1000
Fax: (916) 928-1165
Contact Customer Service
Phone support is available from 8:00am - 4:30pm PT, Monday through Friday. Call 916-9281000 and ask for “Service.”
Online support is available by filling out a request at www.allweatherinc.com/support/online-support/
E-mail your support request to support@allweatherinc.com
Model 1191-I Data Collection Platform
User’s Manual
Revision History
Revision
A
Date
2015 Nov 5
Summary of Changes
Initial release
Model 1191-I Data Collection Platform
User’s Manual
TABLE OF CONTENTS
1. OVERVIEW ................................................................................................................. 1
1.1 Accessories .........................................................................................................................1
2. INSTALLATION ........................................................................................................... 2
2.1 DCP Electronics Enclosure.................................................................................................2
2.2 Electrical Connections ........................................................................................................6
2.2.1 Sensor Connections .....................................................................................................8
2.2.2 Connecting the DCP to the AC Power Line .............................................................12
2.3 UPCM Configuration........................................................................................................13
2.4 Barometric Pressure Sensor ..............................................................................................14
2.5 CDP Commuinication Options .........................................................................................16
3. OPERATION ............................................................................................................. 17
3.1 General ..............................................................................................................................17
3.2 Maintenance Switch..........................................................................................................17
3.3 DIP Switches ....................................................................................................................17
3.4 Display Screens ................................................................................................................18
3.5 Technician Setup Screens .................................................................................................29
3.6 LED Indicators..................................................................................................................31
4. MAINTENANCE ........................................................................................................ 33
5. SPECIFICATIONS .................................................................................................... 34
6. WARRANTY .............................................................................................................. 37
Model 1191-I Data Collection Platform
User’s Manual
1. OVERVIEW
The Model 1191-I Data Collection Platform (DCP) is used with Automated Weather Observing
Systems (AWOS) to collect and process sensor signals. The DCP is located at the sensor station,
and collects data from the sensors, performs error detection on the received information, converts
the sensors’ data into engineering units, and transmits a message packet containing sensor data
and status information to the Central Data Platform (CDP) when polled by the CDP. The CDP
generally polls the DCP at 2.5 second intervals.
The Model 2715 Universal Power and Communication Module (UPCM) provides power and a
serial interface. The UPCM has the option to be solar powered.
1.1 ACCESSORIES
The following accessories and replacement parts are available for the Model 1191-I Data Collection
Platform.
Part Number
2715
M406306-00
M442060
Description
Universal Power and Communication Module
256MB microSD card
5 A 250 V, 5x20 mm slow blow fuse for MARS fan
M442089-00
10 A 250 V, 5x20 mm slow blow fuse for UPCM
M438130-00
Backup Battery
M488119-01
Unistrut Mounting Kit for mounting to tower legs
1
Model 1191-I Data Collection Platform
User’s Manual
2. INSTALLATION
2.1 DCP ELECTRONICS ENCLOSURE
Mount the DCP electronics enclosure on the tower using the M488119-01 Unistrut Mounting Kit.
Do not tighten all the nuts completely until all the Unistrut mountings have been completed.
It may help to prepare a cardboard template of the back of the enclosure to place against various
tower locations to help find a suitable location.
If the DCP electronics enclosure is being mounted on a foldover tower, find a tower side with
enough room and spacing to hold the enclosure. This could turn out to be the hinged side if the
hinge is above ground, or it might have to be a side other than the hinged side if the hinge is at
the base of the tower. Note that all wires should be routed along leg on the hinged side with a bit
of additional slack at the hinge to allow for the tower to fold over without stressing the wires.
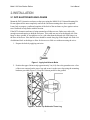
1. Prepare the bolts by applying anti-seize.
Figure 1. Apply Ant-Seize to Bolts
2. Position the upper Unistrut strip approximately 2 m (6 ft) above the ground next to a face
of the tower centered on the tower legs and secure it to the tower legs using the mounting
hardware provided (Figure 2). Keep the Unistrut parallel to the ground.
Figure 2. Secure Top Unistrut to Tower Leg
2
Model 1191-I Data Collection Platform
User’s Manual
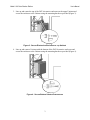
3. Line up and center the top of the DCP electronics enclosure on the upper Unistrut and
secure the enclosure to the Unistrut using the mounting hardware provided (Figure 3).
Figure 3. Secure Electronics Enclosure to Top Unistrut
4. Line up and center a Unistrut with the bottom of the DCP electronics enclosure and
secure the enclosure to the Unistrut using the mounting hardware provided (Figure 4).
Figure 4. Secure Bottom Unistrut to Enclosure
3
Model 1191-I Data Collection Platform
User’s Manual
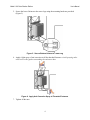
5. Secure the lower Unistrut to the tower legs using the mounting hardware provided
(Figure 5).
Figure 5. Secure Bottom Unistrut to Tower Leg
6. Apply a light spray of anti-corrosion to all the threaded fasteners. Avoid spraying other
areas such as the gasket surrounding the enclosure door.
Figure 6. Apply Anti-Corrosion Spray to Threaded Fasteners
7. Tighten all the nuts.
4
Model 1191-I Data Collection Platform
User’s Manual
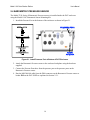
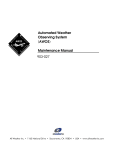
Figure 7 shows the completed installation on a stacked tower as an example.
Figure 7. Completed Installation
5
Model 1191-I Data Collection Platform
User’s Manual
2.2 ELECTRICAL CONNECTIONS
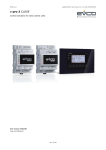
Figure 8 shows the external connections at the bottom of the enclosure.
AC power conduit.
Signal cables from sensors.
Serial connection to CDP.
Ground lug.
Figure 8. External Connections at Enclosure Bottom
The 1191-I DCP must be properly grounded by taking a ground wire with a minimum conductor
diameter of 2.9 mm (9 AWG) and maximum length of 5 m from the brass ground lug at the
bottom of the electronics enclosure (Figure 9) to an adequate grounding point.
Figure 9. DCP Grounding
6
Model 1191-I Data Collection Platform
User’s Manual
Route the cables from the sensors to the bottom of the electronics enclosure. Secure the cables
and the ground wire to a tower leg using tie-wraps or other straps.
1. Route the cables from the sensors into the electronics enclosure using the cable glands
and grommets shown in Figure 8.
2. Connect the wires to the connectors on the DCP sled shown in Figure 10 according to the
wiring information provided in this chapter.
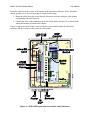
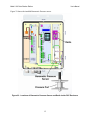
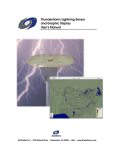
Figure 10 shows the layout of the various electronics subassemblies inside the electronics
enclosure and the routing of cables from the cable glands.
Figure 10. DCP SLED Layout and Connections Inside Enclosure
7
Model 1191-I Data Collection Platform
User’s Manual
2.2.1 Sensor Connections
Note that the AC power switch on the UPCM should be in the OFF position while these
connections are being made.
The terminal blocks at P1 to P11 use friction-lock connectors that are wired and then plugged in
to their respective terminal blocks.
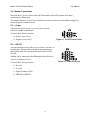
P1 — Power
The DCP SLED receives its +24 V DC power from the
UPCM via the P1 terminal block.
Terminal Block Wiring Summary
Positive wire to Pin 1
Negative wire to Pin 2
Figure 11. P1 DCP Power Pinout
P2 — RS-232
The P2 terminal block provides access to a three-wire RS-232
listening port. This port allows the data communications to
and from the DCP to be recorded and stored on the UPCM
SD card.
Nothing can be connected to the P2 terminal block Rx line if
a device is connected to P11.
Figure 12. P2 RS-232 Pinout
Terminal Block Wiring Summary
Rx to Tx
Tx to Rx
Signal Ground to GND
SHIELD to SHIELD
8
Model 1191-I Data Collection Platform
User’s Manual
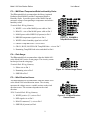
P3 — MARS and Temperature/Relative Humidity Probe
The P3 terminal block accommodates the Motor Aspirated
Radiation Shield MARS) and the Temperature/Relative
Humidity Probe. It provides power to the MARS fan and
measures voltages corresponding to temperature and relative
humidity values.
Terminal Block Wiring Summary
WHITE + wire of the MARS power cable to Pin 1
BLACK – wire of the MARS power cable to Pin 2
MARS power cable SHIELD (if present) to Pin 3
BROWN temperature signal wire to Pin 4
WHITE relative humidity signal wire to Pin 5
Figure 13. P3 MARS &
Temp/RH Probe Pinout
GREEN Temp/RH Probe + wire to Pin 6
GRAY, BLUE, OR YELLOW Temp/RH Probe – wire to Pin 7
Remaining Temp/RH Probe wires and shield to Pin 8
P4 — Rain Gauge
The P4 terminal block accommodates either the Model 6011
or the Model 6021 series of rain gauges. The circuitry counts
bucket tips from the rain gauge.
Terminal Block Wiring Summary
Either wire to Pin 1
Figure 14. P4 Rain Gauge Pinout
Remaining wire to Pin 2
SHIELD to Pin 3
P5 — Wind Direction Sensor
The P5 terminal block accommodates either the Model 2020
or the Model 2100 wind direction sensor. The circuitry
measures the voltage across a variable resistor on the wind
direction sensor. The resistance depends on the wind
direction.
2020 Terminal Block Wiring Summary
WHITE positive (V+) wire to Pin 1
Figure 15. P5 Wind Direction
Sensor Pinout
RED signal wire to Pin 2
BLACK common (V–) wire to Pin 3
SHIELD (if present) to Pin 4
9
Model 1191-I Data Collection Platform
User’s Manual
2100 Terminal Block Wiring Summary
ORANGE positive (V+) wire to Pin 1
GREEN signal wire to Pin 2
BLUE common (V–) wire to Pin 3
SHIELD (if present) to Pin 4
P6 — Wind Speed Sensor
The P6 terminal block accommodates either the Model 2030
or the Model 2100 wind speed sensor. The circuitry measures
the frequency information from the wind speed sensor. The
frequency depends on the wind speed.
2030 Terminal Block Wiring Summary
BLACK positive (V+) wire to Pin 1
WHITE signal wire to Pin 2
Figure 16. P6 Wind Speed
Sensor Pinout
GREEN signal return wire to Pin 3
RED ground or common wire to Pin 4
SHIELD (if present) to Pin 5
2100 Terminal Block Wiring Summary
RED positive (V+) wire to Pin 1
WHITE signal wire to Pin 2
GREEN signal return wire to Pin 3
BLACK ground or common wire to Pin 4
SHIELD (if present) to Pin 5
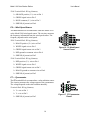
P7 — Pyranometer
The P7 terminal block accommodates a solar radiation sensor.
The circuitry measures the voltage output of the pyranometer.
The voltage depends on the solar radiation intensity.
Terminal Block Wiring Summary
V+ wire to Pin 1
V– wire to Pin 2
Figure 17. P7 Pyranometer
Pinout
SHIELD (if present) to Pin 3
10
Model 1191-I Data Collection Platform
User’s Manual
P8–P10 — RS-485 Sensors
Six RS-485 terminal blocks (P8A, P8B, P9A, P9B, P10A, and
P10B) accommodate sensors such as the visibility sensor,
present weather sensor, and Ceilometer with RS-485 outputs.
Terminal Block Wiring Summary
RS-485 D+ wire to Pin 1
RS-485 D– wire to Pin 2
Figure 18. P8–P10 RS-485
Pinouts
Signal ground wire to Pin 3
SHIELD (if present) to Pin 4
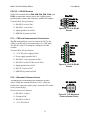
P11 — CDP and Communication Connections
The P11 terminal block is used to connect the DCP to the
CDP over an RS-485 serial connection or via a UHF radio.
The RS-485 or RS-232 settings are configured via DIP
switches
Terminal Block Wiring Summary
+15 V DC power supply to Pin 1
Power supply ground to Pin 2
RS-485 D– wire (if present) to Pin 3
RS-485 D+ or RS-232 Rx wire to Pin 4
Figure 19. P8–P10 RS-485
Pinouts
Signal ground wire to Pin 5
RS-232 Tx wire to Pin 7
SHIELD (if present) to Pin 8
P12 — Barometric Pressure Sensor
The P12 header accommodates the barometric pressure
sensor. Unlike the terminal blocks at P1–P11, which use
friction-lock connectors whose plug is wired, the P12 header
is for a prewired plug.
Header Connections Summary
RS-485 D– to Pin 6
Figure 20. P12 Barometric
Pressure Sensor Pinout
Ground to Pin 7
RS-485 D+ to Pin 8
+15 V DC to Pin 9
11
Model 1191-I Data Collection Platform
User’s Manual
2.2.2 Connecting the DCP to the AC Power Line
The DCP SLED receives its +24 V DC power from the DC output on header P4 of the UPCM.
Note that the 12/24 V DC switch above UPCM header P4 must be set to +24 V DC.
Connections are made to the UPCM inside the electronics enclosure.
AC power connections are made to the UPCM located inside the electronics enclosure. A 3-wire,
single-phase AC source is required consisting of hot, neutral, and earth ground connections.
WARNING
Turn off electrical power at the source before making the electrical connections to the
UPCM!
1. Install a conduit fitting at the location shown in Figure 8. Feed the power cable through
the conduit fitting. A 3-wire 16 to 18 AWG cable is recommended.
2. Connect the three power cable wires to a terminal block plug if this has not already been
done 1 (LINE), 2 (NEUTRAL), and 3 (GND).
3. Plug the terminal block plug into P3, the AC Power In on the UPCM.
12
Model 1191-I Data Collection Platform
User’s Manual
2.3 UPCM CONFIGURATION
The microSD card containing the configuration file is normally kept in the microSD card slot.
Figure 10 shows where the microSD card is located and shows the on/off switch referred to in
this below. If it becomes necessary to change or review the configuration, you may remove the
existing microSD card, place it in an adapter or a USB microSD card device, and use your
computer to edit or review the configuration file using a text editor such as Notepad.
These steps explain how to remove and replace the microSD card containing the configuration
file. The configuration file name is myfile.txt.
1. Turn the DC power supply off (DC on/off switch).
2. Remove the microSD card containing the configuration file.
3. Replace the microSD card containing the new configuration file.
4. Turn the DC power supply on (DC on/off switch).
5. The status LEDs are above the microSD card slot. The red status LED blinks rapidly
(approximately ten times per second) for a few seconds after being powered on. Wait
until the red status LED begins to blink slowly (approximately once per second).
If the red status LED does not blink as expected, check the microSD card.
The default configuration for the serial ports shown below is set at the factory. In all cases, the =
sign separates the parameter and its configuration value.
All parameters must be specified for a valid configuration file.
Parameter
SER0_PROT=2
SER0_BAUD=1
SER0_DATA=8
SER0_PAR=78
SER0_STOP=1
SER0_TE=0
Configuration
Protocol RS-485 Half Duplex
Baud Rate 4800 bps
Data Bits 8
No parity
Stop Bits 1
Termination Off
Parameter
SER1_PROT=2
SER1_BAUD=3
SER1_DATA=8
SER1_PAR=78
SER1_STOP=1
SER1_TE=0
Configuration
Protocol RS-485 Half Duplex
Baud Rate 19200 bps
Data Bits 8
No parity
Stop Bits 1
Termination Off
Configure the SER1_xxx parameters for Serial Port 2 based on the sensor that is connected to it
PSU_ADDR_H=0
PSU_ADDR_L=0
Power supply address upper nibble
Power supply address lower nibble
EN_DCOUT=1
EN_ACOUT=2
EN_CHRGR=1
DC Output enabled at boot
AC Output used with thermostat at boot
Battery Charger enabled
PORT1_MODE=255
There is no sensor connected to Serial Port 2, otherwise according to sensor
PORT2_MODE=0
Replace the 0 based on the sensor connected to Serial Port 3 if the serial port card is added
MIN_TEMP=0
MAX_TEMP=1
Thermostat turn-on temperature is 0°C
Thermostat turn-off temperature is 1°C
FORCE_220V=0
Power supply switches automatically
Additional details are provided in the Model 2715 Universal Power and Communication
Module User’s Manual.
13
Model 1191-I Data Collection Platform
User’s Manual
2.4 BAROMETRIC PRESSURE SENSOR
The Model 7150 Series of Barometric Pressure sensors is installed inside the DCP enclosure
using the Model 11907 Barometric Sensor Mounting Kit.
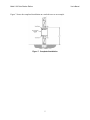
1. Install the Pressure Port at the bottom of the enclosure as shown in Figure 21.
Figure 21. Install Pressure Port at Bottom of DCP Enclosure
2. Attach the Barometric Pressure sensor to the enclosure backplane using the hardware
supplied.
3. Connect the Pressure Port tubes from the pressure port to the pressure ports on the
Barometric Pressure sensor.
4. Run the M493090-00 cable from the DB9 connector on the Barometric Pressure sensor to
header P12 on the DCP SLED as explained in Section 2.2.1.
14
Model 1191-I Data Collection Platform
User’s Manual
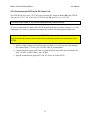
Figure 22 shows the installed Barometric Pressure sensor.
Figure 22. Locations of Barometric Pressure Sensor and Radio Inside DCP Enclosure
15
Model 1191-I Data Collection Platform
User’s Manual
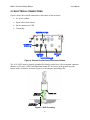
2.5 CDP COMMUINICATION OPTIONS
Figure 22 shows a UHF radio installed inside the DCP enclosure to allow the DCP to communicate
with the Central Data Processor (CDP) running the MetObserver display software.
The UHF radio is one of several options that may be installed in this area. These are examples of
the possible communication options.
UHF radio
Spread spectrum radio
Terminal server
Fiber optic modem
RS-485 serial line
The radio options require an antenna to be mounted nearby, usually on the tower above the DCP.
Figure 21 shows the location on the bottom of the enclosure that would be used for the antenna
cable. The radio option usually requires the antenna on the tower to be in a line of sight with the
other antenna connected to the corresponding radio for the CDP.
The maximum distance for the RS-485 serial line is 1200 m (4000 ft).
16
Model 1191-I Data Collection Platform
User’s Manual
3. OPERATION
3.1 GENERAL
The Model 1191-I Data Collection Platform (DCP) is designed for use with the All Weather, Inc.
AWOS aviation weather systems. The DCP collects data from the AWOS sensors, performs
error detection on the received information, converts the sensors’ data into engineering units, and
transmits a message packet containing sensor data and status information to the Central Data
Platform (CDP) once every five seconds.
3.2 MAINTENANCE SWITCH
A maintenance switch (S2) is located on the DCP SLED (Figure 10). This momentary switch
should be pressed any time maintenance is performed on any part of the AWOS system, prior to
beginning maintenance. The switch closure will be recorded by the CDP, thereby alerting airport
personnel that sensor data may be invalid (because calibration or maintenance checks are being
performed), and keeping an ongoing log of maintenance activity at the site. The ON state of the
switch (shown both on the DCP’s LCD display and at the CDP) will be reset to OFF automatically
after five minutes. This switch must be pressed to enable several maintenance functions from the
keypad.
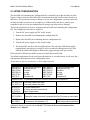
3.3 DIP SWITCHES
Note: The three DIP switch assemblies S3, S4, and S5 are set at the factory according to each
system’s specific configuration.
Three DIP switch assemblies (S3, S4, and S5) on the DCP backplane are used to set configuration
parameters for the DCP. These switches are set at the factory and should not need to be changed.
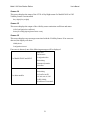
The S3 switches are used to set the auxiliary voltage gain for the solar radiation sensor connected
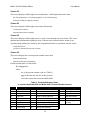
to the P7 terminal block. The gain is normally set to 50. Table 1 shows the switch settings.
Table 1. S3 DIP Switch Settings for
Solar Radiation Sensor
Selection
Aux Gain 1
Aux Gain 10
Aux Gain 50
DIP Switch
2
3
OFF
OFF
ON
OFF
OFF
ON
1
ON
OFF
OFF
Switch 4 on DIP switch S3 is not used.
17
4
Model 1191-I Data Collection Platform
User’s Manual
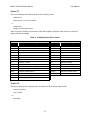
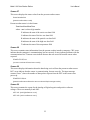
The S4 switches specify RS-232 or RS-485 communication between the DCP and the CDP or
UHF Radio. Table 2 shows the switch settings for each communication setup.
Table 2. S4 DIP Switch Settings for Communication Protocol
Communication
Protocol
RS-232
RS-485
1
ON
OFF
2
OFF
ON
DIP Switch
4
5
ON
OFF
OFF
ON
3
OFF
OFF
6
OFF
OFF
7
OFF
ON
8
OFF
ON
Switches 3 and 6 on DIP switch S4 are not used for any configuration, and should be OFF.
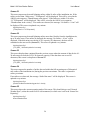
The S5 switches are used to set the station address and the type of wind sensor. Table 3 shows
the switch settings.
Table 3. S5 DIP Switch Settings for DCP Address
and Wind Sensor
Selection
DCP Station 0
DCP Station 1
DCP Station 2
DCP Station 3
Model 2100
Wind Speed
Model 2030
Wind Speed
Model 2040
Wind Speed
1
OFF
ON
OFF
ON
2
OFF
OFF
ON
ON
DIP Switch
3
4
5
OFF
OFF
ON
OFF
ON
OFF
ON
OFF
OFF
3.4 DISPLAY SCREENS
An LCD display screen and a keypad inside the enclosure are used to view sensor data and
perform maintenance checks. The DCP screens are explained in the following sections. Use the *
and # keys on the keypad to move through the screens —press the # key to move down (to a
higher numbered screen), or press the * key to move up (to a lower numbered screen).
In the screen explanations below, unchanging screen text is shown unbracketed, while
explanations of the data values for specific parameters are shown in brackets.
Screen 1
This screen displays the firmware version installed on the DCP.
ALL WEATHER INC.
AWOS DCP 10.5 INTL
18
Model 1191-I Data Collection Platform
User’s Manual
Screens 3–6 will show missing when a broken wire is detected.
Screen 2
This screen displays the value of the DCP address DIP switch S5 and the status of the maintenance
switch. The maintenance switch will retain its ON value for 5 minutes after being pressed.
Address Switch = {dcp poll address}
Maint Switch {On / Off}
Screen 3
This screen identifies the type of wind speed sensor as configured by S5.
Wind Speed Sensor
{2030 Micro Response, 2100 Skyvane, or 1390 Gill (2040 ultrasonic)}
Screen 4
This screen displays the current wind speed in knots, and wind direction values. If the Model
2040 Ultrasonic sensor is used and an error is detected, the error will be displayed in place of
wind data.
Wind Speed {speed in knots to the nearest .1 knot}
Wind Dir {direction} True; or Wind Dir 999 if missing
Screen 5
This screen displays the current temperature and dew point temperature in Celsius and the
relative humidity (RH).
Temp {temperature in degrees Celsius to nearest .1 degree C} RH {rh value}
Dew Point {dew point temperature in degrees Celsius to nearest .1 degree C}
Values are set to 999 if missing.
Screen 6
This screen displays the current temperature and dew point temperature in Fahrenheit and the
relative humidity (RH).
Temp {temperature in degrees Fahrenheit to nearest 0.1 degree F} RH {rh value}
Dew Point {dew point temperature in degrees Fahrenheit to nearest 0.1 degree F}
Values are set to 999 if missing.
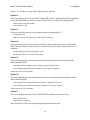
Screen 7
This screen displays the status of the 8190 MARS fan and the system power source.
MARS Fan {OK or FAIL}
System Pwr: {AC or Battery}
If the fan fails, the CDP will stop reporting temperature and dew point.
19
Model 1191-I Data Collection Platform
User’s Manual
Screen 8
This screen displays the current value in volts and counts of the auxiliary input channel.
Aux Inp {auxiliary input channel value in volts}
Counts=count value
Value is set to 99.999 if missing.
Screen 9
This screen displays the barometric pressure output including the offset in inches of mercury.
The lowest sensor value that is with ±0.02 in Hg of the other sensor readings including the offset
is displayed.
BP Output w/ Offset
Pres inHg
Values are reported to 0.001 inHg, and are set to 99.999 if missing.
Screen 10
This screen displays the barometric pressure offsets for the Model 7150 Barometric Pressure
sensors using units of in Hg.
BP Offsets inHg
{offset value 1} {offset value 2} {offset value…}
Values are reported to 0.001 in Hg, and are set to 99.999 if missing.
Screen 11
This screen displays the barometric pressure readings from the Model 7150 Barometric Pressure
sensors without offsets using units of in Hg.
BP w/o Offset inHg
{pressure value 1} {pressure value 2} …
Screen 12
This screen displays the barometric pressure readings from the Model 7150 Barometric Pressure
sensors with offsets using units of in Hg.
BP Values w Offset
{pressure value 1} {pressure value 2} …
Screen 13
This screen displays the rainfall counter.
Rainfall {rain tip counter} tips
Counter values range from 0 to 99.
20
Model 1191-I Data Collection Platform
User’s Manual
Screen 14
This screen displays the status of the 83339-A Day/Night sensor if a Model 8364-E or 8365
Visibility Sensor is not installed.
Day - Night: {Day or Night}
Screen 15
This screen displays the output of the visibility sensor extinction coefficient and status.
Vis Ext Coeff: {extinction coefficient}
Status: {OK or ERR} {eight digit sensor status code}
Screen 16
This screen displays error messages associated with the Visibility Sensor. If no errors are
detected, the display will show:
Visibility Sensor
Configuration Normal
If an error is detected, one of the following messages will be displayed.
Setup Error
Clean Lenses
For Model 8364-E and 8365:
Configuration Error
Data Missing
3 Headed Operation
Other Error
Clean Lenses
Data Missing
For other models:
Vis Conf Err. Use STD
10s, 3min, ext, mi, 1200
CHECK Visibility
POWER and COMM LINES
21
Model 1191-I Data Collection Platform
User’s Manual
Screen 17
This screen displays fault information for the visibility sensor.
Visibility Sensor
{Status Normal or No input available}
or
Visibility Failure
{visibility sensor decoded error(s)}
Table 4 lists the visibility sensor status codes that might be displayed when an error is detected,
along with their meanings.
Table 4. Visibility Sensor Error Codes
Model 6364-E Visibility Sensor
Code
Model 8364-C Visibility Sensor
Meaning
Code
Meaning
MODE0D
MODE0I
MODE1D
MODE1I
Mode 0 direct error
Mode 0 indirect error
Mode 1 direct error
Mode 1 indirect error
MODE0
MODE1
DIRECT
OFFSET
Mode 0 error
Mode 1 error
Direct count error
Offset error
E0
E1
D0
D1
XCHK
E0HT
Emitter 0 failure
Emitter 1 failure
Detector 0 failure
Detector 1 failure
Crosscheck error
Emitter 0 heater failure
CROSSCHK
E0
E1
D0
D1
E0HTR
Crosscheck error
Emitter 0 failure
Emitter 1 failure
Detector 0 failure
Detector 1 failure
Emitter 0 heater failure
E1HT
D0HT
D1HT
Emitter 1 heater failure
Detector 0 heater failure
Detector 1 heater failure
E1HTR
D0HTR
D1HTR
Emitter 1 heater failure
Detector 0 heater failure
Detector 1 heater failure
ALHT
PS
ALS head or Day/Night Sensor heater failure
Power supply failure
Screen 18
This screen displays the reporting value in candela of the Ambient Light Sensor.
Ambient Light Sensor
xxxxx Candela
or
Not Installed
22
Model 1191-I Data Collection Platform
User’s Manual
Screen 19
This screen displays the status of the 8364-E or 8365 Day/Night Sensor
8364-E Day-Night
Missing
or
Day
or
Night
or
Not Installed
Screen 20
This screen displays the power status of the 8364-E or 8365.
8364-E
On Battery Power
or
On AC Power
or
Sensor Not Installed
Screen 21
This screen displays the status of the 8364-E or 8365 power supplies.
8364-E Power Supplies
OK
or
Sensor Not Installed
or
Fail {+5, +15, -15}
Screen 22
This screen displays counts of crc errors and timeout errors for the visibility sensor. A crc error
indicates that data is not being received properly due to communication line problems. Timeout
errors indicate that the sensor is not reporting. This may be caused by communication line
problems or a fault with the sensor.
Visi00 CRC Err/Touts
{crc error counter and timeout error counter}
23
Model 1191-I Data Collection Platform
User’s Manual
Screen 23
This screen displays cloud height sensor information: cloud height and sensor status.
{No Clouds Detected or Cloud Base {height} Ft or Cloud Data Missing}
Status: {OK or ERR} {four-digit sensor status}
Screen 24
This screen displays cloud height sensor status information.
CHI Status {sensor status}
{decoded sensor status message}
Screen 25
This screen displays cloud height sensor crc error counts and timeout error counts. CRC errors
indicate that communication problems exist. Timeout errors indicate that the sensor is not
communicating and may be caused by bad communication lines or a problem with the sensor.
Ceil00 CRC Err/Touts
{crc error counter and timeout error counter}
Screen 26
This screen displays the current present weather sensor data.
Present Weather Data
{present weather sensor information}
Present weather data is in the format
WwwPppppSssss
where:
ww is the present weather code (see Table 5)
pppp is the rain rate in 0.001 inches per hour
ssss is the sensor status word, normally 0000
Table 5. Presented Weather Codes
as reported by Model 6490 and Model 6490-I Present Weather Sensors
Code
L=
L
L+
RR
R+
SS
S+
Meaning
Light Drizzle
Moderate Drizzle
Heavy Drizzle
Light Rain
Moderate Rain
Heavy Rain
Light Snow
Moderate Snow
Heavy Snow
Code
PP
P+
II
I+
AA
A+
Meaning
Light Precipitation
Moderate Precipitation
Heavy Precipitation
Light Ice Pellet (optional)
Moderate Ice Pellet (optional)
Heavy Ice Pellet (optional)
Light Hail (optional)
Moderate Hail (optional)
Heavy Hail (optional)
24
Code
ZL
—
ER
CL
Meaning
Freezing Drizzle
Freezing Rain
No Precipitation
Start-Up Indicator
Error Condition
Lenses require
cleaning
Model 1191-I Data Collection Platform
User’s Manual
Screen 27
This screen displays the status values from the present weather sensor.
Present Weather Stat
{present weather status codes}
Present weather status is in the format:
XnnnLnnnKnnnHnnnTnnn
where: nnn is a three digit number
X indicates the start of the carrier raw data field
L indicates the start of the low raw data field
K indicates the start of the particle raw data field
H indicates the start of the high raw data field
T indicates the start of the temperature field
Screen 28
This screen contains status information from the present weather interface computer. CRC errors
indicate that the computer is communicating, but not correctly. It may indicate problems with the
communications line. Timeout errors indicate that no data was received from the sensor when
expected.
PRWX00 CRC Err/Touts
{crc error counter and timeout error counter}
Screen 29
This screen displays information about the data being received from the present weather sensor.
BCC errors indicate that the sensor is communicating, but not correctly. The input message
counter (“Inctr”) shows the number of data packet requests from the DCP to the sensor since
power-up.
PRWX00 BCC Err/Inctr
{present weather sensor internal crc error counter and input message counter}
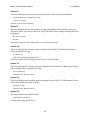
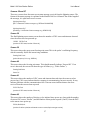
Screen 30
This screen contains the counts for the Analog to Digital negative and positive reference
voltages. These are normally 0 and 4095.
ADC Vref- {adc high reference count}
ADC Vref+ {adc low reference count}
25
Model 1191-I Data Collection Platform
User’s Manual
Screen 31
This screen reports any detected lightning strikes within 10 miles of the installation site. If the
strikes are less than 5 miles away, “TS Reported” will be displayed. This will be voiced in the
AWOS voice output as “Thunderstorm at the airport”. If the strikes are within 5-10 miles,
“VCTS Reported” will be displayed. This will be voiced in the AWOS voice output as
“Thunderstorm in the vicinity”. If no strikes are detected, the message “No Strikes < 10 mi” will
be displayed. This screen is updated every minute.
Lightning Sensor Pg1
{“TS Reported” or “VCTS Reported” }
Screen 32
This screen reports any detected lightning strikes more than 10 miles from the installation site,
up to 30 miles away. If no strikes are detected, the message “No Strikes > 10 mi” will be
displayed. If the data string exceeds the LCD’s capacity (20 characters), the data will be
continued on the next screen (Screen 33). This screen is updated every minute.
Lightning Sensor Pg2
{“LTG_DSNT_” followed by direction in octants}
Screen 33
This screen displays data continued from the previous screen when the amount of data for the 1030 mile range exceeds the LCD’s 20-character capacity. If the data does not exceed 20
characters, this screen is a duplicate of Screen 32.
Lightning Sensor Pg3
{“LTG_DSNT_” followed by direction in octants}
Screen 34
This screen reports the number of strikes detected within the full measuring area (200 nautical
mile radius of the installation site) during the previous one minute. The value is reported in
strikes per minute.
If no strikes were detected, the message “Strike Rate none” will be displayed. This screen is
updated every minute.
Lightning Sensor Pg4
{number of strikes recorded during previous 1 minute}
Screen 35
This screen shows the current operating mode of the sensor. This should always read “Normal
Weather Data”, unless the sensor fails or is disconnected, in which case it will read “Sensor Not
Reporting”.
Lightning Sensor Pg5
Normal Weather Data
26
Model 1191-I Data Collection Platform
User’s Manual
Screens 36 and 37
These two screens show the most recent status message received from the lightning sensor. The
format of the status message is explained in the Model 6500 User’s Manual. Due to the length of
the message, it is split between two screens.
Lightning Sensor Pg6
{first 17 characters of status message; e.g., SPE00MAG@XXN00000}
Lightning Sensor Pg7
{remaining 11 characters of status message; e.g., R0000VB1.03}
Screen 38
The final lightning sensor status screen shows the number of CRC errors and timeouts detected
since the sensor was last powered up.
LTNG00 CRC Err/Touts
{number of CRC errors/number of timeouts}
Screen 39
This screen shows the most recent freezing rain count. This is the probe’s oscillating frequency,
which is normally 40,000 Hz in non-icing conditions.
Freezing Rain Count
{probe frequency, in Hz, e.g., 40000 Hz}
Screen 40
This screen shows the freezing rain status. This should normally indicate “Sensor OK”. If an
error is detected, the screen will show the type of failure (e.g., “Probe Failure”)..
Freezing Rain Status
Sensor OK
Screen 41
This screen shows the number of CRC errors and timeouts detected since the sensor was last
powered up. CRC errors indicate that the computer is communicating, but not correctly. It may
indicate problems with the communications line. Timeout errors indicate that no data were
received from the sensor when expected.
ZR CRC Err/Touts
{number of CRC errors/number of timeouts}
Screen 42
This screen shows the number of deicing cycles initiated since power-up, along with the number
of sensor CRC errors (“BccErr”) and the number of data packet requests (“Inctr”) from the DCP
to the sensor since power-up.
ZR Deic/BccErr/Inctr
{number of deice cycles/sensor internal crc error counter/input message counter}
27
Model 1191-I Data Collection Platform
User’s Manual
Screen 43
This screen is intentionally blank. The technician screens described in Section 3.5 will appear in
this area.
Screens 44 and 45
This series of screens displays data from each of up to four Model 6900 surface sensors.
Runway Condition
{MOIST, WET, RESIDUAL SALT, FZG WET/BLK ICE, CRITICAL or UNKNOWN}
Surface Temp
{nn.nn in degrees Celsius }
A value of MMM indicates that the data are missing, the sensor is not installed or is not working.
Screens 46 and 47
These screens display data from each of up to two subsurface sensors.
Subsurface Temp 1
{nn.nn in degrees Celsius }
Subsurface Temp 2
{nn.nn in degrees Celsius }
A value of MMM indicates that the data are missing, the sensor is not installed or is not working.
Note: Subsurface sensors have been installed on a limited basis at a small number of airports
because of their availability.
Screen 48
This screen displays data from each of up to four Model 6900 surface sensors.
Water Depth
{n.n in millimeters }
Screen 49
This screen shows the incoming packets from the runway surface sensors.
RWY in
xxxx.xxxxxx
or
RWY in/missing
28
Model 1191-I Data Collection Platform
User’s Manual
Screen 50
This screen shows calibration values for technician use only.
xxxx.xxxxxx
x.xxxxxx
3.5 TECHNICIAN SETUP SCREENS
Specialized technician screens can be accessed by pressing the maintenance switch described in
Section 3.2. While all the screens are used by technicians to view sensor outputs, the specialized
technician screens are used to set up and calibrate the sensors. Press the * and # keys on the
keypad to move through the screens —press the # key to move down (to a higher numbered
screen), or press the * key to move up (to a lower numbered screen).
The * and # keys must be pressed within a minute of pressing the maintenance switch, and the
specialized technician screens will appear in lieu of Screen 43. Only the screens associated with
a sensor connected to the DCP will be displayed, so some of the screens described here will not
be available if the respective sensor is not connected.
Follow the instructions for the selected test if that test is to be performed. Otherwise, press # to
proceed directly to the next available test.
UHF Radio Check
The UHF Radio screens are used to test the UHF radio in the DCP, not the actual data link.
UHF Radio Screen 1
Data Link Radio Test
Press 1 to continue
Press 1 to continue to UHF Radio Screen 2.
UHF Radio Screen 2
Data Link Radio Test
Idle: Press 2 to start
Press 2 to start the UHF radio test. The UHF radio in the DCP will start keying. This is used to
check the radio frequency and power output.
UHF Radio Screen 3
Data Link Radio Test
XMIT: Any key = stop
Press any key to stop the UHF radio test.
29
Model 1191-I Data Collection Platform
User’s Manual
Keypad Test Screen
This screen displays the keypad numbers as they are pressed.
Keypad Test. # = Exit
{kepad number pressed}
The keypad test will show each key as it is pressed in sequence, not just the last key pressed.
Note that the asterisk (*) is shown as a period (.).
Calibrate Visibility Sensor
This screen is used to calibrate the Visibility Sensor.
Cal {Model} Vis Sensor
1 to Cont, # to Exit
Follow the instructions on the LCD screen, which match the calibration instructions in the User’s
Manual for the corresponding Visibility Sensor. This feature allows the DCP to be used to
calibrate the Visibility Sensor in lieu of the handheld terminal.
Test Visibility Sensor
This screen is used to calibrate the Visibility Sensor.
Test {Model} Sensor
1 to Cont, # to Exit
Follow the Test Mode instructions in the User’s Manual for the corresponding Visibility Sensor.
This feature allows the DCP to be used to test the Visibility Sensor in lieu of using the handheld
terminal.
Calibrate ALS Sensor
This screen is used to calibrate the ALS Sensor used with the Visibility Sensor. This screen is
intended for factory use only, and must not be used in the field.
Cal {Model} ALS Sensor
1 to Cont, # to Exit
Follow the factory calibration instructions for the ALS Sensor.
Calibrate Freezing Rain Sensor
This screen is used to calibrate the Freezing Rain Sensor. This screen is intended for factory use
only, and must not be used in the field.
Cal Frz Rain Sensor
1 to Cont, # to Exit
Follow the factory calibration instructions for the Freezing Rain Sensor.
30
Model 1191-I Data Collection Platform
User’s Manual
De-Ice Freezing Rain Sensor
This screen is used to de-ice the Freezing Rain Sensor.
De-Ice FZRA Sensor
1 to Cont, # to Exit
BP Sensor Offset
This screen is used to set the Barometric Pressure Sensor offset as described in the Model 7150
Barometric Pressure Sensor User’s Manual.
Set BP1 Offset Screen 1
Set BP 1 Offset
Press 1, # to Cont
Press 1 to go to the next screen to start entering the offset.
Set BP1 Offset Screen 2
Use this screen to set whether the offset is positive or negative.
BP1 Offset Sign
Press 1 (+) or 2 (–)
Set BP1 Offset Screen 3
Use this screen to set the offset.
BP1 offset BP #1
# when done {.xxx}
Enter the offset and press # when done.
Set BP1 Offset Screen 4
A confirmation display appears and indicates whether the offset was entered successfully or not.
Follow the recommendation if the offset was not entered successfully and use the * key to go
back to the first BP1 offset screen.
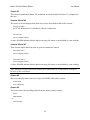
Additional Set BP Offset Screens
Similar screens appear for the BP2 and BP3 offsets. Set these if applicable to the BP sensor.
3.6 LED INDICATORS
The DCP SLED is equipped with six LED indicators on the left side of the LCD/keypad display
that provide a visual clue to the activity and status of several portions of the DCP circuitry.
PWR ON
The green PWR ON LED is lighted when power to the DCP SLED is on.
31
Model 1191-I Data Collection Platform
User’s Manual
STATUS
The green STATUS LED is on when the embedded single-board computer is operating.
Tx
The green RS-232 TX LED lights when data are being transmitted to the CDP via the RS-232
port.
RX
The green RS-232 RX LED lights when data are being received from the CDP via the RS-232
port.
RS-485
The green RS-485 LED lights when data are being transmitted to or received from the CDP via
the RS-485 port.
BLOWN FUSE
The red BLOWN FUSE LED lights when the MARS (Motor Aspirated Radiation Shield) fuse
has blown.
32
Model 1191-I Data Collection Platform
User’s Manual
4. MAINTENANCE
No regular maintenance is required with the Model 1191-I Data Collection Platform, other than
verifying periodically that all cables are connected and in good condition.
A 0.5 A slow-blow fuse protecting a connected MARS (Motor Aspirated Radiation Shield) is
located at F1 on the DCP SLED. This should be checked if a MARS failure is detected or if the
red BLOWN FUSE LED is on.
When performing maintenance on any other part of the system, remember to press the maintenance
switch (S2) prior to beginning maintenance as explained in the Operation chapter of this manual.
33
Model 1191-I Data Collection Platform
User’s Manual
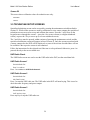
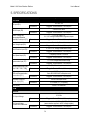
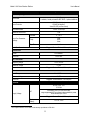
5. SPECIFICATIONS
Parameter
Specification
DCP SLED
DC Input (P1)
RS-232 Input (P2)
MARS Voltage and
Temperature/Relative
Humidity Probe Input (P3)
Rain Gauge Input (P4)
Wind Direction Input (P5)
Wind Speed Input (P6)
Pyranometer Input (P7)
RS-485 Inputs (P8A, P8B,
P9A, P9B, P10A, P10B))
CDP and Communication
Connections (P11)
Barometric Pressure
Sensor Input (P12)
24 V DC, 4 A
Connectors
Pluggable Terminal Blocks, 5.00 mm pitch
3-wire RS-232 serial
Connectors
Pluggable Terminal Blocks, 3.81 mm pitch
+15 V DC output, 1 A
0–1 V DC voltage measurement range both inputs
Connectors
Pluggable Terminal Blocks, 3.81 mm pitch
Counter 0–10 counts/s
Connectors
Pluggable Terminal Blocks, 3.81 mm pitch
0–1.667 V DC voltage measurement range
Connectors
Pluggable Terminal Blocks, 3.81 mm pitch
Frequency Counter 0–1600 Hz
Connectors
Pluggable Terminal Blocks, 3.81 mm pitch
0–1 V DC voltage measurement range
Connectors
Pluggable Terminal Blocks, 3.81 mm pitch
RS-485 half-duplex serial
Connectors
8 Pluggable Terminal Blocks, 3.81 mm pitch
+15 V DC output, 1 A
3-wire RS-232/RS-485 half-duplex serial
Connectors
Pluggable Terminal Blocks, 3.81 mm pitch
RS-485 half-duplex serial
Connectors
2 × 5 header, 0.1” pin spacing
LCD Display
2 lines × 20 characters
UPCM
Electrical
24 V AC, 8 A
47–63 Hz
AC Output Voltage
Connectors
DC Output Voltage
on Serial Port connectors
Pluggable Terminal Blocks, 5.08 mm pitch
Switch-selectable for 12 V DC or 24 V DC, 100 W max.
(same selection applies to all DC voltage outputs)
Connectors
Pluggable Terminal Blocks, 5.00 mm pitch
34
Model 1191-I Data Collection Platform
User’s Manual
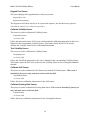
Parameter
Specification
Individually Configurable Serial Ports
Up to 3:
1 available, 1 serial port used for DCP SLED, 1 optional additional
Serial Ports
RS-485 (half duplex)
RS-485 (full duplex)1
3-wire RS-232 (no flow control)
Serial Protocols
Serial Baud Rates
1200 to 115200 bps
Maximum Packet Size
1 kB
Data Bits
Serial Port Parameter
Settings
5, 7, or 8
Parity
Odd
Even
None
Stop Bits
1 or 2
Serial Port Connectors
Pluggable Terminal Blocks, 3.81 mm pitch
Ethernet Port
TCP/IP
10/100Base-T
Connector
RJ-45 Jack
Fan Tachometer
Frequency Range
0 to 10,000 Hz
Maximum Voltage
5 V DC
Connector
Pluggable Terminal Blocks, 3.81 mm pitch
Counter
Count Range
0 to 10,000 s-1
Maximum Voltage
5 V DC
Connector
Pluggable Terminal Blocks, 3.81 mm pitch
Electrical
85–265 V AC, 10 A
47–63 Hz
AC
Supply Voltage
Protected by two 10 A slow-blow fuses,
surge-suppressed AC line voltage is also available to power
other devices up to 500 W
Pluggable Terminal Blocks, 7.62 mm pitch
Backup
Battery
1
12 V DC, 5 A•h
The implementation of RS-485 is electrically equivalent to RS-422.
35
Model 1191-I Data Collection Platform
User’s Manual
Parameter
Specification
8–37 V DC
(must be at least 15 V DC to charge backup battery)
Solar (optional)
Environmental
Operating and
Storage
Temperature
-70 to +70ºC
(-94 to +158ºF)
with enclosure heater
Humidity
0–100% (noncondensing)
Mechanical
Enclosure
NEMA 4X fiberglass
Mounting
Enclosure
Unistrut mounted
Dimensions
Enclosure
39 cm W × 53 cm H × 28 cm D
(15.5" W × 20.75" H × 11" D)
Weight
12 kg (26 lb)
Shipping Weight
16 kg (35 lb)
36
Model 1191-I Data Collection Platform
User’s Manual
6. WARRANTY
This equipment has been manufactured and will perform in accordance with requirements of
FAA Advisory Circular 150/5220-16B. Any defect in design, materials, or workmanship which
may occur during proper and normal use during a period of 1 year from date of installation or a
maximum of 2 years from shipment will be corrected by repair or replacement by All Weather
Inc.
37
All Weather Inc.
1165 National Drive
Sacramento, CA 95818
Fax: 916.928.1165
Phone: 916.928.1000
Toll Free: 800.824.5873
1191-I-001
Revision A
November, 2015