1
Geological Survey of Canada
Open File 3239
B. Brodaric1, R. Harrap2 and D. Lemkow1
FieldLog v. 3.0:
User's Guide and Reference
1
2
Geological Survey of Canada
Queen’s University, Kingston, Ontario
2001
Canada
FieldLog Manual, Version 3.0
Table of Contents
PREFACE .............................................................................................................................................................1
A Field Data Management Program for Geologists....................................................................1
About This Manual .....................................................................................................................2
Organization of the Tutorial.................................................................................................3
Font Conventions.................................................................................................................3
A Note On FieldLog Platforms...................................................................................................3
Acknowledgements..............................................................................................................4
CHAPTER 1: Why Use FieldLog?......................................................................................................................5
Introduction .................................................................................................................................5
Background .................................................................................................................................5
The Field Mapping Process .................................................................................................6
About Classification ............................................................................................................7
The Field Analysis and Cartography Process ......................................................................8
Summary .....................................................................................................................................9
CHAPTER 2: Starting FieldLog .......................................................................................................................11
Introduction ...............................................................................................................................11
Logging on to a FieldLog Database..........................................................................................11
Starting AutoCAD .............................................................................................................11
Opening SnowLake.dwg....................................................................................................12
Starting FieldLog ...............................................................................................................12
Logging on to a Database ..................................................................................................12
Browsing the SnowLake Database ...........................................................................................13
About FieldLog Data Tables..............................................................................................15
Logging Off .......................................................................................................................15
Ending an AutoCAD Session ............................................................................................16
Summary ...................................................................................................................................16
AutoCAD Novices.............................................................................................................16
CHAPTER 3: Adding and Editing Data in FieldLog 3...................................................................................17
Introduction ...............................................................................................................................17
Before You Begin......................................................................................................................17
Adding Data to a Table .............................................................................................................18
Getting Ready ....................................................................................................................18
Adding a New Traverse .....................................................................................................19
Adding New Stations .........................................................................................................20
Adding Lithology Data ......................................................................................................21
Adding Structural Data ......................................................................................................22
Adding a Sample to Station me1........................................................................................23
Adding a Photograph Caption to the Photo Catalog..........................................................24
Using Fl-query to Check a Station’s Values ......................................................................24
Adding Information To Existing Stations..........................................................................25
Exercises ............................................................................................................................25
Editing Data ..............................................................................................................................26
Editing a Station’s Location...............................................................................................26
Moving a Station .................................................................................................26
Moving a Row .....................................................................................................27
Editing a Structural Symbol using Fl-edit .........................................................................28
Editing a Photo Caption with Fl-query ..............................................................................28
Summary ...................................................................................................................................29
CHAPTER 4: Querying a Database .................................................................................................................31
Introduction ...............................................................................................................................31
Before You Begin......................................................................................................................32
Benefits of Using Layers...........................................................................................................32
Performing a Simple Query — Details .....................................................................................33
Choosing the Input for a Query .........................................................................................36
Choosing the Output for a Query.......................................................................................37
Running the Query.............................................................................................................37
Performing a Spatial Query.......................................................................................................39
Selecting a Query Area on a Map ......................................................................................39
Selecting Data ....................................................................................................................41
Plotting Data ......................................................................................................................41
Performing a Compound Query ................................................................................................43
Beginning the Query ..........................................................................................................43
Setting Up Conditions........................................................................................................43
Exporting Query Results....................................................................................................44
Conclusions...............................................................................................................................45
CHAPTER 5: Attaching Data to Lines.............................................................................................................47
Introduction ...............................................................................................................................47
Line Attachments ......................................................................................................................47
Adding an Outcrop to Your Drawing.................................................................................48
Associating Data with the Outcrop ....................................................................................48
Creating a New Entry ..........................................................................................48
Adding an Outcrop Description...........................................................................49
Verifying that an Attachment Worked ................................................................50
Conclusions...............................................................................................................................50
Summary ...................................................................................................................................50
CHAPTER 6: Map Preparation with AutoCAD .............................................................................................51
Introduction ...............................................................................................................................51
Drawing a Map ..................................................................................................................51
What is AutoCAD? ............................................................................................................52
Grouping Data....................................................................................................................52
Data Types in GIS ..............................................................................................................53
The Curvature Problem......................................................................................................54
Closure ...............................................................................................................................54
Scale...................................................................................................................................55
AutoCAD Commands ...............................................................................................................55
Organizational Commands.................................................................................................55
New Maps............................................................................................................55
Tablet Calibration ................................................................................................56
Layer....................................................................................................................56
DDLMODES .......................................................................................................57
End and Quit........................................................................................................58
Undo ....................................................................................................................58
Navigation and Display Commands ..................................................................................58
Move....................................................................................................................58
Pan .......................................................................................................................58
Zoom ...................................................................................................................58
Redraw.................................................................................................................59
Regen ...................................................................................................................59
List.......................................................................................................................59
Drawing Commands ..........................................................................................................59
Line......................................................................................................................59
Pline.....................................................................................................................59
Pedit.....................................................................................................................60
Osnap ...................................................................................................................60
Chprop .................................................................................................................61
Text......................................................................................................................61
Dtext ....................................................................................................................61
Rotate...................................................................................................................61
Copy ....................................................................................................................62
Scale ....................................................................................................................62
Erase ....................................................................................................................62
File Management Commands ............................................................................................62
Save .....................................................................................................................62
Save As................................................................................................................62
DXFOUT.............................................................................................................62
DXFIN .................................................................................................................63
WBLOCK............................................................................................................63
INSERT ...............................................................................................................63
Advanced Issues........................................................................................................................63
Blocks and Attributes ..........................................................................................63
XREFs .................................................................................................................64
Explode................................................................................................................64
Summary ...................................................................................................................................64
CHAPTER 7: Customizing FieldLog ...............................................................................................................65
Introduction ...............................................................................................................................65
Warning..............................................................................................................................65
Customizing FieldLog Palettes .................................................................................................66
Palettes and Profiles...........................................................................................................66
Using Palettes............................................................................................................................67
Example of Modifying Palettes.................................................................................................68
Before You Begin...............................................................................................................68
Simple Palette Changes .....................................................................................................68
Controlling Data Entry with Input ............................................................................................70
FieldLog Dictionaries and Profiles ...........................................................................................72
Examples of Using Dictionaries and Profiles ...........................................................................72
Before You Begin...............................................................................................................72
Dictionary Access ..............................................................................................................73
Profile Modification...........................................................................................................74
Modifying FieldLog’s Table Structure......................................................................................75
Example Using Table Setup...............................................................................................77
Table Setup and Registration .............................................................................................78
Grouping Data....................................................................................................................80
Map Setup .................................................................................................................................81
Fl-Update ..................................................................................................................................83
Conclusions...............................................................................................................................84
CHAPTER 8: Importing and Exporting Data; Using the Newton, GPS, and External Databases............85
Introduction ...............................................................................................................................85
Working with FieldLog and the Newton...................................................................................85
Why the Apple Newton?....................................................................................................86
Why Fieldworker Pro?.......................................................................................................86
What You Need..................................................................................................................86
Before You Start.................................................................................................................86
Loading Fieldworker Pro (FWPro) on the Newton ...........................................................87
Creating a Project Template to Use with FWPro ...............................................................87
Making a FWPro Project Template from FieldLog ............................................87
Transferring a FWPro Project Template from the PC to the Newton.................88
Troubleshooting .................................................................................................................89
Data Input on Site Using the Newton, FWPro, and GPS..........................................................90
The Newton and FWPro ....................................................................................................90
Global Positional Systems (GPS) .............................................................................................91
What is GPS? .....................................................................................................................91
Why Use GPS? ..................................................................................................................91
Before You Begin...............................................................................................................92
Default GPS Settings .........................................................................................................92
Datum Conversion .............................................................................................................93
Collecting GPS Data ..........................................................................................................93
Transferring Field Data from FWPro to FieldLog and AutoCAD.....................................94
Create an Export Text File on the Newton..........................................................94
Transfer the Export File from the Newton to the PC using FWC .......................94
Transfer the Data File to Your FieldLog Database .............................................95
Plot New Data to the Map by Querying FieldLog ..............................................97
Sketches...............................................................................................................98
Exporting Data from Your FieldLog Database .........................................................................98
Exporting Data Using Fl-export ........................................................................................99
Exporting Data Using Fl-query........................................................................................101
Exporting Data Using Digital Exchange Format (DXF) in AutoCAD............................102
Importing Database Tables and Text Files into FieldLog Databases......................................103
Importing Data .................................................................................................................104
Editing FieldLog Data Using External Databases ..................................................................106
Editing Your Database Using MS-Access .......................................................................106
Creating FieldLog-MS-Access Links................................................................108
Importing FieldLog Tables into MS-Access .....................................................110
Summary ................................................................................................................................. 111
APPENDIX A: Installing and Upgrading FieldLog; Creating FieldLog Symbols ....................................113
Introduction .............................................................................................................................113
The FieldLog Distribution ......................................................................................................113
Installing FieldLog Software, Databases, and Connecting to Databases................................114
Installing FieldLog...........................................................................................................114
Installing Sample Data and Creating Project Directories ................................................115
Connecting to Project Databases .....................................................................................115
Setting Up a FieldLog Project Under AutoCAD R12.......................................115
Setting Up a FieldLog Project Under AutoCAD R13 and R14.........................116
Note for ODBC Database Users ......................................................................................118
The Projections Project ...........................................................................................................118
Upgrading From FieldLog v2.83 to v3.0................................................................................119
Upgrading a v3.0 Project From AutoCAD R12 to R13/R14 ..................................................121
Creating Custom Symbols in AutoCAD for FieldLog............................................................122
The DXF2SHX Program .................................................................................................122
The SHX2DXF Program .................................................................................................124
Changing FieldLog Symbols From Shapes to Blocks ............................................................124
Conclusions.............................................................................................................................125
APPENDIX B: FieldLog: Data Models, Relational Databases, and FieldLog’s Database Design ...........127
A Brief Description of FieldLog.............................................................................................127
Abstract ............................................................................................................................127
Geologic Map Construction .............................................................................................127
Data Entry ........................................................................................................................129
Mobile Computing ...........................................................................................................130
Operating Platforms .........................................................................................................131
Database Query ................................................................................................................132
Coordinate Systems .........................................................................................................133
Distribution........................................................................................................133
Bibliography ....................................................................................................................133
Data Models ............................................................................................................................135
What is a Database? .........................................................................................................135
Data Models .....................................................................................................................135
Data Modelling ................................................................................................................135
Conceptual Modelling......................................................................................................137
Logical Modelling............................................................................................................138
Physical Modelling ..........................................................................................................138
Geographical and Geometric Modelling..........................................................................138
Bibliography ....................................................................................................................139
The Relational Data Model .....................................................................................................141
Relations ..........................................................................................................................141
Tables ...............................................................................................................................142
Primary Key.....................................................................................................................143
Foreign Key .....................................................................................................................145
Normalization ..................................................................................................................147
1st Normal Form..............................................................................................................148
2nd Normal Form.............................................................................................................149
3rd Normal Form .............................................................................................................150
Over-normalization ..........................................................................................................151
Bibliography ....................................................................................................................152
FieldLog’s Database Design ...................................................................................................152
FieldLog’s Database Design ............................................................................................152
Referential Integrity.........................................................................................................155
Functional Dependency and 3rd Normal Form ...............................................................155
Geologic Influences and Relations ..................................................................................156
Indexing ...........................................................................................................................156
Annotated Bibliography of GIS for Geologists ..............................................................................................159
Introduction .............................................................................................................................159
WWW References...................................................................................................................159
Papers ......................................................................................................................................160
Books ......................................................................................................................................163
GIS ...................................................................................................................................163
Geology Specific..............................................................................................................165
Computer Science, Mathematics, and Philosophy...........................................................166
Graphic Design ................................................................................................................169
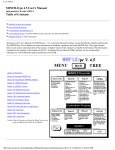
Welcome to the FieldLog 3
Manual
PREFACE
A Field Data Management Program for Geologists
FieldLog is a software module that runs with AutoCAD, the premier personal computer and
workstation drafting software program. Together they provide an extensive set of cartographic and
data analysis tools for field-based geologists. FieldLog is designed to:
• Provide a consistent and efficient data-entry environment for all field data
• Provide a powerful yet flexible organization scheme for field data
• Extend the capabilities of field researchers by providing a simple search environment that
enables them to ask questions about data in the field
• Seamlessly handle coordinate issues such as map projections and user grids
• Seamlessly integrate existing data sources both towards field research questions and building a
final map product
• Simplify the problem of regional compilation by providing geological glossaries of terms that
may be consistent between many projects
• Provide a painless export mechanism so that data can be passed on to other users or
cartographic specialists for final map production
FieldLog delivers all of these functions, and many more, in an easy to use and efficient package.
Furthermore, FieldLog provides long term benefits to users via:
• Simple and complete GIS export and data import capabilities
• Consistent interface and operation across multiple operating system platforms and between
local and corporate databases
FieldLog 3 Users Guide
1
About AutoCAD
AutoCAD is primarily designed for the cartographic drafting of objects
that are not specially located on the earth’s surface. As a result, while
many of its tools are useful for cartography, it has fundamental limitations
when it comes to geological map construction. These limitations include:
• No support for real world coordinate systems
• Limited support for managing data external to the map
• No extensions for geological data handling
The first limitation is a reflection of AutoCAD’s inability to accommodate
for the curvature of the earth’s surface. Most field projects cover large
enough areas that this will introduce significant errors into a map. The
second limitation has to do with AutoCAD’s limited tools for managing
databases attached to maps. The third limitation reflects the fact that
AutoCAD is not tailored for geological data entry, query, or analysis.
These problems are solved by having FieldLog provide tools for map
projections, geological database management, and analysis.
Thus, AutoCAD makes a suitable foundation for field mapping only if
projections and other geologic tools are built in. These form a significant
part of FieldLog, as you will see in this introductory manual.
About This Manual
This manual covers the basic FieldLog system and includes a tutorial covering
general use of the FieldLog system: installation, customization, and
downloading, importing and exporting of data. It also contains notes on using
AutoCAD for preparing maps.
Geographic Information Systems technology draws upon a wide variety of
source fields, ranging from mathematics through cartography and computer
science. As we cannot hope to cover all of this material in this FieldLog manual,
attached is an annotated bibliography to key references for further learning about
GIS.
We don’t expect that FieldLog will be the final repository of all geological
information you will collect. In fact, most users eventually migrate their data to a
desktop GIS such as ArcView or MapInfo, or to a full GIS such as ArcInfo, for
integration with remotely sensed data, geophysical and geochemical imagery,
and so on. This manual briefly covers the export of data from FieldLog to other
systems.
2
FieldLog 3 Users Guide
A Note On FieldLog Platforms
Organization of the Tutorial
The chapters in the tutorial are quite short, and you should be able to find a
topic by chapter title relatively quickly or by referring to the Table of
Contents. Boxed information delivers details that the average user might not
need to know. When in doubt, start reading the box and if you don’t see the
need to continue, stop! In effect, the boxes are appendix material that we’ve
inserted into the text to elaborate on the text.
There are four sections in this manual:
• Section 1: Introduction and User Overview
This section explains exactly where FieldLog fits relative to other
software tools you may have used or seen, and what role it addresses in
the organization.
• Section 2: Tutorial (Chapters 2 to 5)
With geological field data and maps from a project in northern Manitoba,
the tutorial gets you up and running with FieldLog quickly and
efficiently.
• Section 3: Integration, Installation, and Customization
This section covers the use of AutoCAD for map preparation, installation
of FieldLog under AutoCAD 12, 13, and 14, and a brief introduction to
customizing FieldLog to serve your specific needs.
• Section 4: Exporting and Importing of Data
This section covers importing and exporting data as well as editing data
through external databases.
Font Conventions
Text in courier font indicates a command that you type. For example, to log
on to FieldLog:
Type fl-logon, then press Return.
Bold text in Times-Roman font indicates an action you can carry out using
either your mouse and the pull down menus, or the keyboard. For example,
to save a file:
Choose File>Save from the AutoCAD menu or type save at the
command line and then press Return.
A Note On FieldLog Platforms
FieldLog currently runs only with AutoCAD for Windows and DOS.
Currently supported versions include AutoCAD 12 for DOS and 12 through
14 for Windows 95 and NT. There are currently no plans to port FieldLog to
other systems or to support AutoCAD 2000 and beyond.
There have been dramatic changes to AutoCAD across the supported
platforms and we can’t hope to cover all of the detailed differences. This
manual was written to explain the use of FieldLog 3 running with
FieldLog 3 Users Guide
3
AutoCAD 12 for Windows. All screen captures are from that system.
FieldLog’s appearance is fairly constant across all the supported platforms, but
the background window appearances may differ somewhat.
Differences between the AutoCAD versions that affect installation, setup, and
database connectivity are covered in the installation notes.
Where there are significant differences between the functionality of different
versions of FieldLog, we explain this in clearly labelled sidebars.
Acknowledgements
The authors wish to acknowledge the contributions of the many FieldLog users;
without their dedication, patience, perseverance, and constructive feedback,
FieldLog would not have evolved to its present state. It’s impossible to list all
those who have contributed in so many ways, but special thanks is due to the
Ontario Geological Survey for providing funding and support for the initial
development and use of FieldLog and to the Geological Survey of Canada for
funding and supporting FieldLog's subsequent evolution. Rob Harrap initially
developed the manual and Deborah Lemkow significantly assisted in the
manual's upgrade. Finally, the authors wish to thank their families for often
bearing the burden of FieldLog's development.
4
FieldLog 3 Users Guide
CHAPTER 1
Why Use FieldLog?
Introduction
What exactly is FieldLog and what can it do for you? Why is it worth the effort of taking a
computer into the field and reading a manual such as this one? Where does it fit into the goals of
mapping and exploration organizations? Why are most academic and industry geologists now using
computer mapping technologies in their day-to-day work? In this chapter we cover these questions
and introduce spatial information technology — traditionally called Geographic Information
Systems (GIS).
Background
There has been a fundamental change in field mapping in the past decade as more and more
mapping organizations, ranging from geological surveys through to prospectors, come to terms
with three fundamental facts of life:
• Decisions are being made in shorter and shorter timeframes
• Decisions are being based on larger and larger datasets
• Decisions are being influenced by ever wider ranges of datatypes
Whereas field mapping and exploration decisions twenty years ago were often based on the
personal knowledge of a single expert referring to one map and at most a few reports, many
decisions now draw on diverse data from technologies such as digital geophysics, compiled
geochemical atlases, remotely sensed data, and compiled geological maps available in digital form.
These datasets, hosted on computers rather than in report and map format, are ever larger, and have
already largely surpassed the ability to be used without information systems tools.
The transition was and continues to be sped on by the rapidly decreasing costs of both the software
and compiled data sources; datasets that a decade ago would have been impossibly expensive are
FieldLog 3 Users Guide
5
Why Use FieldLog?
now available at no cost across the Internet, and the number of available datasets
is ever growing.
Desktop decision support tools have the potential to help with the facts of life
listed above, if all of the data is compatible with these tools. In many businesses,
decision support tools based on relational databases are completely interwoven
with corporate structure and function, supporting tasks ranging from inventory
control to market prediction. These tools directly respond to large datasets, rapid
decision making reality of recent times. In many ways, these tools have created
the current situation.
GIS tools are specialized decision support tools that handle data where spatial
location is a significant part of the decision making process. In fact, traditional
decision support tools are rapidly merging with GIS tools since most business,
scientific, and governmental decisions do involve questions of location and
spatial relationships.
In a typical mapping office, desktop GIS tools ranging from specialized
geophysical and geochemical processing packages through to Internet-hosted
data browsing tools are being used to make decisions faster, with larger and more
diverse datasets. In many ways GIS tools define a new communications medium,
since by hosting all of the critical information in an organization in one
environment, they promote collaborative and cross-disciplinary decision making.
The down side of the use of GIS tools is that all data must be collected or
reprocessed into a format compatible with the system. For many subdisciplines
of mapping, such as geophysics and remote sensing, the data as collected is in
fact digital, and so all that is required is reformatting into compatible, standard
data structures. Other data, however, is principally analogue, and considerable
additional work must be expended to capture this data into a GIS.
Geological field mapping data is a prime example of traditional analogue data
that many organizations are now striving to capture, or in many cases, recapture,
into GIS. If the geological field data is to be incorporated into the decision
making process, the data must both be digital and be of consistent detail and
quality to support the types of questions that facilitate mapping and exploration.
FieldLog addresses the issue of capturing field data directly. To understand what
functionality it incorporates, we need to examine the field mapping process in
more detail.
The Field Mapping Process
Geological mapping and research is fundamentally a problem of collecting data
at various places, and then manipulating the information, directly or indirectly,
either during the field season or after the season is finished, to produce a report
which is almost always accompanied by a map and explanatory graphics.
Most field data that needs to be manipulated is located at a specific point in
space, almost always on the surface of the earth, and most field data occurs as
descriptive classifications, orientation data, and written notes. In a traditional
mapping operation, the data is recorded in an analogue form in a notebook and
when manipulation is necessary the geologist laboriously works through the
notebook and produces a summary. The summary is often a thematic map keyed
to illustrate some aspect of the data or a specialized diagram such as a stereonet
6
FieldLog 3 Users Guide
Background
— a visual representation of data that allows general trends to be noted and
conclusions to be drawn.
In fact, perhaps the last thing a field geologist really needs is to have a
project’s field data strewn through various notebooks, with each query
concerning the data requiring extensive reading, notetaking, and manual
summarizing on diagrams. All of these take time away from mapping and
divert it to clerical duties. This is where a GIS can help.
The crucial balance that must be achieved is between the power of the GIS to
aid in analysis and graphic production versus time spent entering data in the
first place. There have been two approaches to the problem of using GIS to
date:
• Collection of traditional analogue notes and then recapture into a GIS
either in the evening or post-season
• Collection of digital notes on the outcrop, possibly using Global
Positioning System (GPS) navigation to simplify location finding
FieldLog 3 supports both types of data capture. For recapture, it provides an
interface whereby field notes can be added to project specific databases. It
handles multiple projects simultaneously to simplify organization, and
provides cartographic functionality through AutoCAD to draw a
publication-quality map.
For digital capture, FieldLog supports importing field data from PDA
(Personal Digital Assistants) handheld computers, such as the Apple
Newton, and the direct import of tables captured in delimited format from
GPS receivers. It also can be used directly in the field, running on a pen or
mouse-based portable. The only limitation in this process is that the
computer must be capable of running AutoCAD. To date this rules out using
Windows CE-based palmtops to run FieldLog directly.
The advantage of digital capture over recapture is clear: by providing
capture on the outcrop, the GIS is bound to be more complete, more
consistent, and also may aid in the mapping process by allowing limited
analytical work on the outcrop. By being captured direct to digital, time
spent recapturing the data in the evening can instead be directed towards
map production, thinking about the data, and carrying out analysis.
About Classification
When geologists examine a sample, or geological structure, they are fitting
what they observe into a classification scheme based on their knowledge of
geological methods and theory. Scientific terminology is a rigorous system
for classifying observations in a way that allows unambiguous
communication, at least as an ideal.
When categorizing an observation, there are two issues that become central:
the consistent use of terminology by members of a mapping team and a
consistent level of detail of classification.
Much of the query functionality and data entry tools in FieldLog are built
around supporting consistent field observations so that the field mapping
database will be as useful as possible. These tools, as a result, have explicit
ways of dealing with terminology.
FieldLog 3 Users Guide
7
Why Use FieldLog?
The Field Analysis and Cartography Process
Why AutoCAD?
FieldLog is a module that runs
within AutoCAD. Why isn’t it
an independent program?
AutoCAD is a high end CAD
program with hundreds of
features and a thick set of
manuals. It provides interactive
drawing tools, support for
digitizers and other specialized
hardware, and handles the
storage of spatial information
internally. FieldLog adds only
the specialized geological and
GIS tools that are lacking in
AutoCAD.
AutoCAD’s drawing tools,
layer support, linetypes, and
hatching allow sophisticated
maps to be produced quite
easily. The combination of a
colour inkjet printer, a laptop
running FieldLog, a digitizer,
and a word processor turns a
bush camp into a map
production studio!
Once consistent data is captured into a field system such as FieldLog, it’s
straightforward to carry out decision support analysis using the data. Typical
questions asked of spatial data are:
• Locating subsets of the data that have specific characteristics...
where are the granite outcrops? where are the steep structural fabrics? where are
the mafic rocks that were sampled? where are the sedimentary rocks with known
bedding orientation that also had tops determined?
• Locating subsets of the data based on location...
isolate all of the stations that are in the northeast quadrant of the map for output to
a more detailed map... find all structural measurements that were made within 1km
of a specified fault zone... plot a stereonet of all structural measurements in an
irregular area...
• Locating subsets based on complex combinations of characteristics and
location...
make a stereonet of all planar fabrics recorded in mafic volcanics within an
irregularly defined zone, where the mapping was done by a specified geologist...
Since a spatial decision support system can handle most possible geological
questions in principal, the usual limiting factor on analysis is the availability and
continuity of suitable data. Consistency of terminology and detail is crucial.
FieldLog supports these type of analysis by providing a rigorous data model for
the storage of the field information and by providing powerful database and
spatial search tools to act on the stored data. FieldLog is capable of performing
composite searches, including any of the types used as examples above, and
returning the solution to the question as a table. Once inspected, the results can
be dynamically displayed on the current map view, plotted as a thematic diagram
such as a stereonet or rose diagram, exported to another desktop GIS tool, or
archived to disk. FieldLog further supports naming the question itself, so that a
library of common questions can be built up to speed analysis.
In addition to the ability to search and display results, the system must also be
capable of handling cartographic design as required by a geological map.
Advanced GIS tools can produce publication quality maps with ease — in fact,
most modern maps are produced using GIS. At the level of field geology, needs
are more modest, and the ability to draw polygonal areas, lines with variable
linetype, and add text labels is often sufficient to make field maps. FieldLog
supports cartography via AutoCAD using the traditional AutoCAD drawing tools
to handle line, text, and polygonal area drawing, and extending AutoCAD greatly
to handle the dynamic display of text, structural symbology, and descriptive data
interactively between the field database and the current map.
8
FieldLog 3 Users Guide
Summary
Summary
FieldLog is a rudimentary GIS that stores geological information at points or
related to linework. It provides projection, transformation, and export
support, and has an intuitive and very powerful geological query mechanism
that can create various geological diagrams.
FieldLog runs within AutoCAD, which provides excellent drafting tools for
the production of final output maps and diagrams. Furthermore, AutoCAD is
available on many hardware platforms, enabling you to use the combination
of FieldLog and AutoCAD in situations ranging from a laptop in the field to
a workstation in the lab.
FieldLog 3 Users Guide
9
Why Use FieldLog?
10
FieldLog 3 Users Guide
CHAPTER 2
Starting FieldLog
Introduction
This is the beginning of the introductory tutorial to FieldLog. We assume here that FieldLog is
installed and working, and that the sample data for the Snowlake tutorial project is installed. If this
isn’t the case, refer to Appendix A, Installing FieldLog, and then return here.
Because FieldLog is an extension to AutoCAD, you must operate it from within AutoCAD. In this
chapter you learn how to:
• Log on to FieldLog
• Browse a sample database
• Log off FieldLog
Logging on to a FieldLog Database
Starting AutoCAD
Before you can log on to a FieldLog database, you must start AutoCAD and open a drawing. Refer
to your AutoCAD manual for instructions on starting AutoCAD and opening a drawing.
In this tutorial we use snowlake.dwg, a map of the Snow Lake area of northern Manitoba.* This
map has all of the common elements found in a geological field map — a topographic base,
location information, geologic contacts, and a coordinate system.
* Bailes, A.H., and Galley, A.G., 1993, Geology of the Anderson-Stall volcanic-hosted massive sulphide area, Snow Lake,
Manitoba: Geological Survey of Canada, Open File 2776, 1 map, scale 1:10,000.
FieldLog 3 Users Guide
11
Starting FieldLog
Opening SnowLake.dwg
Snowlake.dwg contains the linework and cartographic annotation for the
SnowLake FieldLog Database. Remember that FieldLog relies on AutoCAD to
manage all the graphical elements of a map, while it adds the underlying database
structure for storing geological field information associated with the map.
To open snowlake.dwg:
1.
Choose File>Open.
2.
Select snowlake.dwg from the snowlake directory (or where you installed the
sample files).
3.
Click OK.
The SnowLake drawing appears.
The drawing is rotated relative
to the screen by about 50
degrees clockwise. This is
because the Snow Lake project
is based on a user grid, and
FieldLog understands and
maintains the relationship
between this grid and standard
methods of projecting maps such
as UTM. The user grid in this
case is rotated relative to north,
and note that the North arrow
points off to the upper right on
your screen. See Map
Projections in Chapter 7 for
more information.
Starting FieldLog
Problems loading a database
If you get an error during
loading (e.g. ‘error 12’) it is
possible that required
AutoCAD components such as
ASE -- external database
connections -- are not installed.
During the installation process
FieldLog established which
projects are available on your
machine. If no names are
present in the pop-up list, the
list of available projects was
not read. This process of
identifying projects depends on
your version of AutoCAD.
Refer to Appendix A for further
information.
Now that you’ve opened a drawing, you can start FieldLog. You can do this
manually or using the FieldLog menu. If you don’t see a FieldLog menu at the
top of your screen, refer to Appendix A for installation instructions.
To start FieldLog:
1.
Choose FieldLog>Load FieldLog.
A message in the AutoCAD command line indicates that FieldLog has
loaded. Now you’re ready to log on to a specific database.
Logging on to a Database
Each time you open FieldLog you must indicate which database(s) you want to
use. Several databases can be active at one time, enabling you to
compartmentalize a project into several independent sub-projects or display
adjoining project data on one map. See Chapter 7 for more information about
project setup.
To log on:
1.
12
Choose FieldLog>fl-logon
FieldLog 3 Users Guide
Browsing the SnowLake Database
The Connect to database dialog box appears.
R13-R14 Note
When logging on in AutoCAD
R13 and R14, only projects not
already logged-on are available
in the pop-up list.
Symbol Errors
In some cases symbol libraries
fail to load properly. If this
occurs, simply click OK to
continue. This may mean some
symbols may not be available
to you when plotting or
inputting data.
If you were logging on to a corporate database, you would need a user
name and password. Because the demo files are local and unprotected,
you can leave the User Name and Password fields empty.
2.
Select SnowLake from the Database Name pop-up, then click OK.
FieldLog begins loading the project description, including the list of
tables in the database, symbol specifications, coordinate systems, saved
database queries, and so on. When FieldLog finishes loading the
SnowLake database, it returns you to the standard AutoCAD command
prompt.
Now that you’ve loaded an AutoCAD drawing, FieldLog, and a sample
database you are ready to browse the database.
Browsing the SnowLake Database
Relational Databases
Relational databases organize
information in tables. Each
table can have multiple
columns, or fields, and any
reasonable number of rows, or
records. Fields have a data type,
meaning that a field might store
a date, an integer, a logical
(true/false) value, or a string of
characters.
FieldLog can store information
in many database formats
through the use of external
database drivers such as ODBC
or those provided by
AutoCAD. FieldLog also
provides its own enhanced
dBase III driver.
A fundamental operation in FieldLog or any other GIS involves asking a
question, then analysing the answer. Normally GIS queries either return a list
of valid data that satisfy the question, or else a map showing this data. In
FieldLog, queries return their results in a query table, which can then be
surveyed visually, edited, plotted or exported to a wide variety of formats,
including to the displayed map. This section provides a brief overview of the
query process using the SnowLake database.
To optimize storage and access of data, FieldLog stores all data in relational
databases. Browsing data stored in relational databases is simply a matter of
asking FieldLog to extract some of the information from the database into a
table, which looks very similar to a spreadsheet display.
To start the query process:
1.
Choose FieldLog>fl-query.
The Query Panel appears (see below). The query command lets you
quickly review your database, as well as create complex, multipart
queries and output the results in varying ways, including to other
programs.
2.
Choose SnowLake from the Project pop-up. Remember that FieldLog
allows you to have a number of separate projects running, attached to a
single map.
3.
Type StatBrowse in the Name box.
Naming the query allows you to rerun it at a later time simply by picking
its name from the Query pop-up. This can save considerable time when
re-using complex queries.
FieldLog 3 Users Guide
13
Starting FieldLog
Error Messages
Three common situations result
in error messages during the
FieldLog query process:
•
If there is no corresponding
data in the database,
FieldLog returns a no data
error. This doesn’t indicate a
true problem.
•
If the query returns a
column name that is
reserved by AutoCAD,
FieldLog returns an error.
•
The number of records that
FieldLog indicates were
found during the query
process is often incorrect
because the calculation
indicates an interim total,
calculated before the final
query is complete. This is an
unavoidable limitation of
the AutoCAD database
environment.
Tables in the SnowLake database include STATI, the station table, STRUC, the
structural table, LITHO, the lithology table, and so on, representing data typically
recorded at a field site. Each table is independent, but can be related or joined to
the others to build a complex query. Here all we want to do is look at an
unfiltered portion of the database — we don’t want to look at the entire database,
just few of the fields from two tables. This is achieved by selecting some of the
database columns from the Output list. Because no further constraint is placed on
the database, all the occurrences of data from those columns are returned as rows
in the result table. This amounts to building a quick summary of your field
database and is analogous to asking the question ‘show me all the data’ stored in
the specified fields.
4.
Choose the following from the Output list:
LITHO.ROCKNUM
LITHO.ROCKTYPE
STATI.UTMX
STATI.UTMY
STATI.UTMZ
These correspond to a numeric identifier for each lithology at a station, as
well as a rock name, from the LITHO table, and a station location from the
STATI table. You can select and deselect entries on the list with successive
mouse clicks.
5.
To run the query, click OK.
A message box appears indicating that FieldLog is running the query. When
the query is done click OK to display the query results where you can use the
Scroll Table dialog box to quickly view large amounts of data.
6.
14
Click OK.
FieldLog 3 Users Guide
Browsing the SnowLake Database
The Scroll Table dialog box appears.
Note that the columns in the table
aren’t aligned. This can happen if
your Windows system font isn’t set
to a fixed width spacing. Fixed width
spacing is possible in DOS and
Windows 3.1 but not in Windows 95/
98/NT environments
Try navigating through the table:
•
•
•
•
Use the slider to view data off of the right side of the table.
Click Next or Prev to scroll up or down.
Click Top or Bot to jump to the top or bottom of the scroll table.
To close the Scroll table, click OK.
About FieldLog Data Tables
R12 Note
FieldLog sorts single-table
queries according to
basenumbers and multiple table
queries according to data values
such as station numbers.
R13/14 Note
All results are sorted according
to a data value such as station
number.
Although many of the entries in the data tables, such as station numbers,
may at first seem redundant, these entries are the key to FieldLog’s power.
Each table contains a column which stores a unique numeric identifier for
each row in the table. In the SnowLake database this column is called
basenumber and it unambiguously identifies individual records (rows).
These unique values allow FieldLog to unambiguously separate what might
otherwise be identical records.
Data is spread between many tables for flexibility and data integrity, but the
tables are related by common column values. For example, rather than
repeating station level information, such as station location or field date, for
each lithology in LITHO, FieldLog uses the STATNUM value found in both
tables to relate station information indirectly. If you have four lithologies at
one station, this means you only have to enter station information once! The
organization of a database into small tables to reduce redundancy is called
database normalization.
Logging Off
When you’re finished using a FieldLog database, log off the database. This
allows FieldLog to terminate any connections to external databases and
close down internal connections clearly.
1.
Type fl-logoff in the AutoCad command line or choose
FieldLog>fl-logoff.
The Disconnect from database dialog box appears.
FieldLog 3 Users Guide
2.
To select the SnowLake database, click it, or click Select.
3.
Click OK.
15
Starting FieldLog
Ending an AutoCAD Session
Database activity isn’t affected
by the File>Save process,
as all database manipulations
are immediately saved on
execution.
If its configuration has been
changed, FieldLog also saves
changes to its setup during the
File-Save process. Simply clear
the resulting message to
continue saving.
To save your drawing and exit AutoCAD:
1.
Choose File>Save. Remember that FieldLog automatically saves your field
observations in a database, but all associated map graphics are stored in an
AutoCAD drawing .dwg file that must be manually saved. If you don’t save
the AutoCAD drawing, you lose all graphics that you added (or changed) during your FieldLog session.
2.
Choose File>Exit AutoCad.
Summary
In this chapter, you learned how to:
•
•
•
•
•
•
•
•
Start AutoCAD
Open a Drawing
Start FieldLog
Log on to a FieldLog database
Browse a FieldLog database using the fl-query command
Log off
Save an AutoCAD drawing
Exit AutoCAD
AutoCAD Novices
If you’re new to AutoCAD, you might want to read Chapter 6, Map Preparation
with AutoCAD, before continuing the tutorial.
16
FieldLog 3 Users Guide
CHAPTER 3
Adding and Editing Data in
FieldLog 3
Introduction
In Chapter 2 you learned how to start FieldLog, log on, and log off a FieldLog database using fllogon and fl-logoff. You also reviewed one section of the sample SnowLake database using flquery. The key points in Chapter 2 are that databases are external to an AutoCAD drawing, which
means you need to connect to them explicitly, and that the database consists of tables that you can
browse, edit, and perform sophisticated queries on.
Building a GIS database is about more than simply browsing records using queries. In this chapter
you’ll discover what’s involved in adding data to an existing database. The process you’ll learn in
this chapter is very similar to the one you’ll perform at the end of a day’s field work or during data
recapture, if you choose to use FieldLog to capture notes from maps and field notebooks.
In this chapter, you’ll learn how to:
• Add data to an existing FieldLog table
• Edit existing data
• Interactively move data on the graphics screen
Before You Begin
If you aren’t logged on to FieldLog and the SnowLake database, follow the steps from Chapter 2 to
open snowlake.dwg, start FieldLog, and log on. Remember that you need to load FieldLog before
you can logon.
FieldLog 3 Users Guide
17
Adding and Editing Data in FieldLog 3
Adding Data to a Table
The FieldLog Data Model
The way that FieldLog
decomposes field data into
distinct tables is called the
FieldLog data model (more on
this in Appendix B).
In brief, the tables mirror kinds
of information recorded during
a fieldwork session. Traverses
are about the days work.
Stations are places where
observations happen.
Lithologies are rock types seen
at a station. Structures are
structural features seen or
measured at a station. Samples
are specimens collected to
match observations, and
include such things as rocks,
soil samples, and photographs.
The overall database structure
thus reflects the field mapping
process. By breaking things into
tables, long-term clarity is
enforced and the ability to
manage large data sets is
enhanced.
Each time you add field data to an existing database, you work with a number of
different tables. For example, after each traverse you’ll probably add:
•
•
•
•
•
•
A new traverse description to the TRAV table
New stations to the STATI table
One or more lithologies observed at each station to the LITHO table
One or more structural measurements per station to the STRUC table
A record of all photographs taken at each station to the PHOTO table
One or more samples to the SAMPL table
As briefly noted in Chapter 2, FieldLog manages field data in a relational
database. Each of the different tables in the database are related to build one
coherent database — see the side bar for a thematic overview. The subdivision of
data you enter into the tables reflects the internal organization of the database,
which reflects the overall structure of fieldwork. As you will see in Chapter 7,
you can customize this organization to meet your needs.
Let’s assume that you’ve done some mapping in the Snow Lake area and are
ready to enter some new data to the SnowLake database.
Getting Ready
First, use AutoCAD’s zoom command to zoom in on the island on the east side of
the map. When you’re done, the island should fill about a tenth of your screen.
Now you’re ready to add the following field geological information to the
SnowLake database:
•
•
•
•
18
A new traverse
Two stations on the island
Lithologies for each station
A sample at one station
FieldLog 3 Users Guide
Adding Data to a Table
• A photo at the other station
• Structural measurements at both stations
As you add the new data, note that you first enter the data into the database,
then on the map. FieldLog setup allows you to specify what database details
appear on the map during this data entry process. As well, any query you run
can output to the AutoCAD map, so you can always dynamically add more
map symbols and text later.
Adding a New Traverse
1.
Type fl-add or choose FieldLog>fl-add.
The FieldLog Add to Table dialog box appears.
To shift between rows in the
forms section, point using your
mouse/digitizer or press the
Return (Enter) key.
Form
If you shift to a field that
requires a value, you won’t be
able to move away from that
field until you enter a value.
Edit box
R13/14 Note
2.
Select SnowLake from the Project pop-up.
3.
Select TRAV from the Table pop-up.
In R13 and R14, the first project
on the list will be automatically
selected.
Now that you’ve chosen to add a new traverse to the database, FieldLog
displays the possible data fields associated with the traverse in the Add to
Table form. This is a data entry form for filling out FieldLog’s tabular
information. By providing a rigorous data entry form, FieldLog supports
uniform detail in a database.
In R12, you must manually
select the project each time.
4.
Select TRAVNUM. Type 29 in the edit box at the bottom of the screen,
then press Enter.
If the entry is valid, FieldLog selects the next item in the table. If the
entry is invalid, a message appears at the bottom of the Add to Table
dialog box.
5.
For GEOLOGIST type ME in the Edit box, then press Enter.
Normally you’d type your initials here, but we don’t know your initials,
and we need these later for a query. Note that if you try to enter a long
name here, FieldLog returns an error. In the setup of the SnowLake
database, this field was deliberately kept short.
6.
FieldLog 3 Users Guide
For NTSMAP, click List (the top right most button).
19
Adding and Editing Data in FieldLog 3
The Select from Profile dialog box appears, listing possible values.
Why Have a Traverse Table?
During a typical data entry
session you add data for one
day of mapping or one traverse.
Why bother explicitly keeping
track of traverses? This simple
once-a-day entry enables you to
do sophisticated queries — such
as displaying mapping done by
one geologist or mapping done
after a certain date.
7.
Choose 63k16, then click OK.
8.
Once you’re back in the Add to Table dialog box, press Enter.
9.
For FieldDate, type 19960621 (or today’s date), then press Enter.
10.
For Summary, type Quick tour of island, then press Enter.
11.
To add the record to the traverse table, click Enter Data at the bottom.
FieldLog assumes that you’ll be adding more traverses to the database, so it
increments the traverse number by one and returns you to the Add to
Database dialog box.
If you want to enter data to another table, you can easily change tables using
the Table pop-up.
12.
When you’re finished adding data, click Cancel. This doesn’t cancel the
entries you’ve just made, it simply ends your current data entry session.
Adding New Stations
About Space
Location on the surface of the
earth is specified using a
coordinate system. In Canada,
the two common methods used
are geographic coordinates (or
latitude/longitude) and
Universal Transverse Mercator
(or UTM). UTM is a map
projection or a method of
transforming locations on a
globe to a flat sheet with a
minimum of distortion.
FieldLog can convert between
most major projections and can
simultaneously record locations
into multiple projections,
automatically converting
between them as data is entered.
The SnowLake database is an
example of where two
coordinate systems are used —
the map is stored in a user grid
coordinate system and the
positions are transcribed into
UTM.
20
When adding a new station to a FieldLog database you must enter the station
coordinates — after all, the key to a spatial database is that it records not only
descriptive information (usually called attributes) but also spatial location. You
can enter coordinates by:
• Typing in the actual numeric value (in the current projection system)
• Pointing with a digitizer or mouse to the station location on the screen
• Pointing with a digitizer or mouse to the station location on a map or air photo
secured to a digitizing tablet (you must first calibrate the map or photo to the
AutoCAD map — see Tablet Calibration in Chapter 6)
During actual field work you might be digitizing the location from a calibrated
airphoto, grabbing the data from a hand held computer or GPS, digitizing from a
sketch map, or visually comparing a sketch on the screen with a paper map. For
simplicity, we’ll use this final method here.
In this lesson you’ll learn how to locate a station by interactively choosing a
point on the screen. This is the least rigorous of the methods allowed because the
location will be specified via approximate visual placement.
1.
To open the Add to Table dialog box, type fl-add or choose FieldLog>fladd.
2.
Select the SnowLake project and the STATI table.
3.
Leave the UTM and GRID, x, y, and z values blank.
FieldLog 3 Users Guide
Adding Data to a Table
If the UTM or GRID, x, y, and z contain values, you won’t be able to
interactively select a point. FieldLog assumes that because you left them
blank, you want to pick the location interactively.
4.
Select STATNUM, type me1, then press Enter.
5.
For AIRPHOTO, type none, then press Enter.
6.
For TRAVNUM, type 29 (since this was the last traverse number you
entered, it should by default already be in the table).
7.
Click Enter Data.
The dialog box disappears and a crosshair with the station symbol and
number appears on the map. If your digitizer was calibrated and you had
a station on map or airphoto to enter, you would now align the digitizer
cross-hair with the station or the digitizer and click. Here, though, you’ll
work in a relative mode, by visually estimating a location.
8.
Move your mouse or digitizer until the crosshair is on a point at the left
side of the island (southwest side), then click to place the data.
Note that the station number is automatically positioned beside the
symbol. (Remember, during setup you specify what database information
appears on the map and what information is simply stored in the
database. For more information on symbol setup, see Chapter 7,
Customizing FieldLog).
FieldLog returns you to the Add to Table dialog and automatically
increments STATNUM by one. Because FieldLog assumes you’ll be
quickly adding blocks of data, it defaults to the next station number.
After the station has been entered, the map should look like the one
shown below. To view the map you can close the fl-add panel by clicking
Quit, or by dragging the panel to one side using your mouse.
Why a Key Number?
If FieldLog included rock
descriptions as part of the
STATION table, you would
have to make assumptions
about data collection during
database setup. How many
rocks, at most, would you leave
room for in the STATI table?
Any unused fields would still
occupy space in the tables, so
your database would be highly
inefficient.
By keeping rock descriptions in
a separate table, the LITHO
table, any number of rock
descriptions can be entered.
Each description represents one
row in the table. Each is
uniquely identified by the
combination of a station
number and lithology code. The
lithology code could be a
sequence number, representing
the 1st, 2nd, 3r... lithology at the
station, or it could be a code
from a geological legend (e.g.,
2a).
Adding Lithology Data
Now we’ll add lithological information for the newly created station. Once
again, we do this using fl-add.
1.
If the fl-add panel is not displayed, open it using the menu or the
command line.
2.
Select the SnowLake database and the LITHO table.
Notice that the station number is already correctly filled in and we can
begin by adding the Lithology. Note that there is a key number for the
rock number. Accept the entry of 1 here and move to the Rocktype field:
3.
FieldLog 3 Users Guide
With Rocktype highlighted, click List on the right.
21
Adding and Editing Data in FieldLog 3
The Select from Profile browser appears.
About Depth
The Profile Browser contains a
viewing depth field and an
Apply button. What are these
for?
Geological classification
schemes are, mostly,
hierarchical. For instance, we
subdivide rocks into igneous,
metamorphic, and sedimentary
classes. We subdivide igneous
rocks into felsic intermediate,
mafic, and ultramafic. The
exact level and type of
subdivision reflects the specific
interests and goals of the
mapping geologist. Most
geologists can agree on the
division and subdivision terms
for rocks, but sub-subdivisions
and so on quickly become
highly personal terms.
4.
Click Pillow Basalt, then OK.
5.
Interactively place the lithology code on your map by pressing Enter Data
and positioning the lithology code on the map.
FieldLog returns you to the add panel.
FieldLog is unique because it
allows geologists to express
queries in geologic terms. To a
great degree this comes from
FieldLog’s use of profiles. The
FieldLog profile allows a query
to specify, for example, all
igneous rocks without naming
them all — the subdivisions
know their division (e.g.,
granite knows it belongs to
igneous rocks).
The Viewing Depth box allows
you to specify how deep into
the profile hierarchy you see. A
0 shows the entire hierarchy, a 1
only the divisions, a 2 the
division and subdivisions, and
so on. Viewing depth can be
useful when you want to scan
the entire profile without
getting overwhelmed by details.
6.
You’re finished adding lithology information. To exit, click Quit.
Adding Structural Data
Next you’ll add some structural data.
1.
Open fl-add, then select the STRUC table.
Notice that the Statnum is already filled in. Because the STATI table ties
station me1 to traverse 29, future queries could search for structures observed
on a specific traverse.
22
FieldLog 3 Users Guide
Adding Data to a Table
Just as the profile for rock types keeps track of rock types hierarchically,
FieldLog can be set up to store structural symbols hierarchically —
planar versus linear, bedding versus foliations, and so on.
Now we’ll use the structural browser to pick a first-phase foliation from
the selection offered.
2.
Click the Feature field, then the Tree button.
The Symbol Tree browser appears.
3.
Click Planar, then Foliation, then s-fol1, and click OK.
4.
To add the chosen symbol to the table, press Return.
5.
Enter 123 as the azimuth, and 45 as the dip.
Your browser should look like the one shown below.
6.
Click Enter Data, then place the symbol on the map.
7.
Your map should look similar to the one shown at the right.
8.
To exit the Add to Table dialog box, click Quit.
Congratulations, you’ve successfully added a station, a lithology, and a
structural measurement to the FieldLog database.
Adding a Sample to Station me1
For practice, and to illustrate a few other features of FieldLog, we’ll now
guide you through entering some more data to the map.
1.
FieldLog 3 Users Guide
In the Add to Table dialog box, select the SnowLake database and the
SAMPL table.
23
Adding and Editing Data in FieldLog 3
To Plot or Not to Plot
2.
Remember that when you add
data to FieldLog you’re
primarily building a database,
not drawing a map. A few wellstructured queries can plot
anything from the a database to
the map at any time. Don’t get
preoccupied with what you do
or do not initially plot to the
map! When in doubt, reduce
clutter on the map by keeping
data in the database only.
Enter the data in the Add to Table dialog box according to the values listed
below:
STATNUM
me1
ROCKNUM
1
SAMPLENUM
1
(for this station)
THIN
N
(no thin section)
STAIN
N
(not stained)
CHEM
N
(not chemically analyzed)
OTHER
(leave blank)
REASON
to assay
R13-R14 Note
In AutoCAD R13 and R14, it is
possible to preview raster
images stored in TIFF, Targa,
and CompuServe GIF (R13
only), and Windows Bitmap
(R14 only) formats. To do this,
a column is designated as an
image column using Input Setup
and FieldLog then interprets the
text as a filename. The text is
entered during fl-add. The
image is displayed when the
user clicks on the Image button
during editing, and is hid when
Enter is pressed. If no path is
specified in the filename,
FieldLog looks in the project
directory for the image file
(e.g., c:\snowlake\rocks.tif). If a
relative path is specified,
FieldLog looks relative to the
project directory (e.g.,
c:\snowlake\images\rocks.tif).
Using an absolute path,
FieldLog looks in the specified
place (e.g., c:\images\rocks.tif).
This allows you to store
references to digital
photography, sketches, and
other raster images in the
database and to display them
using FieldLog.
3.
Before finishing, click the Plot box to empty it. This allows data to be placed
only into the database and not on the map.
4.
Click Enter Data.
You’ve added a sample to the SAMPL table. Note that you didn’t have to enter a
location — the database assumes the sample coincides exactly with its station.
Adding a Photograph Caption to the Photo Catalog
In the Add to Table dialog, select the SnowLake database and the PHOTO table.
1.
Enter data into the Add to Table dialog box according to the values listed
below:
STATNUM
ROLL1
FRAME3
CAPTION
me1
1
12
Interesting feature in outcrop
2.
Again, make sure the Plot box is clear.
3.
To add the station, click Enter Data.
4.
When FieldLog returns you to the Add to Table dialog box, click Cancel to
return to AutoCAD.
For more information on photo captions, see Editing a Photo Caption.
Using Fl-query to Check a Station’s Values
We’ll now check to see if you’re adding the data correctly by using FieldLog’s flquery command.
Notice how easy it is to run a
saved query. As you continue to
use FieldLog, get in the habit of
naming any queries that might
be useful later. Give them
descriptive names so you’ll
remember what they do.
24
1.
Type fl-query or choose FieldLog>fl-query.
2.
To rerun your StatBrowse query, pick it from the list, then click Query.
3.
To move to the bottom of the list, click the Bot button.
FieldLog 3 Users Guide
Adding Data to a Table
Note that me1 is now in the list along with UTMX, UTMY, and other
attributes you added earlier.
Adding Information To Existing Stations
You can go back at any time and add or modify information at existing
stations. In this section we’ll add another structure measurement — a
lineation — to me1 and force it to remain hidden. Hiding information is
useful when you want a complete database, yet don’t want your map to be
too crowded.
1.
Start fl-add using the menu or AutoCad command line.
2.
Choose the STRUC table. To change the current station to me1, select
STATNUM, type me1, then press Enter.
3.
For Feature, click Tree.
The Tree Selection dialog box appears.
4.
Click Linear, then L-Fabric, then the lu symbol.
FieldLog returns you to the Add to Table dialog box.
5.
Press Enter.
6.
For Azimuth, type 45, then press Enter.
7.
For Dip (plunge in this case), type 30, then press Enter.
8.
Clear the Plot checkbox, located at the bottom right of the dialog box.
9.
Click Enter Data.
FieldLog adds the value to the database, but not to the map. You can now use
the fl-query command to check whether the information was entered
correctly into the database. Try it!
Exercises
Before going on to more advanced topics, take a moment and do the
following exercises.
• Add a station, me2, at the other end of the island (use the same date, map,
and so on, as for me1)
FieldLog 3 Users Guide
25
Adding and Editing Data in FieldLog 3
• Add a lithology, pillow basalt
• Add a foliation (s-fol1) with strike 111 and dip 54
• Add a sample, for assay
Make sure you toggle plot back on so that the data ends up on the map. When
you are finished the map around the island should look similar to the one
shown below.
Editing Data
Whether you want to correct mistakes or refine interpretations, you can edit any
data in a FieldLog database. In this section you’ll edit some of the data you just
entered into the SnowLake database.
There are two principal ways to access FieldLog data for editing. If the value you
want to edit is tied to a visible object (a structural symbol, a station marker, and
so on), you can edit the value using fl-move or fl-edit by simply invoking the
command from the menu or command line and clicking on the object on the
screen. If the value isn’t visible, first find the data using fl-query, highlight the
row you want to change or add to, then click Modify to change its value. We’ll
start by moving an existing station.
If FieldLog isn’t running and you aren’t connected to the SnowLake database,
follow the steps from Chapter 2 to open snowlake.dwg and log on to the database.
Editing a Station’s Location
Try using fl-edit to inspect a station. Note that the station has coordinates that
were captured from the mouse interactively.
If you get this message, try
selecting the entity again. You
may not have selected the entity
correctly or you may have
selected an entity that doesn’t
contain any FieldLog
information.
Moving a Station
After entering station me2, you realized that you placed it in the wrong location.
You want to move it a few meters up the right side of the island. If this were
26
FieldLog 3 Users Guide
Editing Data
simply an AutoCAD entity, you could use the move command or drag the
object dynamically. However, since it’s a FieldLog station, you must move
not only the graphic representation of the object on screen, but also the
coordinates stored in the FieldLog database.
About Object Selection
1.
Type fl-move at the AutoCAD command line.
When you decide to move an
object on the map, there’s some
ambiguity about what you’re
trying to accomplish. You might
want to:
2.
Select the station symbol (the X) for station me2, then press Enter.
•
Move all data associated
with a station (STATION)
•
Shift all data associated with
a table by an offset from the
station location — this is
useful for placing structural
data beside stations rather
than on top of them
(TABLE)
•
Move only a selected
database entry from a single
table (ROW)
To accommodate all of these
possibilities, FieldLog displays
the Object Selection Mode
dialog box whenever you use
fl-move.
The Object Selection Mode list box appears. You can use this list to
select all items in the same station, table, group, or row.
3.
To move all data associated with the station, select the Station radio
button.
4.
Click OK.
5.
Drag the station and all associated data to a new location on the right side
of the island.
6.
To place the station in its new location, click.
That’s it! Note that all the lithology and structural data followed along.
Moving a Row
Navigating Tables
Notice that once you have
selected me2 the Table pop-up
list remains available. In
FieldLog you can navigate to
any table related to the currently
selected fl-edit item. Once
you’re finished editing the
second table, using Change
Data saves your edits and
returns you to the previous
table. Quit cancels any edits and
returns you to the previous
table.
FieldLog 3 Users Guide
Occasionally, when you move a station some of the station information, such
as structural symbols, may obscure other objects in your view. To move the
structural symbol for me2:
1.
Type fl-move in the AutoCAD command line.
2.
Select the structural symbol for me2, then press Enter.
The Object Selection Mode dialog box appears. In this dialog box, you
can select items in the same station, table, group, or row.
3.
To move all data associated with the structural symbol (a row in the
STRUC table), select the Row radio button.
This limits the changes you make to the selected structural symbol and
its associated text representing the dip or plunge.
4.
Drag the symbol and dip to a new location.
5.
To place the symbol in its new location, click.
27
Adding and Editing Data in FieldLog 3
R13-R14 Note
In AutoCAD R13 and R14 you
can navigate and display up to
four tables from the original fledit table. In R12 you can only
navigate and display one
additional table. Note that
changes made to the navigated
tables aren’t applied to the map,
as only the database is
modified.
Limits on Modifying Tables in
R12/R13/R14
6.
Editing a Structural Symbol using Fl-edit
Now let’s change the dip of the structural symbol at me2.
1.
Type fl-edit.
2.
Select the structural symbol at me2.
The Edit table dialog box appears, listing the structural data for the selected
symbol.
3.
In R13 and R14, on the other
hand, all scroll tables are
modifiable.
Select DIP, then replace its current value (45) with 55.
Your edit panel should look similar to the one shown below.
If you use fl-query in R12
you’ll notice that the modify
buttons are often greyed out
when you arrive in the Scroll
Table display. In other words,
you can’t modify any of the
data on the display.
This is due to a limitation in
AutoCAD’s support for the
Structured Query Language
(SQL), around which FieldLog
is built. AutoCAD only allows
edits when all displayed data
comes from a single table.
Notice in the photo editing
exercise we only select items
from the photo table — all of
the entries are prefixed by
PHOTO. If we had selected any
entries from other tables — for
example, STATI.STATNUM, we
wouldn’t be able to modify the
data in the table because the
scroll table would contain items
from more than one table.
Use fl-edit on the moved station to verify that the position has indeed been
updated in the database, as shown above.
4.
Click OK.
Your map should now show the changed value of 55. Note that with fl-edit you
can interactively edit all aspects of a structural measurement or any other
database content associated with any map entity created by FieldLog.
Editing a Photo Caption with Fl-query
Next let’s edit the photo caption at me2. Because the photo isn’t shown on the
map, use the fl-query command to access and then edit the caption.
1.
Use fl-query to select all stations with PHOTO.STATNUM > 0.
From the selection list choose the following:
PHOTO.STATNUM
PHOTO.ROLL
R13/14 Note
Digital photographs may be
viewed if the column in the
PHOTO table contains the
filename and if the Image
option is set under the Input
button.
This activates the Image button
which displays the photo when
clicked. Press Enter or ESC to
clear the photo.
28
PHOTO.FRAME
PHOTO.CAPTION
PHOTO.BASENUMBER
2.
Run the query.
3.
When the Scroll Table appears, click Bot to move to the bottom of the table.
4.
Select the me2 entry, then click Modify.
5.
Select the caption, then replace the current text with Fascinating
structures at me2.
6.
To exit, click OK. Note that the entry has changed.
FieldLog 3 Users Guide
Summary
That’s it for adding and editing! Save your drawing and log out of the
SnowLake database.
Summary
In this chapter you learned how to:
•
•
•
•
Add new data to an existing FieldLog database
Move data interactively on the map by item, station, and table
Edit values in the FieldLog database by selecting them on the display
Edit values in the FieldLog database by selecting them with a query
The ability to add data to a database by interactively working on a (screen)
map is an effective way to capture data from analogue field notebooks or to
recapture historic data. Many field geologists are finding, however, that it’s
more effective to capture the data digitally in the field, and then simply
import the captured digital data directly into a database in the base camp.
This is covered in Chapter 8.
Editing is an essential part of day to day usage of any field data capture
system. Editing inevitably precipitates organizational difficulties when
working on larger projects — who has the right to change data?
Furthermore, databases that are hosted on multiple machines can quickly
become internally inconsistent if great care isn’t exercised.
Exactly what is entered and the organization of the database itself is an
essential part of FieldLog usage. The combination of the profiles and forms
in FieldLog enforce a level of data collection, and furthermore a degree of
terminology control, that guarantee that large databases are internally
consistent. The structure shown for the SnowLake dataset is fairly typical of
a geological survey’s normal focus during mapping, but of course all users
will want to customize FieldLog to some degree. Refer to Chapter 7 for
details of customization.
FieldLog 3 Users Guide
29
Adding and Editing Data in FieldLog 3
30
FieldLog 3 Users Guide
Querying a Database
CHAPTER 4
Introduction
Although FieldLog would be useful if all it did was allow you to plot data to a map and build
database files containing field data, FieldLog actually does much more — it leverages the power of
relational databases and CAD programs to enable geologists to change the way geological map
analysis is done. While serving as a cartographic tool, it also incorporates queries similar to those
found in geographic information systems, and further adds a new class of queries based on a model
of how geological nomenclature works.
Although most of the work you’ll do in FieldLog is data entry and editing, the payoff comes when
you mine the database for information. You can mine your database by:
•
•
•
•
•
Querying the database for tabular reports
Querying the database and plotting the results to the map
Deriving stereonets of structural information via a query
Plotting geochemical diagrams from database tables
Exporting the existing database to advanced GIS software for further analysis
So far you’ve used fl-query to generate browsable scroll tables from the database. In this chapter
you’ll learn how to perform complex queries — displaying results on a map, generating diagrams,
and exporting. You’ll also explore the full power of FieldLog’s hierarchical approach to geological
data manipulation, the core of nomenclature based searches.
The fl-query command is a powerful aspect of FieldLog. It’s extremely simple to use for basic
searches, yet provides sophisticated power for advanced users. Many of the abilities of fl-query are
not provided by even the most advanced GIS tools on the market because they were never intended
for geological work — they are general purpose, whereas FieldLog is a specialized GIS tailored for
geoscientists.
FieldLog 3 Users Guide
31
Querying a Database
Before You Begin
If you aren’t logged on to FieldLog and the SnowLake database, follow the steps
from Chapter 2 to open snowlake.dwg and log on:
• Start AutoCAD, then open SnowLake.dwg.
• Load FieldLog using the menu.
• Logon to the SnowLake database using fl-logon from the AutoCad command
line or the FieldLog menu.
At this point you should have a map of the SnowLake area displayed. Zoom out
to view the entire map before you start the tutorial.
Benefits of Using Layers
What goes where?
FieldLog has a very complex
set of choices to make when
plotting to a map, such as what
layer to plot on, what color to
use, what symbols to use, and
so on.
Plotting parameters for a
particular item in FieldLog are
stated in a Palette definition.
Palette is available as a button
item on many of the dialogue
boxes. Palettes are covered in
Chapter 7.
In Chapter 6, we’ll discuss the importance of AutoCAD layers for separating
different data types during map preparation. In this section, we briefly introduce
you to using AutoCad layers in FieldLog. The following assumes you’re familiar
with basic AutoCAD functionality.
The foliations we added to the SnowLake database in Chapter 3 are on a layer
named S-FOL1.
1.
To open AutoCAD’s layer control panel, type ddlmodes in the AutoCAD
command line, or select the analogous icon from one of AutoCAD’s toolbars.
AutoCAD’s Layer Control dialog box appears.
2.
Select the S-FOL1 layer, then click Set Color.
The Select Color dialog box appears.
3.
Choose red from the Standard Colors list, then click OK.
4.
To exit the Layer Control dialog box and return to your map, click OK.
Note that the foliation symbols and their dip measurements are now red. It’s a
good idea to set AutoCAD’s colors up so that different data types have
different colors. This allows you to keep track of what is going where, and
where data is in cluttered areas of the map.
5.
32
Zoom out to see the whole map.
FieldLog 3 Users Guide
Performing a Simple Query — Details
Not only can layers be assigned a colour, but they can also be used to control
the visibility of objects on the map. If map objects have been thematically
grouped into layers then it is possible to make visible/invisible any
combination of map layers. The ability to highlight or hide certain data
allows you to easily build a variety of thematic maps from one basemap.
Another way to do this is to physically remove data from the map but not
from the database. Both methods have their place — layers are useful for
thematic control, while removing data is useful for making a particular layer
simpler to understand and less crowded when plotted.
Performing a Simple Query — Details
Thinking in Queries
First of all, remember that for a
query to be useful, it must make
geologic sense. Before running
a query, think through what you
are doing. In this case, we are
going to isolate all of the first
phase foliations observed in the
SnowLake area by the workers
who built the SnowLake
FieldLog database. Thinking
through the logic carefully can
prevent major mistakes in the
long run.
Now let’s do a simple query — find all S-FOL1’s in the SnowLake database
and add them to your map. This time we’ll go through the process in detail
so you can see what each section of the query box is actually contributing to
the process.
To start the query process:
1.
Type fl-query in the AutoCAD command line or select it from the
FieldLog menu.
The ‘Query database’ dialog box appears.
Prior to executing a query that
will plot to the map, save the
drawing. You can then revert to
the saved drawing if the result
is inappropriate or if an error
occurs.
R13/14 Note
In R13/14, the first project is
automatically selected in the
query database dialog. In R12,
you must manually select the
project each time.
TABLE 1. Fl-Query Dialog Items
FieldLog 3 Users Guide
Project
If you have more than one database open, this allows you to choose
which one to query. Normally you only have one database open, but in
large or complex projects you may elect to spread the project between
several sub-projects, each with its own name and database.
Query
Enables you to select from previously created searches, providing you
named them. Most queries are used frequently, so get into the habit of
using the Name box and giving queries common-sense names.
Name
The place you type in a name for the current query. The query is
available the next time you return to fl-query.
33
Querying a Database
TABLE 1. Fl-Query Dialog Items
Note
If you inadvertently click on a
column that you don’t intend to
use, FieldLog includes it in the
output list. Make sure you
check your output list before
issuing a query, as the selected
columns affect the search
results.
Condition
The viewing area where query conditions that filter the database are
built. You don’t interact directly with this box except to select existing
query conditions for editing.
Output
The area where you select which fields are displayed in the scroll table
that results from running the query. Fields used in a query condition are
automatically selected in this window.
Area
Allows a search of a geographic area on the map, selected using the
mouse or digitizer. To use this feature you must select Inside or Outside
in the Operator pop-up, indicating you want to search inside/outside a
polygonal area.
Line
Allows a search based on proximity to a line on the map, usually known
as a buffer search. To use this feature, you must select Near in the
Operator pop-up. Enter the width of the buffer as a number in the Value
field. The width must be in the current drawing units.
List
Allows you to specify a Value from a hierarchical profile associated
with the column selected in Column. For example, structural data is tied
to a structural profile, so you can choose the desired structure name to
search on by selection from a list if the Column pop-up contains the
field STRUC.FEATURE. You must, of course, select the Column before
you use this button.
Tree
As with List, this button allows a search based on a profile, but in this
case via a hierarchical browser.
Symbol
As with List, this button allows a search based on a profile, but in this
case from a browser showing all the symbols associated with the profile.
Connector
Defines the logical relationship between entries in the Condition list.
The two possible entries are:
Query Nesting
FieldLog doesn’t permit
nesting of conditions.
Conditions must follow one of
the following patterns:
(1) (condition OR condition
OR...) AND
(condition OR condition OR...)
AND...
(2) (condition AND condition
AND...) OR (condition AND
condition AND...) OR...
Conditions using the special
operations IS, HAS, INSIDE,
OUTSIDE, NEAR must be
connected with:
(condition AND condition
AND...)
AND — When conditions are related by AND, both conditions must be
true for the specific entry in the Column table to be returned into the
Scroll Table view.
OR — When conditions are related by OR, either condition must be true
for the specific entry in the Column table to be returned into the Scroll
Table view.
Column
This is the heart of the query table. The query built in the ConnectorColumn-Operator-Value boxes acts on the field in the database indicated
by the Column entry. So, for example, to search for station numbers
above a certain threshold, the column pop-up would be set to
STATI.STATNUM.
Much of the work involved in setting up a query involves deciding
which column to run the query on.
34
FieldLog 3 Users Guide
Performing a Simple Query — Details
TABLE 1. Fl-Query Dialog Items
Note
Operator
IS, HAS, INSIDE, and NEAR
are non-SQL operators
especially provided by
FieldLog. They must be
connected to any other
condition using ‘AND’:
Contains all the acceptable logical operators that FieldLog can use. A
search condition is satisfied if theValue of the specified Column in the
database meets the search conditions:
•
•
•
•
•
•
•
(condition AND condition...)
•
•
•
•
•
•
FieldLog 3 Users Guide
> field must be greater than Value
< field must be less than Value
<= field must be less than or equal to Value
>= field must be greater than or equal to Value
= field must be equal to Value
NOT= field must be not equal to Value
LIKE allows searches based on wild cards. Valid wild-cards in SQL
(the foundation of FieldLog) are:
• _ (the underscore character): This wild-card substitutes for any
single character in the position indicated. For example, the search
STRUC.FEATURE LIKE SFOL_ would return all structural
features SFOL1, SFOL2, and so on.
• % (the percent character): This wild-card substitutes for any
number of characters in the position indicated. For example, the
search STRUC.FEATURE LIKE%1 would return all structural
features ending with 1.
NOT LIKE is similar to Like except that it returns those entries that
fail to match the criterion
IS acts on hierarchies in profiles within FieldLog. It returns elements
that are of the indicated type as well as its subtypes. For example, the
search STRUC.FEATURE IS BEDDING would return the
BEDDING, SUBED, S-BED and SOBED features from the
SnowLake database.
HAS is the logical complement to the Is operator. It returns elements
that are of the indicated type or its super types. For example, the
search STRUC.FEATURE HAS BEDDING would return the
BEDDING and PLANAR features from the SnowLake database.
INSIDE — if you choose a location field in the Column pop-up (e.g.
UTMX or UTMY in the SnowLake database), you can then search
for stations inside a specified area. The Area button allows you to
specify the target area by specifying the bounding polygon.
OUTSIDE — as with INSIDE, but the query returns features that are
outside the area specified using the AREA button
NEAR allows a buffer search — it finds all features within a
specified distance of a line specified with the Line button. Specify
the buffer distance in drawing units in the Value field.
Value
This field accepts logical, alphabetic, and numeric entries that must be
satisfied by the search condition. For example, if you want to find all
station numbers greater than 100, you put 100 in this field.
Next
Selects the Condition directly below the currently selected one. Use
Next when editing existing conditions. Conditions can also be selected
by clicking on them with the mouse.
Prev
Selects the Condition above the one that’s currently selected.
Modify
Overwrites or enters the selected entry from the Connector-ColumnOperator-Value fields into the Condition list. To modify an existing
condition or insert a new condition, you must click this button.
Delete
Deletes the selected entry in the Condition list.
35
Querying a Database
Note
TABLE 1. Fl-Query Dialog Items
To create a new blank
condition, you must click UP or
DOWN. Then simply create the
condition and click MODIFY.
2.
Up
Inserts an empty search condition into the Condition list, above the currently
selected entry.
Down
Inserts an empty search condition into the Condition list, below the currently
selected entry.
Query
Runs the query (if the query is valid).
Cancel
Closes the query box, cancelling the query.
Select SnowLake from the Project pop-up.
The only choice in the Query pop-up is the StatBrowse query from Chapter 3.
We’ll make a new query here, so leave the pop-up blank.
3.
In the Name box type SfolSearch.
Remember that by naming a search, you can reuse it easily. Furthermore, if
there’s an error, you don’t have to re-enter the entire query.
Choosing the Input for a Query
About Complex Queries
It is easy to get misleading
results from any complex
query, especially those that
involve multiple conditions.
When in doubt, work through
the query slowly and make sure
the query does what you want!
Most people run into problems
when using the AND
connector. For example the
following condition is
impossible:
First you choose the table you want to query and then you select the columns that
you want included in the query. Remember that the tables are organized to
roughly mimic the organization of fieldwork — traverses, stations, and structure,
lithological, sample, and photo observations. Here we want to look for structural
information.
1.
Feature=s-fol1 AND
Feature=s-fol2
The Feature column can
contain only one value, s-fol1
or s-fol2, but not both! In this
case OR is required to indicate
that both s-fol1 and s-fol2
occurrences are to be returned
from the query.
The = and IS operators are also
often misused. Use the =
operator when you want the
condition to return a single
value (e.g. = s-fol1 -- all s-fol1
measurements). Use the IS
condition when you want the
condition to return a family of
values (e.g. IS Planar -- all
planar measurements).
The current line in the Condition box queries the feature name in the
Structure table. Since this is the field that names the individual structural
entities, this is where you search to eliminate structures that don’t meet
chosen criterion.
2.
Select = from the Operator pop-up.
3.
Click inside the Value edit box, then click Tree.
The Tree Selection dialog box appears. Tree selection is based on a
hierarchical organization of nomenclature.
4.
Select s-fol1 from the PLANAR>FOLIATION section of the tree.
S-fol1 appears inside the Value edit box. (If you know the name of the value
you want to query, you can type its name directly into the Value edit box.)
The query we’ve entered, STRUC.FEATURE = s-fol1, finds any entries in the
structure table that are s-fol1’s.
5.
36
Select STRUC.FEATURE from the Column pop-up.
To insert the condition into the Condition table, click Modify.
FieldLog 3 Users Guide
Performing a Simple Query — Details
There should now be an item in the main body of the dialog. If a row in
the main body is highlighted, you can edit it by changing the
characteristics in the pop-ups and then clicking Modify once again.
Choosing the Output for a Query
Now that you’ve set up your condition and entered it into the Condition list,
you must choose the type of output you want. Let’s output the results onto
snowlake.dwg. In other words, we’ll direct the features that meet the query
condition — all s-fol1’s — to be plotted to the map. To output the symbols
on the map, FieldLog needs to know:
•
•
•
•
•
STRUC.FEATURE — the feature to be drawn
1.
In the Output list, select STRUC.FEATURE, STRUC.AZIMUTH,
STRUC.DIP, STATI.UTMX, and STATI.UTMY.
STRUC.AZIMUTH — the strike direction of the symbol
STRUC.DIP — the dip value for the symbol
STATI.UTMX — the X location
STATI.UTMY — the Y location
R13/14 Note
In AutoCAD R13 and R14, the
Scroll Table dialog box has an
additional output item, called
Image or Sketch. This allows
you to review all raster images
that were returned by the query
(for example, you can use it to
review field photographs).
The images are shown
sequentially in the AutoCAD
window. For each picture, you
can show it or not, in effect
acting as a pause between
images. After the last image is
displayed, press Enter to
finish. Press Esc to stop image
viewing.
Running the Query
Now that you’ve created conditions and output options, you’re ready to run
the query. FieldLog takes the query you create, translates it into an SQL
statement, and passes it to the AutoCAD database engine which attempts to
execute it.
1.
In AutoCAD R13 and R14, two
radio buttons appear with Plot
Options that allow you to
specify whether you want all
query items plotted, or only the
rows you select. The Clear
button unselects all currently
selected rows.
FieldLog 3 Users Guide
Click Query.
A message box appears indicating that FieldLog found records that
matched your query. Depending on how large your database is, you may
have to wait a few seconds.
2.
Click OK in the FieldLog message box.
3.
The Scroll Table dialog box appears, displaying a list of values that
match your query. If you move to the bottom of the list you should see
the two measurements — me1 and me2 — that you entered into the
database.
37
Querying a Database
4.
To plot the symbols, select MAP from the Plot pop-up.
Remember that AutoCAD is acting as a drafting engine, and FieldLog is
acting as a notes storage and query engine. If you plot to a map, FieldLog tells
AutoCAD to draw new symbols to the map. Unlike the results in many
desktop GIS programs, these entities are permanent, and have to be erased
manually to clear them.
The Plot Options dialog box appears, asking which items to plot. Depending
on what you’re plotting, you may be able to specify parameters.
5.
Select STRUC.FEATURE and STRUC.DIP, then click Plot.
This is equivalent to plotting just the structural symbols with adjacent dips.
FieldLog’s palette setup for the Struc.feature column knows which symbol to
use and knows to access Struc.azimuth to get rotation information. The
Palette is accessible from the Plot dialog box. Also note that plotting the
azimuth itself results in rotation amount being plotted to the map as text.
FieldLog plots the output. When it’s finished, FieldLog displays a message
with the number of records plotted and warns of any values it couldn’t plot.
6.
To exit the scroll table, click OK.
Your map should now contain a large number of foliation measurements (they’ll
show up in red if the layer s-fol1 is set to red, as done earlier in this exercise).
With a plotter hooked up, you could print a quick plot of first phase foliations —
a custom map in less than 10 minutes! And if you named the query, it takes less
than a minute to reuse the query.
38
FieldLog 3 Users Guide
Performing a Spatial Query
We’ve covered a lot in this section. The possible Operator choices in
FieldLog are a bit intimidating at first, but remember that these options are
the key to FieldLog’s power and flexibility. Take some time to try each one
out.
Now let’s try another query, retrieving geological features from an area on
the map using the Inside operator.
Performing a Spatial Query
Navigation in AutoCAD
To move around an AutoCAD
drawing, use the following
commands:
•
zoom to zoom in or out —
the W option in zoom
allows you to pick a window
to zoom in to
•
pan to move around on the
view by shifting the current
view in small increments
See Chapter 6, AutoCAD
review, for more information on
these and other AutoCAD
commands.
Now that you know how to perform a simple query, you’re ready to perform
a more sophisticated query — a spatial query on a selected area of your
drawing.
Spatial queries are key features of GIS software — any database can do
queries such as finding all s-fol1’s. But few databases can find all s-fol’s
within a highly irregular area. The advantages of FieldLog are the geological
nature of the database (including the fact that you can build hierarchical lists
of terms) and the ability to do spatial searches just as an advanced GIS
package would. In fact, because you can express your spatial queries using
hierarchical relationships, FieldLog surpasses most GIS packages in terms of
expressing complex geological queries.
Before you begin the query, use AutoCAD’s zoom command to set your
view so that the island containing stations me1 and me2 is on the right
extremity of the screen and fills about 5% of the screen width.
Selecting a Query Area on a Map
In this query, you’ll pick an area on your drawing and ask FieldLog to list all
of the existing structural measurements for that area. Make sure you’ve
zoomed to approximately the area shown in the following figure.
FieldLog 3 Users Guide
1.
Type fl-query in the AutoCAD command line or select it from the
FieldLog menu.
2.
In the Query dialog box, select SnowLake from the Project pop-up.
3.
In the Name field, type StrucArea
39
Querying a Database
Using Objects to Select Areas
If you use an existing object to
define an area, FieldLog allows
you to close the object to
complete the polygon
automatically. The object must,
however, be a continuous,
uninterrupted polyline.
If Close Polyline is toggled off,
then FieldLog doesn’t accept
open polylines to indicate
areas.
4.
To choose an area, select STATI.UTMX from the Column pop-up. The Area
operator in FieldLog must operate on a field that contains location
information of some sort.
5.
Select Inside from the Operator pop-up.
6.
Click Area.
FieldLog replaces the Query dialog box.
7.
The Spatial Condition dialog appears. Leave it set to Draw fence.
Note
FieldLog doesn’t permit edges
of the polygon to overlap. This
message appears if this occurs:
The Select Object From Map option allows you to use an existing item on the
map, such as a geological unit boundary, as a search area.
Click three or more points to define a polygon-bounding fence enclosing your
area of interest. Make sure you choose a fairly large area so that your query
finds some stations. Don’t close the polygon.
Picking a point outside the
AutoCAD window may also
cause this message to appear.
To remedy this, cancel the
polygon with ESC (R13/14) or
Ctrl-C (R12) and start over.
40
FieldLog 3 Users Guide
Performing a Spatial Query
8.
To finish, press Enter.
This closes the polygon and returns you to the Query panel.
The Value box should say AREA. This indicates that FieldLog has stored
a list of points from the map to define the area. If it hasn’t, try again.
9.
To add the query to the Condition table, click Modify.
The query should now appear in the list box.
Selecting Data
1.
Select the following in the Output list:
STATI.UTMX
STATI.UTMY
STATI.STATYPE
STATI.STATNUM
STRUC.FEATURE
STRUC.AZIMUTH
STRUC.DIP
Note that as usual, we select the STATI.UTMX and STATI.UTMY columns
so that our output options include required location information.
2.
Click Query and then OK when the message box appears.
The Scroll Table dialog box appears, listing the data.
Your specific display may differ from the one shown above, because it’s
likely you’ll have chosen a different area of the map. If no data appears,
you chose an area with no measurements. Return to fl-query and rerun
StrucArea on a larger section of the SnowLake map. Remember to click
Modify to update the condition after you have selected a new area.
Plotting Data
Next, you’ll add all measurements found by the query to the map view.
Remember that FieldLog maintains the geological database independent of
FieldLog 3 Users Guide
41
Querying a Database
the map, so that you’ll routinely add and remove symbols from the map as you do
cartographic work and analysis.
1.
To plot the data, select MAP from the Plot pop-up.
The Plot Options dialog box appears.
Notice that, depending on the type of plot option, Plot Options allows you to
override some of the projection, palette, delimiter, and size parameters. When
plotting to a map, only the size parameters are available. Symbol scale
denotes a scale factor to be applied to symbols, whereas Text height refers to
an absolute size, in drawing units, for plotting the text.
2.
Select STRUC.FEATURE, STRUC.DIP, STATI.STATNUM, and
STATI.STATTYPE, then click Plot.
3.
Zoom in on the new data.
Note that FieldLog has placed a variety of different data types on the map —
station numbers, structural symbols, and dip values. If you examine the layer
definitions within AutoCAD you’ll see that the symbols are layered by data
type. The layering is defined using fl-setup, the FieldLog configuration menu
item, but can be overridden within the Plot Options dialog box using the
Palette button, as discussed earlier.
42
FieldLog 3 Users Guide
Performing a Compound Query
Performing a Compound Query
About Connectors
And and or are examples of
condition connectors. These
can be a bit confusing.
•
And returns only records
that satisfy both listed
conditions perfectly.
•
Or returns records that
satisfy either condition.
Remember that a field in the
database with only a single
value per field can’t have
different values, and so the and
operator always returns an
empty set if you do a compound
and query on it. Think about
this.... X = a AND X = b is
impossible!
Finally, let’s do a compound query. A compound query finds data that meets
the conditions contained in two or more separate condition rules. Here is our
query, in geological terms:
Query in geological terms
Translated to FieldLog query
Find all pillow basalt samples that have a Condition 1: LITHO.ROCKTYPE =
planar structural measurement occurring Pillow Basalt
at the same station.
Join: and
Condition 2: STRUC.FEATURE IS Planar
Before you begin, use AutoCAD’s zoom command to zoom to the extents of
your map. If FieldLog is not loaded and/or you are not logged on to the
SnowLake database, do so now.
Beginning the Query
1.
Type fl-query in the AutoCAD command line.
2.
In the Query database dialog box, select SnowLake from the Project popup.
3.
Name the query PBStruc
Setting Up Conditions
To set up a condition requiring all selected stations contain Pillow Basalts:
1.
Select LITHO.ROCKTYPE from the Column pop-up.
2.
Select = from the Operator pop-up.
3.
Click List, then choose Pillow Basalt.
Pillow Basalt should now be displayed in the Value edit box. This selects
all stations where a pillow basalt was observed.
4.
To add this to the Condition list, click Modify.
5.
To insert the next condition below this one, click Down.
You must establish a relationship between the second rule and the first.
To get results that meet both rules:
6.
Select AND from the Connector pop-up.
7.
To choose only planar structures, select STRUC.FEATURE from the
Column pop-up.
8.
Select IS from the Operator pop-up.
9.
To get a list of available structures, click Tree.
10.
Select Planar, then click OK.
11.
Click Modify.
12.
Select the following output values:
LITHO.ROCKNUM
LITHO.ROCKTYPE
FieldLog 3 Users Guide
43
Querying a Database
SAMPL.SAMPLNUM
SAMPL.REASON
STATI.UTMX
STATI.UTMY
STATI.STATNUM
Other Plot Output Options
You’ve learned how to plot the
results of a query to a text file.
Other options include:
•
Arc/Info E00 — E00 files
are the standard interchange
file for ArcView, ArcView2,
Arc/Info, and ArcCAD. If
you need Geological Survey
regional data, chances are
it’s available in E00 format.
•
Map/Info MIF — Map Info
is a desktop and laptop GIS
common in the mining and
business community.
•
Spans — Spans is a raster
GIS well suited to raster
analysis and geoscience
modelling.
•
Stereonet — FieldLog
generates equal area and
equal angle point stereonets
and plots them to the current
map view.
•
Rose Diagrams — FieldLog
generates rose diagrams and
plots them to the current
map view.
•
44
Geochemistry — FieldLog
generates x-y plots and x-yz plots given a userspecified formula relating
FieldLog database fields to
an x-y or x-y-z grid. These
are plotted to the map.
13.
To submit your query, click Query.
The resulting scroll table should look similar to the one shown below.
Exporting Query Results
Before exiting the query, you can also export the results to a text file. This is
useful for preparing a report, exporting data into another program, or archiving
subsets of a database.
To export query results to a text file:
1.
Select Text.txt from the Plot pop-up.
FieldLog 3 Users Guide
Conclusions
2.
For output, select all items except for those ending in BASENUMBER.
These are internal FieldLog record numbers and generally aren’t useful
outside of the program.
3.
Select UTM ZONE 14 NAD27 from the Projection pop-up.
FieldLog allows you to re-project the station locations. This can be
crucial when:
• Exporting data into other programs
• Matching specific data format requirements
• Standardizing data archives
4.
Type c:\snowlake\snow.txt in the File Name edit box (assuming
you’ve put your sample data in the c:\snowlake\ directory.
5.
To output the data to the text file, click Plot.
A message box appears, indicating that the records are plotted.
6.
Using a text editor or word processor, open up the text file you just
created (in this case c:\snowlake\snow.txt).
The text file should contain the same information as the scroll table.
That’s it! You’ve done simple, spatial, and compound queries — outputting
the results to a table, a map, and a text file. The fl-query command is
powerful yet relatively simple. As you get more familiar with FieldLog
you’ll begin to naturally think in terms of how to express queries.
Conclusions
In this chapter you learned how to:
•
•
•
•
•
•
FieldLog 3 Users Guide
Manipulate the colors of entities by AutoCAD layer
Perform a simple query
Perform a spatial query.
Perform a compound query
Export data to a text file
Plot database data to the map view
45
Querying a Database
The FieldLog Query dialog box can be intimidating, and the options available
from the data browser are quite diverse. However, the geological questions that
can be addressed using the combination of operators in the Query dialog box
allow you to address real world problems with your data. And the data mobility
and thematic map flexibility of the data browser allow you to migrate your field
notes into stereonets, thematic diagrams, and to other systems.
A few of the operators found in the Query dialog box may seem fairly strange at
first, but turn out to be the most useful when it comes to dealing with real, often
ambiguous geological data. At an organizational level, the divergence in naming
between different mappers has for years been a severe limitation on doing queries
in a GIS environment. The hierarchy operators in FieldLog, based on artificial
intelligence techniques, directly reflect the core of the mapping problem —
where are rocks similar, rather than only named identically.
46
FieldLog 3 Users Guide
CHAPTER 5
Polygons in FieldLog
FieldLog does permit polygons
to be attributed. Data can
attached to the polygon’s
bounding line, or a text label
can be positioned inside the
polygon and linked to a
database table that contains the
polygon attributes. The text
label is positioned using the
standard fl-add functionary. It’s
very useful to label polygons in
this second way, and to record
associated descriptive
information, including the label
location, in a database table
because most GIS systems
require the label and its location
before they recognize the
polygon. See the UNITS table
in the SnowLake database for
an example.
Or, if the polygons are created
using a single enclosing line,
the data can be attached to the
line, as described in this
chapter. In this case, the
polygon label should be a text
column located in the row to
which the line is being
attached.
Attaching Data to Lines
Introduction
All of the data you’ve worked with so far in this tutorial is associated with points on a map.
Structural geology measurements, samples, and photos are all keyed to a station location, just as
they would be when you recorded them in your notes. Associating database entries with point
entities on the map is the normal mode for FieldLog data, though not the only possible one.
While most field measurements are well suited to being treated as points, there are cases where it’s
useful to label other entities — usually linework — with FieldLog database records. This labeling
would allow a direct association between features such as faults and contacts and the FieldLog
database. The data could then be accessed by clicking on the drawing using Fl-edit.
In fact, in a full GIS for an area, there would likely be point data such as station-based observations,
line data such as contacts and lake shores, and polygonal data such as geological unit extents.
FieldLog directly supports the generation of line and point datasets, concentrating of course on the
point data. AutoCAD, especially versions before R14, is extremely limited in handling polygonal
data. However, as discussed in the sidebar, it’s possible to label polygons in FieldLog.
In this chapter, the final chapter of the tutorial, you’ll learn how to associate FieldLog data with
linework.
Line Attachments
If you aren’t logged on to FieldLog and the SnowLake database, follow the steps from Chapter 2 to
open snowlake.dwg and log on.
FieldLog 3 Users Guide
47
Attaching Data to Lines
Adding an Outcrop to Your Drawing
1.
Zoom in on the island on the left side of snowlake.dwg.
Once you’ve zoomed in, the island should fill the center half of your screen
2.
Use the layer or ddlmodes command to make a new layer named outcrop and
make it the current layer.
Its name should appear in the layer display in the upper left part of the
AutoCAD window. All new drawing entities are placed on this layer. While
FieldLog automatically places new AutoCAD entities on proper layers as it
creates them, you have to do this manually for linework you add using
AutoCAD commands such as pline — AutoCAD’s default layer is always the
active layer.
3.
Use AutoCAD’s pline command to sketch a quick outcrop on the island near
the bay. Use pline’s close option to finish the outcrop’s outline with a perfect
closure.
If you’re unfamiliar with pline and other drawing commands, read Chapter 6
for a brief introduction or refer to your AutoCAD manual.
Close the pline properly. If you’re going to migrate data to a desktop or
workstation GIS environment, you must properly close the linework that
defines polygonal areas. See Chapter 6 for notes on digitizing.
Associating Data with the Outcrop
Creating a New Entry
First, create a new Traverse entry for your whirlwind island visit.
48
1.
Type fl-add in the AutoCAD command line.
2.
Select SnowLake from the Project pop-up.
FieldLog 3 Users Guide
Line Attachments
3.
Select TRAV from the Table pop-up.
4.
Enter the following values:
5.
TRAVNUM
30
GEOLOGIST
me
NTSMAP
63k16
FIELDDATE
19960405
SUMMARY
Detail on Island Outcrop
To add the traverse to the database, click OK.
Adding an Outcrop Description
Linking Logic
When linking database
information to entities on the
map, there are a few things to
keep in mind:
•
•
You’re trying to build links
where the items are
conceptually linked. Use
links sparingly to avoid
chaos.
Be aware of the size of the
entity you’re linking to. If
it’s a pline, it may very well
extend onto other areas of
the map, where the
observations linked would
be out of context.
A single record can be linked to
multiple AutoCAD entities, but
a single AutoCAD entity can
only be linked to one record.
Adding later links will sever
earlier ones.
Outcrops are, conceptually (to FieldLog), areas of geological interest that
may contain more than one station. Since you drew an outcrop outline it’s
only natural that you now associate an outcrop table entry with that
linework. There will then be a logical link between the two, and this link is
passed on if you export the data to another GIS program.
To add an outcrop description:
1.
Type fl-add in the AutoCAD command line, or pick it from the menu.
2.
Select OUTCR from the Table pop-up.
3.
Enter the following values:
TRAVNUM
30
OUTCRNUM
3
AIRPHOTO
none
BASENUMBER
(use provided value)
4.
Make sure that the Attach checkbox is selected (you want to link the
outcrop table entry to the outcrop’s outline).
5.
Click OK.
6.
Select the outcrop’s outline, then click to attach.
7.
When prompted for more links, click No.
Overwriting Links
FieldLog maintains only one
database link for any AutoCAD
entity it creates. If you link an
AutoCAD entity to a row in the
database, and later link the
entity to another row, the first
link is overwritten (destroyed).
However, the contents of the
database are unaffected.
FieldLog 3 Users Guide
49
Attaching Data to Lines
Verifying that an Attachment Worked
The point of attachments is that you can access tabular data by clicking on a
drawing entity — the entity and the table become conceptually linked and this
link persists if the data is exported.
You can check whether an attachment worked by clicking a drawing entity that
should contain attachments.
Now verify that the outcrop is attached to the database.
1.
Type fl-edit, then click the outcrop’s outline.
If you attached the station to the outcrop correctly, the Edit Table dialog box
for outcrop 3 appears.
Conclusions
In this chapter you learned how to:
• Attach data to screen entities
• Verify that the attachment took place
Summary
This tutorial introduced the main concepts you need to use FieldLog. Now you’re
ready to work as a FieldLog user. If you want to learn more about FieldLog and
AutoCAD, here’s what you’ll find later in this manual:
• Chapter 6 provides details on AutoCAD.
• Chapter 7 covers setup and customization procedures.
• Chapter 8 covers import/export procedures and using external databases. It
also has instructions for mobile computing using an Apple Newton, including
on site data entry and data transfer to FieldLog.
• Appendix A includes installing FieldLog software and databases, project
setup, software upgrades, and custom symbol libraries.
• Appendix B contains a description of FieldLog, data models, relational
databases, and FieldLog’s database design.
• An annotated bibliography of GIS for Geologists, which lists websites,
papers, and book references.
50
FieldLog 3 Users Guide
Map Preparation with AutoCAD
CHAPTER 6
Introduction
AutoCAD is a powerful computer aided drafting (CAD) program. It enables you to draw and
display maps. FieldLog builds on this infrastructure to construct a field data system. Unfortunately,
AutoCAD also contains many functions that are of little or no use for geological map production,
data archiving, and query-based data access, so that navigating the regular AutoCAD
documentation can be frustrating and intimidating. This chapter provides a quick overview of
AutoCAD and briefly describes the AutoCAD commands you must know to use FieldLog
effectively.
FieldLog v3 was developed to support AutoCAD versions R12-14 which is reflected in differences
between the AutoCAD interfaces. This chapter assumes that you are running AutoCAD R12 for
Windows. Command-line data entry hasn’t changed significantly between the supported versions,
so we assume that you’re typing commands rather than using menus.
At this time there are no plans for the further development of FieldLog to support newer versions of
AutoCAD, such as AutoCAD 2000.
Drawing a Map
As discussed in Chapter 1, FieldLog is a specialized but rudimentary GIS that primarily stores
point data. This means that while it’s well suited to storing, querying, and outputting field data from
defined positions, it doesn’t allow the construction of a proper geological map, since geological
maps typically:
• Show contact types
• Have shaded, coloured, or symbolic patterns to indicate lithology
• Make extensive use of secondary text and drawing for legends and location insets — also
known as cartographic annotation
FieldLog 3 Users Guide
51
Map Preparation with AutoCAD
To overcome these shortcomings various AutoCAD functions must be invoked.
When you need to produce a map using FieldLog and AutoCAD, FieldLog uses
the data you enter to provide the geological constraints for linework showing
contact and other geological relations. Some lines may have FieldLog data
attached, however, most of the linework starts and ends as AutoCAD, not
FieldLog, entities.
Typically map production is aided by reference to historical maps. A new map is
plotted onto a base that is either digitized from an existing paper map or onto an
existing digital map that represents the topographic and cultural features of the
map area. If you are digitizing the base yourself, chances are that you’ll be doing
this in AutoCAD, using the commands reviewed below. If you purchase a base
map from a governmental or third-party source, you can normally purchase it in
DXF, the AutoCAD transfer format. Regardless, you need to know a minimum
amount about AutoCAD to be effective with FieldLog. This chapter provides the
core of that required knowledge.
AutoCAD is a relatively straightforward program. But, like any program, it’s
useful to have both a conceptual background — how it works, and a procedural
background — how to get it to perform. We’ll start with a conceptual
background.
What is AutoCAD?
About Themes
If you use other GIS software,
especially Arc/Info, you’ll
often see the word theme, but
rarely the word layer. This
reflects the conceptual
foundations of each type of
software — CAD software
doesn’t focus on what data is,
just on drawing it. GIS
software, on the other hand, is
totally concerned with what the
data is and often doesn’t even
have a permanently visible
display area.
You should get in the habit of
thinking of each AutoCAD
layer as a distinct conceptual
theme, as this leads to a more
flexible layer structure in the
long term.
AutoCAD is a Computer Aided Drawing or Design (CAD) program. AutoCAD
is a very sophisticated set of tools for putting graphic entities such as linework
and text into a file that can then be viewed and printed. Like FieldLog, AutoCAD
has at its core a database. The difference is that AutoCAD’s database is oriented
around rapid drawing, not geological research. While AutoCAD can quite
efficiently represent a line or a point in two or three dimensions, it doesn’t try to
track what that linework means to the user. Think of AutoCAD as a highly paid
draftsperson who carries out your instructions for making a drawing — it doesn’t
really care about the topic of the drawing, but it draws very well nonetheless.
From a geological point of view, the structure of AutoCAD is based around
storing linework, text, and symbols, and then layering these entities for the
convenience of the user. AutoCAD has a large number of tools for:
• Controlling the view of the drawing you can see
• Adding and removing map entities
• Layering data
Grouping Data
As different thematic data accumulates in one drawing, confusion can result due
to clutter, interference between map entities, and the difficulty of tracking
original source characteristics for diverse data. Ideally each theme, or related
bunch of drawing entities, should be stored independently, so that they can be
viewed individually or in any combination. We want, for example, to be able to
view all of the roads in a map area, but sometimes we’d like to hide them so that
they don’t obscure geological relationships. We also want to be able to control
colours and linework styles (dots, dashes, and so on) by theme, so that modifying
52
FieldLog 3 Users Guide
Introduction
a drawing to be printed on monochrome or colour printers and at different
scales is painless.
AutoCAD achieves this type of control when you assign similar data to
layers. Each layer can be shown or hidden, have colour globally changed,
and have linework properties changed without affecting other drawing
layers. Combining select layers can deliver thematic maps that neatly
sidestep the clutter problem. In addition, secondary information such as
legends and annotation can be stored on separate layers and displayed only
when plotting final output. This speeds display times and further reduces
clutter during routine data entry and manipulation.
If you take the time before you start a project to set up layers that are well
suited to your needs, you will be rewarded by flexibility and elegant control
throughout the use of the drawing. Whenever possible, separate data
according to theme and different source onto individual layers — it’s trivial
to combine layers later on, but laborious to split a layer once the drawing is
under way. Keep careful track of what sources were used and what
limitations or assumptions are associated with the data. This can save you
endless trouble later on. In GIS this ‘data about the data’ is called metadata.
It’s your vital quality control information.
What This Means
Layer Notation
FieldLog, when plotting data to
the map, automatically assigns
the data to an AutoCAD layer.
You must therefore ensure that
data sets that you have digitized
or imported, and that may not
be in the FieldLog project
database, have their own
unique layer names. For
example, digitized data placed
on an AutoCAD layer called
SIUBED is inseparable from
SIUBED bedding data plotted
to the map by a FieldLog query.
Digitized or imported data that
you wish to keep separate from
your database should be placed
on a distinct layer such as
‘SIUBED_digitized’.
AutoCAD was originally designed to draw architectural and machine-shop
designs. In order to use AutoCAD to make maps we need to learn the areas
where AutoCAD doesn’t handle real world map making problems very well,
and also to recognize and take advantage of its strengths.
Potential problems include:
• Accuracy of linework and closure of polygons
• Curvature of the earth (introducing distortion in maps of large areas)
• Problems with scale
To address these issues, you need to know something about how a GIS
works so that you can see how to solve these problems in AutoCAD.
Data Types in GIS
Given that we want to have some GIS capabilities within AutoCAD and
might eventually want to export FieldLog data to a full GIS, it makes sense
to consider how a GIS stores data and how that affects our use of AutoCAD.
GIS software uses two general data models, the Raster andVector Models.
• The Raster Model models the world as a regular array of cells much like
the surface of a television set. Attributes are associated with individual
cells, and the array covers the area of interest. This model is well suited
to geophysical datasets such as gravity and magnetics, to remotely
sensed data, and to geological data when flexible modelling is paramount
(Bonham-Carter, 1994). However, it’s poorly suited to map production
because the cell size places fundamental limits on the quality of output
data and because entities such as roads that are contiguous in the real
world are modelled as discrete, disconnected cells.
FieldLog 3 Users Guide
53
Map Preparation with AutoCAD
Projection Systems
• The Vector Model, on the other hand, breaks objects down into points, lines,
polygons, and possibly other entities such as faces, surfaces, or volumes —
associating attributes with any or all of these. FieldLog is a limited GIS in
that it handles points well, has limited capacity to attach attributes to lines,
does very little with polygons or other geometric data types, and uses
AutoCAD for drawing vectors rapidly. A robust GIS would contain a
database of points, lines, polygons, and possibly other geometric data types,
and it would permit information to be associated with any of these. It could
then also draw a map based on a particular subset of its database. From this
perspective, FieldLog stores a database of points, some tags on lines, and
associates these with an AutoCAD drawing. AutoCAD internally maintains a
database of drawn entities and separates these onto layers.
Projection systems are
mathematical ways to
transform geographical
coordinates (on a sphere) onto
flat coordinates.
Data types in geology (and basemaps)
Data type
Sample geologic features
raster
geophysical data, continuous field data such as hydro,
geochemical, and geophysical field data
point
field stations, structural measurements, sample locations,
photograph centers, and so on (height of land, monuments,
benchmarks)
line
faults, contacts (roads, rivers, pipelines, powerlines, and so on)
polygon
geologic units, equal-value polygons for geochemical data
(lakes, islands, town outlines, and so on)
The Curvature Problem
Datum
Besides selecting the proper
projection for your area, you
must also specify the datum
used. For example:
•
North American Datum
1927
•
North American Datum
1983
The datum is a measurement of
the Earth’s ellipsoid used in
calculating a projection. The
same point on the earth’s
surface differs by as much as
200 metres, in the UTM
projection, if the correct datum
isn’t used. Projection
information is usually listed in
the border section of a map.
When a GIS draws a map from its database, it takes careful account of the
geographic factors like shape of the earth and desired map projection. AutoCAD,
however, is a drafting program and it considers the world flat. FieldLog keeps
track of a map’s projection system (typically Universal Transverse Mercator in
Canada) so that it can back calculate what the geographical coordinates are and
take the earth’s curvature into account. In effect, when you digitize or add data
points to a FieldLog database, you need to explicitly specify to FieldLog the
projection system of the current data. FieldLog can then correctly store the data
in AutoCAD so that keeps track of curvature and other projection problems.
FieldLog is flexible in this because, in addition to standard systems and
projections such as UTM, Lambert, and Geographic Coordinates (lat.-long.),
FieldLog allows you to define a user defined grid projection system.
It’s extremely important that when you digitize a piece of a map you tell
FieldLog the correct projection system and datum, otherwise FieldLog and
AutoCAD can’t handle the data correctly!
Closure
The fundamental requirements of a vector GIS are that:
• Points are accurately positioned
• Polygons close exactly
54
FieldLog 3 Users Guide
AutoCAD Commands
Accurate positioning includes not only proper placement on the curved
surface of the earth, but also correct absolute placement — if you digitize a
map sloppily, you end up with a sloppy database.
Not only must the drawing entities be accurately placed, but it’s important
that they close.This means that you must ensure that any polygon you use to
represent a geological unit is completely and perfectly closed in by linework.
Linework that appears closed at one scale may in fact be open. You can
check this by zooming in. Truly closed linework remains closed despite
unlimited zooms on any given vertex. AutoCAD has tools to ensure a
polygonal area is closed when you digitize it. We’ll discuss these later in this
chapter.
Scale
About Basemaps
If you’re about to embark on a
major field project using
FieldLog, you’re facing not
only the task of FieldLog setup,
but also the task of basemap
preparation.
To properly digitize a
typographic basemap is a
daunting task.
You may want to consider
purchasing digital basemaps
from the federal, provincial, or
state government or a third
party source.
In Canada, 1:20,000 scale
basemaps are available for
some areas of provinces from
the provincial government.
1:250,000 scale basemaps are
available from the federal
government. All are available
as DXF files, which FieldLog
can easily load and, if
necessary, re-project to suit
your specific needs.
Finally, any map has a nominal scale. If we digitize a basemap at 1:25000 for
use in a 1:250 000 soil survey, the basemap will be unnecessarily detailed,
meaning wasted hours of digitizing, and will often be cluttered as well. If we
digitize a basemap at 1:25000 for use in a 1:5000 detailed mapping project
the basemap will likely be too crude to use. This means that you should
carefully choose sources at an appropriate scale and choose appropriate data
types when you make a map. At 1:25000 an outcrop might be a small
polygon. At 1:250 000 it’s a point. At 1:5000 it might actually contain
several smaller polygonal areas. Choosing the right representation for
features is often just as important as accurately digitizing them in the first
place. One useful trick is to make a sketch map at the final scale of your
project (say, the scale of a map you have to deliver in the near future). Do
points best represent outcrops at this scale? What scale basemap do you
need? A little intuition and thought goes a long way here, and saves you a lot
of time in the end.
AutoCAD Commands
The remaining part of this chapter details key AutoCAD commands and
provides some insight on how they are used with FieldLog. This section isn’t
intended to replace the AutoCAD Reference manual. It focuses on
commands from the point of view of drawing a map. The commands are
organized as follows: Organizational Commands, Navigation and Display,
Drawing, File Management, and Program Extensions. The chapter concludes
with a brief discussion of more advanced AutoCAD features and a
discussion of AutoCAD and AutoLISP issues for users interested in more
sophisticated interaction with their maps.
Organizational Commands
New Maps
To start a new map:
1.
Choose File>New.
AutoCAD prompts you for a new drawing name.
FieldLog 3 Users Guide
55
Map Preparation with AutoCAD
2.
Type a unique name that’s easy to remember, then press Return.
Don’t set yourself up for a disaster — use a name that you haven’t used before.
You can use the date and month for the last few digits of a name to force it to be
unique — for example, SNOW9512 would be a map in Snow Lake started in
December 1995.
Tablet Calibration
Note
Digitize only within the
calibrated area — errors are
introduced and compounded
when moving outside the
calibrated area.
Air photo distortion increases
towards the edges of the photo,
so try and limit digitizing to the
central portions of the photo.
AutoCAD directly supports graphics tablets. In AutoCAD a user can lock a
digitizer to a drawing mathematically, so that regardless of the current drawing
scale or view, data entered on the digitizer is transformed and correctly entered
into the drawing.
To calibrate a tablet:
1.
If you have a digitizer properly configured, AutoCad gives you the option of
calibrating it.
2.
TABLET MODE F10
(12R+13R)
Switching out of TABLE
MODE is particularly useful
when you want to view/pan
over to a segment of your map
outside the current screen
window.
Type cal.
AutoCAD asks you to pick a point. Pick a point on the map that you can
accurately find on your screen or that has known coordinates in the
coordinate system of your AutoCAD drawing.
Toggle Switches
TABLET MODE F4 (14R)
Type tablet at the command prompt.
3.
Click a point, placing the crosshair as carefully as possible.
AutoCAD prompts you for the coordinates.
4.
Either type in the coordinates separated by a comma or else click the point on
the screen that corresponds to the map point digitized.
5.
Repeat this procedure for a second point diagonal from the first, then a third
point, and so on (for most maps four points is adequate for digitizing).
6.
Press Return.
AutoCAD offers some statistics and asks you to choose between an
orthographic, affine, or projective transformation.
7.
Choose the affine or projective transformation, or whichever reports the
lowest error.
8.
Return to the drawing view (press F2 in Windows).
Now check your projection by placing the crosshair on a point you can identify
on your screen, but not one that you used for the digitizing process. The cursor on
the screen should be on the correct location and the coordinates displayed in the
text box on the toolbar should be correct for the chosen point on the map. If not,
repeat the tablet calibration with different points. Once you have a good fit,
you’re ready to begin working with AutoCAD and FieldLog.
Layer
Use the Layer command to:
• Create new layers
• Change the current drawing layer
• Change global characteristics of layers, such as colour and linetype
56
FieldLog 3 Users Guide
AutoCAD Commands
AutoCAD always draws onto the current layer. The name of the current
layer is always displayed on the border of the drawing you are working on.
Before doing any work in AutoCAD, always make sure that the layer you
want to work on is current.
In general, you should use more layers rather than less. It’s easy to merge
two layers onto one if the need arises, but very tedious to separate one layer
onto two. Of course, map items that are associated with FieldLog avoid this
problem because the database information can be used to direct the output to
a specific layer as needed.
Options with Layer are:
?/Make/Set/New/ON/OFF/Color/Ltype/Freeze/THaw/LOck/Unlock
Most of options require that you know the layer name you want to act on,
and the spelling must be exact. The DDLMODES command does the same
thing as the Layer command, but works graphically. We encourage you to
use it instead. The various Windows AutoCAD versions also present toolbar
icons for layer control.
The options for layers are:
?
lists existing layers
OFF
makes a layer invisible to the user, but still accessible from
the database
ON
makes a layer visible
Freeze
makes a layer invisible and inaccessible to editing commands
Thaw
makes a frozen layer visible and accessible to editing
commands
Lock
makes a layer inaccessible to editing commands; doesn’t
affect visibility
Unlock
makes a locked layer accessible to editing commands
Color and
Ltype
sets default colour and linetypes for the entities on the layer
Make
creates a new layer and makes it the current layer (the layer
any new entities go on by default)
New
creates a new layer but doesn’t make it current
Set
makes an existing layer current
DDLMODES
This command is a dialog box equivalent of the Layer command. It lists all
layers in the drawing, enabling you to easily keep track of the layers you’ve
created and their characteristics. If you click the Layer toolbar this is the
dialog you see.
To change the properties of a layer, click a layer name, then an option box.
FieldLog 3 Users Guide
57
Map Preparation with AutoCAD
Note
End and Quit
The End command was
discontinued in AutoCAD R14.
End saves the current drawing and exits AutoCAD. Quit exits without saving, but
before quitting AutoCAD gives you the option of saving any unsaved changes.
Undo
Undo reverses the last action performed in AutoCAD.
Undo is useful if you’ve just erased something important, modified a feature you
shouldn’t have modified, and so on. Don’t use it to undo a mistake in FieldLog. If
you do something in FieldLog itself, FieldLog changes the database tables it
maintains in the background.Undo doesn’t undo changes to database tables, so if
you undo something on the AutoCAD map that actually involves FieldLog
manipulations of the database, you create inconsistencies between your map and
the FieldLog database.
Before using undo, check to make sure the last operation was an AutoCAD
operation (like pline, dtext, etc.) and then proceed.
Navigation and Display Commands
Move
Important Note
If you accidentally press Enter
when specifying the origin or
target location during Move,
AutoCAD may move the entity
into a remote location far from
your map area. Perform an
Undo to recover the lost entity.
Move allows you to move objects on the screen. For example, you can move text
labels from place to place. You can also move geographically referenced data
such as outcrops, but their corresponding database values won’t change. To move
FieldLog data, use Fl-edit.
Pan
Pan allows you to shift your view of the drawing. AutoCAD distinguishes
between the drawing, which is all of the entities you’ve entered and that have
been loaded through FieldLog, and the view, which is your current screen view of
that drawing. Because AutoCAD treats all graphic entities mathematically, you
can zoom in or out infinitely, although your data quickly falls below or above the
scale of the view. Pan allows you to shift the view side to side or up and down
without changing the scale. Simply type pan, then choose a point. Choose a
second point to show AutoCAD where to shift the first point. Try it a couple of
times to get the idea.
Zoom
Note
Occasionally the Zoom > E
causes your map to appear as a
small dot on the screen. This
occurs because some entities
are at an extreme position far
from the map (see note above).
You need to delete these
outliers before zooming using
the extents option again.
58
Zoom allows you to change the size of the display of your drawing. Together
with pan, zoom is the command you’ll most often use to get different views of
your data. Useful options are:
zoom > e
zooms to the entire extent of your current database
zoom > w
allows you to pick a new view window with the cursor
zoom > p
returns to the previous zoomed view of a drawing, this is useful
for returning to a smaller scale view after you zoom in for a close
look at something
FieldLog 3 Users Guide
AutoCAD Commands
Redraw
Some Useful Hotkeys
The following commands can
be activated by typing a single
letter ‘hotkey’ and pressing
return.
•
move
m
•
pan
p
•
zoom
z
•
redraw
r
•
pline
pl
•
erase
e
•
undo
u
•
circle
c
•
hatch
h
AutoCAD frequently clutters up the drawing area with small ticks and lines that
represent temporary markers used during editing. To clean up a view, type redraw.
Although this command is very fast, it doesn’t recalculate the view from the database.
Setting the AutoCAD environment variable blipmode to off prevents these ticks from
being placed. Ticks however can be useful in tracking the history of recently performed
commands — i.e. you can verify that you have moved the proper entity by checking to
see if there is a residual tick mark in the appropriate area.
Regen
To force AutoCAD to recalculate a view from the drawing database, type regen.
AutoCAD frequently does a regeneration when you change the view of the drawing.
Regenerations can be quite slow, especially on computers without much RAM. Be
prepared to wait a few minutes. Also, in R14 a regen must be performed before raster
images, such as geophysical maps, are properly displayed in the background.
List
List allows you to select and display the characteristics of drawing entities. It’s useful
for quickly determining what layer an entity is on.
Drawing Commands
Line
Don’t use this command with FieldLog.
Pline
Important Note
If you type End when you’re
not in a pline sequence, you end
your AutoCAD R12/13 session.
This isn’t a disaster as
AutoCAD saves your map
when it closes, but you have to
load and logon to FieldLog
again. You’ll have also lost
your calibration information
and must recalibrate.
GRIPS
Pline is the command you’ll use the most when drawing your map. Pline is short for
PolyLine. Use pline to draw lines where each line segment connects from the previous
line segment’s vertex. You can use pline to draw geometric shapes like boxes that have
only a few vertices or, by using many vertices, almost smooth shapes like shorelines or
rivers. With pline, every time you click with the mouse or digitizer you leave a vertex.
To end the command, press Return.
To add a pline:
1.
Pline returns From Point.
2.
An easy method to edit an
entity’s shape is to use its grips
— boxes placed on top of
vertices or at insertion points.
To activate the grips, select an
entity by clicking it or
windowing it. The grips can
then be selected and easily
moved. Pressing the esc key
once deselects the grips, and
pressing esc again deselects the
entity and terminates the
procedure. In AutoCAD R12,
use ctrl-c instead of esc.
Type pline.
Move your pointer to the first location you want a vertex, then click.
After the first vertex the options change to:
Arc/Close/Halfwidth/Length/Undo/Width/<Endpoint of line>
3.
To add more vertices, just click.
Close draws a line segment from the last vertex to the first vertex of this polyline,
closing a perfect polygon. Undo removes the previous segment.
A useful option that isn’t listed is End. If you type End while in the Pl command mode
and then press the spacebar, AutoCAD asks you to pick a vertex. You can pick any
vertex on the screen and AutoCAD draws a segment from the previous position to the
exact position of the chosen vertex. This is a useful way to ensure that polylines close
onto each other — since Close only allows a polyline to close on itself. You can set up
FieldLog 3 Users Guide
59
Map Preparation with AutoCAD
AutoCAD to always try to find a vertex to jump to whenever you click the cursor, a
useful feature for making maps — see OSNAP below.
Pedit
Line Widths and Linetypes
In AutoCAD, line widths can’t
be changed globally, but must
be edited individually at the
pedit/width prompt.
In AutoCAD, line thickness
usually refers to the “z”
(height) value.
A cartographic quick-fix for
changing the linewidths of preexisting lines is to assign
unique colours to layers of
lines. Then through
AutoCAD’s print> pen
assignments dialog box change
the pen default width by
selecting the appropriate colour
pen and assigning a new value.
This change isn’t reflected on
your screen.
Pedit allows you to modify an existing polyline. Things you can do with pedit
include:
• Assign a width to the line
• Edit a vertex
• Join lines and close polygons
Options under pedit include:
Close/Join/Width/Edit vertex/Fit/Spline/Decurve/Ltype gen/Undo/eXit<X>.
Primarily, you use pedit to join lines, close polygons, change line widths, and
rearrange polyline vertices using a pedit submenu called Edit vertex. Options under
Edit vertex are:
Next/Previous/Break/Insert/Move/Regen/Straighten/Tangent/Width/eXit <N>:
The pedit/linetype gen option
doesn’t refer to changing your
linetype, but controls the
location of a pattern within a
line segment; i.e., do you want
your line pattern to start at the
beginning of the line, or have it
centred over the entire length.
The linetype can be preset by
assigning a specific line type to
a specific layer. When lines are
added to this layer they inherit
the assigned linetype.
Linetypes can be changed by
editing the layer attribute, or by
selecting individual lines and
using the chprop command to
modify them.
Scale: you may have to adjust
the scale of the linetype in order
to see the pattern attributed to
the line. This is done using the
ltscale command. The default
value is 1. The lower the value,
the more patterns (dashes for
example) per line segment.
N
shifts the currently selected vertex (shown on your screen as an X
on a vertex) to the next vertex
P
shifts the currently selected vertex (shown on your screen as an X
on a vertex) to the next vertex
Move
allows you to move the current vertex
Break
splits the polyline at the current vertex
Width
changes the width of the currently selected line segment
The other options are used less often. Remember that you can use Move and End to
move a vertex exactly onto another vertex (to close a polygon, for example).
Other things you might want to do with pedit are override the colour of a line or
change a linetype or width. Normally you use width 0 lines in AutoCAD so that
lines appear sharp at any zoom. However, you may want to assign lines a definite
thickness. This can be useful for emphasizing faults and other features. It’s usually
better to put all similar features on one layer and make a special linetype for that
layer. Read about linetypes in the AutoCAD Reference Manual.
Osnap
Osnap modes, or Object Snap modes, are modifications to the way AutoCAD runs
other commands rather than independent commands. Object Snap forces AutoCAD
to modify the placement of features such as vertices by referring to the drawing
area surrounding the click point and then doing a quick operation. Available
operations are Endpoint, Midpoint, Center, Node, Quadrant, Intersection, Insertion,
Perpendicular, Tangent, Nearest, and Quick. The most useful one is Endpoint.
To set the object snap:
60
1.
Choose Settings>Object Snap.
2.
Select the Endpoint checkbox.
FieldLog 3 Users Guide
AutoCAD Commands
3.
Adjust the size of the search area using the Aperture Size slider.
Until you clear the checkbox in the Object Snap dialog box, any click that’s close enough to an
existing vertex that the existing vertex falls inside the Aperture box size (there will be a small
box around the cursor to show you the size) is shifted to the existing vertex instead of
appearing at the click location. This is useful in map production. If the aperture is set relatively
small, you can quickly draw polygons and always close them exactly — try to pick an existing
vertex and Osnap automatically shifts the click point for an exact match. Try it!
To use Osnap from the command line, type Osnap, then type Endpoint for the mode. To
adjust the aperture size (in pixels on your screen) type Aperture. A value of about 12 is a
good starting point.
Chprop
The chprop command allows you to change various properties of selected AutoCAD objects.
The chprop options are:
Colour/LAyer/LType/ltScale/Thickness
colour
changes the objects’ colour
layer
places the objects on a different layer
ltype
changes the linetype
ltscale
changes the linescaling of an object
thickness
this refers to the ‘z’ value--height
The chprop command overrides the object’s existing properties. For ease of editing, maintain
cartographic properties at the layer level, rather than varying them object by object.
Text
Text allows you to place a single line of text on a drawing. It requests a start point, a height, a
rotation angle, then the text string. To change the font or style of the text, type Style at the
first prompt rather than picking a start point.
When placing text on a map it’s a good idea to place it on a separate layer from the map
information. That way annotations can be turned on or off. Multiple text layers (say
placenames, samplenotes, etc.) are even more flexible. Use layer or ddlmodes to make a layer
for text.
Dtext
Dtext allows you to place lines of text anywhere on a drawing. It’s identical to the Text
command except that it doesn’t exit until you press Return twice. Multiple lines of text can be
easily entered.
Rotate
Rotate allows you to rotate any drawing entity on the screen using your mouse or digitizer, or
by specifying the actual rotation angle. Rotating a structural symbol or other FieldLog entity
doesn’t change the value stored in the database, only the currently drawn symbol. Use Fl-edit
to change values in the database. Rotate is useful for rotating text to coincide with the
alignment of features like roads and rivers.
FieldLog 3 Users Guide
61
Map Preparation with AutoCAD
Copy
Copy allows you to copy entities, one at a time, or place multiple copies of the
same entity at different locations.
Scale
Scale enlarges or shrinks the selected entity. Values between 0 and 1 reduce the
entity size, whereas values>1 increase its size. For example, an object scaled .5 is
1/2 its original size and an oject scaled at 4 is 4 times its original size. The x and
y aspect ratio remains unchanged. When multiple entities are scaled, an origin is
selected and all entities are scaled relative to this origin. This means that the
absolute location of all entities changes — a very dangerous side-effect.
FieldLog’s fl-scale command overcomes this problem.
Erase
Erase allows you to select and erase drawing entities. Using the mouse, you can
click on objects to build up a set to erase. Pressing Enter deletes the selected
entities. Undo (u) deselects the most recently selected entity. The window (w)
option allows you to build a selection set by drawing a box. To terminate the
erase command, use Ctrl+C (R12/13) or press esc for R14. If you erase
something you want to keep, use the undo command.
File Management Commands
Save
Save saves your file to disk quickly. It doesn’t prompt you for a filename unless
this is the first time you’ve saved the file. Save your work often! Save doesn’t
back up your FieldLog database. FieldLog data is automatically saved when
entered.
Save As
Save As allows you to save a drawing under a new name. This is useful if you
want to generate multiple independent backups of a drawing. Save As does NOT
backup the FieldLog database — it only saves the drawing part of the file. If you
use Save after Save As you’ll replace the second version of your file, not the
original file. When a Save As is performed, AutoCAD changes the name of the
currently open drawing and leaves the original drawing untouched on disk.
DXFOUT
DXFOUT allows you to export a DXF file. DXF is the standard CAD (and lowend GIS) way of exchanging spatial data — you can import a DXF into
CorelDRAW or Illustrator, for example, to make slides for a presentation.
DXFOUT opens a dialog box and asks for a filename and directory. It then asks
for decimal places of accuracy (6 is often sufficient, unless you are importing
into a GIS where maximum accuracy — usually 16 — is desirable) and proceeds
to write the file to disk.
62
FieldLog 3 Users Guide
Advanced Issues
DXFIN
DXFIN allows you to import a DXF file. DXFIN opens a dialog box and asks for a file
name and directory. It then brings in the entities from the file and places them on the view
at appropriate places. When making maps you can get bizarre results if you DXFIN a file
from one map projection into another map projection — AutoCAD doesn’t directly
support map projections. To get around this, import the DXF into an empty drawing,
project it using fl-project into the desired projection, save the reprojected version, and
then insert the new drawing into the original using INSERT.
WBLOCK
The WBLOCK command writes a block or the entire drawing out to a disk file, creating a
new DWG file. Use this command to get blocks used for symbology out of one DWG file
and into another. If an entire drawing is exported, it can be inserted as a block into another
drawing — this is an easy way to create composite maps where one map is at a different
level of detail than another.
INSERT
Inserts a named block onto the map, allowing the user to specify rotation and scale as
desired. If a drawing is named, the entire drawing is converted into a block and written
into the file on the fly.
Advanced Issues
Blocks and Attributes
WBLOCK vs BLOCK
BLOCK groups objects for use
in a current drawing file only.
WBLOCK extracts drawing
entities into a separate drawing
file. This drawing file can then
be inserted into other drawing
files. For example, a digitized
obscure symbol not found in
any resident FieldLog shape
library could be saved as a
wblock and then inserted
whenever necessary into your
current drawing file.
Blocks are structures in AutoCAD that are built up out of smaller drawing entities. An
example might be a north arrow (with an N and an arrow) or a template for a drawing
name, date, and author. Any number of entities may be included with a block, up to and
including an entire drawing!
To make a block:
1.
Make sure all of the related entities are visible, then type block.
2.
Type in a unique block name.
3.
Enter a base insertion point, which is the point on the block that the aggregate is
inserted around. Try this out, it isn’t exactly intuitive.
4.
Select the objects you want included in the block.
The entities disappear. Don’t worry. They went into the block database. To replace
them, insert the block.
To insert a block:
1.
Type Insert, then the block name.
2.
Enter the insertion point, followed by a scale factor (1 for X, 1 for Y unless you want
the block size to change), and a rotation angle (0 to leave the block unrotated).
AutoCAD inserts the block.
Attributes are user defined data that are embedded within a block. You can put text or
numeric fields with prompt names inside any block. When it inserts a block, AutoCAD
prompts you for values for the attributes. This is a simple way to build up a database map
combination. We don’t recommend it within FieldLog, as FieldLog provides more
FieldLog 3 Users Guide
63
Map Preparation with AutoCAD
sophisticated ways to build a database than simple attributes. See the Attributes
section of the AutoCAD Reference Manual for more information.
Before you make a block and attribute set, consider carefully: FieldLog is
designed to provide symbol-database combinations exactly like blocks and
attributes, but much more powerfully and simply. If the needed changes can be
made via a FieldLog table, consider going through the Setup process and
including the new item in your FieldLog database rather than maintaining two
separate database systems. A general rule is: if the data is geological, it should be
in FieldLog.
FieldLog maintains symbols as either blocks or shapes in AutoCAD drawings.
However, prior to using with FieldLog, all symbols must reside in shape libraries
that are loaded by FieldLog before any symbols are plotted to a drawing. Refer to
the Appendix A for instructions on how to create shape libraries.
XREFs
There are times it’s useful to temporarily include material for other drawings in a
FieldLog map. The XREF command allows the contents of any AutoCAD
drawing to be attached as background to a drawing in use. The attached reference
drawing can’t be edited, but can be temporarily modified in display color and
behavior by the DDLMODES command. All layers in the attachment appear
with their drawing name as a prefix.
As long as the projection parameters of the attachment and the drawing are
matched exactly, XREF can be useful; if the two drawings are projected
differently they don’t superimpose properly and XREF is useless.
Explode
If you need to disassemble a symbol or user block in AutoCAD, use the Explode
command to select and break up the block. If a FieldLog database record is
attached to a block, then that linkage is lost upon exploding. However, for blocks
such as stereonets, FL creates links to the entities inside the block where
exploding the block exposes the database links and permits the database contents
associated with them to be browsed with fl-edit.
Summary
AutoCAD contains a great variety of commands for making accurate drawings,
many which are useful for making geologic maps. This chapter covers the
essential commands. In addition to knowing the commands, effective map
production involves organization and planning. The key points in building maps
in AutoCAD are:
64
1.
All data must be in the same map projection and datum, with the same
projection parameters.
2.
Whenever possible, put thematically distinct information on seperate layers.
3.
Distinct sets of layers such as topographic bases can be kept “pristine” and
imported into working maps with XREF.
4.
Document your work, and backup often!
FieldLog 3 Users Guide
CHAPTER 7
Customizing FieldLog
Introduction
FieldLog provides support for field data capture through a data model well suited to the needs of
most field geologists. The data model provides building blocks for the construction of personal
database structures in which the field data resides. For example, the database used in this tutorial
(SnowLake) exemplifies a data structure well suited for the needs of survey geologists interested in
capturing a wide variety of field observations and dependent laboratory results into a single data
management system. This example data structure is also populated with real field data.*
Your needs may be substantially different from those of the workers in the SnowLake area. This
might include differences in symbolization, differences in terminology and classification schemes,
and differences in depth of detail. This chapter assumes that you want to make minor changes to an
existing FieldLog project, and briefly introduces customization of the palettes, profiles, and table
structure within a project.
Warning
Changes to the fundamental structure of FieldLog can lead to unanticipated adverse side effects.
Before customizing FieldLog, back up your database completely. Once a change has been made,
take the time to do a wide variety of queries, data entry and editing examples, and map editing
before attempting major work with the modified system.
* Bailes, A.H., and Galley, A.G., 1993, Geology of the Anderson-Stall volcanic-hosted massive sulphide area,
Snow Lake, Manitoba: Geological Survey of Canada, Open File 2776, 1 map, scale 1:10,000.
FieldLog 3 Users Guide
65
Customizing FieldLog
Customizing FieldLog Palettes
At some point you may want to modify the way that FieldLog symbolizes data to
the map. The Palette controls the display characteristics of items as they are
plotted to the map.
For example, the possible variables in a palette specification are:
•
•
•
•
•
•
•
•
•
•
•
Text value and font, if text is to be printed
Symbol library and symbol name, if a symbol is to be printed
Layer the new entity should be placed on
Colour of the new entity
Size of the new entity
Orientation angle of the new entity
Angular offset
Position of a text item around a symbol
X,Y,Z offsets relative to station location
Line width, for entities with controllable line width
Solid or pattern fill type for the wedges of a pie diagram
These options are contained in the Symbol Setup dialog, shown below:
Palette controls can be associated with various parts of a database setup,
permitting groups of database items to share a Palette control. If every possible
combination of layer, colour, symbol, orientation and so on had to be set for
every possible entry in an entry field, database setup would be incredibly tedious.
This is alleviated by allowing you to specify symbology at different levels of
database setup.
Palettes and Profiles
FieldLog allows symbol palettes to be assigned at two levels: first, any column in
a table may have a palette attached to it. Second, any item in a profile may have a
palette specification.
66
FieldLog 3 Users Guide
Using Palettes
FieldLog’s data entry and data query processes are column-based: data is
added to tabular rows, which consist of columns, and queries return a table
of columns. Even FieldLog’s dictionaries and profiles are attached to
columns. More significantly, columns are selected for plotting in both the
data entry and query procedures. Thus, when a symbol is to be plotted,
FieldLog first inspects the column’s (e.g. Rocktype in LITHO) Palette
parameters and utilizes those that are specified. For those parameters without
a value at the column level, FieldLog reads the data item in column (e.g.
monzogranite) and checks in the profile to see if a Palette value has been
defined for the data item. If so, then it tries to find the missing symbol
parameters here. If some parameters are still not found FieldLog traverses up
the hierarchical profile searching for them in the Palette definitions of any
parent profile items (e.g. in Granite and Igneous). If no symbol or text
parameter is specified in this process (though other parameters could be
defined), FieldLog simply prints the data item as text onto the map.
Symbols
Symbols in AutoCAD are built
from individual line segments
or other graphic entities and
reside in libraries that are
named with .shx extensions.
The FieldLog distribution
comes with three Canadian
structural symbol libraries,
OGS.shx, GSC.shx, and
NATMAP.shx, offering a great
variety of symbols.
For example, as shown in the figure on the preceding page, s-fol1 is present
in the palette, has a specified symbol from a specified library, and will be
placed on the layer sfol1.
If there is no value in the palette attached to the profile entry, FieldLog
examines the palette for the entry that is the parent in the profile hierarchy
(i.e. Foliation) to the original data value. It continues to move up the
hierarchy (i.e. to Planar) until the top is reached, or until a value is found.
If you need to define your own
shape libraries, refer to
Appendix A and experiment
with the programs for
manipulating symbols:
SHX2DXF.EXE and
DXF2SHX.EXE
At first look this structure is quite complex, but consider this: instead of
specifying for each structural symbol in the profile how to rotate to the
correct azimuth, this is simply set in the column’s palette. Instead of
explicitly designating the position of text, such as the dip or plunge, for each
structural symbol in the profile, these can be assigned to the Planar and
Linear items and thus inherited by the remainder of the structural items in
the profile. This resulting system is both flexible and powerful.
Using Palettes
When modifying or setting up palettes, remember that the purpose of the
hierarchy of symbol palettes is to avoid having to make a new entry in
multiple places. If you are symbolizing a group of symbols, anything
common to the group belongs either in the column’s palette, or perhaps in
the profile parent’s symbolization.
FieldLog 3 Users Guide
67
Customizing FieldLog
One of the most powerful features of palettes is that they allow dynamic
symbolization, where the symbols on a map convey multiple meanings through
the use of the available cartographic variables (typically colour, size, orientation,
symbol type, and lineweight). In a traditional map, a structural symbol conveys
orientation through orientation, type of structure through symbol type, and dip
through associated text. A dynamic symbolization might colour structural
symbols to reflect steep and shallow dips, and avoid using the dip text totally.
There is no limit to the number of possible dynamic symbolizations of a
FieldLog dataset. However, bear in mind that a map that others must use must
have either recognizable, standard symbols or else a very clear legend.
Example of Modifying Palettes
To look at both the symbolization process and dynamic symbolization, we’ll
make some basic modifications to the symbol palette for the structure table in
SnowLake and examine the results.
Before You Begin
If you aren’t logged on to FieldLog and the SnowLake database, follow the steps
from Chapter 2 to open snowlake.dwg and log on:
• Start AutoCAD, then open SnowLake.dwg.
• Load FieldLog using the menu.
• Logon to the SnowLake database using fl-logon from the AutoCad command
line or the FieldLog menu.
At this point you should have a map of the SnowLake area displayed. Zoom out
to view the entire map before you start the palette tutorial.
Simple Palette Changes
In this exercise we’ll change the palette for structural symbols so that all planar
structures plot in red and all linear structures plot in green.
1.
First, zoom in to an area where you can see an existing structure. Type fladd at the command prompt or select it from the menu, and select the
STRUC table.
Notice palette button near the bottom of the dialog box. This is how we’ll
access the palette.
2.
68
Select the Feature column in the table, then click the Palette button.
FieldLog 3 Users Guide
Example of Modifying Palettes
The Symbol Setup dialog box should appear.
About Structural
Measurements
Structural observations are
representations of the threedimensional orientation of
observed features. Since a
simple observation of strike and
dip by itself is ambiguous (does
a strike of 80 degrees mean that
the object dips off to the right
or left?), a common method for
recording structures is to record
planar structures such that
when looking in the direction of
the strike, the object dips off to
the right. This is informally
known as the right-hand-rule.
Using this system, strikes range
from 0 to 360 degrees, and dips
from 0 to 90 degrees.
For linear objects, record the
trend as the facing direction
when the object plunges away
and down, and the plunge as the
angle at which it drops below
the horizontal.
Notice that there is a section for colour. What happens if we pick a colour
here? That colour is subsequently used for all plotted structures as it
overrides the colours specified in the AutoCAD layer setup.
3.
Since we want to set two different colours, not one global colour, leave
the dialog box by clicking Quit. We need to control palette
symbolization through the profile for structural data because that’s where
different types of structures can be symbolized independently.
4.
After returning to fl-add, with the Feature column still selected, click the
List button. The hierarchy browser for the structural palette appears.
Alternatively, FieldLog
supports the dip-direction
method of recording planar
structures, where the trend and
plunge of the steepest line in
the plane is measured as a
lineation.
Since we want to use colour to distinguish between Planar and Linear
features, only these items need to be symbolized in the hierarchy. There
is no need to set the colour for any of the child items of Planar and
Linear as FieldLog moves up the hierarchy and finally reaches the
Planar/Linear items and their colours. Also notice that the position of
text around a Planar feature is set to 1 — this indicates that associated
text (such as dips or plunges) plot immediately beside any Planar
symbol.
AutoCAD Symbol Positions
AutoCAD places text around
predefined symbols using a
simple 8-position system. In
this notation, a 1 indicates that
the text is placed to the right, a
3 to the top, a 5 to the left, and a
7 to the bottom. The even
numbers represent the diagonal
quarters.
FieldLog 3 Users Guide
5.
Click Planar, then the Palette button.
6.
Click the Color button, and choose red from the choices offered.
7.
To return to the hierarchy browser, click OK.
69
Customizing FieldLog
8.
Now set the color of linear structures to green. Notice that the position of text
around a Linear feature is set to 3 — this indicates that associated text (such
as dips or plunges) plot immediately above any Linear symbol. Press OK.
9.
Return to the browser, click OK and exit to fl-add. Quit fl-add.
10.
Run a query using fl-query to display all structures (you should be able to do
that by now! If not, see chapter 4) Note that they plot in red and green
dependent on type.
We’ve just seen that the symbolization controls in FieldLog allow customization
that supports dynamic symbolization for making thematic maps.
Controlling Data Entry with Input
Making New Profiles and
Dictionaries
Once you have created a new
profile and dictionary, you need
to fill it with valid entries. After
exiting Data Entry Setup you
should see that the list item is
available in fl-add and fl-edit
for this column. You can now
use the Insert and Delete
buttons within List to populate
your profile. See the notes on
Profiles, below.
One of the key problems facing geological database builders is quality control.
Misspellings, informal terminology, and missing data can cripple a GIS database.
FieldLog has two methods for dealing with this problem. First, profiles and
dictionaries act as on-line references for spelling and meaning, and allow typing
to be replaced by selection from lists to avoid spelling errors. Second, FieldLog
supports controls on all columns in all tables that restrict data access types, force
columns to be completed, and do simple checking on entered data.
The input controls are accessible from fl-edit, fl-add, and fl-setup. For the
statnum field of the STATI table, the data entry setup dialog box contains:
The Table and Column referred to are indicated at the top of the dialog box. The
main features of the dialog box are:
• Profile Name: if a profile is attached to the column, it’s named here.
To attach a new profile, simply name it here and a table is created
automatically once the OK button is clicked. If the option is greyed out,
adding a profile is unavailable except through setup, or is inappropriate for
this column type. To attach a new profile, you must also define a new
dictionary. Profile names are a maximum of 5 characters long.
• Dictionary Name: if a dictionary is attached to the column, it’s named here.
To attach a new dictionary, name it and a table is created automatically once
the OK button is pressed. If the option is greyed out, dictionaries are
70
FieldLog 3 Users Guide
Controlling Data Entry with Input
unavailable for the column highlighted. Dictionary names are a
maximum of 5 characters long.
Uniqueness
FIeldLog stores two
fundamental types of
information in its tables: field
data and setup information (i.e.,
information about how the
database and project are
configured).
Part of the configuration
information for each table is the
Unique Number. FieldLog
requires a numeric column,
called the Unique Number, to
exist in each table and to
contain unique values. This
provides the system with an
unambiguous way of referring
to a row, and hence to a field
observation, in a table.
Other columns, such as the
station number column in the
STATI table, may also be
unique.
For more details on relational
databases and FieldLog, see
Appendix B.
R13/14 Note: Images
AutoCAD R13 and R14
support the direct incorporation
of images into a FieldLog
database. Supported file
formats are:
R13: TIFF, GIF, TARGA (TGA)
R14: TIFF, TGA, BMP
• Viewing Depth: specifies the number of levels visible in the profile
browser.
• Delimiter: specifies the character used to separate multiple choices for a
profile.
• Multiple Select Checkbox: indicates that the current column may contain
multiple entries separated by a delimiter.
• Edit Checkbox: indicates whether the current column is editable.
• Certain fields are used internally by FieldLog, and should not be
modified by users. The unique number is an example of this.
• Required Checkbox: specifies whether the column must be filled in.
• Required fields are a crucial tool for ensuring that a minimum level of
data is collected and recorded; e.g., STATI.Statnum.
• Repeat Checkbox: forces FieldLog to repeat the last value entered into
this column when a new record is created; e.g., TRAV.Fieldate.
• Increment Checkbox: forces FieldLog to repeat and increment by one the
last value entered, when a new record is created. Used to automatically
increment unique numbers; e.g., STATI.Statnum.
• Unique Checkbox: forces FieldLog to check that an entry is unique, in
order to prevent duplicates occurring; e.g., STATI.Statnum.
• Minimum and Maximum Boxes: forces FieldLog to enforce minimum
and maximum values for numeric fields. The actual limits are indicated
in the boxes; e.g., STRUC.Azimuth.
• Memo Checkbox: indicates that the column is a memo, where a multipleline message can be typed.
• Memo fields are very useful for recording descriptive text. Though they
can be exported to text files, they can’t be searched. Unlike many GIS
and database systems FieldLog’s memo fields are completely compatible
with all SQL compliant databases; e.g., LITHO.Comment.
• Image Checkbox: indicates that the column contains a reference to an
image file which can be viewed using the Image button. This is inactive
with AutoCAD R12, but available in R13-14.
• Plot: indicates that the selected column is to be plotted to the map during
data entry. This box may be overridden by the Plot button in the fl-add
panel. The Input>Plot option doesn’t affect which columns are to be
plotted from a query, as those are selected at query time; e.g.,
STRUC.Feature.
• Default: stores the default entry for the column. This value is
automatically placed in the column during data entry; e.g. TRAV.Fieldate.
There are obviously many controls here that can affect how data entry
progresses. The most crucial for day to day work are the required and unique
checkboxes. These can be used to enforce a minimum level of detail and to
prevent index numbers, such as lab sample numbers, from being entered
incorrectly.
FieldLog 3 Users Guide
71
Customizing FieldLog
FieldLog Dictionaries and Profiles
Short Name Abbreviations
You can use short names during
data entry. You type the short
name and FieldLog
automatically replaces it with
the long name. In fact, only the
unique part of the short name
must be entered for FieldLog to
determine which long name is
being referenced. This greatly
speeds data entry.
Perhaps the most revolutionary feature of FieldLog is the incorporation of
terminology dictionaries and profiles into the basic operation of the program.
Dictionaries and profiles allow organizations and users to control the use of
terminology during the creation and upkeep of a database, and can thus ensure
some level of uniformity across large projects. Since the dictionary/profile
combination is a set of standard database tables, they can be distributed between
projects to enforce standards organization-wide. One common implementation of
this involves the creation of corporate dictionaries and profiles, where the
corporate profile is a core subset of terms from the a corporate dictionary,
arranged in a hierarchical manner. Geologists are encouraged to retain this core
during daily operation, but they may evolve the lower levels of the hierarchy to
meet individual and project needs. Thus a degree of corporate uniformity is
maintained without sacrificing flexibility of use.
The dictionary is in fact a form of metadata that store definitions, abbreviations,
and long forms of common geological terms. Dictionaries enforce not only
common spelling of a term, but also provide an easy way to check definitions,
and so support a uniformity of usage of terms, a much more difficult problem in
large GIS projects.
The profile is essentially a hierarchical view of the terminology within a
dictionary. It also links to palettes to provide controls on symbology, and links to
the dictionary to provide access to the meaning of the terms. Arranging
geological terms hierarchically is crucial in recording and, especially, analysing
geological observations, since the inexact nature of geological fieldwork
virtually guarantees that descriptions will be more specific in well exposed and
geologically clear-cut areas, and more general in poorly exposed or highly
ambiguous areas.
As FieldLog can search within hierarchies, using the fl-query tool, it’s possible to
analyse data despite differences in the level of classification. For example, a
hierarchical query looking for granitoids would find not only rocks labelled as
granitoids, but also rocks that were more specifically types of granitoids.
Examples of Using Dictionaries and Profiles
Although Dictionaries and Profiles can be created, modified, and deleted using
advanced tools in fl-setup>Dictionary Setup, you can make basic changes to
existing Profiles using the Profile browser, accessed with the List button on the
fl-add panel. You can also create new Profiles using the Input button. This
allows you to modify Profiles during data entry to reflect new terminology and
create new Profiles when a column in a table could benefit from a classification
system.
Before You Begin
If you aren’t logged on to FieldLog and the SnowLake database, follow the steps
from Chapter 2 to open snowlake.dwg and log on:
• Start AutoCAD, then open SnowLake.dwg.
72
FieldLog 3 Users Guide
Examples of Using Dictionaries and Profiles
• Load FieldLog using the menu.
• Logon to the SnowLake database using fl-logon from the AutoCAD command line
or the FieldLog menu.
At this point you should see a map of the SnowLake area. Zoom out to view the entire
map before you start the dictionary/profile tutorial.
Dictionary Access
1.
2.
Use fl-add to add a new station on the map, using the following values:
UTMX, UTMY, UTMZ
leave blank
Station Type
Outcrop
Station Number
me4
airphoto
none
Traverse Number
30
Outcrop Number
none
Add a structural observation for this station, using the following values. Don’t click
Enter Data when done.
Station
me4
Feature
s-bed
Azimuth
123
Dip
54
3.
Let’s assume that in this case we want to check on the exact meaning of s-bed in the
dictionary. Select the Feature column, and then click the List button.
4.
In the Select from Profile browser, choose s-bed, and then click the Diction button.
FieldLog 3 Users Guide
73
Customizing FieldLog
The Edit Table dialog box appears, with the dictionary definition for s-bed
listed:.
Note that no short form is defined. Also, since this is a simple table just like all
other FieldLog tables, it is viewed in the standard fl-edit dialog.
The dictionary items could be modified at this point, but we’ll leave them intact.
5.
Click the Quit button.
Profile Modification
Misspelled Profile Items
To correct a misspelled profile
item, you must delete it and
insert a correctly spelled item.
We’ll now modify the structural profile to include a specialized type of bedding —
an observed crossbed, xbed. This means defining the relationship of xbed to other
items in the profile and creating a new dictionary entry for the term.
1.
Access the structure entered in the last exercise using fl-edit.
2.
Select the feature entry. To open the Profile browser, click List.
3.
Select s-bed.
We’ll introduce a special case of the s-bed symbol, xbed, which is a child of sbed.
74
4.
To force FieldLog to enter the new Profile entry as a child of the currently
selected item, click the Child radio button.
5.
Enter x-bed in the data entry field at the bottom of the dialog.
6.
To place the new item, xbed, into the profile, click Insert. Fill in the dictionary
item with a definition for the new term (e.g., Longname = x-bed, Shortname
=xb, Definition = cross bedding), and click Change Data.
FieldLog 3 Users Guide
Modifying FieldLog’s Table Structure
You should now see a new subtype of s-bed:.
Saving the Setup
Once you have changed a
profile or dictionary, you
should force FieldLog to save
the changes in case there is a
crash.
From the fl-setup button menu,
choose Save FieldLog Setup.
7.
To force the change into the fl-edit dialog box, click OK, and then Enter Data to commit
the change to the database.
Note: Prior to plotting an x-bed to the map, you must specify a Palette definition for it. To
do this, use the Palette button as described above.
A properly constructed set of profiles and dictionaries can make a big difference in the internal
consistency, and thus utility, of a field geological database. Field terminology is itself
inherently hierarchical, and so by treating this hierarchical organization explicitly, FieldLog
provides unique tools for geological analysis.
Modifying FieldLog’s Table Structure
Palettes, profiles, dictionaries, and input controls determine how data is entered into a series of
tables to produce a self-consistent, geologically useful database, and how items from this
database are plotted to the map. But the actual data content is also controlled by the table
structure of the database, which is built from logical building blocks (the FieldLog data model)
that reflect the mapping process. From these building blocks geologists can construct
databases that are tailored to individual and specific project needs. As discussed in Appendix
B, data models are adapted to specific applications, but generally have a common overall
structure. This reflects the fact that while we are all collecting field data for specific purposes,
there are large commonalities in fieldwork in general.
For example, in the SnowLake database, the following tables are central:
• TRAVerse table
This table provides a place to record information that describes and documents a traverse,
which often comprises a day’s work, but at the very least is a thematic series of stations.
• OUTCRop table
The Outcrop table records groups of stations that are geographically linked to a single
outcrop. A single outcrop may have any number of associated stations
• STATIon table
The station table stores location and identification information describing a station, the site
of a series of geological observations. Multiple stations can be associated with a single
traverse or outcrop.
FieldLog 3 Users Guide
75
Customizing FieldLog
• LITHOlogy table
The Lithology table hosts information about a rock type observed at a station.
It contains rock name and various descriptive physical attributes. Multiple
lithologies can be associated with a single station.
• STRUCture table
The Structure table records structural data, including type and orientation
details. Multiple structures can be associated with a single station.
Alternatively, structures can be associated directly with a specific lithology,
allowing analysis showing the relationship between lithology and structures
present.
• SAMPle table
The Sample table is derived from the lithology table and records information
for collection purposes. For instance, samples collected may be for
geochemistry, geochronology, petrology, or oriented for structural purposes.
Multiple samples can be associated with a single lithology.
• LEGND table
The Legend table stores map legend information, including age relations and
stratigraphic nomenclature. It’s used in assigning regional nomenclature to a
set of map data.
• MINERal table
The Mineral table records specific instances of minerals observed in
lithologies. Multiple mineral observations may be associated with a single
lithology.
• CHEMistry table
The Chemistry table is an example of a data source that is from outside the
field environment, in this case from a geochemical survey associated with
specific samples. Although this data originated as a spreadsheet from a lab, it
has been seamlessly imported and incorporated into the SnowLake project.
• UNITS table
The Units table records positions at which labels may be placed to uniquely
define polygons for the construction of a polygonal geological map. When
exported to a desktop GIS, the Units table is used to attribute polygons
constructed from AutoCAD linework.
• PHOTO table
The Photo table catalogues photographs taken in the course of field mapping.
FieldLog operating within AutoCAD R13 and R14 permits digital versions of
the photographs to be displayed from the database if the digital filename is
stored within a column and if that column has been designated as an Image
using the Input button.
These tables divide the normal data collected in a field mapping project into
pieces that are related by identification numbers (e.g., station number, sample
number, lab number, and so on) to generate a single flexible structure. The exact
fields, or columns, present in each table vary depending on the needs of the
76
FieldLog 3 Users Guide
Modifying FieldLog’s Table Structure
organization: the SnowLake database is for government geological survey style mapping.
Most often, modifying this structure for your own work involves adding fields to tables;
the overall table structure is usually constant.
Changing the table structure is a straightforward process in FieldLog, and is managed by
Fl-Setup>Table Setup.
Example Using Table Setup
As an example we’ll examine the table structure underlying the Sample table.
1.
Choose FieldLog>Fl-Setup.
2.
Choose Setup>Table Setup. The Table Setup dialog box appears.
Use the radio buttons to select the project, table, or table column to modify. To select a
table, a project must be first selected. Type Char indicates that this is an alphanumeric
field. Length 1 indicates that only a single character is recorded. Decimals is in this
case are irrelevant. The alternative choices for Type are variations on numeric types,
including floating point, real, and integer values in various precisions. To exit column
setup, click Quit.
R13-R14 Note
In AutoCAD R13 and R14
there is an additional button in
the Fl-Setup menu bar. Project
Setup is used to establish links
between AutoCAD and
FieldLog projects. In AutoCAD
R12 this is done by editing files
directly. See Appendix A for
details.
3.
Select the SnowLake project. Click the Table radio button. A list of available tables
appears.
The Delete and Purge
Options
Delete makes FieldLog
unaware of the table, and also
permits you to permanently
erase the table and its data. Use
Delete with great care. Purge is
a house-keeping operation that
will eliminate deleted rows,
that are invisible to you. This
compresses the table and
improves database
performance. It is worthwhile
to occasionally perform this
operation on your database; but
note that purged items cannot
be recovered, so use it
cautiously.
Note that at this point the New button is available, allowing us to create an entire new
table. However, if you enter a table name and try and save it, FieldLog returns an error
message — you must create at least one column for the new table before FieldLog
allows you to save your setup (column setup is discussed below).
4.
Next, select the Sample table by clicking Sampl in the list of tables.
Notice that the Delete and Purge buttons are now available. Also available are the
Setup and Points buttons; these are discussed below in the Table Registration and
Points Registration sections.
5.
Click the Column radio button.
The list at the right now shows the columns in the table that are available for editing.
Here we have selected the column Thin, which records whether or not a particular
sample is intended for thin sectioning.
FieldLog 3 Users Guide
77
Customizing FieldLog
Note that the Delete, New, and Move buttons are now active. These act on the
selected column, performing the indicated action: Delete removes a column
from the table, New creates a new column (type in a new column name and
press Enter), and Move moves a column from its current position to a new
one.
On the right, we now have access to the Setup, Input, and Palette buttons.
Input and Palette are for setting default input controls and palette settings,
respectively, as discussed earlier in this chapter. Setup controls the data type
parameters for the indicated column. For example, the Thin column has the
characteristics:
6.
You can add a new column to the Sample table by clicking New, typing a
column name, and pressing Enter.
7.
The new column name appears at the bottom of the column list, in the right
panel. FieldLog assigns it a data type of Char and a Length of 6. To modify
these, click to select the column, and then use the Setup parameters to alter
the default data type. Finally, click Save to save the new table structure.
Table Setup and Registration
Although many of the characteristics you set when creating a table are at the
level of columns, such as data input controls and profiles, the most complex
setup process is to actually determine the logical place of a new table in the
FieldLog data model. This is done using the Setup button once a table has been
selected from the table list; the Table radio button is then active.
As an example, we’ll examine the overall setup of the Sample table and its place
in the FieldLog data model.
1.
Return to the Table Setup dialog box, and then select Project SnowLake and
Table Sampl.
At this point the Delete, Purge, and New buttons, and the Setup and Points
buttons become accessible.
Points is a special button that allows us to tell FieldLog that a specific set of
columns in a FieldLog table contains coordinate information, and to define
the projection system for that information. We’ll return to this shortly.
78
FieldLog 3 Users Guide
Modifying FieldLog’s Table Structure
2.
Click the Setup button. The Register Database Table dialog box appears.
This is a complex dialog, and we only examine it superficially.
This dialog is roughly divided into three sections. The lower left displays
the available columns in the selected table, in this case Sampl. The upper
left chooses the table type, in this case a Sample Table. The right section
permits the assignment of columns from the table to the required logical
components in the data model. This allows FieldLog to link tables within
a database.
For example, each FieldLog table must contain a numeric column which
in turn contains unique numbers for each row in the table. The Unique
Number edit box in the right panel represents this logical entity. For
FieldLog to be able to use a table it must know which actual column in
the table represents this unique number concept. In the Sample table the
column containing unique numbers is called Basenumber and thus
Basenumber appears within the Unique Number edit box.
For the FieldLog data model to be practical, it requires one or more other
links to be specified between tables, depending on the type of table.
These links are represented by the Traverse Number, Outcrop Number,
Station Number, and so on, concepts listed in the right panel. When a
table type is chosen some of these links become activated, indicating the
possible links available. Of the activated links, some are mandatory and
others are optional. FieldLog doesn’t permit the table to be registered
until all mandatory links are specified. The actual column in the table
that corresponds to an activated link may be specified by selecting the
link, typing the name of column into the edit box beside the link or,
alternatively, clicking the column name in the bottom left panel,
automatically placing the column name in the edit box of the selected
link.
As a general rule, the closer the table is to the ‘top’ of the list, the more
required links will exist. The Sampl table, (previous page), has relatively
few requirements. It must have:
• A unique number for record identification, usually called
Basenumber
• A placeholder for FieldLog to store Station Numbers, to keep
samples associated with their source stations
FieldLog 3 Users Guide
79
Customizing FieldLog
• A sample number, to store the data recorded on the sample for human
identification purposes
• It may optionally also contain a Rock Number to associate the sample
with a specific lithology observed at the station
Most tables require not only a unique number, but also one or more other key
columns to uniquely identify the table. For example, the statnum column
uniquely identifies the STATION table, though STATION also contains a
basenumber column as its unique number.
Required key fields for the table types include:
•
•
•
•
•
•
•
ANALYSIS: unique, analysis, and station numbers
•
•
•
•
•
•
•
•
OUTCROP: unique and outcrop number; optionally traverse number
SAMPLE: unique, sample, and station numbers
COMPOSITION: unique and station number; optionally rock number
GENESIS: unique and station number; optionally rock number
ROCK: unique and station number
SEGMENT: unique, station, and segment numbers
STATION: unique and station number; optionally traverse and outcrop
numbers
TRAVERSE: unique and traverse number
BOUNDARY: unique and boundary number
UNIT: unique and unit number
LEGEND: unique and legend number
REFERENCE: unique and reference number
DICTIONARY: unique and item name
OTHER: unique
Of course, you may want to include other links to create a more highly
interrelated database setup. For example, linking in a Unit Number would
allow a direct association between the geological unit and the sample. The
degree to which you interrelate information in the database is a reflection of
the needs of your project.
FieldLog provides a powerful environment for storing data, at the cost of a data
model that requires care and handling. When working on the table setup for a
project, be sure to do a backup, and test the changes thoroughly before returning
to normal use.
Grouping Data
If you are doing detailed mapping in geologically complex areas, you may want
to group various observations. For example, you may want to group related
foliation and lineation measurements in a location where each lineation exists on
the plane of one of the foliations. Grouping is particularly beneficial when you
are plotting your data to the map from a query. If you don’t group your data, all
structural data for that station plots directly on top of each other, making it
impossible to discern which lineation goes with which foliation, unless you have
80
FieldLog 3 Users Guide
Map Setup
your note book or the FieldLog database open in front of you. However,
once you have grouped the data (this is done initially in fl-add, or
retroactively using fl-edit or spreadsheets), the selection set prompted
through the Fl-move command enables you to move the grouped data
together. This function allows you to ‘peel’ off the data pairs on screen and
place them where it is aesthetically pleasing.
The Group functionality is accomplished by grouping rows in the database
that contain the related observations. You can group rows in a table by
creating a column that contains the name of the group (where A is the name
given to the first set of grouped data, and B, the second, and so on. In this
case groups A and B represent linked foliations and lineations).
Creating group capabilities is a two step process:
1.
Create a column for the grouping name
• Choose Fl-setup>Table Setup and (in this case) select the STRUC
table.
• Click the Column radio button.
• To create a new column, click New, then input the name (grp).
• Now Save. Move the column using the Move command so that it’s
below the dip column
2.
Register the table.
• Click the Table radio button, then Setup. You’ll be in the table
registration screen.
• The Group Number (bottom right of screen) is now active — click
the button and type in the group column name (grp).
• Click Register. Be sure to save your fl-setup.
After entering data that includes group values, the end results look like this:
Station#
Feature strike dip
grp
1
1
1
1
foliation 200
foliation 145
foliation 330
foliation 350
A
A
B
B
20
35
60
48
NOTE: Don’t use GROUP as a column name. It’s a RESERVED word in
AutoCAD R13/14 sql language. If you use it you won’t be able to access
your database and will have to change the column title using an external
database.
If you are adding grouped columns and grouping your data retroactively, you
need to use fl-update on the entities on the map, or replot them from a query.
Map Setup
Map Setup assigns a projection to the AutoCAD map, permitting FieldLog
to associate the map with an actual location on the earth’s surface. Map
Setup also controls the default display preferences for the plotting of
symbols and text onto the AutoCAD map. It doesn’t affect the actual data in
the database — it simply controls defaults on the current projection system
FieldLog 3 Users Guide
81
Customizing FieldLog
Transformation Setup
In order to transform
coordinates between user
defined coordinate grids and
standard projections (e.g.,
converting between the
SnowLake user grid and UTM)
you need to define a
transformation using fl-setup >
transformation> setup. To
define a new transformation,
provide a name and the source
and target projections. Then, in
the Points dialog, input paired
reference points from both
projections. FieldLog calculates
a function for the conversion
and lists the amount of error at
each point.
and symbol display. Whenever you start using a new map with an existing
FieldLog database project you MUST perform map setup. The map setup
preferences are actually embedded in the map and saved with the map when you
perform an AutoCAD save (e.g., File>Save). Thus map setup need only be
performed a single time for each map, and once the map is saved those
preferences are activated each time the map is used with FieldLog. Of course, to
change Map Setup preferences, the map must be saved for the changes to take
effect in future sessions.
1.
To access map setup, click Map Setup in the FieldLog Setup button box.
The Map Setup dialog box appears.
Note that although these values pertain only to the current map associated with a
FieldLog database, they are all required for FieldLog to function.
Symbol Scale Note
Even though FieldLog plots
symbols as either blocks or
shapes, every symbol must
originate from an AutoCAD
shape library. FieldLog
provides tools to ease the
construction of these libraries.
See Appendix A.
Suggested symbol and text
sizes:
scale
symbol
size
text
size
1:20,000
12
25
1:50,000
40
80
1:250,000
200
400
Projection — before using a map with FieldLog you must assign a working
projection to the map. This projection relates points on the map to actual
locations on the earth’s surface. It also permits seamless conversion between
points in the database and the map, when the database and map coordinate
systems differ. FieldLog won’t be able to perform any operations on the map
until a projection is specified in Map Setup.
Often in field mapping some of the data being added to a database is purely
graphical in nature, such as road locations, grid lines, and lakes. The Map
Projection pop-up allows you to specify the projection for this graphical data, so
that any field data in the associated FieldLog database can be correctly located
and plotted to the map during Fl-Add, Fl-Query, and so on. The actual FieldLog
database may store coordinates in a coordinate system other than the map’s, and
as long both are clearly specified the FieldLog engine converts between them
whenever required. Database coordinate systems are specified using the Points
button in fl-setup>Table Setup, as described above.
Symbol scale — This is the default size scale factor for map symbols. AutoCAD
draws symbols using blocks or shapes, which are objects composed of a group of
lines and curves amalgamated into a complex shape. The size of these blocks or
shapes is specified at the time of creation, in drawing units. Since drawing units
differ dramatically in size depending on map projection, and since map scales
vary dramatically in scale depending on geological purpose, you usually have to
scale symbols up or down to suit the map currently in use.
For example, the symbol libraries that come with FieldLog (OGS.SHX,
GSC.SHC, and NATMAP.SHX) contain symbols drawn at 10 units in length.
Specifying a Symbol Scale of 2 would double all subsequently drawn symbols to
20 map units in length.
82
FieldLog 3 Users Guide
Fl-Update
Note that this default Symbol Scale can be overridden for individual columns
or elements of a symbol dictionary using the Palette button in flsetup>Table Setup, fl-add or fl-query.
Text height — Default height for text in current drawing units. Unlike
Symbol Scale, which magnifies or diminishes symbols, Text Height sets the
actual size of text drawn to the map.
As with Symbol Scale, map projection differences mean that the needed
height for text must be established visually, based on a combination of map
scale and projection. In practical terms, annotation text should be about 5-10
mm high on the final, printed map. Since map scales for output often vary
dramatically, the default text height value can be overridden with the Palette
button, available in fl-setup>Table Setup, fl-add, or fl-query.
North angle — The angle from ‘right’ on the map, measured counterclockwise, which represents North or 0 degrees. This value is used to correct
the rotation of structural symbols to take into account rotated map
projections and user grids. Valid responses are 0 - 360. For a ‘normal’ map,
where north is to the top of the page, the value would be 90. Because a user
grid was superimposed on the SnowLake map, its North angle is actually
about 50 degrees from the ‘right’.
Clockwise angles — Enter ‘Y’ for azimuthal angle measurements, or ‘N’
for standard Cartesian counter-clockwise method. In order to plot oriented
data measured using standard azimuthal techniques (i.e. strike, dip direction)
this parameter must be set to ‘Y’.
You can experiment with the symbol size and text height parameters as you
use a map. For example, the size of symbols and text already present on a
map may be modified using the fl-scale command. Experimenting with north
angles is more problematic (and shouldn’t be necessary). If the angle values
are wrong, any plotted symbols are incorrectly rotated, and you must either
carefully erase these and replot after correcting the north angle value; or
preferably, apply the fl-update command to the plotted symbols and their
angles are corrected after correcting the north angle value.
Fl-Update
You may want to update your map to reflect changes made to your database
(for example, replace old symbols with symbols from a new library or
reposition FieldLog entities after transforming database coordinates). This
can be easily done using the fl-update command.
FieldLog 3 Users Guide
1.
In AutoCAD, turn off all the layers except for layers containing the
FieldLog data you want to update.
2.
Select fl-update from the FieldLog menu. Your cursor returns to the
screen, waiting for entity selection. Select some entities to update and
press Enter. FieldLog updates all of the selected entities, replacing old
symbols with new ones or repositioning entities in new locations.
Remember that you can use the ‘w’ option to window an area instead of
manually selecting entities.
3.
Save your map in AutoCAD.
83
Customizing FieldLog
Conclusions
FieldLog customization is essential when adapting an existing project setup to
suit the needs of a new field mapping area. It is almost always easier to modify an
existing project than to create a new one from scratch. The empty version of the
SnowLake database, SnowEmp, is included with the FieldLog distribution as a
template for building new projects. It contains the SnowLake data structure, all
dictionaries and profiles, as well as all input and display preferences from the
SnowLake sample project. Only the actual data has been removed.
Finally, remember that carelessly done table modifications cause big problems!
Always back up a database and associated drawings before modifying the setup,
and test the new setup thoroughly.
84
FieldLog 3 Users Guide
CHAPTER 8
Importing and Exporting Data;
Using the Newton, GPS, and
External Databases
Introduction
FieldLog is a rudimentary GIS that stores and manipulates geological field information. One of its
strengths lies in its interface capabilities, which range from importing field data from hand held
computers or various database systems and text editors, to exporting data to advanced GIS tools
such as ArcInfo and MapInfo.
In this chapter, we focus on capturing and storing measurements and observations collected on an
outcrop using the Apple Newton and GPS. We also discuss importing this data into FieldLog, and
describe how to export the data in a variety of formats.
Working with FieldLog and the Newton
Many hand-held computers can record field data (including GPS information) about outcrops in a
format you can easily and seamlessly download into a PC FieldLog database, and subsequently plot
to an AutoCAD map. The Apple Newton, coupled with Fieldworker Pro software, is one of the
hand-held systems that has been used extensively with FieldLog.
Geologists collect data in the field using the Newton and a GPS, download the data at the field
camp onto their PC as a text file, and then append the data to their FieldLog Project database. The
new data is then plotted, providing an up-to-date map that can be printed to scale using portable
printers. Other geological features, such as contacts or structures, can be added to the hardcopy map
or directly on the digital map as the field season progresses.
FieldLog 3 Users Guide
85
Importing and Exporting Data; Using the Newton, GPS, and External Databases
Why the Apple Newton?
About the Newton
There are several Newton
models: the 120, 130, 2000 and
2100. The 2100 offers increased
speed and memory capabilities:
the 130 has 1 MB of memory,
while the 2100 has 4 MB, and is
four times faster. Because
Apple stopped producing the
Newton in March 1998, you can
only buy second hand Newtons,
available from third-party
retailers. Non-Newton
handhelds are being used with
various degrees of success.
Newton Accessories
The Newton 2000 and 2100
come with a cable and a
connection adapter (for GPS,
up/downloading, printing, and
so on). The adapter is fragile as
it protrudes from the Newton
when plugged in. You can
protect it by securing it to the
Newton using duct tape. Or you
can use a serial card for external
connectivity (use an 8 to 16 MB
card to allow for backups).
Newtons use 2 double AA
batteries, good for about 2 days
of field work.
Despite its demise, the Apple Newton is still the hand-held system most actively
used with FieldLog. It has a powerful pen-based operating system (OS) with
hand-writing recognition and a touch sensitive screen, making it invaluable when
inputting data into a field database. The Newton also supports a GPS interface,
many other external connections, and has proven itself in the field. The
effectiveness of its Windows CE successors is unknown at this time. However,
because the import/export capabilities relevant to this chapter are software
specific, and not hardware dependent, much of the following discussion also
applies to non-Newton hand-helds.
Why Fieldworker Pro?
Fieldworker Pro (FWPro) is commercial software (www.fieldworker.com) that
turns the Apple Newton into a geological data entry device; in many cases it has
replaced the traditional field notebook. Fieldworker allows data entry screens to
be configured by the user and subsequently used for site-based data entry. It also
receives and records GPS information. Geologists can still use airphotos and
topographic maps to visually locate themselves in the field, but will need to
digitally capture the locations into their FieldLog database using a digitizing
tablet.
There are now several versions of Fieldworker, including some (2.0 to 2.3) that
don’t suit geological data. Fieldworker Pro is very flexible and geologically
useful. It permits segregation of observation types at a station and then permits
multiple occurrences of that type to be recorded - in other words, it’s fully
relational. For example, multiple lithologies, structural measurements,
photographs, and samples can be recorded at a site.
When used in conjunction with FieldLog, the Fieldworker Pro setup must be
identical to your FieldLog database design. You can do this easily by generating
the FWPro data input template directly from FieldLog (as discussed below).
Although FWPro allows you to build data entry templates interactively, to
maintain correspondence between FieldLog and FwPro database designs, you
should make changes in FieldLog and transfer them to FWPro. FieldLog also has
advanced design features unavailable from the FWPro setup process. Because
FWPro reflects your FieldLog database design, carefully consider your FieldLog
design to facilitate its transfer to FWPro and to optimize the field data recording
process.
What You Need
• Newton Connection Utilities (NCU): These utilities allow you to install
software such as Fieldworker Pro onto the Newton. They also allow you to
connect the Newton to your PC.
• Fieldworker Connect (FWC): This software is used primarily to transfer the
FieldLog project template to the Newton and to transfer field data from the
Newton to your PC.
Before You Start
• Ensure that you have installed FWPro, NWC and FWC on your PC
86
FieldLog 3 Users Guide
Working with FieldLog and the Newton
• Ensure your Newton is connected to your PC
• If you haven’t used the Newton or FWPro before, do the Newton setup/
tutorial, complete the handwriting recognition exercises, and read the
FWPro manual for background information.
Loading Fieldworker Pro (FWPro) on the Newton
Backing Up Your Data
To load FWPro onto the Newton:
Although transferring data
from the Newton to your PC
is relatively easy, errors do
occur. For example, you may
accidentally overwrite data
instead of appending it. As a
result, keep labelled disks
with daily backups.
Remember, back up your map
as well as your database.
1.
On your PC, open the Norton Connection Utilities (NCU).
• From the horizontal menu bar, select the Newton pull down menu
and choose Settings.
• In Port to Listen On, select the com port dedicated to your Newton.
• In Speed, select 9600 for the Newton 2100 or 2400 for the Newton
130.
• Click OK.
2.
On your Newton, click the Dock icon.
• Click connect and change the settings to match those on your PC
(for example, serial 9600).
• On the bottom right of the Dock screen, click Connect.
The Connection status line should now say Connecting to Newton
device...using Com port 1. You can watch the progress of the installation by
viewing the time bar on either your PC or Newton. When the installation is
done, close down the NCU on your PC. To verify that FWPro is installed on
your Newton, tap EXTRAS. FWPro should now reside under unfiled
icons.
Creating a Project Template to Use with FWPro
FWPro data entry forms (i.e., the project template) can be generated by
FieldLog or you can create them manually in FWPro. To maintain
correspondence between your FieldLog and FWPro databases, and to take
advantage of advanced project setup features that are automatically
generated by FieldLog, use FieldLog to create the project template.
Terminology: FWPro vs.
FieldLog
FieldLog uses column and
table in its project database
setup vocabulary, whereas
FWPro uses the words field and
screen respectively. The word
screen can also refer to the
Newton screen (i.e. tap on the
screen) in the FWPro or
Newton manuals.
FieldLog 3 Users Guide
Before you generate a project template from FieldLog, make sure the order
of the columns in each table reflects your mapping style. Because FWPro
displays the columns in a vertical list on the Newton, you will save time in
the field if you arrange these columns according to your preferred data
recording sequence. FWPro does not allow the order of the columns to be
changed; furthermore, doing so would compromise the similarity between
the FWPro and FieldLog databases.
Making a FWPro Project Template from FieldLog
To make a FWPro project template from FieldLog:
1.
Ensure you are logged on to a FieldLog project.
2.
In FieldLog, choose fl-setup>Save External Setup.
3.
Click the Fieldworker 2.0/2.3/Pro button, then click OK.
4.
Click the Fieldworker Pro button, then click OK.
87
Importing and Exporting Data; Using the Newton, GPS, and External Databases
The message FieldLog setup saved appears.
5.
Click OK.
The FWPro project template is saved in a file named project.txt in your
project directory (c:\snowlake\project.txt for the SnowLake database).
WARNING: If you have data stored on your Newton, and you import a new
project template into FWPro, you will lose all stored data. To alter your
FWPro setup without losing stored data, you must use FWPro’s setup capabilities
(see the FWPro manual). Any changes in your FWPro project setup MUST be
exactly replicated in your FieldLog project setup BEFORE importing the
FWPro data; failure to do so will result in FieldLog data import errors. FWPro
is limited in the types of changes that can be made interactively.
FWPro’s setup capabilities/restrictions include:
• The addition of columns, tables and pick-lists is allowed; shifting the order of
tables, columns and pick-list terms isn’t allowed
• New tables can possess a maximum of 7 fields (however, your project setup
on the Newton will reflect your FieldLog database, regardless of how many
columns are in the table)
• Only tables that occur once per station (e.g., STATI in SnowLake) can be
created via interactive FWPro setup
Transferring a FWPro Project Template from the PC to the Newton
To transfer a FWPro project template from the PC to the Newton:
1.
Ensure your PC and Newton are connected with a serial cable
2.
On your PC
•
•
•
•
Open Fieldworker Connect (FWC).
To display the transfer options, click Show.
To enable editing of the default settings, click Unlock.
Ensure that the transfer arrow reflects the operation you want to perform
(i.e. transferring from PC-->Newton). If necessary, click Reverse to
change the direction of data transfer to reflect PC-->Newton.
• Specify the Newton (HPC) transfer options:
• port: select the com port connected to your Newton
• speed: select the baud rate to reflect the model of Newton used (e.g.,
Newton 130=2400 baud, Newton 2100=9600 baud)
•
control: select a flow control to regulate the data transfer (e.g.,
hardware)
• Specify the PC (Desktop) transfer options:
• directory: specify the directory containing the project template (e.g.,
c:\SnowLake for the SnowLake project)
•
•
•
•
88
multiple users: ignore
split: ignore
allow filesearch: ignore
send: project; data or projects may be uploaded to FWPro
FieldLog 3 Users Guide
Working with FieldLog and the Newton
• Specify a filename (in the edit box beside Open) for the configuration
(the configuration can be recalled afterwards by opening the
filename).
• To save the configuration, click Save.
3.
On your Newton:
• Choose Extras>Unfiled Icons, then select FWPro.
• At the top left corner, select Project, then Import.
• Change the information in the Options box to reflect the settings from
the PC.
4.
On your PC:
• Click Transfer.
• Select your project template file (i.e. project.txt).
• Click Open.
FWC responds with Tap Import on you HPC now. Don’t click OK in
this message box yet.
Note: You MUST tap the import button on the Newton AFTER you
have begun the transfer on your PC, but before you click OK to this
message. If you tap the Newton’s Import button too early, cancel,
then re-tap it before you click OK.
5.
On your Newton:
• Tap Import.
The Newton status line displays Newton ready to receive data.
6.
On your PC:
• In response to the Tap Import on your HPC now message, click OK.
Problem Solving: Other
Alternatives
FWPro has excellent
troubleshooting. Their manual
is a good place to start. Their
web site also has an informative
FAQ dealing with transfer
problems. If all else fails,
contact FWPro and they will try
and advise you.
FWPro Import Project Notes
Large project setup files, with
many pick lists, can exceed the
Newton’s memory capacity and
cause projects to only load
partially. To overcome this,
eliminate or shorten some of the
pick lists.
FieldLog 3 Users Guide
You should see your project tables displayed on your Newton as they are
loaded. When the transfer is finished, the status line displays Transfer is
complete. Verify in FWPro that your project setup information was
transferred correctly by going into the tables and checking that all of your
fields are present. Pay particular attention to the last table.
Troubleshooting
If the tables don’t load properly, try the following:
• Repeat the transfer (without making any changes)
• Check to make sure the Newton transfer settings match your PC settings
and that you have the proper com port dedicated to your Newton
• Repeat the transfer, using a lower baud rate in the transfer settings
• Use a text editor to open up the.txt file and check the syntax against the
examples in the FWPro manual (you may be missing an EOF statement)
89
Importing and Exporting Data; Using the Newton, GPS, and External Databases
Note: If you are using the Newton 2100, and your transfer fails, you may need to
hit the reset button. Otherwise, each subsequent transfer attempt may fail, even if
you have solved the initial problem.
Data Input on Site Using the Newton, FWPro, and
GPS
The Newton and FWPro
Your project template should now be loaded onto your Newton, and FWPro
should be ready to accept input data. Prior to entering data, remember that
FWPro refers to FieldLog tables as screens, and to columns as fields.
90
FieldLog 3 Users Guide
Global Positional Systems (GPS)
To enter data, activate your Newton, and open FWPro by selecting the
Fieldworker Pro icon located in the EXTRAs bin. Select your project name
from the pull down menu at top left hand corner of the screen. FWPro
defaults to the STATI screen when a project is first opened.
If you are using GPS, turn it on as soon as you arrive at your new/next
station, as positioning and averaging of the location point data takes a few
minutes. FWPro lets you input other station data (i.e. structural
measurements, lithological observations) while processing the location
information in the background. When the GPS has finished calculating the
location coordinates, the information appears on your STATI table screen
near the top of the display.
1.
Fill out the STATI screen. Click on black diamonds to the right of the
field name to access picklists. If the screen has more than 6 data entry
fields, black vertical scroll arrows located in the centre of the screen, just
below the 6th field, become active, allowing you to scroll down to the
7th or 8th field. To get to the next screen, either click the black diamond
to the left of STATI, or click one of the horizontal scroll arrows to the
right of the STATI screen.
2.
Fill out all the screens for that station the same way you would add data
to the FieldLog database using Fl-add.
3.
Make sure that you have received the GPS information for the station
before moving on to the next station.
GPS Techniques
There are basically 3 different
GPS methods — real-time
selective availability (SA),
differential correction using
post-processing methods, and
real-time differential correction
using FM radio broadcasts. The
choice of one system over
another requires a cost/benefit
analysis.
Ideally you want real-time
points captured in the field and
corrected on-site using FM
broadcasting. However, in
remote areas, broadcasters are
typically out of range, (except
for coastal areas, where the
coast guard is able to provide
the service). In addition, these
GPS units tend to be more
expensive than GPS for
selective availability systems.
Post-processing requires a base
station and an expensive GPS.
The GPS locations are kept on
the GPS (rather than on the
Newton), then processed.
Finally the two data sets are
combined in a database such as
FieldLog or in a spreadsheet.
Note that S.A. has been turned
off recently, resulting in more
accurate basic readings. Postprocessing and real-time
corrections may still be required
for very high precision
locations.
FieldLog 3 Users Guide
Global Positional Systems (GPS)
What is GPS?
Global Positioning System (GPS) is based on a field receiver getting signals
from satellites located high (~ 17,600 km) above the earth in a stable orbit.
The travel time of each signal transmitted by a satellite and received by the
GPS receiver is computed and your location on the earth’s surface is then
calculated by triangulation. Signals from at least 3 of the 24 orbiting
satellites are required for an accurate location, signals from a 4th satellite
allow your receiver to resolve altitude information. Importantly, since May
2000, the U.S. Government has removed intentional scrambling of the GPS
signals (they were originally scrambled to prevent other governments from
using the data to guide missiles). This means you now get very accurate
readings.
Why Use GPS?
The use of GPS with FieldLog remains optional. GPS technology has
changed dramatically over the past few years — lower prices, improved
accuracy, and quicker positioning speeds make it a viable alternative to
traditional data location methods. There also appears to be a direct
correlation between field mapping areas and systems used. It seems that
where the geology is well exposed, the geologist is getting into highprecision GPS and related gadgetry (for example, laser glasses which
transmit digital images and vectors directly to a computer). A large emphasis
is placed on immediate cartography and 3d visualization and the technique
91
Importing and Exporting Data; Using the Newton, GPS, and External Databases
GPS Equipment
You need an adapter or serial
card to connect the GPS to the
Newton. This is the same
adapter used to connect the
Newton to the PC. GPS units
become more expensive as they
increase in reception speed and
accuracy (e.g. centimetre
accuracy) — these typically
possess a stronger receiver as
well as more channels for
receiving satellite information.
Solar Flares and GPS
Solar flares sometimes affect
GPS. However, flares severe
enough to affect GPS and
communications are rare,
usually forecasted, and
warnings are issued. There is a
“solar activity” number you
may want to check periodically:
303-497-3235
of choice appears to be post-processing. Where the geology is less exposed, a
greater emphasis is placed on the actual field observations and notes, and the data
collected is generally point data. A field mapping style of predominantly regional
mapping of moderate to poorly exposed rock generally places users into the latter
category where real-time selective availability system (SA) is used — GPS
readings are funnelled directly to the Newton on the outcrop without
intermediary processing, but with reduced accuracy and resolution. Since SA
scrambling was stopped, this translates to ~10m accuracy, more than adequate for
regional mapping.
For regional scale mapping of 1:50 000 to 1:250 000, the SA accuracy of 30-100
metres is usually acceptable. Fieldworker also does some on-site averaging,
which helps increase the level of accuracy. Even at 1:50 000, this represents 0.52mm accuracy — the same level of accuracy achieved when using traditional
methods of airphotos and topographical maps for positioning.
The GPS data downloads to the FieldLog database via FWPro and the Newton.
This method of positioning not only eliminates the tedious and lengthy task of
calibrating the tablet and digitizing station locations, it also eliminates errors
introduced while digitizing and calibrating. FWPro also allows tracing of
macroscopic linear features (faults, dykes and contacts) using a GPS. However,
unless some modifications are made in your project database template, FWPro
treats these linear features as station point data.
A significant downside of GPS is that there are times when satellite orbits,
obstructions, and weather combine to make it impossible to get a fix from 3
satellites. For more information, consult a reference on GPS.
Before You Begin
Ensure you have the appropriate cable and adapter for GPS-Newton connection.
Label which end of the cable goes into which apparatus. Make sure both your
Newton and GPS have active batteries. Carry a backup set of 4 batteries.
What is NMEA?
If you are using a GPS you will
undoubtedly come across the
terms NMEA or NMEA 0183.
In 1983, the National Marine
Electronics Association (USA)
developed a voluntary standard
for Interfacing Marine
Electronics Devices — NMEA
0183. This Standard defines
signal requirements, data
transmission protocol, timing,
and specific sentence formats
for a 4800 baud serial data
connection. The standard has
been periodically updated. For
more information on NMEA go
to www4.coastalnet. com/nmea
Your GPS unit should be accompanied by a straight-forward manual that
describes how to navigate its menus using arrow keys, guides you through your
setup, and instructs how to get readings for your current location. The life span of
GPS batteries is ~ 6 to10 hours for alkaline batteries and 12 to 20 hours for
lithium batteries. Often GPS report the actual total time in use. Typically, each
time you remove your batteries from the GPS powerpack, you have to reset the
defaults.
Default GPS Settings
To transfer location data from a GPS unit to the Newton, the baud, connection,
and collection settings of the GPS unit must match the GPS settings of the
Newton. These settings are located under Setup on the GPS unit (refer to your
GPS manual) and under on the Newton Extras>FWPro>i (information icon,
near bottom left of screen)>GPS Preferences. You also have to choose the
appropriate settings from picklists for Receiver Accuracy, units, Coordinate type
(Grid and Display), and Datum Conversion, all of which are on your Newton
GPS Preferences screen.
Your Newton GPS preference screen includes:
92
FieldLog 3 Users Guide
Global Positional Systems (GPS)
Receiver Accuracy 100
Metres
(pull down picklist with preset values)
Connect
Serial
Collect
GGA*
(toggle between ft. & m.)
9600 baud
Display Grid
(pull down picklist with preset values)
Datum Conversion (choose from picklist below)
Select
Last Point Only
Average of All Points
Average from Display
Automatic Trail
Save GPS Data
*Note: There are at least a dozen different types of ‘protocol’ or, in GPS
terminology, Sentences, used when collecting GPS data. The most common
sentence is (GP)GGA — GPS Fixed Data. See your GPS reference manual
or a GPS text for more information.
Datum Conversion
The most commonly used method for datum conversion is Average from
Display. With this method, you can view all readings as a scatter diagram,
allowing you to eliminate outliers before the average is calculated. Average
of All Points is calculated from all GPS points collected at the field location.
For both Average options, field observation data can be input while the
location readings are being calculated in the background. Use Last Point
when you are confident that the current reading is accurate enough to use.
The last coordinate read is retained, and no averaging is performed.You can
select these options through Display, which is located on your station
screen, beside the GPS button. FWPro manual describes the process of
capturing location data.
Collecting GPS Data
Turn on the GPS as soon as you reach your station as the GPS can take 10
minutes or more to track the 3 satellites needed for triangulation. A status
line on your GPS display tells you how many satellites it has found. The
GPS can also function independently, without plugging into the Newton,
allowing you to move about the area making observations and entering
measurements. When you have finished entering data, simply plug the GPS
unit into the Newton. You may still have to wait for a final satellite
transmission, or for FWPro to average your data. When the GPS has finished
calculating the location coordinates, the information appears on your STATI
table screen near the top of the display. You should see something like this:
15 485,072
7,071,888
-41.1 M
4 satellites
where the 2 digit number in this case (15) refers to the UTM zone, the 6 digit
number (485,072) is the UTM Easting, and the 7 digit number (7,071,888) is
FieldLog 3 Users Guide
93
Importing and Exporting Data; Using the Newton, GPS, and External Databases
the UTM Northing (if UTM meters are selected in the FWPro’s GPS
Preferences>Display option; otherwise a lat/long is reported). -41.1 M refers to
elevation in Metres above sea level, and 4 satellites were used to triangulate.
Transferring Field Data from FWPro to FieldLog and AutoCAD
Converting .gif Files
Converting .gif files to .bmp
or .tif formats involves using
a third party image
conversion software package
such as Corel PHOTOPAINT
or Adobe. Simply open the
.gif file and save it as a .bmp
or .tif file.
Once you have collected your observations and measurements, you need to
transfer this information to your FieldLog database and update both the database
and possibly your map. This is a 3 step process:
1.
Export your FWPro field data to a PC (as a text file) using FWC.
2.
Import the field data text file to a FieldLog database.
3.
Plot the results to the AutoCAD map by querying the updated FieldLog
database.
After transferring your data from the Newton to your PC, you must also add to
your database any information that is not station specific and was therefore not
included in data entry on the Newton. This includes traverse, legend, and
geological unit information.
If you made sketches on the Newton, you must also transform your sketches into
a format compatible with AutoCAD. FWPro exports sketches as .gifs, which
AutoCAD can’t import. You can convert .gifs into either .bmp or .dxf formats
using a utility program.
The detailed steps to bring FWPro data from a Newton to a PC follow.
Create an Export Text File on the Newton
1.
On the Newton, select your current project
2.
Click Station , then select Export
3.
Input the station values at the From and To station prompts
4.
Use the following settings for the rest of the screen:
Data: All excluding sketches or All including sketches
Note: Sketches significantly increase the download time and also require reformatting from .gif to AutoCAD/FieldLog compatible formats (.bmp, .wmf,
and so on).
6 GPS Format: Fieldworker:
Delimited by: Tab
(
Field Names
Many tables include: Station name
Connection at: 9600 To: DOS
Flow Control: None via: Serial
This finishes the export on the Newton.
Transfer the Export File from the Newton to the PC using FWC
After completing the Newton>Export screen, you’re ready to transfer the file to
your PC.
On your PC:
94
FieldLog 3 Users Guide
Global Positional Systems (GPS)
1.
Open Fieldworker Connect (FWC).
2.
To change your default settings, click Unlock.
3.
Make sure that the transfer arrows reflect the operation you want to
perform (i.e. transferring from PC to Newton or vice versa). If necessary,
click Reverse to change the direction of data transfer. The screens look
different for each direction of file transfer.
4.
Fill out the fields. Select the Com port dedicated to the Newton and the
Baud rate that reflects the model of Newton you’re using. The default
fields in the lower right side should look like this:
• Directory: specifies the directory that receives the data.
• Multiple users: places files from different Newtons in separate
directories (one for each user). Use this when users have different
FieldLog databases.
• Split: creates (or appends to) separate files for each screen (table)
type. This is required by FieldLog, which can only import tables
individually. The filename of the text file inherits the FWPro screen
name with a .dat extension (e.g., Lith.dat). You can allow users to
supply alternate file names by activating the Ask for file names
option discussed below. FWC also creates some .txt files for its
internal use.
• New Directories: when this option is selected and the directory
specified above doesn’t exist or if directories for multiple users don’t
exist, FWC creates them; otherwise the transfer fails.
• Ask for file names: prompts the user for filenames when creating
new files for the downloaded data. This allows users to name files
instead of using default file names (e.g., ‘struc.dat’).
• Append: determines whether a new data file is created for incoming
data (and the old one overwritten) or whether the incoming data is
added to an existing data file. This is particularly useful when
multiple users are downloading data daily, as it combines their
observations into one set of text files that can then be imported into
FieldLog as a single set.
5.
Specify a filename (in the edit box beside Open) for the configuration
(the configuration can be recalled afterwards by opening the filename).
6.
To save the configuration, click Save.
7.
Click Transfer.
The Newton status line informs you what table is being transferred. The
PC status line shows how many bytes of data have been transferred to
your PC.
8.
When the transfer is finished, a Transfer is complete message appears.
Click OK.
Transfer the Data File to Your FieldLog Database
After transferring data from the Newton, your data directory contains .dat
data files and .txt setup files. It’s good practice to review the downloaded
.dat files prior to importing them into FieldLog. You can use any word
processing software for this. If you change the.dat files, you MUST save
them as plain text files. Failure to do so prevents them from being
successfully imported into the FieldLog database (most word processors add
FieldLog 3 Users Guide
95
Importing and Exporting Data; Using the Newton, GPS, and External Databases
hidden codes to files as they are saved which interfere with FieldLog data
import).
Note: Only tables that contain data get transferred. Empty tables are ignored.
To transfer the newly acquired data to your FieldLog database:
1.
Open AutoCAD>FieldLog. Logon to your project (in this case SnowLake).
2.
Choose fl-import.
3.
To locate your file, click File. Enter (or select) the file name in the File Name
box
4.
Click the Text file radio button.
5.
Click Import.
The FieldLog: Import Text File dialog box appears.
6.
7.
Select the FieldLog table you want to append/update (in this case LITHO).
The columns of the LITHO table appear in the right column of the screen.
Select all the columns, excluding BASENUMBER.
8.
In the Column Delimiter box, type tab.
9.
Leave the Text Delimeter box blank.
10.
In the Projection box, scroll and enter the appropriate projection. This box is
active only if you’re importing data into a table that contains coordinates
(e.g., in the Snowlake database, the projections are stored in the STATI table).
11.
If you are importing into your main table (e.g., the STATI table):
• Select the Fieldworker option
The column on the right side of the screen becomes blank
• Ensure that you have filled out your projection correctly.
12.
96
If you are appending data, click Append. This adds the data from the text file
to the database table. If you are overwriting existing data, then click Update.
Update is selectively available, depending on the type of database table.
FieldLog 3 Users Guide
Global Positional Systems (GPS)
13.
Click Import.
FieldLog lists the number of rows imported along the bottom of the
screen. If a row of data can’t be imported, an error message appears,
which must be cleared by clicking OK before the import process will
resume. Rows that can’t be imported are written to an .err error file
beginning with the table name (e.g., LITHO.ERR). This file can be
edited as necessary and re-imported as a text file.
Plot New Data to the Map by Querying FieldLog
Alternative Export Formats
in AutoCAD
If you are exporting an
AutoCAD map to CorelDRAW
and your drawing doesn’t
require any more editing before
printing, it may be useful to
export as a Windows metafile
(WMF) or an Encapsulated
Postscript (EPS) file. These
options are available in
AutoCAD under the File>
Export> Save as file type list.
The advantage of using .wmf
and .eps is that the FieldLog
symbols will come across to
CorelDRAW regardless of
whether they are shapes or
blocks. When you save as
.wmf, you are returned to your
drawing file and prompted for a
selection set. When you save as
.eps, it saves the entire file on
screen as a screen dump or print
file.
It is often advantageous to immediately visualize imported data, particularly
in collaborative and multi-disciplinary mapping situations. If you have
downloaded data from the Newton, you must plot the new data to the map on
a table by table basis. This requires a separate query/plot operation for each
imported file/table. Since you can name queries in FieldLog, this is not as
arduous as it sounds. You simply need to modify a standard query.
In FieldLog:
1.
Choose fl-query.
2.
Starting with the STATI table:
• In the condition box, specify the station range you just transferred
(e.g., stati.stanum > 52 AND stat.stanum < 252).
• Name this query using a name that reflects the range (e.g., st53-252).
• In the Output box, select: stati.statnum, stati.utmx, stati.utmy,
stati.utmz, and stati.statype.
• Run the query.
• Plot the statnum and the column which contains the outcrop symbol,
usually either statype or statumx, to the AutoCAD map.
3.
Select another table (e.g., LITHO) and select the query name reflecting
the range of stations you want to plot (in this case, st53-252).
• In the Output box, select: stati.statnum, stati.utmx, stati.utmy,
stati.utmz, litho.statnum, and litho.rocktype. Remember that you
always need the UTM values when plotting to the map.
• Run the query.
• Plot any lithological information, usually litho.rocktype, that you
want to display on the map.
4.
Systematically go through your remaining tables and plot any data you
want to display to the AutoCAD map by running a query — ensuring that
you edit the query to reflect the data you want to plot. This permits you to
plot all relevant data from the desired table. You can now edit the
placement of information on your map for appearance. Do this using one
of AutoCAD’s move commands.
You must now add any information to your database that is not station
specific, and was therefore not input on-site using FWPro. For example, the
information pertaining to the TRAV table is not captured on the Newton. To
add this:
FieldLog 3 Users Guide
1.
Choose fl-add, then select the TRAV table.
2.
Fill out traverses for all members of the field party.
97
Importing and Exporting Data; Using the Newton, GPS, and External Databases
3.
When you have finished entering information in the TRAV table, select
another non-station specific table you want to add information to.
Sketches
FWpro allows you to draw sketches and store them linked to a data entry field.
Each sketch is uniquely named and this name becomes its filename (with a .gif
extension) in the data directory when it’s downloaded from the Newton. This
name is also placed in the data file which is imported into FieldLog. Thus, in the
FieldLog database, there will be columns, corresponding to sketch fields, which
contain the filename of the sketch (e.g., in the STRUC table, there would be a
column called sketch). You can display sketches in FieldLog by querying the
database and displaying selected ‘image’ columns. You can also display sketches
by plotting a symbol for the filename to the map and then retrieving the database
record for that symbol (with fl-edit), selecting the image name column and
clicking the Image button. However, before images can be viewed they must be
converted from .gif format to .bmp or .tif formats, and the filenames in the
FieldLog database must be changed accordingly.
Exporting Data from Your FieldLog Database
One of FieldLog’s strengths is its interface capabilities. Data can be easily
exported in a wide variety of formats compatible with other platforms. Export
format options in FieldLog include: ArcINFO (E00), MapINFO (MIF), spans
(TBA, VEC), and TXT files (for exporting to text editors, spread sheets, word
processors, and most other data-oriented software).
In addition, many software packages can directly read FieldLog tables, since
these are simply Dbase III format tables. If you do use FieldLog tables directly,
make sure that the program you’re using doesn’t modify the table structure, as
this would cause problems with FieldLog. The cartographic aspect of FieldLog
data can also be exported as DXF (Digital Exchange Format) and many GIS
packages directly read AutoCAD files. Lines (contacts, faults, and other
macroscopic features) drawn using AutoCAD, as well as topographic bases, are
generally exported using dxf format.
There are two methods for exporting FieldLog data — using fl-export and flquery. Fl-export exports some basic AutoCAD entities, such as plines, shapes,
blocks, and circles, and retains their cartographic appearance (e.g., size, angle,
location, and so on) and related database information in the export file. Fl-export
only exports data plotted to the AutoCAD map. You must export database data
that’s not on the map using fl-query. Fl-query exports data that has been selected
via a query, even if it isn’t plotted to a map. The four different export file formats
(E00, MIF, TBA\VEC, and TXT) are available using either method.
The E00 file — an ESRI generated file format is used to import into ArcINFO
and ArcView. Cartographers using ArcINFO to produce publication quality maps
use E00 because they can easily import data — no data massaging is necessary. It
maintains layer integrity and the point data records the location information as
well as any rotational information of symbols. Database information may remain
attached to the cartographic entities if the user chooses. Geologists export as E00
98
FieldLog 3 Users Guide
Exporting Data from Your FieldLog Database
files because they can easily bring their E00 file into Arcview and view,
manipulate, and analyse their data in conjunction with other data sets.
The MIF file — a MapInfo generated file is used to import into MapINFO.
Like ArcInfo and Spans, MapInfo is a GIS that has strong data management,
display and analysis functions.
The TBA/VEC file — a Spans generated file is used to import into Spans
data analysis packages. Like ArcInfo and MapInfo, Spans is a GIS that has
strong data management, display and analysis capabilities.
The TXT file — this format is extremely versatile and exportable to many
different kinds of software packages — word processing, graphics, CAD,
spreadsheets, and databases. For example, the FieldLog projection definition
template is exported to FWPro in a special .txt format.
Exporting Data Using Fl-export
You must open your current AutoCAD drawing file before choosing flexport. Once invoked, fl-export prompts you to create an export selection
set by selecting entities from the screen. If your selection set covers a large
area, you should turn off and lock all AutoCAD layers containing
information that you don’t want to export. You can use any of AutoCAD’s
common selection mechanisms to build a selection set (e.g., windowing an
area to select its inhabitants). Once the selection set is built and selection
completed, FieldLog starts the exports.
1.
Choose Fl-export (from the AutoCAD menu or command line).
• Project: select a FieldLog project from which to export database
data. If no project is selected, only cartographic entities, with no
attached database information, are exported.
FieldLog 3 Users Guide
99
Importing and Exporting Data; Using the Newton, GPS, and External Databases
• Plot: select the export format (i.e. TXT, E00, TBA MIF as discussed
above). Notice that different export formats activate various export
options; this is summarized in the table below.
File type
Data type
Input fields
available
Common
input
values
TXT
all types
column delimiter
comma
text delimiter
double
quote
E00
point
symbol scale
text height
line
MIF
none
polygon
none
point
column delimiter
----blank
symbol scale
text height
TBA
line
column delimiter
blank
polygon
column delimiter
blank
point
column delimiter
blank
line
none
---
polygon
none
---
• Database: select the database columns that you want to export with each
map entity. Note that a FieldLog map entity is associated with at most one
row in one database table. Therefore, selecting columns from more than
one table results in many empty fields despite there being data in the
actual tables. It’s best to select map entities and database columns from
one table at a time. This means a separate export should take place for
each database table.
• Column delimiter: is the character that separates columns in the export
file. Typical column delimiters are commas, spaces, and tabs. For all
delimiters except tabs only the actual character is typed into this field
(e.g., , ; - ). For tabs, the word tab must be typed.
• Text delimiter: is the character that encloses text columns. The doublequote (“) is a common text delimiter. Note that if your database contains
this character in data entries, significant problems will result.
• Symbol scale: is a scale factor applied to exported symbols. Leaving this
field blank causes symbols to be exported at their current size.
• Text height: is the new text height. Leaving this field blank causes text to
be exported at its current height on the map.
• Projection: selects the output coordinate system. FieldLog assumes the
output coordinate system is that of the current map. If you want to project
the map to another coordinate system (e.g., UTM to lat/long geographic)
select an alternate projection from the list.
• File name: type a complete file name (e.g., c:\SnowLake\structdata.E00).
• Spatial data type: choose one of the three spatial data type buttons:
100
FieldLog 3 Users Guide
Exporting Data from Your FieldLog Database
•
Point for exporting symbols (i.e., shapes, blocks) and text.
Select the Text option if you want to attach database information
to text (e.g., when the only information being plotted from a
table is a text field such as lithology or geologist names). Don’t
select the text option if the text is related to a symbol (e.g.,
structural symbol and dip), as database information would be
generated in the export file for both the symbol and the text.
•
•
Line for exporting plines.
Polygon for exporting single-closed plines (i.e. polygons).
Note: If you want to export 3 different types of spatial data (point,
line, polygon) then you must create three separate export files.
Moreover, if you want to export database data with each map entity,
then each table could need to be exported separately, requiring 3
(spatial data types) x N (database tables) export files.
2.
Click Plot.
3.
You are prompted to make your entity selection set. Select the entities to
export from the screen, then press Enter to begin exporting. After
completion, FieldLog reports the number of entities ‘plotted’ to the file.
Exporting Data Using Fl-query
Fl-query generates an export file through the usual FieldLog fl-query
process. However, instead of plotting your results to a map, you can plot
them to an export file. Your data selection set won’t be confined to your
current drawing file, but can be any subset of your entire project database.
Unlike fl-export, the fl-query export files are generated with cartographic
defaults that can be modified. For information on performing FieldLog
database queries, refer to Chapter 4.
FieldLog 3 Users Guide
1.
Choose fl-query. Create a query that reflects the database subset you
want to export. You must include an x,y coordinate in your query output
to export the data to a spatial file format such as E00, MIF, TBA, or TXT.
2.
At the FieldLog query Scroll Table dialog box, select your file export
format from the Plot To pull down menu at the lower right corner of the
screen.
101
Importing and Exporting Data; Using the Newton, GPS, and External Databases
3.
Once you have selected your export file format, the Plot Options dialog box
appears.
4.
Fill out the plot options. Refer to the fl-export options above for more details
on how to do this.
5.
Click Plot.
6.
FieldLog lists the entities being plotted. When finished, it displays the total
number plotted in a message box.
Exporting Data Using Digital Exchange Format (DXF) in AutoCAD
The DXF file is a widely used complex ascii file format accepted by several
platforms/packages (ArcInfo, CorelDraw, MiniCAD, AutoCAD, to name a few).
Each AutoCAD version is accompanied by an updated DXF version, and this
causes some software packages to be incompatible with some DXF formats. For
example, CorelDRAW 7 doesn’t accept .dxf files from AutoCAD R14. It’s also
critical to realize that when exporting FieldLog data via DXF, non-AutoCAD
products can’t recognize database information associated with entities in the
DXF file.
Shapes verses blocks. AutoCAD drawings that contain FieldLog symbols as
AutoCAD shape entities often fail to be transferred via .dxf to other graphic
packages (e.g., CorelDRAW). However, AutoCAD block entities are often
successfully converted, which means you should change shapes to blocks in
AutoCAD prior to DXF export. You can convert symbols to blocks at any time,
but it’s easier to do so at the start of a project (see appendix A for details about
converting shapes to blocks). FieldLog’s default symbol representation is the
shape, but it can equally well use blocks. In either case, FieldLog must obtain the
symbol definitions from one or more .shx symbol libraries. Alternatively,
exporting via WMF (Windows Metafile) or EPS (Encapsulated Poscript) formats
tends to preserve both symbol types (shapes or blocks), but may result in the loss
of some other graphic characteristics (such as the recognition of a symbol as a
single entity versus a series of unrelated lines) depending on the receiving
software package.
To create a .dxf file:
1.
102
As dxfout is an AutoCAD command, you must have AutoCAD running with
your current drawing file loaded. FieldLog doesn’t need to be running.
FieldLog 3 Users Guide
Importing Database Tables and Text Files into FieldLog Databases
2.
If you’re only exporting a few items, you can leave unwanted layers on
and use the selected option. Otherwise, everything that isn’t frozen or
locked is exported, so turn off, freeze, and lock any layers that contain
information not required for transfer.
3.
Choose File>Export.
4.
Choose the .dxf format in the Save as file type box.
5.
Click Options if you want to export only selected entities, if you want to
change the file format to binary, or if you want to change the level of
accuracy (the number of decimal places exported in the ascii format).
You can’t set Options unless you have selected the .dxf format.
6.
Save the file.
You are returned to your drawing and prompted for your selection set. If
you don’t use the Options dialog box, saving the file causes everything
not frozen or locked to be included in the .dxf file
Importing Database Tables and Text Files into
FieldLog Databases
FieldLog imports external data via the fl-import command. FieldLog imports
either database tables or text files, through its ‘database’ or ‘text’ options
respectively.
When importing database tables, the database table format must match the
format of the FieldLog database. For example, if the FieldLog database is
stored in dBase3 format (.dbf), then only dBase3 tables can be imported.
Importing a database table involves insertion of a new table into your
FieldLog database project. If, for example, you want to import a new
FieldLog 3 Users Guide
103
Importing and Exporting Data; Using the Newton, GPS, and External Databases
FieldLog database table CHRON containing geochronologic results called
CHRON.dbf, you must use the ‘database’ import option. This option requires the
table to be first identified from within your FieldLog directory, and then to be
registered to a FieldLog project. Remember that FieldLog uses a rigorous data
model. Certain fields need to be present in the table if it is to be registered to a
project (see Chapter 7 for table registration).
Importing data as text files involves inserting new rows into pre-existing
FieldLog tables or overwriting existing rows within these tables.
Note: Before importing any data into your database, make a backup.
Importing Data
Reserved Characters in Text
File Import
The single quote is a reserved
character in SQL dependent
databases. Its occurrence in text
intended for import causes
FieldLog to reject the row.
1.
Choose fl-import.
2.
Choose either the Text file or Database option.
3.
To locate your file, click File.
4.
Click Import.
If you chose Text file, the Import Text File dialog box appears.
• Table: Select the FieldLog table you want to append/update (in this case
STRUC). The columns of the STRUC table appear in the right column of
the screen.
• Column: Select all the columns in the database column list that
correspond to columns in your text file, excluding BASENUMBER.
FieldLog imports text file columns by matching the first text file column
with the first selected database column, the second text column with the
second selected database column, and so on. Not all database columns
need to be selected and there may be gaps between selections. FieldLog
assumes all text columns are selected, but ignores any text columns for
which there are no corresponding database columns selected (e.g., when 3
104
FieldLog 3 Users Guide
Importing Database Tables and Text Files into FieldLog Databases
database columns are selected and there are 5 text file columns). Note
that the order of the columns in the text file MUST be identical to
the order of the columns in the database.
• Column Delimiter: Enter a Column Delimiter, usually , or TAB or
leave blank. FieldLog imports data on a line by line basis. The end of
a line indicates the end of a row and the beginning of a new row.
Individual columns (fields) within a row are separated by a
delimiting character (the column delimiter), and FieldLog considers a
field’s contents to consist of the characters embedded between these
delimiters (e.g., for the comma delimited row ‘field1, field2, field3’
there exist 3 fields: ‘field1’,’ field2’ and ‘field3’). This may be a
problem when the delimiting character exists in the field’s text as it’s
considered the end of a field (e.g., suppose field2 contained a comma
as in ‘field1, field,2, field3’ then 4 fields would be erroneously
recognized: ‘field1’, ’ field’, ‘2’ and ‘field3’. This problem can be
overcome by using text delimiters which surround text fields and
permit column delimiters to be embedded within them (e.g., using the
double quote as text delimiter in the row ‘ “field1”, “field,2”, “field3”
would result in three fields being recognized: ‘field1’, ’field,2’ and
‘field3’. Remember that the single quote is a special database
character that, if embedded in the text, causes the row to be to
rejected during import.
• Text Delimeter: Enter a Text Delimeter, usually “ or leave blank.
Text delimiters surround text fields, causing all the characters
between them to form the contents of a field (see the discussion
above).
• Projection: In the Projection field, select the coordinate system of
the points in the text file. This field only becomes active if you are
importing data into a table containing coordinates (e.g., in the
SnowLake database, the coordinates are stored in the STATI table).
The incoming coordinate system doesn’t need to match the database’s
coordinate system, as FieldLog converts them appropriately, if
possible (e.g., it converts incoming lat/long geographic coordinates to
the UTM Zone 14 and User Grid coordinates of the SnowLake
database).
• Append/Update: If you’re appending data, click Append. Click
Update to overwrite existing data. Update is only available when the
database table and incoming data can be uniquely identified by a
column value (e.g., Statnum in STATI) or a combination of column
values (e.g., Statnum+Rocknum in LITHO). Update searches
database tables for the matching values and if successful replaces the
database columns with those from the text file. If no matching values
are found, Update inserts a new row.
• Fieldworker: This option is only valid when importing location data
files from the Fieldworker Pro data entry software (i.e., those data
files that contain location coordinates). This option sets defaults for
the column list, column delimiter, and text delimiter.
5.
FieldLog 3 Users Guide
Click Import.
105
Importing and Exporting Data; Using the Newton, GPS, and External Databases
If you chose Database in the Import Table dialog box, the Register Database
Table dialog box appears.
6.
You must now register your new FieldLog table (refer to Chapter 7:
Registering Your Table for details on table type and required column
information).
Editing FieldLog Data Using External Databases
Using External Databases
The use of specific external
databases won’t be covered.
Refer to the relevant database
package manual. Note,
however, that you must
complete edits in the external
database for the change to
become visible in FieldLog.
This automatically happens if
you shut down the external
database. If you want to keep
the external database running
along with FieldLog and
AutoCAD, then you can
complete the edit function in the
database by clicking on another
row. A ‘pencil’ icon in the far
left column in Microsoft Access
(for example) is indicative that
the row is being actively edited.
106
When editing your project database it’s often convenient and advantageous to
adopt a data view format more versatile than FieldLog’s (which is limited by the
capabilities of AutoCAD). There are two approaches. The first approach links the
FieldLog database directly to the external system, permitting either system to edit
the same database simultaneously, (i.e. it’s possible to edit FieldLog data in
AutoCAD/FieldLog and MS-Access at the same time). The second method
requires the data to be exported to an external system (in this case, MS-Access)
where it is modified and re-imported into FieldLog.
Note: It may be prudent to make a copy of your entire FieldLog database before
editing it.
Editing Your Database Using MS-Access
Open up an external database. In this example we use Microsoft Access.
1.
Start MS-Access.
2.
Choose File>New Database.
FieldLog 3 Users Guide
Editing FieldLog Data Using External Databases
DBase III
3.
Blank database is highlighted. Click OK..
4.
Give your new Access database a name (e.g., SnowLake) and place it in
your FieldLog project directory (e.g., c:\SnowLake); it’s given the
extension .mdb for Microsoft Access database. Click Create.
5.
In the Table dialog box, click New.
FieldLog is based on the Dbase
III model. All of its files are in
DB3 format, and DB3 drivers
are used to access data and link
with AutoCAD.
• You must now decide whether you want to:
a) link your .mdb files directly to your FieldLog database using the Link
Table option to enable simultaneous editing, or
b) import your FieldLog .dbf tables into MS-ACCESS, modifying them,
and re-importing them back into FieldLog thus overwriting pre-existing
files. You can do this using the Import Table option.
FieldLog 3 Users Guide
107
Importing and Exporting Data; Using the Newton, GPS, and External Databases
Creating FieldLog-MS-Access Links
108
1.
To start linking tables, click Link Table.
2.
In the Files of type box, choose dBase3. A list of your FieldLog project .dbf
files appears. Select the first .dbf file you want to link to (in this case
Trav.dbf), then click Link.
3.
You’re prompted to choose an index file (.ndx) which controls the sequence
of rows in the database and improves query efficiency. If you’re using
AutoCAD R13/R14, ignore this option and click Cancel. For R12 and below
click all.ndx files prefixed with the name of the table you selected above (e.g.,
travpri.ndx), then click Select.
FieldLog 3 Users Guide
Editing FieldLog Data Using External Databases
4.
If the link is successful, the message Successfully linked to table appears.
To clear this message, click OK. To quit linking, click Close (or select
another .dbf to link to and repeat the process).
5.
Open the TRAV table in MS-Access by selecting the Table tab and
double-clicking TRAV, or by single-clicking TRAV and then clicking
Open.
Note that you aren’t creating a new .dbf file, but are linking to the .dbf
file resident in the FieldLog project database. If you deleted the linked
file in your .mdf database file, you would only be deleting the link to
FieldLog.
6.
FieldLog 3 Users Guide
You can now edit the data. Contents of the TRAV table in FieldLog are
modified as soon as the edits are made in Microsoft Access. Conversely,
if you edit the data in FieldLog (using fl-edit or fl-query), the changes are
visible in Microsoft Access.
109
Importing and Exporting Data; Using the Newton, GPS, and External Databases
Note: Changes made in Microsoft Access aren’t reflected in your AutoCAD
map drawing. You must either fl-update your map drawing (see Update,
Chapter 7) or erase the FieldLog entities and replot your data with fl-query.
To have MicroSoft Access running at the same time as FieldLog, simply
minimize the AutoCAD window; this allows you to move easily from one
package to the other.
Importing FieldLog Tables into MS-Access
1.
Select Import Table in the New Table dialog box, then click OK.
2.
In the Files of Type box, choose dBase3. A list of your FieldLog project .dbf
files appears. Select the first .dbf file you want to import.
3.
Click Import.
A Successfully imported table message appears.
110
4.
Click Close after importing all the tables you want to edit or view.
5.
Open the TRAV table in MS-Access by selecting the Table tab and doubleclicking TRAV, or by single-clicking TRAV and then clicking Open.
FieldLog 3 Users Guide
Summary
Note: Your FieldLog .dbf files won’t be modified unless you overwrite
the original FieldLog database file with the MS-Access database file.
6.
To overwrite/update the FieldLog database file with your .mdb database
file, choose File>Save As/Export.
When you’re entering/changing data in an external database, you can enter
any value, regardless of whether that value is present in a FieldLog picklist
or dictionary. FieldLog rules to control data entry won’t be in effect. Your
only data restrictions are length of field, as your external database uses the
setup values for column character length input under fl-setup>table
setup>column> setup. This means that you have to ensure that the spelling
and syntax of your edited entries match those values predetermined in
FieldLog. Subsequent queries won’t include misspelled entries in a queried
selection set.
Remember that changes made using your external database won’t be
reflected in your AutoCAD map drawing. You must either update your map
drawing (see Update, Chapter 7) or erase the FieldLog entities and replot
your data with fl-query.
Summary
FieldLog is capable of working alongside other database software, whether it
is running on a handheld field computer or alongside AutoCAD on a desktop
machine. Data import and export are fully supported in FieldLog but require
some knowledge of table names and their internal structure.
To safeguard against error, remember to thoroughly back up your entire
database project before importing data. Re-entering field data isn’t fun.
FieldLog 3 Users Guide
111
Importing and Exporting Data; Using the Newton, GPS, and External Databases
112
FieldLog 3 Users Guide
Installing and Upgrading
FieldLog; Creating FieldLog
Symbols
APPENDIX A
Introduction
FieldLog 3 is a highly structured program that builds database links, data automation methods, and
geologic reasoning tools into AutoCAD. Since it must interface with AutoCAD as well as support
its own functions, installation and project creation are slightly more complex than in traditional
stand-alone software.
This appendix covers AutoCAD installation under AutoCAD R12, R13, and R14, and provides
summary notes on upgrading existing FieldLog version 2 projects to FieldLog version 3. It also
summarizes advanced issues such as live links between AutoCAD/FieldLog and ODBC-compliant
databases.
The FieldLog Distribution
FieldLog contains 14 files:
•
•
•
•
•
•
•
•
•
FLG12WIN.EXE, the AutoCADR12 for Windows executable
FL12DOS.EXE, the AutoCAD R12 for DOS executable
FLG13.EXE, the AutoCAD R13 executable
FLG14.EXE, the AutoCAD R14 executable
FLG14ES.EXE, the AutoCAD R14 executable (Spanish)
SNOWLAKE.EXE, the Sample data.
SNOWEMP.EXE, an empty database
SNOW1314.EXE, sample digital photos and geophysics for AutoCAD R13 and R14
FIELDMAN.EXE, FieldLog v. 3.0 User Guide and Manual in Postscript
FieldLog 3 Users Guide
113
•
•
•
•
•
SNOWARC.ZIP, sample geophysical data
FIELDMAN.PDF, FieldLog v.3.0 Users Guide and Manual in PDF format
FLG14ES.PDF, FieldLog v.3.0 User Guide in PDF format (Spanish)
ASIDB3.EXE, DBASE 3 driver for AutoCAD R14.00 or R14.01
ASIDB3.XMX, DBASE 3 driver for AutoCADR14.00 or R14.01
The first 9 are self-extracting pkzip archives and unpack into many small files
when they are double clicked in Windows. The snowarc.zip file must be
extracted either with WinZip or by using the command:
pkunzip -d snowarc
To view the PDF files, you must download Acrobat Reader.
The last two files are dbase drivers. The drivers shipped with AutoCAD R14 are
unstable and need to be re-installed into your main AutoCAD directory.
There is a FAQ at http://gis.nrcan.gc.ca
FieldLog doesn’t support AutoCAD 2000 or any of its variants.
Installing FieldLog Software, Databases, and
Connecting to Databases
To use FieldLog you must install the full version of AutoCAD for DOS or
Windows. Specifically, the AutoCAD database environment (ASE) must be
installed correctly. If you aren’t sure these are installed, reinstall AutoCAD on
your machine with all options set. A full installation guarantees that all necessary
components are installed.
Ensure that you have installed your latest version of AutoCAD. For R12 this
means R12_c4 for Windows and R12_c3 for DOS. Earlier releases contain
significant bugs.
Installation involves three separate procedures:
1.
Installation of the FieldLog software package.
2.
Installation of sample, empty, or preexisting databases.
3.
Instructing FieldLog to recognize the appropriate database.
If you are a first-time user, you probably want to install the sample database so
that you can do the tutorial. Those starting a new project will likely be use
SnowLake or a pre-existing database.
Installing FieldLog
To install FieldLog under Windows 3.1, Windows 95, or Windows NT:
1.
114
Go to the AutoCad Support directory (i.e. \acadwin\support for R12
windows, \acad\support for R12 DOS, \r13\win\support for R13, and
\Program Files\ AutoCAD R14\support for R14).
FieldLog 3 Users Guide
Installing FieldLog Software, Databases, and Connecting to Databases
2.
For R12/R13, if you have a custom AutoCAD menu file stored in this
directory and you have named it ACAD.MNU, copy it under a new
filename (... ACADold.MNU ...) since FieldLog writes a new
ACAD.MNU file into this directory as it unpacks.
3.
Copy one of the FieldLog executables (flg12win.exe, flg12dos.exe,
flg13.exe, flg14.exe) into the AutoCAD support directory using DOS,
File Manager, or Windows Explorer.
4.
Execute the FieldLog file you copied by typing its name at the DOS
prompt, or double clicking the Icon in Windows Explorer/File Manager.
This unpacks several files into the AutoCAD support directory.
5.
For R12: reboot your system.
6.
For R14.00 and R14.01, re-install dbase3 drivers by copying the two
ASIDB3 files found at the FieldLog website into your main AutoCAD
directory. These overwrite the somewhat unstable driver files that come
with AutoCAD.
Several new files appear in your AutoCAD support directory, including one
called FIELDLOG.DCL.
Installing Sample Data and Creating Project Directories
The files associated with a FieldLog project are stored in one directory,
known as the project directory. Installing a project or creating a new project
first involves creating a directory to contain the project and then, for existing
projects, copying the project files into the directory and, finally, notifying
FieldLog about the project’s name and location. To install the tutorial data
provided:
1.
Make a directory for the sample data and name it snowlake (e.g.
c:\snowlake).
2.
Go to the sample data directory you just created.
3.
Copy the file SnowLake.exe to this directory.
4.
Extract the data by typing the filename (Snowlake) or by double clicking
on the file’s icon.
5.
Get a directory listing for the sample directory. There should be many
small files in the directory.
This installs the sample project data. To inform FieldLog about this sample
data follow the instructions below.
Connecting to Project Databases
Setting Up a FieldLog Project Under AutoCAD R12
In order to use a project with AutoCAD R12 and FieldLog, a registration file
called FieldLog.prj located in AutoCAD’s support directory, and your PC’s
AutoExec.bat startup file, must be modified. A line for each project to be
used with FieldLog is added to these files. These changes allow FieldLog to
find the data on the PC, to determine the database type, and to assign a
project name to the files found.
FieldLog 3 Users Guide
115
1.
Using a word processor (such as NotePad), edit the ascii text file called
fieldlog.prj in your AutoCAD support directory (typically this is
\acad\support for DOS and \acadwin\support for Windows). It should include
the following line:
SnowLake=c:\snowlake,dBase3
assuming c:\snowlake is the directory containing the sample data files. There
should be no spaces in this file. Make sure you save it as an ascii text file, not
as a word processor file.
2.
Add the following line to the top of your autoexec.bat file, typically found in
the root directory of your PC (e.g. c:\autoexec.bat):
set SnowLake=c:\snowlake
again assuming c:\snowlake is the directory with the sample data files. The
only space should be after the word set. Save this file as an ascii text file.
3.
Reboot the machine.
If you proceed through the logon process described in Chapter 2 of this tutorial,
the SnowLake project should now be accessible. Successive projects are added
the same way, though each project requires a unique name and distinct project
directory to contain its files.
Setting Up a FieldLog Project Under AutoCAD R13 and R14
Under AutoCAD R12, the location of projects and their host database type is
stored in the FieldLog.prj file. This file is not used by FieldLog for AutoCAD
R13 and R14. In AutoCAD R13, the necessary information to locate and identify
a database is stored in the ASI.INI file in the AutoCAD directory, and in
AutoCAD R14 it is stored in the Windows Registry. These files aren’t modified
manually, but are instead handled by a new command (fl-setup>Project Setup)
under the fl-setup menu of FieldLog (see fl-setup instructions listed below).
Before you can use FieldLog within AutoCAD, you must insert FieldLog into
your AutoCAD menu located at the top of your screen.
1.
In AutoCAD, choose Tools>Customize Menus.
The Customize Menus screen appears.
2.
In the blank File Name box, type FieldLog, then click Load.
3.
Select the Menu Bar tab.
4.
From the Menu Group selection set, choose FieldLog.
5.
Highlight Help in Menu Bar, then click Insert.
A FieldLog menu appears on your AutoCAD menu bar, to the left of Help.
116
6.
To exit the dialog box, click Close.
7.
Load FieldLog from its FieldLog pull-down menu in AutoCAD. Then click
the fl-setup>Project Setup button.
FieldLog 3 Users Guide
Installing FieldLog Software, Databases, and Connecting to Databases
The Project Setup dialog box has four columns:
• Project Name
This is FieldLog’s name for your project. It’s unrelated to actual
filenames in the target directory. Note: project names should NOT be
changed once data has been added to a map within the project, doing
so nullifies the database link between the map and database.
• Project Directory
This indicates the location of the project, either on the local PC’s hard
drive or on a remotely connected hard drive.
• Database Type
This indicates the type of database that is hosting the FieldLog project.
The default is dBaseIII.
• Database Links
Project Catalogues
AutoCAD requires that project
databases be arranged in
accordance with the SQL ‘92
specification. This means that
all projects hosted by a specific
database type, such as dbase III,
must be stored as subdirectories of a common
location on the hard drive
If a specified project is stored in
a directory named c:\data\field
then all other projects must be
subdirectories of c:\data as well.
Project Names
FieldLog may erroneously
permit two projects to be
assigned to the same data
directory. This prevents both
projects from being available.
This can only be corrected via
the ASICFG program, located
in the ACAD support directory.
FieldLog 3 Users Guide
This indicates whether AutoCAD database links are maintained in
addition to FieldLog’s links. These additional links are required if the
project is to be accessed from AutoCAD MAP or via the AutoCAD SQL
extension.
There are four corresponding input fields: two text fields for the name and
path to a new project, a pop-up menu for choosing the database type, and a
toggle to turn links on and off. The New button empties all of the input fields
in preparation for placing a new project on the list. The Insert button adds a
project definition using the variables in the four fields. When a new project
is inserted, FieldLog attempts to verify that the Project Catalogue restriction
is met (see box at left), but doesn’t verify that the directory exists or contains
a valid FieldLog project.
Once a directory has been specified, you can log on to the database and
create tables, add data, and so on.
The Delete button removes a project from the list, but only if it’s not
currently logged on. If the project removed was the last of its type (e.g.,
dBaseIII) the catalogue restriction is lifted for the subsequent added
database. Note that deleting a project specification does NOT delete any of
the project files, it merely makes the project unknown to FieldLog.
117
The Modify button allows the database directory and link setting to be changed.
If the name or type of database is to be modified, you must delete the current
database reference and reinsert it with a new name/type.
Note for ODBC Database Users
For ODBC projects registered to FieldLog, the Directory field must not only
specify the location of the directory but also the name of the database file in
which the FieldLog data resides. For example, for MS Access databases this
database file possesses an .MDB extension (e.g., c:\snowlake\snowlake.mdb).
The catalogue restriction applies to the location of ODBC files.
Projects must also be registered with the Windows ODBC driver. To register a
project with ODBC, go to the Control Panel in Windows, and choose the
Windows ODBC Drivers icon. The ODBC Data Source Administrator dialog box
appears. If there isn’t currently a data source called ODBC, click Add to create
one. Select the appropriate driver type from the list, and then click Finish. Enter
ODBC as the new data source’s name, and select your database as the default data
source. Click OK to save the data source configuration. The database should now
be accessible and any other database with a similar driver will also be accessible.
The name (here, ODBC) of the data source must be identical to the name of the
ODBC environment which you are using in the ASI/Registry.
These steps are required for AutoCAD to function correctly with ODBC.
The Projections Project
Under FieldLog 3, the name Projections is reserved for a special purpose project
used to maintain a library of ellipsoids, projections, and transformations. This
allows users to centralize this information even if many individual FieldLog
projects are being used. It also allows users to share projections with other users
without risking sharing actual data. The Projections project doesn’t normally
have any tables other than those used for ellipsoids, projections, and
transformations (i.e., fldatum.dbf, flproj.dbf, flxform.dbf, flxpoint.dbf).
Whenever FieldLog loads, it checks to see if a project called Projections has been
defined. If so, it automatically loads this project and makes all of the projection
information available to all subsequent FieldLog projects. FieldLog ensures that
all changes and additions to the projections environment are kept in this central
118
FieldLog 3 Users Guide
Upgrading From FieldLog v2.83 to v3.0
location. Projection information from individual projects is then added to
this projection catalog when the projects are logged on. Any changes to
projection information cause all the projection information to be saved to the
common location, as well as to any loaded projects. Therefore it’s critical
that projection information is well managed.
To create a projections project, create a new project using fl-setup (R13) or a
text editor (R14), depending on your version of AutoCAD. Name this new
project Projections. You may further wish to copy the projection example
files from SnowLake (i.e., fldatum.dbf, flproj.dbf, flxform.dbf, flxpoint.dbf)
into the directory for this new project to gain access to the wide variety of
defined projections therein.
Upgrading From FieldLog v2.83 to v3.0
To update FieldLog from version 2.83 to 3.0, you must upgrade your v2.83
database and any AutoCAD maps containing data linked to that database.
This is a four step process:
1.
Back up your entire project onto a safe, reliable backup medium.
Consider backing it up twice!
2.
You must inform FieldLog where the v2.83 project can be found.
In AutoCAD R12:
• Add a project definition line to your Autoexec.bat as explained above
for the sample data. For example:
set MyProjectName=c:\mydatadirectory
If you have multiple projects on this machine, one set statement in
your autoexec.bat file is required for each project.
• Add a project definition file to your AutoCAD support directory as
explained above for the sample data. For example:
MyProject=c:\mydatadirectory,dBase3
If you have multiple projects on this machine, each project is
described by a separate line in your FIELDLOG.PRJ file.
• Reboot your system.
In AutoCAD R13 and R14:
• Start AutoCAD, Load FieldLog, and in fl-setup>Project Setup
insert a new project definition specifying the project name (e.g.
MyProject), its location (e.g. c:\mydatadirectory), and database type
(e.g. dBaseIII). This project definition should be listed in the main
panel after being inserted.
FieldLog 3 Users Guide
3.
You may want to copy the projection definitions from the SnowLake
sample dataset into your project directory. This involves copying the
fldatum.dbf, flproj.dbf, flxform.dbf, and flxpoint.dbf files from the
SnowLake project directory (i.e. c:\snowlake) into the v2.83 project
directory (i.e. c:\mydatadirectory).
4.
Upgrade your project database (do all of the following steps, carefully, in
order):
119
a.
Start AutoCAD and Load FieldLog, if this is not already done.
b.
Logon with fl-logon.
c.
Select fl-upgrade from the menu or type fl-upgrade at the
command line.
d.
To select the project you want to upgrade, click it.
e.
To start the upgrade, click OK. FieldLog proceeds to upgrade each table
in your database.
f.
FieldLog interrupts the upgrade process and asks you load any symbol
libraries you want to use with the project. If FieldLog is able to locate
the OGS, NATMAP and GSC symbol libraries it automatically loads
them and they should appear in the main panel. Any additional libraries
can be specified at this point. Use the File button to locate the libraries,
and the Load button to load them. When finished, click Exit. FieldLog
continues the upgrade process.
g.
FieldLog informs you when the v2.83 database has been upgraded to
v3.0. To save the new setup, click OK.
h.
FieldLog then asks to upgrade the map. You can upgrade your map(s)
now or later. Before a map can be used with v3.0 it must be upgraded by
following steps a-g, and then selecting all FieldLog created entities on
the map. FieldLog then upgrades the map entities so that they are linked
to the v3.0 database. Map entities created with v2.83 don’t communicate
with a v3.0 database until they are upgraded. Fl-upgrade must be
performed once on the database, and once for each map associated with
the database.
i.
When the upgrade process is completed FieldLog notifies you that your
database tables may need to be registered more accurately. This is an
optional, advanced procedure. To complete the upgrade process you can
register your tables more accurately by:
•
Select fl-setup from the menu or type fl-setup at the command
line, then enter Tables Setup.
•
Select your project from the list on the right.
•
Click the Table option, then select the first table on the right.
•
Click Setup.
•
Select appropriate table types and identify key fields. Each table
already has:
a unique number field and station number field; other options:
STATION: unique#, station#, outcrop#, traverse#
SECTION: unique#, station#, section# (e.g. drill hole segments)
ROCK: unique#, station#, section#, rock# (e.g. each rock at a station is numbered)
SAMPLE: unique#, station#, section#, rock#, sample# (e.g. rock samples, photos)
GENESIS: unique#, station#, section#, rock#, sample# (e.g. structure)
COMPOSE: unique#, station#, section#, rock#, sample# (e.g. minerals, alteration)
ANALYSIS: unique#, station#, section#, rock#, sample#, analysis# (e.g. thin
sections, geochemistry, and so on)
•
120
To save your new setup, open the Fl-Setup button box, then click
Save FieldLog Setup.
FieldLog 3 Users Guide
Upgrading a v3.0 Project From AutoCAD R12 to R13/R14
Upgrading a v3.0 Project From AutoCAD R12 to
R13/R14
To upgrade from AutoCAD R12 to AutoCAD R13/R14 no special upgrade
procedure is required. Simply follow the instructions above ( Setting Up a
FieldLog Project under AutoCAD R13 and R14) to inform FieldLog
about your v3.0 project. However, because AutoCAD R13/R14 is SQL’92
compliant it reserves many more words than R12. If a database table name or
column name uses any of these reserved words, the table won’t be accessible
to FieldLog’s commands (e.g. fl-add, fl-edit, fl-query, etc.). To correct this,
the improper name must be changed. This name change must be performed
outside FieldLog using another database system such as dBase, FoxPro, MSAccess, and so on. The list of reserved words (with the most commonly used
improper names bolded) is:
ABSOLUTE, ACTION, ADD, ALL, ALLOCATE, ALTER,
AND, ANY, ARE, AS, ASC, ASSERTION, AT, AUTHORIZATION,
AVG, BEGIN, BETWEEN, BIT, BIT_LENGTH, BOTH, BY,
CASCADE, CASE, CAST, CATALOG, CHAR, CHARACTER,
CHAR_LENGTH, CHARACTER_LENGTH, CHECK, CLOSE, COALESCE,
COLLATE, COLLATION, COLUMN, COMMIT, CONNECT, CONNECTION,
CONSTRAINT, CONSTRAINTS, CONTINUE, CONVERT, CORRESPONDING,
COUNT, CREATE, CROSS, CURRENT_DATE, CURRENT_TIME,
CURRENT_TIMESTAMP, CURRENT_USER, CURSOR, DATE, DAY,
DEALLOCATE, DEC, DECIMAL, DECLARE, DEFAULT, DEFERABLE,
DEFERRED, DELETE, DESC, DESCRIBE, DESCRIPTOR, DIAGNOSTICS,
DISCONNECT, DISTINCT, DOMAIN, DOUBLE, DROP, ELSE, END,
END-EXEC, ESCAPE, EXCEPT, EXCEPTION, EXEC, EXECUTE, EXISTS,
EXTERNAL, EXTRACT, FALSE, FETCH, FIRST, FLOAT, FOR,
FOREIGN, FOUND, FROM, FULL, GET, GLOBAL, GO, GOTO, GRANT,
GROUP, HAVING, HOUR, IDENTITY, IMMEDIATE, IN, INDICATOR,
INITIALLY, INNER, INPUT, INSENSITIVE, INSERT, INT, INTEGER,
INTERSECT, INTERVAL, INTO, IS, ISOLATION, JOIN, KEY, LANGUAGE,
LAST, LEADING, LEFT, LEVEL, LIKE, LOCAL, LOWER, MATCH, MAX,
MIN, MINUTE, MODULE, MONTH, NAMES, NATIONAL, NATURAL,
NCHAR, NEXT, NO, NOT, NULL, NULLIF, NUMERIC, OCTET_LENGTH, OF,
ON, ONLY, OPEN, OPTION, OR, ORDER, OUTER, OUTPUT, OVERLAPS,
PARTIAL, POSITION, PRECISION, PREPARE, PRESERVE, PRIMARY, PRIOR,
PRIVILEGES, PROCEDURE, PUBLIC, READ, REAL, REFERENCES,
RELATIVE, RESTRICT, REVOKE, RIGHT, ROLLBACK, ROWS, SCHEMA,
SCROLL, SECOND, SECTION, SELECT, SESSION, SESSION_USER, SET,
SIZE, SMALLINT, SOME, SQL, SQLCODE, SQLERROR, SQLSTATE,
SUBSTRING, SUM, SYSTEM_USER, TABLE, TEMPORARY, THEN, TIME,
TIMESTAMP, TIMEZONE_HOUR, TIMEZONE_MINUTE, TO, TRAILING,
FieldLog 3 Users Guide
121
TRANSACTION, TRANSLATE, TRANSLATION, TRIM, TRUE, UNION, UNIQUE,
UNKNOWN, UPDATE, UPPER, USAGE, USER, USING, VALUE, VALUES,
VARCHAR, VARYING, VIEW, WHEN, WHENEVER, WHERE, WITH, WORK,
WRITE, YEAR, ZONE
Creating Custom Symbols in AutoCAD for FieldLog
The DXF2SHX Program
FieldLog contains libraries with variations of the most common symbols used in
geological cartography (NATMAP.shx, OGS.shx and Metamorhpic.shx).
However, in some cases you may need to create your own symbol library to
reflect the cartographic needs of your operating environment. Creating a new
symbol library to use with FieldLog involves drawing the symbols in AutoCAD,
exporting them to a dxf format, and converting the dxf file to a.shx symbol
library using the antiquated DXF2SHX.EXE DOS program.
The DXF2SHX program converts a DXF file drawn in AutoCAD to an
AutoCAD.SHX symbol file format.
The DXF2SHX program works best with AutoCAD R12. The program doesn’t
convert dxf files generated from R14 (even if they are saved as R12 dxf) without
some low-level recoding using a text editor/word processor.
Some rules for drawing symbols in AutoCAD:
• Each symbol and its components must be placed on its own AutoCAD layer.
• The symbol’s layer name becomes the symbol name.
• Each symbol layer name should be alphanumeric and contain no special
characters.
• All entities created on layer ‘0’ are ignored, you can use this layer for
annotation.
• Symbols must be constructed only from the following simple AutoCAD
entities: lines, plines, circles, or arcs; do not use hatches or shapes.
• Each symbol must reside within a 10 by 10 unit cell; i.e. each symbol must
occupy an area not greater than a square 10 drawing units long and wide.
• Each start or end point of an arc or line should occur on an integer boundary
or contain no more than one decimal place of accuracy; e.g. 10.0 or 10.1 are
acceptable, whereas 10.01 and 10.11 aren’t.
• Each symbol must have a text entity indicating the symbol origin. This text
string is oriented so that the lower left corner of the first character is the
insertion point of the text, and hence the origin point for the symbol.
• To execute the DXF2SHX program, use the DOS prompt.
Some helpful guidelines for symbol creation in AutoCAD:
1.
Choose Settings>Drawing aids.
• Turn grid on; set x and y spacing to 0.1.
122
FieldLog 3 Users Guide
Creating Custom Symbols in AutoCAD for FieldLog
• Turn snap on; set x and y spacing to match grid spacing.
• Click OK.
2.
On layer 0 draw a workspace box 10 by 10 units.
3.
Type pline, then enter
0,0
10,0
10,10
0,10
0,0
You may want to create a grid with several 10 x 10 cells, one cell for each
symbol you’re creating.
To create the symbol:
1.
Through the AutoCAD layer manager, create different layer names for
the different symbols you’re creating.
2.
Make the layer of the symbol you want to create current.
3.
Create the symbol using pline or arc, taking care to start and end arcs and
plines on .1 grid points.
4.
Label your symbol and give it a point of origin by typing its name using
dtext. The start point of the text becomes the point of origin.
5.
Save the drawing file.
6.
Repeat steps 2 to 5 for each symbol created
Make a dxf file:
• In R14:
• Make a version R12.dxf and save to the \Program Files\
AutoCADR14 \Support directory.
• Open the .dxf file in a word-processing package or text editor.
• Scroll down to the ‘table’ section and modify the ‘Dimstyle’table
portion to look like this:
0
TABLE
2
DIMSTYLE
70
0
0
ENDTAB
0
ENDSEC
• Save your file as a dxf (text) file.
• In R12: Save your dxf file to \Acadwin\Support directory:
• Go to the DOS prompt (either using the
Start>Programs>Command Prompt icon in Windows or ‘shell
out’ in AutoCAD by typing shell and then pressing enter twice).
• At the command line type:
FieldLog 3 Users Guide
123
DXF2SHX
DXFfilename.DXF
SHXfilename.SHX
• The conversion program executes quickly and ends with ‘writing shapes.....
done’, if all went well.
• To exit DOS, type exit, and press Enter.
• To verify the process has worked correctly, begin a new drawing in
AutoCAD, load the symbol library, and insert a shape:
•
•
•
•
•
Type load at the command line.
Select your new symbol library (the newly generated .shx file) and load it.
To insert your symbol, type shape.
Type the name of your symbol.
Your new symbol appears, and you’re prompted for the insertion point,
size, and rotation of the symbol
The SHX2DXF Program
The FieldLog package also contains the corollary to DXF2SHX — the
SHX2DXF program. This program converts an AutoCAD symbol library (.SHX
files) into a DXF format, from which it can easily be viewed or revised.
The DXF file created by SHX2DXF contains each symbol from the SHX symbol
library. In AutoCAD, each symbol occupies its own AutoCAD layer, annotated
by its symbol name. The program must be executed using the DOS prompt.
At the command line, type:
SHX2DXF
SHXfilename.SHX
DXFfilename.DXF
Changing FieldLog Symbols From Shapes to Blocks
FieldLog represents symbols equally well as either AutoCAD blocks (.dwg files)
or shapes (.shx files); by default FieldLog uses shapes. FieldLog MUST draw all
symbols from one or more shape symbol libraries, regardless of the method of
representation selected (i.e. shape vs. block). So why change the format? For
symbols exported as .dxf to import correctly into other software packages, the
symbols need to be initially plotted as blocks or converted from shapes to blocks
prior to export. Although symbols on a map can be changed from shapes to
blocks at any time during the life of a project it’s easier to set/change the symbol
format at the start of the project.
To change the FieldLog setup from shapes to blocks, each symbol definition in
the project database requires editing. The symbols plotted to your map also need
to be updated to reflect the changes in your FieldLog setup. This isn’t a huge
undertaking as you are probably using only a small subset of the symbology
available with FieldLog. Before you start, remember to make a backup of both
your database and your AutoCAD map drawing file.
To edit:
1.
124
Go to fl-add.
FieldLog 3 Users Guide
Conclusions
2.
Select a table that contains a column with an attached ‘list’, and where
the terms in the list are symbolized (e.g. Struc.Feature in SnowLake).
3.
Select Struc.Feature, and click List.
4.
Select the first term you want to change, and click Palette.
5.
Click the Block button.
6.
Click OK.
7.
Repeat this for all the terms you expect are, or will be, displayed on your
map.
8.
Exit from fl-add, and Save your setup changes with fl-setup>Save
FieldLog setup.
To update your map symbol entities:
1.
In AutoCAD, turn off and freeze all the layers except for those
containing the symbols you want to update.
2.
Using fl-update, ‘window’ the map, and press Enter. FieldLog applies
the symbol changes and converts the shapes to blocks.
3.
Save your map in AutoCAD.
Conclusions
This appendix provides a basic introduction to FieldLog installation and
project setup. It also covers how to make a new symbol library using the
program DXF2SHX, and how to convert symbols drawn as shapes to
symbols drawn as blocks.
When importing FieldLog v2.83 files into FieldLog v3.0, a wide variety of
minor but irritating problems can occur. Check the FieldLog web site for tips
and tricks, additions to the manuals, and for information on contacting the
authors.
FieldLog 3 Users Guide
125
126
FieldLog 3 Users Guide
APPENDIX B
FieldLog: Data Models,
Relational Databases, and
FieldLog’s Database Design
A Brief Description of FieldLog
Abstract
FieldLog is a software tool developed by the Geological Survey of Canada (GSC) to aid geologists
in the digital management of geologic field data. It provides a means to digitally record, retrieve,
display, and analyse field observations, and to supplement cartographic map preparation and
geologic interpretation. FieldLog maintains a relational database within an AutoCAD environment
and connects to several popular GIS systems through export formats. It’s founded on a data model
which consists of geological concepts common to the mapping process. Project databases, their
cartographic representation, referenced coordinate systems, and glossaries of geologic terms are
completely configured and modifiable by the geologist. The data model defines much of the
internal database and cartographic behaviour, insulating the geologist from many technical details
and providing enhancements to traditional database and cartographic operations. Sophisticated data
entry and database query, including specialized geologic diagrams, are present to augment the mapmaking process. Integration with mobile computing devices, as well as with more standard
methods of field note taking such as traditional field notebooks, permits a broad range of data
recording options. FieldLog has been an integral component of the GSC’s regional mapping and
rapid digital map publication methodology since 1991.
Geologic Map Construction
Geologic maps depict geologic observations and interpreted geologic objects which are often
inferred from the observational data. The exact representation of these objects as map entities is
scale dependent and the geometry may vary between point, line, polygon, surface, and volumetric
objects. The identification or deduction of geologic objects is iterative: evidence is gathered and
hypotheses are formulated which are supported or refuted by further evidence. This is an analytic
process where data are mutable and prone to re-classification or re-interpretation during the course
FieldLog 3 Users Guide
127
of the mapping. In this context a field system must ultimately be an aid to the
thinking process as much as it must be an efficient mechanism to record and store
thoughts. Effective gathering of data is the first priority in this process, soon
followed by a need to recast the data into different scenarios.
Under FieldLog a geologic map usually begins as one or more digital
topographic basemaps which are originally purchased from some third party,
typically a government agency. The maps may also be directly scanned and
digitized. Once acquired, the base maps are registered in some coordinate system
which defines their geographic position. A project database is constructed by the
field geologist to contain the field data and to interact with the maps. Project
databases may be derived from corporate templates or may be begun anew. Once
a project database is established data can be simultaneously added to the maps
and to tables in the database. In this process field data may be displayed on
several maps and a map may contain data from several projects. Though
FieldLog allows several projects to be active during a session, its functions only
operate on one project at a time. For instance, query contents can’t be selected
from more than one project in any one query.
Field observations typically are sites or boundaries, and these are added to the
base map as points or line segments. Their attributes are entered into the database
at the same time. These supporting data are manually entered into the FieldLog
database from field notebooks or forms, or are digitized from air photographs and
topographic maps using small digitizing tablets. They may also be imported from
mobile computing devices such as GPS (satellite-based Global Positioning
Systems) and PDA (hand-held Personal Digital Assistants) or more sophisticated
portable units. Some of the data are symbolized on the map — either via manual
digitization or through importation and plotting via queries — and some of them
reside in the database as supporting evidence. This data entry stage typically
involves the entry of site information into the database and the display of select
portions on the map. Boundary data may also be recorded and digitized at this
time. Mesoscopic observations such as station locations, structural
measurements, and rock type characteristics are recorded and plotted with
FieldLog, and macroscopic observations such as contacts, folds, and faults are
drawn using AutoCAD’s line and polygon drawing mechanisms — they may also
be imported from pre-existing digital geology maps or from portable field
computers. Once in digital form, the evolving map is typically plotted at scale on
a regular (i.e. daily) basis using page size printers. The plotted pages are joined,
often with tape, and this growing paper mosaic represents the field map. Often
interpretive features, such as geological contacts, are sketched by hand onto this
mosaic, and subsequently digitized when and if confirmed. As the geological
story unfolds, the various hypotheses — depicted as disconnected boundaries on
the map — are joined to form polygons which eventually partition the
geographic extent of the map. In this process observed supporting data are often
reclassified using FieldLog’s editing capabilities which ensure that map and
database equivalency is maintained. AutoCAD’s standard functions are used to
edit all non-FieldLog data.
The evolution of geologic insight for a map area often involves the utilization of
tools such as stereographic plots as well as geophysical overlays. FieldLog
provides either the resources to perform these tasks or to export the data
painlessly so that it can be further integrated into more sophisticated and
specialized systems such as GIS or other geological plotting packages.
Ultimately the results of such deliberation are returned to FieldLog as new
128
FieldLog 3 Users Guide
A Brief Description of FieldLog
geologic objects on the map, or as changes to existing map entities. The end
result is a geologic field map with an underlying database of field
observations.
Data Entry
FieldLog maintains field observations in a relational database which is
linked to one or more digital AutoCAD maps. In a typical project most field
data are stored in the relational database, and a subset of these data are
displayed on the map. However, some map entities, such as geological
boundaries, may exist solely as cartographic objects without being
additionally described in the field database. FieldLog permits map entities of
any geometric shape (e.g. points, lines, or polygons) and cartographic type
(e.g. symbols, text, lines, and so on) to be described in the database.
Furthermore, the data entry process allows point entities to be
simultaneously added to the database and map as symbols or text. This
procedure doesn’t hold for other map entities such as lines or polygons: they
must first be added to the map using AutoCAD’s standard cartographic
functions and then linked to a database description during data entry. Each
AutoCAD map, and thus each map entity, has positional information
referenced to a previously established coordinate system taken from
FieldLog’s catalogue of cartographic projections. Positional information is
copied from the map to the FieldLog database only for designated points,
whereas positional information for other map entities remains in the
AutoCAD map.
When entering data, field observations may be typed, locations may be
digitized, and either can be imported from external text or database tables. A
digital topographic map is usually used as a backdrop onto which the
observations are plotted. When observations are imported from external
sources such as mobile data collection devices, they are retrieved from the
database and plotted to the map via a user directed query process. When
observations reside in paper notebooks or forms, they are manually entered
by selecting a table and entering information into the columns of a new row.
Column contents are verified according to various parameters configured by
the geologist. If verified, the new row is inserted into the table and the values
of selected columns are optionally positioned on the digital map through
visual location or via digitization from some source such as a topographic
map or air photograph. When several observations occur at a site, the data
may be stored in more than one table or in more than one row in a table. In
this case FieldLog propagates critical values between rows, or from one
table to another, in order to reduce data entry time and to enforce proper data
connectivity between database tables (i.e. referential integrity constraints).
For example, site identifiers propagate to all rows and tables until a new site
is specified. FieldLog also permits customizable dictionaries of geological
terms to be created and attached to columns for data entry purposes (Fig. B1) and for the maintenance of semantic consistency of terminology. Once a
dictionary is attached to a column, the contents of the column are restricted
FieldLog 3 Users Guide
129
to one or, optionally, more terms from the dictionary. Dictionaries are unlimited
in the number of terms they may contain.
Figure B-1. Data entry using a hierarchical profile.
Mobile Computing
FieldLog v3.0 takes advantage of affordable pen-based data entry technology
offered by the Apple Newton by exporting a field database structure to the
Newton and importing collected data from it. The FieldLog database format is
transferred to the Apple Newton where it is displayed intact, including all
relevant hierarchical profiles (Fig. B-2). Commercial software (Fieldworker)
operates on the Newton to receive the FieldLog project template and present it
for data entry. Data may be hand-written on a touch-sensitive screen, or typed on
a small, screen resident keypad. A GPS can be connected to the Newton and its
locations directly read by the Fieldworker software, permitting complete data
entry to occur in the field. The resultant data are exported to FieldLog in a
specialized text file format and are merged into the project database. FieldLog
interfaces to mobile computing devices other than the Apple Newton using
standard import/export formats. FieldLog v3.0 has also been successfully utilized
on the outcrop via portable pen-based computers operating AutoCAD under the
Windows 95/NT operating systems.
130
FieldLog 3 Users Guide
A Brief Description of FieldLog
Figure B-2. A FieldLog project database on the Apple Newton, using the Fieldworker
software for data entry. The Station table is displayed.
Operating Platforms
FieldLog operates in AutoCAD’s cartographic environment which it extends
to include additional geographic and geologic processing capability.
AutoCAD was chosen because of its popularity, its cartographic excellence,
its liberal development environment, and its ability to run on many hardware
and operating system platforms. Of the operating systems supported by
AutoCAD, FieldLog currently functions within DOS, Windows 3.1, 95, and
NT. It currently uses all current versions of AutoCAD including releases 12,
13 and 14.
FieldLog can interact with a variety of database systems, primarily because
all relational database activity is performed transparent to the geologist using
SQL (Structured Query Language), which is platform independent.
Relational databases such as dBase, ODBC (e.g. MS-Access), Oracle, and so
on, are thus accessible from this modern client-server environment.
FieldLog 3 Users Guide
131
Database Query
Queries are performed using a visual interface which permits the user to
thematically filter the database and view the results in tabular form. Database
filters are constructed using conditional statements which are composed of
thematic, spatial, or hierarchical components and which are connected with
‘AND or ‘OR’ logical operators (Fig. B-3a). Query results are displayed as a
virtual table (Fig. B-3b). Row contents in the resulting table may be browsed,
deleted and modified singly or globally. The results may also be plotted to the
active AutoCAD map using customized geological map symbols (Fig. B-3c),
they may be manipulated to produce custom diagrams (i.e. stereonet, rose,
geochemical, and pie diagrams) and may be exported to a variety of formats.
Supported query export formats include tabular representations as text files and
database tables, as well as direct translations to GIS using the following
exchange mechanisms: ArcInfo/ArcView E00, MapInfo MIF, and SPANS TBA
formats. The user can designate which columns to export and can scale the
symbology or alter the coordinate system for each type of format.
Figure B-3a. Query menu.
Figure B-3b. Query results + plot.
Figure B-3c. Query results plotted as symbols, rose and stereo diagrams —
overlain on geological contacts.
132
FieldLog 3 Users Guide
A Brief Description of FieldLog
Coordinate Systems
FieldLog permits ellipsoids, projections, and transformations to be created
and modified. In this way it’s possible to create a personalized catalogue of
coordinate systems. Projections are restricted to variations of the following
basic kinds: geographic, transverse mercator, universal transverse mercator,
lambert conformal conic, double stereographic, and user defined coordinate
systems. Coordinates and map entities can be converted from one projection
to another. Transformations may further be defined to convert coordinates
from a user grid to other grids or orthogonal projections
Distribution
Currently FieldLog is distributed electronically at no cost, on an ‘as is’ basis,
from the following Internet address: http://gis.nrcan.gc.ca. You must
complete a registration form before downloading the software. You can also
purchase a bound version of the users guide and tutorial as a GSC Open File
from the GSC Publications office February 2001. This manual is available,
and will remain available in the future, in electronic formats on the Internet
site. Formal software support is not provided by the GSC, but the author will
respond to questions and comments regarding the software. Short courses on
its use are occasionally presented at scientific meetings and at the GSC.
Bibliography
Bonfati, F. and Monari, P.D.
1995: Conceptual Modelling as a means for organizing geological
information; in Proceedings of the Joint European Conference and
Exhibition on Geographical Information, March 26-31, The Hague, p. 442447.
Brodaric, B.
1992: Geologial Survey of Canada FieldLog v2.83; Geological Survey of
Canada, internal publication, 95 p.
Brodaric, B. and Fyon, J.A.
1989: Ontario Geological Survey FieldLog: a microcomputer-based
methodology to store, process and display map-related data; Ontario
Geological Survey, Open File Report 5709, 73 p.
Broome, J., Brodaric, B., Viljoen, D. and Baril, D.
1993: The NATMAP Digital Geoscience Data-Management System;
Computers and Geosciences, v. 19, no. 10, Pergamon, p. 1501-1516.
Carver, S., Heywood, I., Cornelius, S. and Sear, D.
1995: Evaluating field-based GIS for environmental characterization
Modelling and decision Support; International Journal of Geographic
Information Systems, v. 9, no. 4, p. 475-486.
Currie, A. and Ady, B.
1990: GEOSIS Project: Knowledge Representation and Data Structures for
Geoscience Data in Statistical Applications: Statistical Applications in the
Earth Sciences, (ed.) by Agterberg, F.P. and Bonham-Carter, G.F.,
Geological Survey of Canada, Paper 89-9, p. 111-116.
FieldLog 3 Users Guide
133
Date, C.J.
1990: An Introduction to Database Systems;Volume 1, Fifth Edition, AddisonWesley, New York, New York, 854 p.
Giles, J.R.A.
1995: Geological Data Management; Geological Society Special Publications
97, Geological Society of London, 185 p.
Lenton, P.
1991: Geodata User’s Manual, Manitoba Energy and Mines Field Data Entry
System for Geological Data Recording; Internal Publication, Manitoba Energy
and Mines, 38 p.
Norwegian Geological Survey
1992: GBAS, Et PD-System for lagrig og bruk av berggrunnsgeologiske
feltdata, NGU report 92.230.
Rogers, N. and Brodaric, B.
1996: Spatially linked relational database management of petrology and
geochemistry using FieldLog v3.0: a worked example from the Bathurst mining
camp, New Brunswick; in Current Research, Part E, Geological Survey of
Canada, Geological Survey of Canda, Paper 96-E, p. 255-260.
de Roo, J.A., van Staal, C.R. and Brodaric, B.
1993: Application of FIELDLOG software to structural analysis in the Bathurst
mining camp, New Brunswick; in Current Research, Part D, Geological Survey
of Canada, Paper 93-1D, pp. 83-92.
Rumbaugh, J., Blaha M., Premerlani, W., Eddy, F. and Lorenson, W.
1991: Object-Oriented Modelling and Design; Prentice Hall, Englewood Cliffs,
New Jersey, 500 p.
Ryburn, R.J. , Blewett, R.S., Stuart-Smith, P.G. and Williams, P.R.
1993: Users Guide to the National Geoscience Mapping Accord Field Database;
Australian Geological Survey Organization, Record 1993/049, 54 p.
Schetselaar, E.
1995: Computerized Field-Data Capture and GIS Analysis for Generation of
Cross Sections in 3-D Perspective Views; Computers and Geosciences, v. 21, no.
5, p. 687-701.
Sharma, K.N.M., Gobeil, A., Hebert, C., Lamothe, D. and Lebel, D.
1998: Guide d’utilisation des geofiches; Ministere des ressources naturelles,
Quebec, 30 p.
Struik, L.C., Atrens, A. and Haynes, A.
1991: Handheld computer as a field notebook and its integration with Ontario
Geological Survey’s “FieldLog” program; in Current Research, Part A,
Geological Survey of Canada, Paper 91-1A, p.279-284.
Troop, D.G. and Cherer, R.M.
1991: Development of a Pen-Based Computer System for On-Site Recording of
Geological Field Notes; Summary of Field Work and Other Activities 1991,
Ontario Geological Survey, Miscellaneous Paper 157, p. 126-130.
Ullman, J.D.
1988: Principles of Database and Knowledge-Base Systems;Volume 1,
Computer Science Press, Rockville, Maryland, 631 p.
134
FieldLog 3 Users Guide
Data Models
Data Models
What is a Database?
In its simplest form a database is a collection of data that are related in some
manner. A database management system (DBMS) permits this data to be
stored and manipulated by a computer. The manner in which the data is
conceptually organized, stored, and managed largely depends on the type of
database system being employed: relational database management systems
(RDBMS), today’s most prevalent system, manage data in tables whereas
emerging object-oriented database management systems (OODBMS) use
objects. Network and hierarchical database systems are alternatives that are
less commonly used.
Data Models
Database systems are distinguished by their rules for data organization (their
data model) and by the way these rules are implemented (their data
definition and data manipulation languages). Relational database systems
adhere to the Relational Data Model (Codd 1970), and typically use a
language called SQL (Structured Query Language) to create and manage
databases. SQL exists in two formal versions: SQL’89 (SQL1) and SQL’92
(SQL2). Object-oriented systems are less well defined, but many adhere to
an evolving object model (Cattel 1996) that proposes a syntax for database
definition (ODL) and another for database manipulation (OML): these are
typically implemented in conjunction with existing object-oriented
programming languages such as Java or C++. The emerging SQL3 standard
attempts to bridge the gap between the relational and object worlds by
providing a common database language. However, it’s still in development.
Data Modelling
Modelling is a complex task which attempts to capture the intricacies of realworld situations, including the characteristics of real-world objects, events,
and object-event interrelations. Modelling by its very nature is from a
particular point of view, often a combination of the view of an expert in the
system being described (the earth, wildlife, surface geology...) and an expert
in implementing models on computer systems (databases, forward
modelling,...). Thus the modelling process occurs at many levels of
abstraction for any described situation. In a geological mapping situation the
real world objects modelled typically range widely from the details of
individual observations, to their interconnections, to their synthesis into
explanatory structures.
When the modelling process is intended to produce a data manipulation
framework, the conceptual setting in which it occurs is typically called a data
model. A data model is formally defined as a set of fundamental conceptual
objects and mathematical and logical rules that govern their behaviour. The
rules are usually expressed in terms of how and why objects may exist, and
what interactions are permitted (Codd 1980).
The formal objects and operators of a data model are generally abstract in
nature and form a language in which real world situations may be expressed.
Generally such languages are intended to be mapped into computing
FieldLog 3 Users Guide
135
constructs, easing the transition from the real world to the abstract and finally to
the computer. This process usually requires the identification of key concepts
within a specific real-world domain (as seen through the eyes of an expert) and
an expression of their interactions using the data model’s conceptual objects and
operators. In this sense, a data model may be seen as a tool kit composed of
concepts, operators, and their rules of behaviour, all used to describe some real
world phenomenon for computing purposes. In its most abstract sense a data
model provides the logical framework in which the real world may be described
for computing.
However, there exist many possible levels of examination in this process. At one
level it can be described as a rigorous, abstract notation for describing some real
world domain, and on another level, it can be seen as way of organizing and
manipulating data pertaining to the real world domain at the physical level of the
computer, in terms of bytes, records and files. Any one of these perspectives are
commonly referred to as a type of data model. Hence, the term data model is
often used to describe the product of a modelling process, usually as a database
design for a particular real world domain, as well as the method and rules of
abstraction used to generate such representations of reality. For instance, it isn’t
uncommon to speak of geometric data models or geological data models — these
are each abstractions containing domain-specific concepts and rules that are
widely applicable. In another sense, however, the computing paradigm in which
the models are formed, be it relational, object-oriented, or some other, is also a
data model (of a data model, i.e. a meta-model such as UML) (Rumbaugh et al.
1999) as it describes how the domain models are created and how their
architecture behaves.
In some cases the domain specific model is called a database model (Burrough
1992; Teory 1988) as database design is the ultimate purpose at hand. This notion
of the model being directly expressed as a database design may be attributed to
the seminal work of Codd on relational databases (Codd 1970), which has caused
data modelling to become inextricably linked with database design. As a result,
the relational data model has become the standard example of a data model.
This initial notion of a data model providing both a conceptual framework as
well as a logical mapping into computing constructs has been under review for
some time. Computational driven frameworks, usually expressed in form of an
algebra with mathematical operators, as in the relational model, are seen as being
generally insufficient in expressing many semantic relationships between data.
Because of this, conceptual models use semantically richer, often nonmathematical operators. However, this results in their translation to computing
environments being more complex or impossible to implement with commercial
systems. In fact, semantic models are often generalized to logical models such as
the relational model, which in turn may be implemented with more ease directly
on a computer. The generalization of a domain-specific and operator-rich
semantic model to a logical model is fraught with difficulties.
The semantic-logical split in design leads to the concept of abstract modelling
occurring at two levels, the conceptual and the logical. Each may in fact use a
separate underlying data model for their expression and are in fact quite removed
from the specific details of the computing environment. In addition, the specific
physical configuration of the computing implementation may also be considered,
and this third layer is referred to as a physical model. It’s also often referred to as
136
FieldLog 3 Users Guide
Data Models
a data structure (but also inadvertently as a data model) being a computing
oriented description of some logical data model.
The results of a modelling process must ultimately be applied in a computing
environment, be it spatial (GIS — Geographical Information System) or
non-spatial (RDBMS — Relational Database Systems, Object-Oriented
Database Systems), or both. Before this can occur a model must first
minutely and exactly describe the type and behaviour of the information to
be managed by the database. This process usually involves the undertaking
of requirements analysis and database modelling, resulting in a particular
database design for a given subject area and set of data. Once a design is
formulated it can be initiated within a database system, the resultant database
can be populated with data, and finally, the database becomes useful for
thematic querying. It’s important to design and populate the database for
optimum querying, both in terms of conceptual completeness as well as
performance efficiency. A bad database design can result in slow,
incomplete, or incorrect responses. Database design is generally conducted
in stages consisting of requirements analysis and data modelling. The needs
of a subject area are identified during the requirements analysis and these in
turn lead to the identification of critical concepts, their interactions, and
other implementation criteria, all of which constitute the database model.
Database models are, as discussed, usually described at the three levels of
semantic/conceptual, logical, and physical models (Frank 1992). These are
summarized below.
Conceptual Modelling
Conceptual Modelling strives to depict a real world subject area according to
how the user perceives it. A comprehensive description of the subject area is
constructed by isolating key concepts and by describing their static and
dynamic properties. Static properties represent a concept’s descriptive
characteristics and dynamic properties describe the actions it may undertake,
including its interaction with other concepts. Using a language analogy,
static properties are nouns and dynamic properties are verbs. For instance,
static properties of visible objects are, crudely, observable features while
dynamic properties describe what these features can do, how, and when they
interrelate, and how they react when other properties are changed. In
general, a complete conceptual model for a system approaches being a
complete physical-chemical model of the system, and in many cases is
unobtainable.
There exist many conceptual modelling methods. They vary in the types of
interactions permitted between concepts, and how the concepts are
described. In addition, each method possesses a diagramming technique for
its presentation. All conceptual modelling methods strive to be unaffected by
the type of database to be employed; however, today’s most popular
commercial methods tend to be oriented to one database framework or
another. For instance, Entity-Relationship modelling is oriented to relational
databases. Concepts are called entities, interactions between them are
relationships, and a concept’s compositional characteristic is an attribute.
Object Modelling, on the other hand, refers to concepts as objects, to
interactions as associations, to behaviour as methods, and to an object’s
static characteristics as attributes. Theoretically it’s possible to implement
the various types of conceptual models within any database system, but in
practice it’s often easier to match conceptual model types to specific
FieldLog 3 Users Guide
137
database systems. In effect, commercial implementations of conceptual
diagramming techniques have blurred the boundary between conceptual and
logical models.
Logical Modelling
Unlike conceptual models, logical models tend to refer to a specific type of
database system. They are in this sense a step toward actual implementation.
Whereas a conceptual model describes a real world subject area abstractly, a
logical model refines the conceptual model for use with a specific type of
database system such as the relational or object-oriented systems. A logical
model for a relational system describes the key relational elements: entities,
relations, attributes, primary keys, foreign keys, integrity and referential
constraints, and so on — everything, in fact, required to describe a working
design in the relational paradigm. The analogous object logical model would
describe objects, relationships, attributes, and methods.
A logical model doesn’t describe the details of how the database is to be
physically arranged in the computer, which is the realm of the physical model
and so is somewhat abstract. Logical modelling uses diagramming techniques
similar to conceptual modelling, although with a greater focus on specifics of
database content and arrangement, and so is somewhat removed from the domain
expert’s conceptual model of the system observed.
Physical Modelling
The physical model specifies the details of implementing the logical model in a
specific database type and on a specific computer system. The physical model is
thus concerned with the physical implementation of the logical model. For
instance, attributes are assigned a data type: integer, real, fixed-length character
string, or variable-length character string, and so on. Collections of such
attributes are stored as records. A series of records on the computer is called a
file, while in a relational system a series of records is called a table. The physical
model also usually strives to optimize the performance of the database by
organizing the physical aspects of the implementation in the most favourable
manner. Typically considered is the physical distribution of the database: its
partitioning onto one or more computers, the clustering of certain database
portions, various indexing techniques, and so on. These options are highly
database specific. Often they cause the logical model to be rethought. In fact,
database design is typically a cyclic process where any aspect of the overall
model may be refined based on issues encountered in any of the conceptual,
logical, or physical levels. The cycle is the result of ongoing interaction between
the users of a system, the domain expert(s), the database designer, and the
database manager for the project.
Geographical and Geometric Modelling
Traditional business database systems treat a concept’s properties as discrete
attributes, often grouped in tables (in the relational model) to optimize
performance or query potential, or for other considerations. Spatial data,
however, has the added complication that many attributes aren’t business
concepts (like sales, revenue, or names) but represent physical objects that not
138
FieldLog 3 Users Guide
Data Models
only have physical characteristics (composition, temperature...) but also
have spatial extent. Extent includes such considerations as the semantic basis
of any concept, the nature of its connectivity to other objects and to its
neighbours in space, and the temporal changes that it may undergo.
At the logical and physical levels, real world entities must be represented in
a fashion amenable to flexible and rapid access and analysis, and this places
serious limitations on which conceptual models can be translated into valid
logical models. In GIS, historical efforts concentrated on the logical and
physical models which have led to two alternative and ‘allowable’
conceptual approaches to representing spatial objects — the continuoussurface and the discrete approach. (Goodchild 1992; Frank 1992; Burrough
1992).
In brief, the continuous (i.e. raster) approach models spatial objects by
subdividing space into numerous cells, usually a regular orthogonal grid, and
associating attributes with the cell locations directly. The discrete (i.e.
vector) approach models spatial objects as points, lines, polygons, surfaces,
and enclosed volumes. Attributes are associated with whichever data type
makes the model the most flexible and conceptually clear.
At a more abstract level, many representations of physical objects are a mix
of continuous and discrete models, and as these approach being true
conceptual models they may become difficult or impossible to implement
directly (Frank 1992). In fact, each of the two general approaches can be
described in terms of more abstract stratagems by which spatial reality is
conceptualized. Frank lists several such perspectives (sets of points,
surfaces, euclidean constructions, partitions, cells, graphs, cognitive spaces,
and so on) and notes that they can’t often be implemented directly — they
are effectively conceptual models of geographical reality (Frank 1992).
Their implementation requires finite constraints that give rise to certain
geometric objects and mathematical relationships. For instance, Frank notes
that the partition concept, which embodies the notion of a space segmented
into connected and non-overlapping regions, can be implemented in a
topological data model composed of node and edge primitives. These
primitives respect certain topological relations from which spatial properties
such as adjacency, overlap, and intersection can be calculated. This set of
topological rules and mathematical operators forms the logical framework
for the partition concept.
The various means of actually implementing these rules and operators
constitute a physical model which can also be referred to as data structure.
For example, the TIN (triangular irregular network) structure is an example
of a specific implementation of the partition concept and its logical design.
TINs use a topological data structure consisting of interconnected triangles
of varying size and with shared edges to represent a surface.
Bibliography
Brodie, M.L., Mylopoulos, J. and Schmidt, J.W.
1984: On Conceptual Modelling; Springer-Verlag, New York.
Burrough, P.A.
1992: Are GIS Data Structures Too Simple-Minded?; Computers and
Geosciences, v. 18, no. 4, p.395-400.
FieldLog 3 Users Guide
139
Cattell, R.G.G.
1996: The Object Database Standard; Object Data Management Group (ODMP93), Morgan-Kaufmann, San Francisco, California., 184 p.
Codd, E.F.
1980: Data Models in Database Management; in Proceedings of Workshop on
Data Abstraction, Databases, and Conceptual Modelling, Pingree Park,
Colorado, June 1980.
Date, C.J.
1990: An Introduction to Database Systems;Volume 1, Fifth Edition, AddisonWesley, New York, New York, 854 p.
1995: Relational Database Writings 1991-1994; Addison-Wesley, New York,
New York, 542 p.
Egenhofer, M. and Frank, A.U.
1987: Object-Oriented Databases: Database Requirements for GIS; in
International GIS Symposium, The Research Agenda, Crystal City, Virginia,
November 1987.
Egenhofer, M.
1992: Why not SQL!; International Journal of Geographic Information Systems,
v. 6, no. 2, p. 71-85.
Frank, A.U.
1992: Spatial Concepts, Geometric Data Models, and Geometric Data
Structures; Computers and Geosciences, v. 18, no. 4, p.409-417.
Goodchild, M.F.
1992: Geographical Data Modelling; Computers and Geosciences, v. 18, no. 4,
p.401-408.
Hadzilacos, T. and Tryfona, N.
1996: Logical Data Modelling for Geographical Applications; International
Journal of Geographic Information Systems, v. 10, no. 2, p. 179-203.
Hughes, J.G.
1991: Object-Oriented Databases; Prentice Hall, Englewood Cliffs, New Jersey,
280 p.
Hull, R. and King, R.
1987: Semantic Database Modelling: Survey, Applications and Research
Issues; Associaton for Computing Machinery, Computing Surveys, v. 19, p. 201260.
Mattos, N.M., Meyer-Wegener, K. and Mitschang, B.
1992: Grand Tour of Concepts for Object-Orientation from a Database Point of
View; Data and Knowledge Engineering, North Holland, p. 321-352.
Nyerges, T.L.
1990: Geographic information abstractions: conceptual clarity for geographic
Modelling; Environment and Planning A, v. 23 , no. 10, p. 1387-1536.
Preparata, F.P. and Shamos, M.I.
1985: Computational Geometry, An Introduction; Springer Verlag, New York,
398 p.
140
FieldLog 3 Users Guide
The Relational Data Model
Rapier, J.F. and Maguire, D.J.
1992: Design Models and Functionality in GIS: Computers and
Geosciences; v. 18, no. 4, p. 387-394.
Rumbaugh, J., Blaha M., Premerlani, W., Eddy, F. and Lorenson, W.
1991: Object-Oriented Modelling and Design; Prentice Hall, Englewood
Cliffs, New Jersey, 500 p.
Surveys and Resource Mapping Branch
1995: British Columbia specifications and guidelines for geomatics;
Reference series, volume 1: Spatial archive and interchange Format:
Formal Definition, Release 3.2, Surveys and Resource Mapping Branch,
Province of British Columbia, p. 258.
Teory, T.J.
1988: Database Modelling and Design: The Fundamental Principles;
Second Edition, Morgan Kaufmann, San Francisco, California, 277 p.
Ullman, J.D.
1988: Principles of Database and Knowledge-Base Systems; Volume 1,
Computer Science Press, Rockville, Maryland, 631 p.
The Relational Data Model
Relations
The relational data model is the theoretical backbone of relational databases.
It formally defines the rules which underlie most relational database system
behaviour. These rules are expressed using mathematical concepts borrowed
from set theory. In the relational data model relations are analogous to sets
and are manipulated using the set operators union, intersection, difference,
and product, as well as the additional relational operators select, project,
join, and divide. A relation consists of many tuples and each tuple contains
the same number of attributes. Attributes are usually named and are selected
from a set of possible scalar values, called a domain. Thus it’s possible to
speak of a relation definition consisting of attribute names and their
domains, as well as the relation occurrence which consists of many instances
(tuples) of attribute values. Consider the following relation definitions:
STATION (SITE_ID, X_LOCATION, Y_LOCATION, DATE)
LITHOLOGY (SITE_ID, ROCK_ID, ROCK_TYPE, DESCRIPTION)
For a particular field site, the STATION relation records as attributes an
identifier (SITE_ID), a location (X_LOCATION, Y_LOCATION) and a
date of observation (DATE). Each observed rock type at that station is
enumerated and described in the LITHOLOGY relation with the following
attributes: the site identifier (SITE_ID), the number of the rock type at the
site (ROCK_ID), the rock type name (ROCK_TYPE) and its description
(DESCRIPTION). The domain for SITE_ID and ROCK_ID may be the set
of positive integers 1...n, whereas the domain for rock types may consist of
the set of allowable rock types: “granite”, “basalt”, and so on. A final type of
attribute value which applies to all domains is the NULL value — it signifies
the attribute value is undefined. For instance, a NULL date value in the
FieldLog 3 Users Guide
141
STATION relation indicates the date on which the station was visited is
unknown. The actual relations could resemble the following:
STATION { (1, 100, 100, 06/06/96), (2, 200, 200, 06/06/96) }
LITHOLOGY { (1, 1, “granite”, ““), (1, 2, “dacite”,””), (2, 1, “granite”,””), (2, 2,
“rhyolite”,””) }
Two stations, each containing two lithologies, are described above. Thus the
STATION relation contains two tuples and the LITHOLOGY relation contains
four. The number of tuples is the relation’s cardinality, whereas the number of
attributes in each tuple is its degree.
Tables
In actual database systems, relations are depicted and implemented as tables. A
relation corresponds to a table, a tuple corresponds to a row in the table, and an
attribute corresponds to a column in the table. Note the tabular representation of
the STATION and LITHOLOGY relations in Figure B-4:
STATION:
SITE_ID
X_LOCATION
Y_LOCATION
DATE
1
100
200
06/06/96
2
200
200
06/06/96
LITHOLOGY:
SITE_ID
X_LOCATION
Y_LOCATION
DATE
1
100
200
06/06/96
2
200
200
06/06/96
SITE_ID
ROCK_ID
ROCK_TYPE
DESCRIPTION
1
1
granite
1
2
dacite
2
1
granite
2
2
rhyolite
Figure B-4. The STATION and LITHOLOGY relations as tables.
Domains are often implemented as column constraints by specifying a range of
acceptable values for a column (e.g. 1...n), or by relating a lookup table
containing acceptable terms for the column (“granite”, “dacite”,...,and so on).
Although analogous, tables and relations aren’t equivalent. The order of tuples or
attributes is unimportant to a relation, whereas it does matter to a table. Duplicate
tuples are disallowed, whereas duplicate rows may be permitted in tables, though
strictly speaking it isn’t good practice. When a table is physically stored on a
142
FieldLog 3 Users Guide
The Relational Data Model
computer, it’s often referred to as a file and its components become records
and fields instead of rows and columns, respectively. Most users are typically
confronted with the tabular (i.e. logical) representation of a relational
database system, as the physical and conceptual layers usually remain
hidden. The following is a list of commonly used, loosely equivalent, terms:
RELATIONAL
TABULAR
PHYSICAL
Relation
Table
File
Tuple
Row
Record
Attribute
Column
Field
Implied in the definition of a relation is a sense that the relation embodies a
distinct type of entity, such as a station or a lithology, and that a collection of
such relations constitute a database which is thematically related, such as a
set of geological field observations. A relational database may then consist
of many related tables, each representing some distinct entity type and each
populated with instances of that type. For example, the station table contains
instances of field stations and the lithology table contains observed
lithologies. The totality of the tables forms a database that is thematically
complete. To achieve this, database systems must also provide the means to
define and enforce the relationships between tables, and in this way model
the behaviour between the entity types. For instance, field sites and
lithologies are related in that lithologies are observed at distinct field sites.
Referential integrity constraints are the mechanism by which relational
systems model such, and other, relationships. They require a relation’s
primary and foreign keys to be identified.
Primary Key
Inherent to the sense that a relation embodies a distinct type of entity is the
notion that each tuple within the relation is unique. A field site has its own
identity which can never be shared with another site; likewise a lithology
observation at one site can’t also be a lithology observation at another site
(providing the sites are distinct) — the two observations may be similar, may
even be expressed using identical wording, but nonetheless they are two
distinct occurrences. The relational database model formalizes this concept
by requiring each tuple to contain one or more attributes which in
combination are unique within the relation. Thus relations can never have
duplicate tuples. This unique attribute, or combination of attributes, is called
the primary key. For instance, in the STATION table each field site is
assigned a unique station number called SITE_ID; its uniqueness qualifies it
to be the primary key. Likewise, in the LITHOLOGY table, multiple rock
types may be observed at each site and each rock type is uniquely numbered
within each site. The first rock type at a site is ‘1’ or ‘A’, the second ‘2’ or
‘B’, and so on. The combination of SITE_ID and ROCK_ID therefore form
a distinct combination of attributes for the LITHOLOGY relation, and thus
form its primary key. These types of primary keys are often also called
natural keys, as they are composed of attributes naturally recorded with each
entity. Sometimes it’s necessary to introduce an artificial attribute into the
relation in order to establish a primary key. Consider the STRUCTURE
relation below, which records structural measurements:
FieldLog 3 Users Guide
143
STRUCTURE (SITE_ID, FEATURE, AZIMUTH, DIP_PLUNGE, ROCK_ID)
Like lithologies, structural measurements are recorded at field sites and thus this
relation contains a site identifier (SITE_ID). It also contains a description of the
measurement by documenting its type (FEATURE) and its geometrical
emplacement in terms of its intersection with horizontal (AZIMUTH) and the
vertical (DIP_PLUNGE) planes of the earth’s surface. A lithology identifier
(ROCK_ID) is included in order to indicate the host lithology. It’s quite possible
in this relation to have duplicate tuples, as distinct structural measurements at a
station could have identical attributes:
STRUCTURE { (1, foliation, 200, 20, 1), (1, foliation, 200, 20, 1),...}
A primary key can’t be established for this relation without introducing another,
artificial, attribute to distinguish between structural measurements containing
identical attributes at a site:
STRUCTURE (SITE_ID, STRUCTURE_ID, FEATURE, AZIMUTH,
DIP_PLUNGE, ROCK_ID)
In practice this artificial attribute, STRUCTURE_ID, could be employed as a
counter for the structural measurements at a site, much like ROCK_ID
enumerates the rock types at each station from1...n or A...Z or it could simply be
employed as a global counter of all the structural measurements in the relation,
this in fact being an enumeration of the number of tuples in the relation (or rows
in the table). The decision to use one or the other method is largely dependent on
whether another relation exhibits a existential dependency on STRUCTURE, that
is, on whether another relation requires each structure within a site to be
identified. It’s easier, though arguably less natural, to simply enumerate the
structures within the scope of the whole relation than to enforce enumeration of
the structures within each site. Both options would lead to the establishment of a
proper primary key (shown in boldface below). Enumeration within a site
generates a composite primary key consisting of SITE_ID and
STRUCTURE_ID, whereas enumeration of the tuples in the relation produces a
single primary key of STRUCTURE_ID:
STRUCTURE (SITE_ID, STRUCTURE_ID, FEATURE, AZIMUTH,
DIP_PLUNGE, ROCK_ID) STRUCTURE { (1, 1, foliation, 200, 20, 1), (1, 2,
foliation, 200, 20, 1), (2,1, lineation,300,30,NULL),...}
or
STRUCTURE (SITE_ID, STRUCTURE_ID, FEATURE, AZIMUTH,
DIP_PLUNGE, ROCK_ID) STRUCTURE { (1, 1, foliation, 200, 20, 1), (1, 2,
foliation, 200, 20, 1), (2,3, lineation,300,30,NULL),...}
A primary key in a relation provides what is commonly called object identity — a
means of uniquely identifying each tuple in a relation or row in a table. It
reinforces the implied sense of the relation as a collection of distinguishable,
similarly attributed objects. Because of this, attribute values which form part or
all of the primary key in a tuple may not have a null or blank value, and must
comprise a unique value for each tuple in the relation. A relation may contain
more than one set of attributes which provide object identity — each of the
attribute sets may be called keys, superkeys, or candidate keys. The selection of a
primary key from these is typically arbitrary, unless there are overriding semantic
reasons to prefer one over the other.
144
FieldLog 3 Users Guide
The Relational Data Model
Foreign Key
Primary keys don’t capture any sense of the association between relations —
this is the purview of foreign keys. A foreign key documents how a relation
interacts with another relation, describing its existential dependency on the
other relation. A relation is existentially dependent on another relation if it is
inconceivable for the first relation to exist without the presence in the
database of the second relation. For instance, it would be meaningless to
associate lithology observations or structural measurements to a non-existent
site; field observations are fundamentally dependent on the site at which
they were observed. Removing the site from the database invalidates any
related observations. Field data typically contains other existential
dependencies, such as samples and mineral observations with lithologies and
analyses with samples and therefore also with lithologies.
It’s possible for relations to be associated without being existentially
dependent — they may in fact be simply related. For example, in some
databases most rock samples are collected at well designated field stations,
however, it may also be permissible within this database for a rock sample to
be collected without defining a formal field station.
These rules between relations are called referential integrity constraints.
Referential integrity is inherently included in the foreign key concept. To
maintain referential integrity between tables, a foreign key consists of one or
more attributes that match a primary key in another table.
Foreign keys are necessary because in the relational model a concept is often
distributed amongst more than one relation. For instance, in the examples
above, the field station concept is represented by the totality of the
STATION, LITHOLOGY, and STRUCTURE relations. This fragmentation
generally occurs for two reasons: technically, because it improves database
performance, and conceptually, because the fragment relations also represent
concepts with individual importance. By linking these fragments with
foreign keys the notion of a composite concept — i.e. the field station — is
retained without losing its individual components. In practice the composite
concept often stems from a central relation, and the relations composing the
concept are related via the presence of common attributes which are in fact
foreign keys. For example, each of the STATION, LITHOLOGY, and
STRUCTURE relations contain a station number (SITE_ID) identifying the
site. This station number is the primary key for the STATION relation, but
comprises only part of primary key for the LITHOLOGY or STRUCTURE
relations. Because foreign keys must relate to a primary key, the station
number attributes in the LITHOLOGY and STRUCTURE relations are
foreign keys which relate to the station number primary key of the STATION
relation. This is sensible since the STATION relation is the central relation.
Notice that by this definition foreign key relationships can’t be designated
between the LITHOLOGY and STRUCTURE relations. This rule is enacted
specifically for managing referential integrity between the relations — it
doesn’t prevent LITHOLOGY and STRUCTURE from being related, say, in
a query, but it does prevent them from being existentially dependent. Foreign
keys are initially specified with this goal in mind, as they are declared solely
for clarifying the nature of the existential dependence of the foreign key with
its target relation. This is usually specified in terms of behaviour for
inserting, updating, or deleting tuples from the database. For instance, when
the value of a primary key is modified, should any related foreign key tuples
FieldLog 3 Users Guide
145
also be modified? If a primary key value is deleted should the tuples containing
its foreign key values also be deleted?
Each of these questions may be typically answered by one of four action options:
restricts, cascades, nullifies or defaults. The database operation could thus be
restricted from occurring, it could cascade to the related tables, it could set to
null the foreign keys in the related tables, or it could change the foreign key
values to a pre-determined default value. For instance, altering a station number
value (SITE_ID) in a tuple in the STATION relation could be responded to in one
of the following ways by the related foreign keys:
• If identical station numbers exist in STRUCTURE or LITHOLOGY then the
system prohibits alteration of the station number (restricts)
• If cascades is specified then the matching station numbers in the foreign key
relations are also altered
• If nullifies is specified they are made null
• If a default value such as ‘system’ is specified they are changed to this default
value
Similarly, when a station number is deleted from the STATION table, the options
may specify that the operation is invalid if matching foreign key values exist, that
all matching foreign keys are also deleted, or changed to null or a default value.
SQL handles these options through phrases that are incorporated into the
definition of the relation: on delete cascade, on delete set null, on delete set
default, and on delete restrict; as well as on update cascade, on update set null,
on update set default, and on update restrict. A related, but somewhat different,
constraint considers whether a foreign key can be null, that is, whether it’s
existentially dependent on the primary key. The SQL syntax incorporates the key
words not null for this. For example, the SQL statements for creating the
STATION, LITHOLOGY, and STRUCTURE relations would resemble the
following:
e.g. for STATION (SITE_ID, X_LOCATION, Y_LOCATION, DATE) the
statement is:
create table STATION
(SITE_ID integer not null unique,
X_LOCATION integer,
Y_LOCATION integer,
DATE integer,
primary key (SITE_ID));
e.g. for LITHOLOGY (SITE_ID, ROCK_ID, ROCK_TYPE, DESCRIPTION)
the statement is:
create table LITHOLOGY
(SITE_ID integer not null,
ROCK_ID integer not null,
ROCK_TYPE char (30) not null,
DESCRIPTION char (250),
146
FieldLog 3 Users Guide
The Relational Data Model
primary key (SITE_ID, ROCK_ID),
foreign key (SITE_ID) references STATION (SITE_ID)
on delete cascade on update cascade);
e.g. for STRUCTURE (SITE_ID, STRUCTURE_ID, FEATURE,
AZIMUTH, DIP_PLUNGE, ROCK_ID) the statement would be:
create table STRUCTURE
(SITE_ID integer not null,
STRUC_ID integer not null,
FEATURE char(20) not null,
AZIMUTH integer,
DIP_PLUNGE integer,
ROCK_ID integer,
primary key (SITE_ID, STRUC_ID),
foreign key (SITE_ID) references STATION (SITE_ID)
on delete cascade on update cascade,
foreign key (SITE_ID, ROCK_ID) references LITHOLOGY (SITE_ID,
ROCK_ID)
on delete set null on update cascade);
In this way relational databases bind related concepts and allocate
appropriate behaviour to them.
Normalization
As noted above, decomposing a concept into multiple relations is performed
for both conceptual clarity and efficient database design. More often than not
these two directions coincide, as the theory of effective database design,
called normalization, is founded on the inherent, semantic relationships
within a set of data. In normalization, the relationships between data are
expressed as functional dependencies and they may exist only within one
relation, between attributes of the relation. During normalization, the
functional dependencies within a relation may cause the relation to be
further subdivided (normalized) into two or more derivative relations. An
attribute set (i.e. one or more attributes) is functionally dependent on another
attribute set in the relation if the presence of one set of attribute values in a
tuple always coincides with the presence of the other attribute values. For
instance, in the un-normalized table below, rock class is functionally
dependent on rock type. Whenever ‘granite’ occurs in the rock type column,
‘plutonic’ occurs in the rock class column, or Rock Type-->Rock Class
(Rock Type functionally determines Rock Class). Note that the opposite,
Rock Class-->Rock Type, isn’t true because an instance of ‘plutonic’, for
example, doesn’t necessarily yield ‘granite’, there being more than one type
of ‘plutonic’ rock. Functional dependencies are transitive. For instance, if
Site_id-->Rock Type and Rock_Type-->Rock_Class then Site_id->Rock_Class.
FieldLog 3 Users Guide
147
Un-normalized...
site_id
x
y
rock_type1
rock_class1
rock_type2
rock_class2
1
100
100
granite
plutonic
dacite
volcanic
2
200
100
granite
plutonic
rhyolite
volcanic
table continued...
feature1
feat_class1 azimuth1 dip1 feature2
feat_class2 azimuth2 dip2
foliation
planar
200
20
planar
lineation
linear
300
30
foliation
200
20
Figure B-5. An un-normalized table of field observations at two field sites.
Normalization is prompted by problems maintaining referential integrity within
and between relations. For example, consider the un-normalized table in Figure
B-5. From a design perspective, this table represents a novice’s first attempt at
organizing field data. The columns represent various field observation types and
each row represents the data for a distinct field station. This design is attractive
because it can be maintained in a single spreadsheet, however, it’s problematic in
many ways. To accommodate more than one type of structure or rock type at a
station, multiple columns must be added to the table. Because the number of
observations at a station is unpredictable, the table either needs infinite width or
must be restricted to a fixed number of observations. For instance, the table
above allocates space for two lithologies and two structures. Either option is
problematic. A very wide table means many empty cells, which results in a
bigger databases, degraded database performance, and is difficult to visualize and
thus understand. A narrow table with limited columns, such as the one above,
prevents important data from being included in the database. Furthermore, it can
be semantically ambiguous. For example, are the foliations at station 1 hosted by
the granite, the dacite, or neither? It also faces certain update inefficiencies.
Reclassifying granites to ‘granitic’ requires a traversal of the complete table.
First Normal Form fixes some of these problems.
1st Normal Form
site_id
x
y
1
100
100
1
100
100
2
200
200
2
200
200
rock_id
rock_type
rock_class
struc_id
1
granite
plutonic
1
2
dacite
volcanic
2
1
granite
plutonic
1
2
rhyolite
volcanic
table continued....
feature
feat_class
azimuth
dip
srock_id
foliation
planar
200
20
1
foliation
planar
200
20
1
linear
linear
300
30
Figure B-6. The un-normalized table of Figure B-5 arranged in 1st Normal Form.
148
FieldLog 3 Users Guide
The Relational Data Model
Tables in first normal form (Figure B-6) can’t contain repeating column
types such as rock_type1, rock_type2, and so on. Multiple instances of a
column type, such as rock type, are instead appended as new rows and
common data are repeated in each row. For instance, each separate structural
reading is recorded into a new row containing repeated station information,
such as the station number and its location. The table thus grows in length
instead of in width. This treats the most pressing problem of data loss, as 1st
normal form doesn’t impose limits on the number of data occurrences and
thus permits all relevant data to be recorded. Furthermore, including
identifiers for each lithology and structure at a station allows structures to be
related to lithologies. For example, both foliation measurements at station 1
are hosted by the granite, and the lineation at station 2 isn’t associated with
any specific rock type. However, there is a lot of duplicate data with this
design, which causes performance degradation and introduces several update
and delete complications. For instance, modifying or deleting a station
number or its location would affect several rows, as would re-classifying
‘granites’ to ‘granitic’. Maintaining the relationship between structures and
their host rock types is also complicated — if a rock identifier changes, its
related structure must be updated. Second Normal Form addresses many of
these issues.
2nd Normal Form
site_id
x
y
site_id
rock_id
rock_type
rock_class
1
100
100
1
1
granite
plutonic
1
100
100
1
2
dacite
volcanic
2
200
200
2
1
granite
plutonic
2
200
200
2
2
rhyolite
volcanic
STATION table
LITHOLOGY table
site_id
struc_id
feature
feat_class
azimuth
dip
rock_id
1
1
foliation
planar
200
20
1
1
2
foliation
planar
200
20
1
2
1
lineation
linear
300
30
STRUCTURE table
Figure B-7. The un-normalized table of Figure B-5 arranged in 2nd Normal Form.
In second normal form a single table design can be decomposed into several
tables, based on functional dependencies between its attributes. More
specifically, second normal form tables are in first normal form and every
attribute that isn’t part of the primary key must be functionally dependent on
the primary key. As discussed above, primary keys are one or more attributes
that uniquely identify a row in the table. Consider the 1st Normal Form table
of field observations. It yields the following functional dependencies:
site_id --> x, y
(site_id, rock_id) --> rock_type
(site_id, rock_id) --> rock_class since rock_type --> rock_class
(site_id,struc_id) --> feature, azimuth, dip, rock_id
FieldLog 3 Users Guide
149
(site_id,struc_id) --> feat_class since feature --> feat_class
From these functional dependencies it’s clear that our 1st Normal Form table
should be decomposed into three tables adhering to 2nd Normal Form. This
decomposition is intuitive, as it should be, resulting in tables containing station,
lithology, and structure data. Many of the previous update anomalies are
overcome, largely due to the elimination of much redundant data and the
introduction of foreign keys and referential integrity constraints between the
tables (see the foreign key section above). For instance, deleting a station from
the station table eliminates all lithologies and structures related to that station.
Modifying a station number or rock identifier is also only performed once, with
the changes propagated via foreign keys to any related tables. However, reclassifying granites to ‘granitic’ still requires the complete LITHOLOGY table to
be traversed.
3rd
Normal Form
3rd Normal Form overcomes this problem by disallowing attributes to be
functionally dependent on the primary key via transitivity. In 3 rd Normal Form,
every attribute which doesn’t compose the primary key must be non-transitively
dependent on the primary key. This results in the following dependencies when
applied to the 2nd Normal Form example above:
site_id --> x, y
(site_id, rock_id) --> rock_type
rock_type --> rock_class
(site_id,struc_id) --> feature, azimuth, dip, rock_id
feature --> feat_class
The following tables (Figure B-8) are generated from these dependencies:
3rd Normal Form
site_id
x
y
site_id
rock_id
rock_type
rock_type
rock_class
1
100
100
1
1
granite
granite
plutonic
1
100
100
1
2
dacite
dacite
volcanic
2
200
200
2
1
granite
rhyolite
volcanic
2
200
200
2
2
rhyolite
etc...
STATION table
LITHOLOGY table
ROCK TYPE table
site_id
struc_id
feature
azimuth
dip
rock_id
feature
feat_class
1
1
foliation
200
20
1
foliation
planar
1
2
foliation
200
20
1
lineation
linear
2
1
lineation
300
30
1
etc...
STRUCTURE table
STRUCTURE TYPE table
Figure B-8. The un-normalized table of Figure B-5 arranged in 3rd Normal Form.
150
FieldLog 3 Users Guide
The Relational Data Model
It’s comforting to see that normalization can lead to intuitive designs and
that conceptual notions aren’t necessarily distorted by relational
requirements. There are at least three other normal forms: Boyce-Codd, 4 th,
and 5th. Boyce-Codd is useful when a relation has more than one primary
key, each composed of more than one attribute, with at least one attribute
shared between the keys. If this situation doesn’t occur, Boyce-Codd is
equivalent to 3rd Normal Form. The 4th and 5th Normal Forms address
anomalies arising from dependencies among data that aren’t functional but
are related to multiple occurrences of values in the data and to joined tables.
These last three normal forms are less frequently encountered. Generally,
adherence to 3rd Normal Form suffices for many database designs.
Over-normalization
At times, adherence to normal forms can cause a database design to be
overly decomposed. It’s ultimately the designer (the domain expert) that
must direct the level of normalization, balancing utility against complexity.
For instance, we could include in our LITHOLOGY table an attribute listing
the minerals noted in the rock type (Figure B-9). The one attribute may
contain several mineral names:
site_id
rock_id
rock_type
Minerals
1
1
granite
bi-chl-qtz
1
2
dacite
plag-chl
2
1
granite
2
2
rhyolite
LITHOLOGY table
Figure B-9. A lithology table containing a Minerals field that can host multiple
mineral names.
The functional dependency (site_id, rock_id) --> (rock_type, minerals)
doesn’t argue for segregating minerals into a separate table, though this
could be a valid design decision. The semantic basis for maintaining a single
table argues that each entry under minerals represents a distinct assemblage
and not a composition of separate observations. From the alternate
perspective, where each entry in the minerals column is an individual
observation, as opposed to the totality of the assemblage, it may be wiser to
create a MINERALS table (Figure B-10). In fact, if minerals isn’t
considered an assemblage, then the LITHOLOGY table above would be unnormalized as it would contain repeating values, albeit within a single
column. In that case it should be decomposed:
MINERALS table
site_id
rock_id
rock_type
site_id
rock_id
minerals
percentage
1
1
granite
1
1
biotite
10
1
2
dacite
1
1
chlorite
20
2
1
granite
1
1
quartz
30
2
2
rhyolite
1
2
plagioclase
10
1
2
chlorite
20
LITHOLOGY table
Figure B-10. The Figure B-9 table normalized.
FieldLog 3 Users Guide
151
From this example it’s evident that database design must reflect the semantic
underpinnings of the subject area. In doing so, it’s first necessary to determine
what these semantic concepts are before arranging them into a database schema.
The task of identifying relevant concepts and relations for inclusion in the
database represents another aspect of database design.
Bibliography
Bonham-Carter, G.F.
1994: Geographic Information Systems for Geoscientists: Modelling with GIS;
Pergamon, Tarrytown, New York, p. 43-50.
Codd, E.F.
1970: A Relational Model of Data for Large Shared Data Banks;
Communications of Association for Computing Machines, v. 13, no. 6.
1980: Data Models in Database Management; in Proceedings of Workshop on
Data Abstraction, Databases, and Conceptual Modelling, Pingree Park,
Colorado, June 1980.
Date, C.J.
1986: Relational Database Selected Writings; Addison-Wesley, New York, New
York, 497 p.
1990: An Introduction to Database Systems;Volume 1, Fifth Edition, AddisonWesley, New York, New York, 854 p.
1995: Relational Database Writings 1991-1994; Addison-Wesley, New York,
New York, 542 p.
Egenhofer, M.
1992: Why not SQL!; International Journal of Geographic Information Systems,
v. 6., no. 2, p. 71-85.
Teory, T.J.
1988: Database Modelling and Design: The Fundamental Principles; Second
Edition, Morgan Kaufmann, San Francisco, California, 277 p.
Ullman, J.D.
1988: Principles of Database and Knowledge-Base Systems; Volume 1,
Computer Science Press, Rockville, Maryland, 631 p.
FieldLog’s Database Design
FieldLog’s Database Design
Underlying all FieldLog components and functions is a conceptual data model
that consists of geologic concepts and their rules of interaction. The data model is
an abstraction of the geological mapping process where concepts common to
most geologic mapping activities are identified and their general relationships
defined. In this sense the mapping process is grossly distilled to a series of
commonly performed activities with common objects of observation. FieldLog
provides this basic conceptual structure to the geologist and permits it to be
152
FieldLog 3 Users Guide
FieldLog’s Database Design
implemented by individuals in very different ways by refining and adapting
the concepts into a personalized database definition.
Because FieldLog operates with a relational database, the data model’s
geologic concepts are translated into relational database constructs for data
processing, which constitutes its logical design. Relational databases, and
thus FieldLog, organize data in tables consisting of columns and rows. The
data model is applied to this organization by classifying each table as a
geologic concept (e.g. a site, a sample, an analysis, and so on) from the data
model, and this classification causes the tables to inherit relational properties
governing the database’s behaviour.
In a table, columns represent types of data to be stored and the rows
represent instances of those columns. For instance, a site table may contain
columns containing the locations and site identifiers of field observations.
Every occurrence of a site, with its accompanying identifier and location,
would constitute a new row in the table. FieldLog requires the geologist to
describe a field project as a set of tables containing columns. Each table is
associated with a geologic concept from the data model. Once a table is
registered with the model in this way, its interaction with other tables is
established and thereafter exclusively handled by the data model. For
example, operations required for extracting data from more than one table
(relational joins), and for the inheritance of critical values between tables
during data entry (for referential integrity) are maintained in a manner
transparent to the geologist. For example, critical items such as site
identifiers and sample numbers are propagated to all relevant tables until a
new field site is established. Table types do have basic requirements. A
sample table, for example, must possess columns containing site identifiers
and sample numbers. Each table must also possess a numeric column whose
row value is unique within the table and which acts as the link between the
database and any graphic environment such as CAD or GIS. By insisting on
certain key table elements, FieldLog is able to ensure that critical relational
rules of behaviour are observed — that the database is relatively normalized
(to third normal form) and that referential integrity is at least minimally
maintained.
The conceptual model deals with spatial as well as semantic issues.
Observed data originates from a geographic location which may be a region
(outcrop) or a site (field station). Often these observations are made along a
travelled path which defines a geographic route (traverse). In the course of a
survey, sites and regions are encountered on one or more routes, and sites
may occur within regions. Some observations are further defined by spatial
partition (segment), often vertical, within their site or region of origin — a
stratigraphic section at some field site, or a drill core segment within a drill
hole. Once spatial positioning is accounted for, the relationships between
observed data are semantic in nature as observers are discipline specific.
Geologists observe rock, soil scientists observe soil, and biologists observe
flora or fauna. These themes are generally described in terms of their
composition (compose) or disposition (genesis), all of which may be
sampled. Composition describes a theme’s internal constitution, such as
mineralogy or alteration within rocks, whereas disposition describes the
theme in terms of its setting and the processes leading to its specific, often
physical, configuration. Disposition may be described within a specific
theme type or it may be macroscopic to the theme. For instance, structural
processes display the following characteristic — it’s possible to discuss
FieldLog 3 Users Guide
153
faulting within a rock type at a site, and also to discuss regional scale faulting
which encompasses the site. All of themes (rocks), compositions (minerals), or
dispositions (structures) may be sampled (sample). Samples may further undergo
various analysis (analysis) such as geochemical, geochronological, petrographic,
and so on. Themes, compositions, dispositions, samples, and analyses can be
attributed to any spatial location, whether it’s a site or partition within a site.
Therefore, other than their vertical partitions, stratigraphic sections and drill hole
segments can be described in the same general manner as non-partitioned sites or
regions. This implies that field survey, drill hole, and stratigraphic section data
can coexist within one semantic model, and also within a single database
structure. FieldLog has indeed been often applied in these various situations.
Apart from observational data FieldLog also provides concepts to manage
interpreted information such as geological boundaries (boundary), legends
(legend) and units (unit). These interrelated concepts may further be associated to
the field observations used to deduce them. Thus, reasonably thorough
information about any geologic boundary can be maintained in FieldLog. Each
boundary may be related to more than original field observation, by including the
boundary identifier with the field observation. Successive boundaries may then
in turn be related to a geologic unit, with the inclusion of a unit identifier in the
boundary description. Both units and boundaries may be classified or described
by a legend. The legend label must be included in the boundary or unit
description to achieve this.
In addition to implementing geologic concepts FieldLog also permits
customizable catalogs of geological terms to be created and attached to columns
for data entry purposes and for the maintenance of semantic integrity of
terminology. FieldLog implements such catalogs in two modes — as dictionaries
(diction) and their profiles. A dictionary contains an archive of geological terms.
It also contains a definition for each term, thus ensuring that a record of the
semantic meaning of each term is maintained. A hierarchical arrangement of
some dictionary items is called a profile and it’s the profile which is attached to a
column and presented to the geologist during data entry. Once a profile is
attached, the contents of the column are restricted to items from the profile. It’s
possible to configure the column to accept single or multiple terms from the
attached profile and multiple choices are recorded in their order of selection, so
that terms may be arranged in priority sequence. Profile items may be assigned
an abbreviation for rapid data entry, and may also be assigned custom symbology
for visualization. A dictionary may be associated with many profiles, but a
profile can only draw its items from one dictionary. Profiles permit personalized
and project specific collections and arrangements of geological terms to be
employed, yet also allow standard terminology in the form of dictionaries and
their defined semantics to be defined within projects or agencies. Profiles and
dictionaries can be modified at any time and can contain an unlimited number of
terms. They are invaluable for data entry.
FieldLog furthermore presents two additional general utility tables —references
(reference) and the miscellaneous category of other (other). Any non-dictionary
table may contain a reference number which refers to material residing in a
reference table. A FieldLog database may contain more than one reference table
and it’s up to users to select the appropriate reference table during querying and
other operations. The remaining table category, ‘other’, permits tables to be
incorporated into the model without conforming to FieldLog’s general data
154
FieldLog 3 Users Guide
FieldLog’s Database Design
model. However, FieldLog doesn’t allow these tables to be related to any
other FieldLog table — they become stand-alone tables in the field database.
Thus FieldLog contains 15 primary concepts, which represent the range of
table types manipulated by the system in the relational environment. A
complete list of these types follows. Where the conceptual name differs from
the logical, relational implementation, the logical name is enclosed in
brackets: analysis, sample, composition (compose), disposition (genesis),
theme (rock), partition (segment), site (station), region (outcrop), route
(traverse), boundary, unit, legend, reference, dictionary (diction), and other.
These are discussed in detail below.
Referential Integrity
FieldLog’s logical table types are discussed below. Each table type is briefly
described and relevant primary, foreign, and candidate keys are listed.
Referential integrity constraints aren’t specified, as FieldLog expects these
to be defined within the host database environment. Referential integrity
isn’t specified during table creation in FieldLog as the acceptable syntax
varies from one database system to another. FieldLog does, however,
maintain many intra-table constraints such as attribute uniqueness, null
values, defaulting, and so on., during its operations. Inter-table constraints
such as update and delete actions are respected by FieldLog if specified
within the database environment. For instance, when using an MS-Access
database with FieldLog, referential integrity can be specified within MSAccess and is maintained for all FieldLog operations.
Functional Dependency and 3rd Normal Form
FieldLog’s database model places each table into 3rd Normal Form — in
fact, into Boyce-Codd Normal Form as well — by virtue of its general
logical design. In this design users must select from within each table one or
more attributes to serve as a primary key for the table. They can also select
other attributes from each table and designate them as foreign keys, which
must conform to some pre-defined foreign key options. In effect, FieldLog
provides a relational framework that users may populate with personal
choices. In doing so, every attribute in a table which doesn’t compose the
primary key is functionally, non-transitively dependent on the primary key.
Each table contains a primary key, usually a composite key consisting of
several columns, as well as a candidate key — the unique number — which
is required for linking to maps and other GIS. However, because this
candidate key isn’t composite, Boyce-Codd normalization complications are
avoided and each FieldLog table therefore by definition conforms to 3rd
Normal Form. For example, consider the Sample relation:
SAMPLE (site_id, rock_id, sample_id, sample_type,
sample_description, unique_id)
It can be related, via foreign keys to the station, segment, rock, boundary,
unit, legend, and reference tables. Its primary key can consist of some or all
identifiers from these same tables: station number, segment number, rock
number, and sample number. For example, station 1001, 3rd rock type, 2 nd
sample. The critical functional dependencies for this example are:
(site_id, rock_id, sample_id) --> sample_type, sample_description
FieldLog 3 Users Guide
155
(site_id, rock_id, sample_id) --> unique_id
(unique_id) --> sample_type, sample_description
(unique_id) --> (site_id, rock_id, sample_id)
Clearly, every non-primary key attribute is functionally, non-transitively
dependent on the primary key, and the relation is in 3 rd Normal Form. Each of
FieldLog’s table types adhere to this general structure.
There’s one final element of FieldLog which appears to contradict normalization.
FieldLog allows users to permit multiple entries into a database column,
particularly where a dictionary is attached. At first this seems to contradict the
first rule of normalization. However, from the discussion above, these entries are
semantically viewed as one item — see the minerals example in the
normalization section above.
Geologic Influences and Relations
Finally, in the section below, all observational table types (analysis, sample,
rock...) can be related to boundary and unit tables. This captures the sense that a
field observation may critically determine, or influence, some interpreted entity
such as a contact or unit. Similarly, most table types can be related to some
legend entity, indicating they impacted the existence of that legend entity. For
instance, a map polygon may be classified by a legend unit indicating that the
polygon contributed to the establishment of the legend unit. In addition, every
table type, except ‘other’, may contain a bibliographic reference.
The final possible relation is the grouping construct which associates two or
more rows in a table. A column is specified as the grouping column and common
values in that column, within a station, rock, sample, and so on, are considered a
group by various FieldLog map operations. For instance, a station may contain
many structural measurements, two of which are related — perhaps a lineation
occurring on the plane of a foliation. These could be designated as belonging to a
structural group within the station, thus defining the relation between them.
Indexing
To optimize data access, particularly querying, FieldLog uses indexing
extensively (but only in AutoCAD R12; R13/R14 databases aren’t indexed).
Query operations are dominated by two basic operations: joining tables based on
common attribute values and searching attributes for specific ranges of values.
It’s possible to predetermine indexes for the first of these events since the joining
of tables during query operations, in FieldLog, must be based on the foreign key
relationships between the tables — these are established during the setup phase,
prior to using any table. Thus FieldLog indexes all primary and foreign keys, as
well as the unique number used for linking the database to a map. Predicting
which other attributes in the database need indexing is impossible, as queries are
arbitrary. Therefore FieldLog restricts itself to indexing the key attributes.
FieldLog permits 15 different table types, which result in 11 possible foreign
keys to relate tables: analysis number, sample number, rock number, segment
number, station number, outcrop number, traverse number, boundary number,
unit number, legend number, reference number and unique number. FieldLog
therefore creates an index for the primary key and each foreign key in a table.
156
FieldLog 3 Users Guide
FieldLog’s Database Design
Indexes are named by including the table name as prefix and appending
standard three letter suffixes for the different index types. For instance, a
table named STATI (STATION) may contain outcrop and traverse numbers
as foreign keys linking it to OUTCROP and TRAVERSE table types,
respectively. FieldLog would create four indexes for this table: one for the
primary key (STATIPRI), one for the unique number (STATIUNQ), and two
for the foreign keys (STATIOUT, STATITRV). Note that each FieldLog table
contains minimally two indexes, the first for the primary key and the second
for the unique number. Indexes are named with standard suffixes, depending
on the nature of the key. Because some foreign key attributes are
incorporated into the primary key, and thereby automatically indexed, the
number of indexes possible is less than the total number of foreign keys. For
example, a SAMPLE table type would incorporate station, segment, rock
and sample numbers into its primary key and index these columns once, as a
part of the primary key. A list of the standard index suffixes follows:
primary key:
<table name> + ‘PRI’
unique number:
<table name> + ‘UNQ’
outcrop number:
<table name> + ‘OUT’
traverse number:
<table name> + ‘TRV’
boundary number:
<table name> + ‘BND’
unit number:
<table name> + ‘UNT’
legend number:
<table name> + ‘LEG’
reference number:
<table name> + ‘REF’
One last index type is FieldLog’s ‘memo’ table index. Memo tables are
tables ancillary to main database tables. They store free-format, unlimited
length text which belongs to a column of the main database table. Memo
table names and their index names are identical:
memo:
FieldLog 3 Users Guide
<table name> + ‘MEM’
157
Traverse
Outcrop
*traverse_id
geologist
date
traverse_summary
*outcrop_id
traverse_id
outcrop_summary
Drill Hole Segment
*station_id
*segment_id
start_depth
end_depth
trend
plunge
Lithology
Mineral
*station_id
*segment_id
*theme_id
*mineral_id
sample_id
mineral
min_grainsize
max_grainsize
percentage
describe = ...
Station
*station_id
outcrop_id
traverse_id
easting
northing
elevation
station_type
mapped_unit
station_summary
Mineral List
*station_id
*theme_id
*segment_id
rock_type
texture
color
structure
mineral
assemblage
protolith
comment = ...
Drill Hole
*station_id
easting
northing
summary
Structure
Rock Type List
Structure List
*station_id
*segment_id
*structure_id
theme_id
sample_id
structure_type
azimuth
dip_plunge
Rock Sample
*sample_id
station_id
segment_id
theme_id
sample_type
sampling_reason
description
Thin Section
*sample_id
*thin_id
Biotite
Epidote
Plagioclase
etc...
Geochron
*sample_id
*lab_id
age
plus_error
minus_error
method
etc...
Geochem
*sample_id
*lab_id
SiO2
Al2O3
Fe2O3
etc...
Figure B-11. A skeleton database design for geological field observations and drill hole
observations. The mineral, rock, and structure lists represents catalogs of geological
terminology.
158
FieldLog 3 Users Guide
Annotated Bibliography of GIS
for Geologists
Introduction
This bibliography is a starting point for people interested in reading the literature on GIS and
Geoscience data management. The bibliography lists papers and books of interest to someone who
has collected data in the field and now wants to do something with it. The first section provides a
list of papers and books, with notes on what they are about and why they might be interesting. The
second section contains a list of readings that are recommended based on what you’re trying to
accomplish while learning about these methods. We’ve included some books that are inspirational,
and some books from related fields (especially remote sensing) as related skills are essential in
strong use of GIS.
This list was compiled by Rob Harrap, with suggestions from Boyan Brodaric. It’s by no means
complete, and we would welcome hearing suggestions (or complaints). This list lives on the web at
http://geol.queensu.ca/harrap/robh.html and you should be able to find an updated version there.
WWW References
NADM WebSite: http://www.geology.usgs.gov/dm/
The North American Data Model is an attempt to provide a generic, flexible, and portable data
model for field geology. The current version is based on the semantics of geologic data and on
relational database theory. The NADM web page highlights current versions and ongoing research.
NCGIA Core Curriculum WebSite: http://www.ncgia.ucsb.edu/education/curricula/giscc/
The NCGIA maintains this resource site for teachers needing overview material to extend their
courses on GIS. It provides fairly succinct coverage of most major issues in GIS.
FieldLog 3 Users Guide
159
Core Curriculum in RS WebSite: http://www.research.umbc.edu/~tbenja1/
The RSCC provides an overview of the main ideas in remote sensing, intended
for practitioners who need teaching materials and a review of new topics. Many
figures are included online for download.
Digital Chart of the World WebSite: http://www.maproom.psu.edu/dcw/
The Digital Chart of the World is a reference map of the major features on the
globe. It includes human and natural features in separate GIS themes, at a
nominal scale of 1:1 Million. The Penn State Map Room provides online access
to the DCW in ArcInfo format.
National Geospatial Clearinghouse: http://mapping.usgs.gov/nsdi/
The NSDI provides online access and metadata for a huge variety of global and
local GIS data useful in geologic mapping projects. It is a portal to remote
sensing and GIS catalogues maintained by the USGS.
Papers
Baker, V.L.
1999: Geosemiosis; Bulletin of the Geological Society of America, v. 111, p.
633-645.
An interesting and controversial look at the philosophy of geology, based on the
semiotic approach in cultural studies.
Bishr, Y.
1998: Overcoming the semantic and other barriers to GIS interoperability;
International Journal of Geographical Information Systems, v. 12, p. 299-314.
Interoperability refers to the ability of multiple software systems to share access
to data. In large projects this is a key issue in whether software tools really help
an organization. Many of the issues deal with the semantics of data, as reviewed
in this technical paper.
Brodaric, B. and Fyon, J.A.
1989: OGS FieldLog: A microcomputer-based methodology to store, process and
display map-related data; Ontario Geological Survey Open File Report 5709, 73
p.
An early paper on FieldLog and what it can do. Read it to see how far FieldLog
has progressed.
160
FieldLog 3 Users Guide
Papers
Broome, J., Brodaric, B., Viljoen, D., and Baril, D.
1993: The NATMAP Digital Geoscience Data Management System;
Computers and Geosciences, v. 19, p. 1501-1516.
A team review by staff at the Geological Survey of Canada, this paper
summarizes the data flow and cartographic process at the Survey and points
out key problems in data management in a large organization.
Burrough, P.A.
1992: Are GIS Data Structures Too Simple Minded?; Computers and
Geosciences, v. 18, p. 495-400.
Real world data and GIS data models are not always a good match. Why this
is so and what can be done about it is the topic of this classic paper.
Carver, S., Heywood, I., Cornelius, S., and Sear, D.
1995: Evaluating field-based GIS for environmental characterization:
Modelling and Decision Support; International Journal of Geographical
Information Systems, v. 9, p. 475-486.
A technical look at the use of GIS in environmental evaluations.
Cheng, T. and Molenaar, M.
1999: Objects with Fuzzy Spatial Extent, Photogrammatic Engineering and
Remote Sensing; v. 65, p. 797-801.
Real world objects are not as well delimited or clearly characterized as we
would often like to think when building GIS datasets. Fuzzy logic is one way
to address these issues.
Currie, A. and Ady, B.
1990: GEOSIS Project: Knowledge Representation and Data Structures for
Geoscience Data in Statistical Applications: in Statistical Applications in the
Earth Sciences; (ed.) by Agteberg, F.P. and Bonham-Carter, G.F., Geological
Survey of Canada, Paper 89-9, p.111-116.
A classic early attempt to integrate hierarchical domains, as used in
FieldLog, into GIS projects in the geosciences.
Egenhofer, M.
1992: Why not SQL!; International Journal of Geographic Information
Systems, v. 6, p. 71-85.
The underlying data language used to express queries in a GIS places real
limitations on what can be done. This quite technical paper addresses SQL,
the standard database query language, and its limitations.
Frank, A.U.
1992: Spatial Concepts, Geometric Data Models, and Geometric Data
Structures; Computers and Geosciences, v. 18, p. 409-417.
A thorough review of data models as used in GIS, with an excellent
reference list attached.
FieldLog 3 Users Guide
161
Frodeman, R.L.
1996: Envisioning the Outcrop; Journal of Geoscience Education, v. 44, p. 417427.
A review of the philosophical issues in field data collection, from a philosopher
who went back to school to study geology.
Gahegan, M.
1997: The Visualization of Relationships Between Geographic Datasets;
Proceedings of Geocomputation 1997 and SIRC 1997, p. 335-343.
This paper presents an attempt to look at the complex relationships in geographic
data using visualization tools in 2d and 3d. Although fairly academic, the kinds
of approaches here will show up in the next generation of GIS tools on the
market.
Goodchild, M.F.
1992: Geographic Data Modelling; Computers and Geosciences, v. 18, p. 401408.
We don’t only collect data, we then do something with it. The analysis that
follows data collection is the topic of this paper.
Krige, D.G.
1999: Essential basic concepts in mining geostatistics and their links with
geology and classical statistics; South African Journal of Geology, v. 102, p.147151.
A review of the concepts of geostatistics including comments on validation and
biases. Geostatistical tools are key requirements in effectively using sampled
data such as geochemical and geophysical measurements.
Laxton, J.L. and Becken, K.
1996: The design and implementation of a spatial database for the production of
geological maps; Computers and Geosciences, v. 22, p. 723-33.
A review of the attempts at the British Geologic Survey to build a system for
constructing and disseminating geologic maps. Examines the issues in digitizing
and cartography in detail.
Milne, P., Milton, S., and Smith, J.L.
1993: Geographical Object-Oriented Databases – A Case Study; International
Journal of Geographic Information Systems, v. 7, p. 39-55.
Object oriented databases offer particular strengths to geological work. This
early technical paper on OODBMS in GIS sets the stage for current research.
Newell, R.G., Theriault, D., and Easterfield, M.
1992: Temporal GIS – Modelling the Evolution of Spatial Data in Time;
Computers and Geosciences, v. 18, p. 427-33.
Handling time in a GIS is tricky, and this paper looks at some of the key
problems.
162
FieldLog 3 Users Guide
Books
Nyerges, T.L.
1991: Geographic Information Abstractions: Conceptual Clarity for
Geographic Modelling; Environment and Planning A, v. 23, p.1483-1499.
This paper discusses the issue of abstraction in GIS, including classification,
generalization, and aggregation issues. It delves into the philosophy of GIS
modelling, including temporal models and the nature of geographic reality.
Raper, J.F. and Maguire, D.J.
1992: Design Models and Functionality in GIS; Computers and
Geosciences, v. 18, p. 387-394.
How we organize projects and databases, and what functionality is built into
software systems, is the topic of this review paper.
Schetselaar, E.
1995: Computerized Field-Data Capture and GIS Analysis for Generation of
Cross Sections in 3-D Perspective Views; Computers and Geosciences, v.
21, p. 687-701.
An overview of the construction of geologic sections from field data,
including data collected with systems like FieldLog.
Webster, T.L., Murphy, J.B., and Barr, S.B.
1998: Anatomy of a terrane boundary: an integrated structural, geographic
information system, and remote sensing study of the late Paleozoic AvalonMeguma terrane boundary, mainland Nova Scotia, Canada; Canadian
Journal of Earth Science, v. 35, p. 787-801.
A good example of the kind of large-scale thinking that can be done with
GIS and remote sensing. Excellent examples of visualization output from a
GIS.
Books
Most of these are texts (we’ve indicated those that are research volumes in
the notes) and are in general more readable than the papers. On the other
hand, with the exception of Bonham-Carter’s excellent text, these are for the
most part geographic and computer oriented rather than addressing concepts
of direct interest to geological applications.
GIS
Longley, P.A., Brooks, S.M., McDonnell, R., and Macmillan, W.
1998: Geocomputation; John Wiley and Sons, New York, New York, ISBN
0-471-98575-9, 278 p.
[Research Level Book] A collection of papers on computation with
geospatial data. Not specifically geological, and transcends GIS to talk about
spatial data in general. Interesting as a view on what the current research
directions in spatial computing are.
FieldLog 3 Users Guide
163
Borrough, P.A. and McDonnell, R.A.
1998: Principles of Geographical Information Systems; Oxford University Press,
ISBN 0-19-823365-5.
A very solid introduction to GIS and some aspects of spatial statistics. Key
features are a solid treatment of error analysis, fuzzy set approaches to GIS, and a
detailed overview of interpolation techniques.
Laurini, R. and Thompson, D.
1992: Fundamentals of Spatial Information Systems; Academic Press, ISBN 012-438380-7, 680 p.
[Research Level Book] Everything you never wanted to know about the internal
workings of GIS, including both advanced raster techniques and vector
techniques. This is not a book about USING GIS, as much as a book about how
the GIS works. A good book for finding out what is going on behind the scenes.
MacEachren, A.M.
1995: How Maps Work: Representation, Visualization, and Design; Guilford
Press, ISBN 0-89862-589-0
[Research Level Book] This book is as much about how we see maps as it is
about how maps are physically made, whether by computer or hand. While it
won’t directly teach you about GIS data structures and such, it will make your
maps much clearer. Unique and very challenging due to the breadth of issues
covered, from neural aspects of perception to map symbolization to GIS.
Monmonier, M.
1991: How To Lie With Maps; University of Chicago Press, Chicago, Illinois,
ISBN 0-226-53415-4.
A very readable guide to intellectual self defence in map interpretation and
analysis. Not specifically a GIS book, but a key guide to understanding how
maps may be used to mislead.
Peuquet, D.J. and Marble, D.F.
1990: Introductory Readings in Geographic Information Systems; Taylor and
Francis, ISBN 0-85066-856-5.
A collection of wide ranging references on GIS, divided into background,
practical applications, and more theoretical design and evaluation sections. The
practical applications section is somewhat dated, but the other sections are still
classics in the fundamentals of GIS. The book is similar to a textbook in scope,
but in self-contained paper form.
Jones, C.
1997: Geographical Information Systems and Computer Cartography; Longman.
ISBN 0-582-04439-1.
A wonderful, compact, overview of all aspects of GIS and cartographic systems,
ranging from the basic to the very advanced. Readable, useable, accessible.
Limited number of color plates keeps the price down, but limits what can be
shown in remote sensing sections.
164
FieldLog 3 Users Guide
Books
MacEachren, A.M.
1994: SOME Truth with Maps: A Primer on Symbolization and Design;
Association of American Geographers, ISBN 0-89291-214-6 (order from
AAG, 1710 16th St. Washington, D.C.20009-31980.
A classic, small, readable introduction to making presentable and accurate
maps using GIS. Much of the material is adapted from traditional
cartography, but in a way that highlights how GIS tools fit in. This is a 'howto', not a theory book (see instead MacEachren's How Maps Work) nor a
case study book (see instead Tufte's Envisioning Information).
Vincent, R.K.
1997: Fundamentals of Geological and Environmental Remote Sensing;
Prentice-Hall, 0-13-348780-6.
[Research Level Book] By the time you get to the midpoint of this book, you
will know more about the physics and engineering of remote sensing
systems than you thought possible. And then come the case studies, which
illustrate the application of multiband remote sensing data to geological
exploration (kimberlite, precious and base metals, and oil) and
environmental monitoring. Very good, reasonably complete, affordable onestop-shopping for a remote sensing book.
Unwin, David.
1981: Introductory Spatial Analysis; Methuen, ISBN 0-416-72200-8, 212 p.
A mathematical treatment of map relationships, but quite accessible and
relatively inexpensive.
Geology Specific
Agterberg, F.P. and Bonham-Carter, G.F.
1989: Statistical Applications in the Earth Sciences; Geological Survey of
Canada Paper 89-9, ISBN 0-660-13592-2, 588 p.
This volume is as much about geostatistics as it is about GIS itself. A good
collection of papers to look through if you are interested in the full range of
spatial techniques from GIS to geophysical image interpretation to
geostatistics.
Bonham-Carter, G.F.
1994: Geographic Information Systems for Geoscientists: Modelling with
GIS; Pergamon, Tarrytown, New York, ISBN 0-08—42420-1, 398 p.
This is the only real GIS book that focuses on geoscience issues. It gets into
the math very quickly, and focuses on modelling to find ore deposits, but the
introductory material is also good. This book is well suited to be a ‘second’
book on GIS – in other words, read after you have read an introductory book
on GIS (such as Jones’ book, for example).
FieldLog 3 Users Guide
165
De Paor, D.G.
1996: Structural Geology and Personal Computers; Elsevier, ISBN 0-08-0431100.
A collection of papers covering a wide range of data collection, presentation, and
analysis topics. Particularly useful for structural geologists, but also a good
overview of communications/hypermedia efforts and mapping tools.
Drury, S.
1993: Image Interpretation in Geology; Chapman and Hall, London.
Sooner or later you will need to integrate airphoto information or perhaps even
remote sensing data into your work. Drury provides a clear overview of geologic
features as they manifest in imagery.
Gunther, O.
1998: Environmental Information Systems; Springer-Verlag, ISBN 3-540-60926.
A very interesting but very odd book. Gunther sets out to lay a framework for
systems that manage environmental data, and really doesn't pull it off. The
interesting thing is that the book is still quite useful. There is too little GIS for
this to be a GIS book, and the rest covers subjects as diverse as object oriented
database systems and modelling, metadata management systems, and the
semantics of environmental data. All of the sections are clear, informative, and
useful, but somehow they just don't seem to add up to a book with the title
Environmental Information Systems.
Koch, G.S. Jr. and Link, R.F.
1971: Statistical Analysis of Geological Data; Dover, New York, New York,
ISBN 0-486-64040-X, 438 p.
A thorough, somewhat mathematical treatment of all aspects of geologic
statistics. Not particularly accessible, but complete. The section on geological
statistics on computers is amusingly dated.
Computer Science, Mathematics, and Philosophy
Adriaans, P. and Zantinge, D.
1996: Data Mining; Addison Wesley Longman, Harlow, U.K., ISBN 0-20140380-3, 159 p.
Data mining is the task of finding relationships in very large databases. Many of
the methods are similar if not identical to those used in mainstream GIS, and in
fact there is an increasing convergence between the three fields of machine
learning, GIS, and data mining. This book is a short and readable introduction to
the core concepts of data mining, many of which can be directly used in GIS
analysis.
Ahl, V. and Allen, T.F.H.
1996: Hierarchy Theory: A Vision, Vocabulary and Epistemology; Columbia
University Press, ISBN 0-231-08481-1.
A wonderful, to-the-point look at hierarchical systems, their role in science, and
their behaviour. To me, this rates with Kuhn’s Structure of Scientific Revolutions
166
FieldLog 3 Users Guide
Books
for laying very general and overarching rules for how human understanding in science
works.
Brooks, F.
1995: The mythical man month, Anniversary Edition; Addison Wesley, ISBN
0201835959, 336 p.
If you are ‘doing’ computer work, as opposed to thinking about it, this book is an
essential read. Brooks discusses the art of running a software development team, and
dispels many notions that at first seem like common sense but in fact are incorrect – like
the common assumption that adding programmers to a team will speed up development.
Although there are newer books on this subject, this one cuts to the core, is readable,
and doesn’t wander off into jargon and businesspeak.
Cleveland, W.S.
1993: Visualizing Data; Hobart Press, Summit, New Jersey, ISBN 0-9634884-0-6, 360
p.
A statistical graphics book that lays out standards of good statistics and design.
Statistical graphics are very common in GIS, and statistical arguments are at the core of
many research applications of GIS in the geosciences.
Date, C.J.
1995: An Introduction To Database Systems, Sixth Edition; Addison-Wesley, Reading,
Massachusetts, ISBN 0-201-54329-X, 839 p.
[Research Level Book]. The classic reference on relational database theory, design, and
applications. Definitely not a light read! Probably not a good ‘first book’ on databases
but definitive.
Foley, J.D., Van Dam, A., Feiner, S.K., and Hughes, J.F.
1990: Computer Graphics: Principles and Practice, Second Edition; Addison-Wesley,
ISBN 0-201-12110-7.
[Research Level Book] A classic, encyclopedic reference on theoretical and practical
issues in photorealistic computer graphics. The book is very clearly written, and
explains all of the fundamental concepts and methods that GIS systems exploit. The
overall aim of this book is more towards realistic scene building rather than interactive
graphics, but the overall coverage is so good that the book remains a very good
reference.
Huff, P.
1954: How to Lie with Statistics; Norton and Company.
The classic reference to the deliberate and accidental lies that statistics can generate.
Very short and readable, and a good companion to Monmonier’s follow-up, How to Lie
with Maps.
Norman, D.A.
1993: Things That Make Us Smart: Defending Human Attributes in the Age of the
Machine; Addison-Wesley, ISBN 0-201-58129-9.
Norman is one of the parents of the Cognitive revolution in psychology, and a very clear
writer on how information and structure in the real world interacts with the mind to
FieldLog 3 Users Guide
167
produce confusion and chaos. What a tool is, and what data is, requires an
understanding of what humans are and are not, and what limitations they have. A
glorious book.
Phillips, J.L.
2000: How To Think About Statistics, Sixth Edition; W.H. Freeman & Company,
New York, New York, ISBN 0-7167-3654-3, 202 p.
Statistics is at the core of GIS analysis and this is a good introduction to the
fundamental ideas of statistics. The treatment is highly descriptive, and the
reasoning aspect is emphasized.
Rumbaugh, J., Blaha, M., Premerlani, W., Eddy, F., and Lorenson, W.
1991: Object Oriented Modelling and Design; Prentice Hall, Englewood Cliffs,
New Jersey, ISBN 0-13-629841-9, 500 p.
[Research Level Book] A very good, detailed introduction to object modelling and
design, both for those doing object-oriented programming and for those working
with object databases. Technically challenging, but an important foundation for
serious programmers and designers.
Sowa, J.F.
2000: Knowledge Representation: Logical, Philosophical, and Computational
Foundations; Brooks/Cole, Pacific Grove, California, ISBN 0-534-94965-7, 593 p.
[Research Level Book] Knowledge Representation is the subset of Artificial
Intelligence research that deals with how we can store, visualize, and manipulate
representations of real world knowledge in a computer. The object oriented
programming movement is a direct result, for example, of research on knowledge
representation in simulation languages carried out in the 1960s. This book is a
thorough introduction to the history and methods of knowledge representation,
especially to graph based methods. A very difficult read, but essential for those
interested in the philosophical underpinnings of data modelling, reasoning, and
advanced analysis.
Stefik. M.
1995: Introduction to Knowledge Systems; Morgan Kaufmann, San Francisco,
California, ISB-155860-166X.
[Research Level Book] An exhaustive, clear, and essential guide to representing
knowledge in any form, and in particular, to representing knowledge using
computer systems. The coverage of symbol systems, representation, and semantics
are the best I’ve read, and the well-reasoned examples illustrate the technical
material very well. Knowledge Systems are to GIS’ what GIS is to CAD - the next
evolutionary step, and the challenge of building a meaningful geoscience
information system, as opposed to a confused one, is well aided by books such as
this one.
168
FieldLog 3 Users Guide
Books
Teory, T.J.
1988; Database Modelling and Design: The Fundamental Principles, Second
Edition; Morgan Kaufmann, San Francisco, California, 277 p.
[Research Level Book] A solid reference on database modelling methods,
for those who do this regularly and need to know the details.
Graphic Design
Tufte, E.R.
1990: Envisioning Information; Graphics Press, Cheshire, Connecticut.
This book is an absolute classic, and perhaps the most cited book in graphic
design and cartography of the last decade. Using hundreds of examples from
past centuries, Tufte covers all aspects of making clear and informative
graphics and maps.
Tufte, E.R.
1983: The Visual Display of Quantitative Information; Graphics Press,
Cheshire, Connecticut.
Tufte’s first book is not strictly about spatial graphics, but it is a classic in
illustrating techniques for making graphs and charts clear and informative.
Tufte, E.R.
1996: Visual Explanations; Graphics Press, Cheshire, Connecticut.
Tufte’s latest book, and most ambitious, is an attempt to look at what defines
understandability in information graphics. A source of inspiration for
thematic diagrams more than a directly applicable book on cartography or
map design, the book is beautifully laid out and written.
FieldLog 3 Users Guide
169
170
FieldLog 3 Users Guide