1
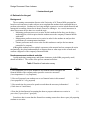
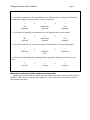
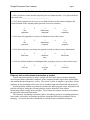
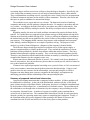
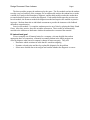
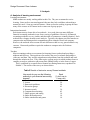
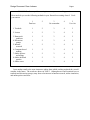
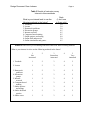
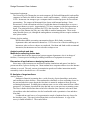
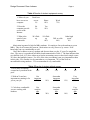
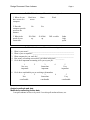
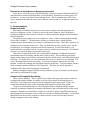
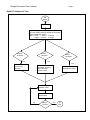
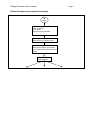
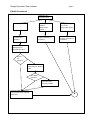
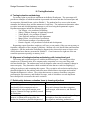
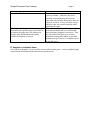
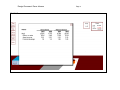
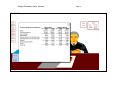
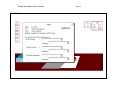
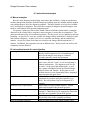
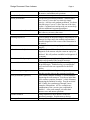
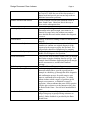
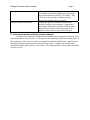
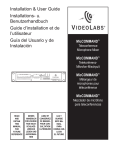
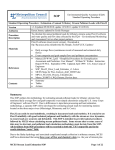
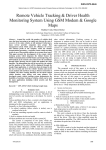
Design Document: Dave Johnson Design Document Financial Ratios Class David Johnson Page 1 Design Document: Dave Johnson Page 2 Table of contents I Instructional goal.................................................................3 II Analysis .............................................................................8 III Testing/evaluation...........................................................19 IV Instructional strategies....................................................24 V Implementation and evaluation strategies .......................28 Design Document: Dave Johnson Page 3 I. Instructional goal A. Rationale for the goal Background The accounting concentration director at the University of St Thomas MBA program has heard several instructors in other subject areas complain that students don't understand how to perform ratio analysis. Students are receiving multiple exposures to ratios in both financial and managerial accounting classes but it doesn't seem to be sinking in. As a result, instructors in other classes must devote time to re-teach the topic. Marketing professors must review ratios for their students before they can develop a marketing plan, which requires that the students assess the company's financial health with ratios. Management professors must review ratios in order for the students to analyze their performance in a management simulation. Finance professors must review ratios for their students to analyze the investment potential of a company. Although the students receive multiple exposures to the material and can compute the ratios mechanically, they don't understand how to interpret them or what steps to take to make and confirm a diagnosis of the company's financial health. Needs assessment methods and data I poled marketing, management, and finance instructors in the MBA program by email, shown in Exhibit 1. The results of the poll are summarized below: Table 1 Results of instructor survey Question 1. How important it is for your students to use financial ratios to diagnose the financial health of the company and to prescribe corrective measures? (1 not important to 5 very important) Rank 4.5 2. How well prepared your students are to use financial ratios in this manner? (1 not prepared to 5 very prepared) 2.0 3. How much time do you need to spend to teach them the necessary information? (1 little time to 5 much time) 4.0 4. Rate the job that financial accounting has done to prepare students to use ratios in your class. (1 poor job to 5 good job) 1.9 From these data it seems that the financial accounting courses have done a poor job preparing students to use ratios. Design Document: Dave Johnson Page 4 Exhibit 1 Email to finance, management, marketing, and managerial accounting instructors 1. Circle how important is it for your students to use financial ratios to diagnose the financial health of the company and to prescribe corrective measures? 1 Not important 2 3 Moderately important 4 5 Very important 2. Circle how well prepared your students are to use financial ratios in this manner. 1 Not prepared 2 3 Moderately prepared 4 5 Very prepared 3. Circle how much time do you need to spend to teach them the necessary information? 1 Little time 2 3 Moderate time 4 5 Much time 4. Circle the job that financial accounting has done to prepare students to use ratios in your class. 1 Poor job 2 3 Average 4 5 Good job Methods for collecting further needs assessment data I plan to pole students who have taken my class within the last three years by email, shown in Exhibit 2. I have kept my students' email addresses. I will use this data to corroborate with the data from the instructors. Design Document: Dave Johnson Page 5 Exhibit 2 Email to former financial accounting students 1. Have you taken a course that has required you to use financial ratios? If so, please indicate the course title_______________________________ 2. Circle how important was it for you to use financial ratios in this course to diagnose the financial health of the company and to prescribe corrective measures? 1 Not important 2 3 Moderately important 4 5 Very important 3. Circle how well prepared you were to use financial ratios in this course. 1 Not prepared 2 3 Moderately prepared 4 5 Very prepared 4. Circle how much time your instructor required to teach you the necessary information? 1 Little time 2 3 Moderate time 4 5 Much time 5. Circle the job that financial accounting has done to prepare you to use ratios in this course. 1 Poor job 2 3 Average job 4 5 Good job Evidence that an instructional intervention is needed Despite repeated exposures to ratios, students still don't know how to interpret what they mean and use them to formulate a diagnosis of the company's health, dig for more detailed data, and confirm that their diagnosis is correct. The reason is ratios are taught as a procedure with an emphasis on the calculations of the ratio, not as a problem with related main and sub-principles. Another problem with the way instructors teach in the MBA program is they frequently teach problem solving by stating the relevant principles in their declarative form without demonstrating how to apply those principles. They assume the learners can select and combine the principles without any instruction. The American Accounting Association (AAA), the industry group for accounting professors, has recently criticized the accounting curriculum, saying that it has serious problems with its pedagogy. So serious, that it has contributed to a steady decline of students seeking an Design Document: Dave Johnson Page 6 accounting degree and has caused some colleges to drop the degree altogether. Specifically, the AAA charges that accounting courses rely too much on memorization, lecture, and textbooks. They recommend that accounting courses, especially the course I teach, focus less on preparation of financial statements and more on the analysis of those statements. Therefore, this course and this topic are perfect candidates for instructional design. The textbooks are too vague and not very relevant. The homework consists of made-up companies and mostly asks the student to compute the ratios. It's taught as a procedure and isn't very realistic. According to the Ruth Clark article, procedures are good for near transfer. But students are having difficulty making far transfer, the ability to interpret ratios in unfamiliar settings. Regarding transfer, the more and varied problems encountered in practice the better the far transfer. So a guided discovery approach seems a better strategy to build problem-solving skills. Students at present lack problem solving skills. To solve a problem in unfamiliar circumstances, the student must map the current problem to the critical features of the problem schema in longterm memory. This mapping should contain a deep structure with meaningful and conceptual links. Making a medical diagnosis is an example of problem solving. The purpose of ratio analysis is to make a financial diagnosis, a diagnosis of the company's financial health. The difference between and expert and novice problem solvers is that experts employ a pattern recognition ability to identify problem types. They can link the similarities of current problems to other problems by abstract deep structure rather than surface features. They have chunked related principles together in memory. They can develop solution hypotheses quickly. Therefore, ratio instruction should establish the schemas in memory by rehearsing with concrete examples that illustrate why the company's ratios vary. Experts must devote thousands of hours of practice. We certainly can't devote hundreds of hours to ratio analysis, but can provide more practice than we current provide, which is limited to two or three homework problems. If learners have acquired prerequisite knowledge over a period of time, or if its' not structured in the correct manner, instruction must help them restructure their knowledge. Using a visual model to show the new structure for the relationships, concepts and principles is effective. Diagrams can make things more concrete, reorganize the knowledge, and emphasize the underlying generalities and the relationships of the concepts and principles. Summary of proposed instructional intervention I propose developing instruction that is comprised of three modules. All three modules will be conducted in a classroom. At the end of the third module, students will play a Web-based game I plan to develop called Ratio Sleuth. In the game, the player is a financial consultant hired by the president of SensorDyne, Inc., a manufacturer of electronic sensors. The president needs the consultant to sort through ratios to determine why the company is not performing as well as its competitor, National Sensor. A number of reports are available to the consultant but at various levels of detail and cost. The consultant bills SensorDyne $10,000 for each game but is charged a penalty for requesting unnecessary reports or surpassing time limitations. Finally, if the consultant makes the incorrect diagnosis when reporting to the Board of Directors, the consultant loses the $10,000 and suffers a loss due to any report or time penalties. Design Document: Dave Johnson Page 7 The three modules prepare the student to play the game. The first module teaches the student to make a top level analysis of the company, the second module teaches the student how to make a middle level analysis and formulate a diagnosis, and the third module teaches the student how to consult detailed reports to confirm the diagnosis. Each module builds upon the previous one. In each module, the instructor models the diagnosis method and requires the students to practice in groups. Students then take an individual assessment to provide the instructor with feedback about their comprehension. Once in-class module 3 is complete, students practice out of class by playing the Ratio Sleuth Game. After they practice, they take an online assessment. Their results are automatically emailed to the instructor to determine whether the students have mastered the material. B. Instructional goal Given a complete set of financial ratios for a company, relevant detailed data, and an appropriate basis of comparison, a financial accounting student in the MBA program can correctly diagnose what caused a company's change in return on equity. They will Determine which variations in ratios that are worth investigating Examine selected ratios and develop a plausible diagnosis for the problem Select more detailed data to investigate and confirm whether the diagnosis is correct Design Document: Dave Johnson Page 8 II. Analysis A. Analysis of learning environment Learning environment MBA students are mostly working adults in their 30s. They are accustomed to active learning. Some prefer a structured approach because they lack confidence when taking a numerical course. Some are anxious learners. Most are used to working in groups because many of the courses at St Thomas involve some sort of group project. Instructional materials Each instructor may choose his or her textbook. As a result, there are many different financial accounting textbooks in use from a variety of publishers. However, all financial accounting textbooks are very similar, and their table of contents are virtually identical. Each textbook has a chapter devoted to ratio analysis. Typically, the chapter provides formulas to compute ratios and illustrates their computation with an example from a real company. However, the textbook offers reasons for ratio differences that are very general and not very concrete. Homework problems require the students to compute ratios for fictitious companies. Teachers Most accounting teachers are accustomed to lecturing from a textbook and providing a midterm and final test. Their preference for media is the use of overheads and perhaps a video now and then. They usually assign homework problems from the textbook and work through the solution in class. They often require a group project in which students choose a company to analyze with ratios and present their findings orally or in the form of a paper. This is confirmed by an email sent to financial accounting instructors, reproduced in Exhibit 3. The results of the survey are shown below: Table 2 Results of instructor survey Present methods How much do you use the following methods in your financial accounting classes? 1. Textbook 2. Lecture 3. Homework problems 4. Discussion groups 5. Internet research 6. Computer-based training 7. Online quizzes and testing 8. Online drill and practice 9. Online simulations and games Rank (1 don't use to 5 use a lot) 5.0 5.0 5.0 4.5 3.0 0.5 1.0 1.0 1.0 Design Document: Dave Johnson Page 9 Exhibit 3 Email survey of accounting instructors present teaching practice How much do you use the following methods in your financial accounting classes? Circle your answer 1 Don't use 2 3 Use somewhat 4 5 Use a lot 1. Textbook 1 2 3 4 5 2. Lecture 1 2 3 4 5 3. Homework problems 4. Discussion groups 5. Internet research 6. Computer-based training 7. Online quizzes and testing 8. Online drill and practice 9. Online cases 1 2 3 4 5 1 2 3 4 5 1 2 3 4 5 1 2 3 4 5 1 2 3 4 5 1 2 3 4 5 1 2 3 4 5 I sent another email to the same instructors asking them which teaching methods they would consider in the future. The results are shown in Table 3. Although most would continue to use a textbook and discussion groups, many showed an interest in Internet research, online simulation, and online quizzes and tests. Design Document: Dave Johnson Page 10 Table 3 Results of instructor survey Interest in future methods Rank (1 don't use to 5 use a lot) 5.0 3.0 2.0 4.5 4.5 0.5 4.0 3.0 4.5 What is your interest level to use the following methods in the future? 1. Textbook 2. Lecture 3. Homework problems 4. Discussion groups 5. Internet research 6. Computer-based training 7. Online quizzes and testing 8. Online drill and practice 9. Online simulations and games Exhibit 4 Email survey of accounting instructors interest in future teaching methods What is your interest level to use the following methods in the future? 1 Not interested 2 3 Somewhat interested 4 5 Very interested 1. Textbook 1 2 3 4 5 2. Lecture 1 2 3 4 5 3. Homework problems 4. Discussion groups 5. Internet research 6. Computer-based training 7. Online quizzes and testing 8. Online drill and practice 9. Online cases 1 2 3 4 5 1 2 3 4 5 1 2 3 4 5 1 2 3 4 5 1 2 3 4 5 1 2 3 4 5 1 2 3 4 5 Design Document: Dave Johnson Page 11 Instructional equipment The University of St Thomas has two main campuses (St Paul and Minneapolis) and satellite campuses in Chaska, the Mall of America, Anoka, and Owatanna, . All have overheads and VCRs. Instructors can arrange to get a computer and/or overhead projector for PowerPoint presentations. The campus in Minneapolis has classes with Internet hookups. From discussions I've had with student advisors, I'm told that almost all students have access to a computer at home or at work. Approximately 75% have computers with dial-up modems at home. The principal delivery platform for UST is the classroom. So far, few classes are offered over the Internet; the only one is the MBA in medical management. There aren't many blended classes yet, although the undergraduate accounting teachers require students to take quizzes online. Primary decision makers Bill Davidson MBA accounting concentration director, Rich Sathe, accounting department chair, and instructors themselves. UST leaves a lot of decision making up to instructors, who are free to choose own textbook. Davidson and Sathe could recommend instruction, but instructors are free to decide to adopt or not. Analysis methods and data Methods for collecting further data I can obtain data from the instructional systems support department, who is in charge of facilities, if a more precise building-by-building breakdown of equipment is necessary Discussion of implications on designing instruction Since many of the instructors are interested in online simulations and games, but don't at present use them, I plan to develop one. Most students have computers and access to the Internet at home or at work. The only concern is transmission speed so all online instruction must be reasonably sized to download over a 56 k modem. B. Analysis of target audience Analyze learners Students in financial accounting have a wide diversity of prior knowledge, motivation, and confidence in their abilities. Some students have had three or four accounting classes in the past and take this course despite the fact that it is meant for students with no previous accounting background. Evidently these students want a review of the material from a MBA perspective. In contrast, about half the class has had zero or one previous accounting course. The class is further divided into those who believe that the class content is relevant to their job and those who don't and those who feel comfortable with a quantitative class and those who don't. I conducted an email survey of a representative sample of students from my classes for the last three years. This survey asked about their access to the Internet. A copy of the survey is found in Exhibit 5. The results follow. Design Document: Dave Johnson Page 12 Table 4 Results of student equipment survey 1. Where do you have access to a computer Don't have access 1% Home 89% 2. Does the computer provide access to the Internet No 1% Yes 99% 28 k Dialup 56 k Dialup 60% 3. What is the speed of your connection: Work 75% DSL or cable 40% Other high speed 0% Motivation in general is high for MBA students. No employer forces the student to get an MBA. They do it because they want to. Motivation can vary, however, by course. Prior knowledge can vary considerably as well. I have had a chance to survey students and observe them over the 15 years I've taught the class. The survey is reproduced in Exhibit 6 and summarized in Table 5. The data indicates that over half the class, 61%, have either never had an accounting course or have had a single course. 39% have had multiple courses. For 44% of the class, accounting is not very important to them in their jobs. 56% consider it to be somewhat to very important. 45% of the class are uncomfortable using numbers. 55% are somewhat to very comfortable. Table 5 Results of student attitude survey 0 1 2 1. How many accounting courses have you taken in the 40% 21% 27% past? 2. With an X rate how important accounting is for you at your job Not important 26% 3. Circle how comfortable you are working with numbers Not comfortable 25% 18% Somewhat important 35% 20% Somewhat comfortable 40% 3 6% 4 6% 12% Very important 9% 10% Very comfortable 5% Design Document: Dave Johnson Page 13 Exhibit 5 Email survey of financial accounting students 1. Where do you have access to a computer Don't have access Home 2. Does the computer provide access to the Internet No Yes 28 k Dialup 56 k Dialup 3. What is the speed of your connection: Work DSL or cable Other high speed Exhibit 6 Email survey of financial accounting students 1. 2. 3. 4. 5. What is your name? ___________________________________________________ What is your occupation? _______________________________________________ What company do you work for?_________________________________________ How many accounting courses have you taken in the past?__________ Circle how important accounting is for you at your job: 1 Not very important 2 3 Somewhat important 6. Circle how comfortable you are working with numbers 1 2 3 Not Somewhat comfortable comfortable 4 5 Very important 4 5 Very comfortable Analysis methods and data Methods for collecting further data I can poll students in class or by email. I can also poll student advisors, too. Design Document: Dave Johnson Page 14 Discussion of implications on designing instruction Since there is a wide diversity of prior knowledge, I propose to provide both individualized and collaborative instruction through three in-class modules, followed by an online game over the Internet. A game is an effective motivational devise. This is important since 44% of the class is unmotivated to take the class because they have no relevant way to apply the material to their job. C. Content analysis Analysis of tasks Ratio analysis resembles the process a doctor takes to diagnose a medical problem or a detective to diagnose a crime. A detective surveys the scene, hunts for clues, formulates a preliminary diagnosis, then sends the evidence to a lab to confirm the diagnosis and formulate a specific diagnosis. The purpose of ratio analysis is to investigate the "crime" of the return on equity declining. Please refer to Exhibit 7. The preliminary measure is return on equity, which has three component parts: profit margin, asset turnover, and financial leverage. These three measures are analogous to surveying the crime scene. Then, you drill down to more specific ratios. For the profit margin, you consult a common-sized income statement. For the asset turnover, you consult accounts receivable turnover, inventory turnover, and fixed asset turnover. For financial leverage, you consul the debt to equity and current ratio. Once you've examined the ratios, you can formulate a diagnosis. Perhaps the company's merchandise hasn't been selling, and they had to mark it down. This caused the gross profit margin in the common-sized income statement to decline, which in turn caused the profit margin to decline. To confirm this, you can examine the sales price over time to see if it declined. If it is true, the competition must be increasing. You can see if industry capacity has exceeded demand. Perhaps the company has misjudged customer preferences. You can compare features of the company's product with those of its competitor. Therefore, the initial diagnosis is confirmed and a more specific diagnosis is formulated. Making a diagnosis employs problem solving with three groups of principles: profit margin, asset turnover, and financial leverage. Analysis of Prerequisite Knowledge Please refer to Exhibit 8. This is a series of procedures that require the student to choose a company and consider whether it is public or private, big or small, and homogeneous or diversified. The student must select a basis for comparison and a time period. Finally, the student must obtain the ratios, either computing them himself or retrieve them online. The process of computing ratios or retrieving them online is taught in multiple classes (financial accounting, managerial accounting, and finance) and is included in each of the course textbooks. Students can consult those chapters as a job aid or ask the school librarian for help downloading ratios from online sources such as Dow Jones or Mergent/FIS online. I will assume that students can successfully compute or obtain a full set of ratios and will provide these already-computed-ratios in my training. Design Document: Dave Johnson Page 15 Exhibit 7 Analysis of Task B Begin Read Ratios Step 1: Determine which component of Return on Equity (ROE) primarily caused the fluctuation when compared to a peer. ROE = Profit x Asset x Financial margin turnover leverage Did AT fluctuate? Did PM fluctuate? Yes Did FL fluctuate? Yes Yes Consult commonsized income statement Consult accounts receivable, inventory, and fixed asset turnover ratios Consult commonsized balance sheet Step 2: Formulate plausible cause Search for more detailed data No Step 3: Confirm? Yes C End Design Document: Dave Johnson Page 16 Exhibit 8 Analysis of prerequisite knowledge A Begin Select company Public or private? Big or small? Homogenous or diversified Select basis of comparison Self over time or industry or peer Determine time period Most recent 3 years or most recent year or mosts recent period less than a years Determine who computes ratios Design Document: Dave Johnson Page 17 Exhibit 8 continued Determine who computes ratios Student W eb-based database Market Guide Quicken Locate job aid that lists ratios and equations Download ratios for company and basis of comparison Library database Dow Jones Mergent/FIS Online Download ratios for company and basis of comparison Download financial statements from Mergent/FIS Online Got all the periods? Download financial statements from Market Guide Got all the periods? Download financial statements from Company website Compute ratios by selecting correct figures from financial statements B Design Document: Dave Johnson Page 18 Learning objectives Given a change in return on equity, the student can identify which component ratio or combination of ratios (profit margin, asset turnover, financial leverage) primarily caused the fluctuation. Given a change in the profit margin, asset turnover, or financial leverage ratios, the student can formulate a plausible diagnosis of the causes of the fluctuation in the ratio(s). Given a plausible diagnosis of the causes of the fluctuation in the profit margin, asset turnover, or financial leverage ratios, the student can examine more detailed data and confirm whether the diagnosis is correct. Design Document: Dave Johnson Page 19 III. Testing/Evaluation A. Testing/evaluation methodology For testing I plan to provide an assessment in the Ratio Sleuth game. The assessment will provide ten examples in which the student is presented with ratios and data for SensorDyne and its competitor, National Sensor, such as Exhibit 9. The student has free access to the income statement, the balance sheet, and the statement of cash flows. The student must determine where to explore next and which department manager to call in to bring the department's reports. Department managers include the following people: Vin Trumpy, vice president of marketing Sidney Clampett, manager of marketing research Valerie Burns, vice president of finance Vince Packard, manager of credit department Marge Pfister, vice president of production Claire Preston, manager of accounts payable Prentice Osgood, vice president of research and development. Requesting reports from these employees will carry a cost penalty if they are not necessary to formulate a diagnosis of the company's problems. Students can view detailed data and formulate a diagnosis. One the student has formulated a diagnosis they choose their answer from a series of drop down boxes that are presented in Exhibit 11. Correct answers for eight out of the ten scenarios represents a passing, or mastery, level. B. Alignment of testing/evaluation methodology with instructional goal The testing and evaluation align well with the instructional goal. The testing provides a complete set of financial ratios for a company and a competitor over two years along with relevant detailed data. The student must correctly diagnose what caused a company's change in return on equity. They determine which variations in ratios that are worth investigating by calling in employees and examining their reports. They scrutinize selected ratios and develop a plausible diagnosis for the problem, and select more detailed data to investigate and confirm whether the diagnosis is correct. They select their answer or answers from three categories: profit margin, asset turnover, and financial leverage, each of which have several drop-down boxes that provide a reason for the ratio's variation. C. Relationship between evaluation items to learning objectives Learning objective Test Given a change in return on equity, the student The test requires the student to select reasons can identify which component ratio or for a ratio's change from three categories: combination of ratios (profit margin, asset profit margin, asset turnover, and financial turnover, financial leverage) primarily caused leverage the fluctuation. Given a change in the profit margin, asset Student's must select detailed data by calling in turnover, or financial leverage ratios, the an employee from the research and student can formulate a plausible diagnosis of development, marketing, production, or Design Document: Dave Johnson Page 20 Learning objective the causes of the fluctuation in the ratio(s). Test finance departments and examining their reports in a binder. Therefore, they must formulate some preliminary idea of what caused the ratio variation before they select an employee to call in. If they call in the wrong employee, they are assessed a penalty when requesting the report. Given a plausible diagnosis of the causes of the The student examines detailed information in fluctuation in the profit margin, asset turnover, the binder mentioned above to confirm that or financial leverage ratios, the student can their preliminary diagnosis was correct. Then examine more detailed data and confirm they select their final answers in a memo. whether the diagnosis is correct. Immediate scoring and feedback is provided. Students must get 8 out of 10 examples correct to pass the course. D. Samples of evaluation items See Exhibit's 9 through 11 for a few of the screens offered in the game. A more complete listing is provided in the Student Guide under the user guide section. Design Document: Dave Johnson Exhibit 9 Page 21 Design Document: Dave Johnson Exhibit 10 Page 22 Design Document: Dave Johnson Exhibit 11 Page 23 Design Document: Dave Johnson Page 24 IV. Instructional strategies A. Macro strategies Because of the disparity in knowledge, motivation, and confidence, I plan to provide three modules that present principles from the bottom-up, building upon one another until the student can combine them to solve the diagnosis problems. The three modules cover top level, middle level, and detail level diagnosis. Each will offer examples to diagnose the profit margin, asset turnover, and financial leverage and component ratios. For practice I plan to provide a Ratio Sleuth Game in which the student makes a complete diagnosis of the reasons why a company's return on equity is worse then its competitor's. The game provides three play levels and an assessment. The play levels vary in complexity and time permitted. At play level 1, only one variable can change, and the student has 5 minutes to make and confirm a diagnosis. At play level two, two variables can change, and the student has 3 minutes. At play level three, more than two variables can change, and the student has 1.5 minutes. In addition, the companies start out at different sizes. In Play levels one and two, the companies start out identical. B. Instructional events for each objective Learning objective 1 Given a change in return on equity, the student can identify which component ratio or combination of ratios (profit margin, asset turnover, financial leverage) primarily caused the fluctuation. Gain attention Provide analogy to detective looking for clues at a crime scene, only the "crime" we are investigating is financial performance. The diagnostic tools we use are ratios. At the end of the third module, we will play a game called Ratio Sleuth, the Financial Ratio Analysis Game and Tutorial. In this game we will perform detective work, determining why a company's return on equity has gone down. Inform learner of objective In Module 1 we will learn how to identify which component of return on equity has caused it to go down. We will perform a top level diagnosis of a company. Stimulate recall of prerequisite Show return on equity formula diagram. Explain which each element of the formula measures. Present information Show top level diagnosis diagram. Go through Example 1. Think aloud as you examine the ratios and select the one responsible for the ROE decline. Guide learning strategy Show the top level diagnosis diagram. Point out that this provides clues to the company's problems. Elicit performance (practice) After the instructor provides initial example, each Design Document: Dave Johnson Provide feedback Assess performance Enhance retention and transfer Learning objective 2 Gain attention Inform learner of objective Stimulate recall of prerequisite Present information Guide learning strategy Elicit performance (practice) Provide feedback Assess performance Page 25 student does Examples 2 and 3, the instructor provides the answer, and students ask questions. Instructor answers questions Provide three assessment problems. Students must pass 3 out of 3, since this is a relatively simple exercise. Ask how each student performed. For those who did not get 3 out of 3, allow the rest of the class to take a 5-minute break and provide one-on-one help with two additional assessment problems. Present ratio screen of Ratio Sleuth Game. Show how this is the way to survey the scene. Given a change in the profit margin, asset turnover, or financial leverage ratios, the student can formulate a plausible diagnosis of the causes of the fluctuation in the ratio(s). Analogy to detective taking fingerprints or DNA samples. In Module 2 we will learn how to formulate a diagnosis of the reasons why the return on equity has declined. We will perform a middle level diagnosis of a company. Show return on equity formula diagram. Reiterate which each element of the formula measures. Go through Example 1, which illustrates diagnosing the profit margin. Think aloud as you examine the ratios and select the one responsible for the ROE decline. Show the middle level diagnosis diagram. Point out that this provides clues to the company's problems. Have student complete Example 2, which illustrates diagnosing the asset turnover. Provide an initial hint. Have students complete Example 3, which illustrates diagnosing the financial leverage. Provide an initial hint. Finally, have students go through 2 more examples without hints. All five examples are continuations of the exercises just completed in Module 1. After each example, ask what their answers were and answer questions Prompt students for their answers on the two unassisted examples. Explain answer choices. Three problems. Students must get 3 out of 3. Ask Design Document: Dave Johnson Enhance retention and transfer Learning objective 3 Gain attention Inform learner of objective Stimulate recall of prerequisite Present information Guide learning strategy Elicit performance (practice) Provide feedback Page 26 how each student performed. For those who did not get 3 out of 3, allow the rest of the class to take a 5minute break and provide one-on-one help with two additional assessment problems. Present common-sized income statement screen of Ratio Sleuth Game. Show how this is the way to ferret out the subsequent clues. Given a plausible diagnosis of the causes of the fluctuation in the profit margin, asset turnover, or financial leverage ratios, the student can examine more detailed data and confirm whether the diagnosis is correct. Analogy to detective sending evidence to the lab for analysis. In Module 3 we will examine more detailed data and learn how to confirm our original diagnosis of the reasons why the return on equity has declined. We will perform a detail level diagnosis of a company. Go through previous two diagrams: Top Level and Middle Level Diagnosis for repetition. Using screens from the Ratio Sleuth Game, go through three entire examples, thinking aloud as you go. One example should illustrate diagnosing the profit margin, one the asset turnover, and the other financial leverage. Show Detail Level Diagnosis diagram In-class group project. After each example the instructor models above, provide a group practice example in which they go through the entire diagnosis and confirmation process for profit margin, asset turnover, and financial leverage ratios. As a hint, inform students which category of problem (profit margin, asset turnover, or financial leverage) it represents. Inform students that most of their practice will take place at home over the Internet as they play the Ratio Sleuth Game. Provide brief introduction to game. In groups, students can help each other. The teacher can go from group to group offering assistance as needed. Online feedback is provided by the Ratio Sleuth Game Design Document: Dave Johnson Assess performance Enhance retention and transfer Page 27 Inform students that once they have completed about ten examples of the Ratio Sleuth game, they should select Assessment from the Play Level menu. They will be given ten examples and must correctly diagnose the problem 8 out of 10 times. Through this practice, students are much better prepared to analyze real companies. Suggest they look through the business section of the local paper and business periodicals, like BusinessWeek, for instances of the ratios we have used in this unit. C. Instructional media and delivery format rationale I will provide an instructor's manual that will contain masters to prepare overheads for inclass lecture and in-class exercises. I will also provide a student guide that will contain copies of the overheads, in-class exercises, and a user manual for the Ratio Sleuth Game. Instructors can download and printout the instructor's manual from a website. Students can download and printout the student guide from the same website. This helps maintain version control and makes it easier to revise. Design Document: Dave Johnson Page 28 V. Implementation and evaluation strategies A. Description of formative evaluation I have tried out examples from Modules 1, 2, and 3 on a few students from my Spring, 2002 class. I gave them the printed materials and asked them to complete the exercises. From their comments, I made a few minor modifications and decided to provide some additional assessments for the anticipated few students who don't "get it" the first time around. B. Recommendation for further formative evaluation I plan to test out printed content on a few students from my Spring, 2002 class and test my online prototype with students from my August, 2002 class and solicit other instructors to review my instructor and student guides. After making modifications, I will conduct a beta test with my entire class in Fall, 2002. With student testimonials and assessment data from the Beta test in hand, I will spread the word to other accounting instructors in the MBA program in 2003. C. Recommendation for future enhancements Provide a tutorial in the Ratio Sleuth Game that illustrates the relationships between variables and the ratios. For example, students could enter different sales prices and watch how they affect the cost of goods sold percentage. Provide stock market ratio illustrations. Provide a streaming video lecture online with the Ratio Sleuth Game, rather than have the teacher deliver it in class. Provide audio in Ratio Sleuth Game. For now, there are bandwidth constraints, and audio and video are not practical for delivery over the Web. D. Project plan Project plan Detail content outline Design document Develop content Online prototype Online copy edit Online review Instructor guide Student guide Alpha test Beta test (one of classes) Done 2 days Done 1 week One month 1 day 2 days (select past students) 1 day 1 day Students from August class Fall class May June July Aug Sep Design Document: Dave Johnson Page 29 E. Implementation issues There will be a great deal of programming effort required and many graphics to create. All of this I will have to do myself. However, I can host it at my personal website. F. Instructional development issues None