1
Chapter
Basic Operation
1-1
1-2
1-3
1-4
1-5
Before Starting Calculations...
Memory
Option (OPTN) Menu
Variable Data (VARS) Menu
Program (PRGM) Menu
1
1-1 Before Starting Calculations...
Before performing a calculation for the first time, you should use the Set Up Screen
to specify the angle unit and display format.
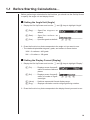
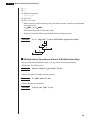
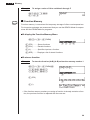
k Setting the Angle Unit (Angle)
1. Display the Set Up Screen and use the f and c keys to highlight “Angle”.
1 (Deg) ........ S p e c i f i e s d e g r e e s a s
default.
2 (Rad) ........ S p e c i f i e s r a d i a n s a s
default.
3 (Gra) ........ Specifies grads as default.
1 2 3 4 5 6
2. Press the function key that corresponds to the angle unit you want to use.
• The relationship between degrees, grads, and radians is shown below.
360° = 2π radians = 400 grads
90° = π/2 radians = 100 grads
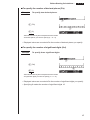
k Setting the Display Format (Display)
1. Display the Set Up Screen and use the f and c keys to highlight “Display”.
1 (Fix) .......... Displays screen for specification of number of decimal
places.
2 (Sci) ......... Displays screen for specification of number of significant digits.
1 2 3 4 5 6
3 (Norm) ..... Switches exponential format display range.
4 (Eng) ........ Displays calculation results using engineering notation.
2. Press the function key that corresponds to the display format you want to use.
16
Before Starting Calculations...
1-1
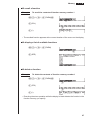
u To specify the number of decimal places (Fix)
Example
To specify two decimal places.
1 2 3 4 5 6
1 (Fix)
1 2 3 4 5 6
3 (2)
Press the function key that corresponds to the number
of decimal places you want to specify (n = 0 ~ 9).
• Displayed values are rounded off to the number of decimal places you specify.
u To specify the number of significant digits (Sci)
Example
To specify three significant digits.
1 2 3 4 5 6
2 (Sci)
1 2 3 4 5 6
4 (3)
Press the function key that corresponds to the number
of significant digits you want to specify (n = 0 ~ 9).
• Displayed values are rounded off to the number of significant digits you specify.
• Specifying 0 makes the number of significant digits 10.
17
1-1
Before Starting Calculations...
u To specify the exponential display range (Norm 1/Norm 2)
Press 3 (Norm) to switch between Norm 1 and Norm 2.
Norm 1: 10–2 (0.01)>|x|, |x| >1010
Norm 2: 10–9 (0.000000001)>|x|, |x| >1010
u To specify the engineering notation display (Eng)
Press 4 (Eng) to switch between engineering notation and standard notation.
The indicator “/E” is on the display while engineering notation is in effect.
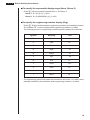
The following are the 11 engineering notation symbols used by this calculator.
Symbol
Meaning
Unit
E
Exa
1018
P
Peta
1015
T
Tera
1012
G
Giga
109
M
Mega
106
k
kilo
103
m
milli
10–3
µ
micro
10–6
n
nano
10–9
p
pico
10–12
f
femto
10–15
• The engineering symbol that makes the mantissa a value from 1 to 1000 is automatically selected by the calculator when engineering notation is in effect.
18
Before Starting Calculations...
1-1
k Inputting Calculations
When you are ready to input a calculation, first press Ato clear the display. Next,
input your calculation formulas exactly as they are written, from left to right, and
press w to obtain the result.
Example 1
2 + 3 – 4 + 10 =
Ac+d-e+baw
Example 2
2(5 + 4) ÷ (23 × 5) =
Ac(f+e)/
(cd*f)w
k Calculation Priority Sequence
This calculator employs true algebraic logic to calculate the parts of a formula in the
following order:
1 Coordinate transformation
Pol (x, y), Rec (r, θ )
Differentials, quadratic differentials, integrations, Σ calculations
d/dx, d2/dx2, ∫dx, Σ, Mat, Solve, FMin, FMax, List→Mat, Fill, Seq, SortA, SortD,
Min, Max, Median, Mean, Augment, Mat→List, List
2 Type A functions
With these functions, the value is entered and then the function key is pressed.
x2, x–1, x !, ° ’ ”, ENG symbols
3 Power/root
^(xy), x
4 Fractions
a b /c
5 Abbreviated multiplication format in front of π, memory name, or variable name.
2π, 5A, X min, F Start, etc.
6 Type B functions
With these functions, the function key is pressed and then the value is entered.
, 3 , log, In, ex, 10x, sin, cos, tan, sin–1 , cos–1 , tan–1 , sinh, cosh, tanh, sinh–1 ,
cosh–1 , tanh–1 , (–), parenthesis, d, h, b, o, Neg, Not, Det, Trn, Dim, Identity, Sum,
Prod, Cuml, Percent
7 Abbreviated multiplication format in front of Type B functions
2 3 , A log2, etc.
8 Permutation, combination
nPr, nCr
19
1-1
Before Starting Calculations...
9 ×,÷
0 +, –
! Relational operator
=, G, >, <, ≥, ≤
@ And, and
# Or, or, xor, xnor
• When functions with the same priority are used in series, execution is performed
from right to left.
exIn 120 → ex {In( 120 )}
Otherwise, execution is from left to right.
• Anything contained within parentheses receives highest priority.
Example
2 + 3 × (log sin2π 2 + 6.8) = 22.07101691 (angle unit = Rad)
1
2
3
4
5
6
k Multiplication Operations without a Multiplication Sign
You can omit the multiplication sign (×) in any of the following operations.
• Before the Type B functions
Example
2sin30, 10log1.2, 2 3, 2Pol(5, 12), etc.
• Before constants, variable names, memory
Example
2π, 2AB, 3Ans, 3Y1, etc.
• Before an open parenthesis
Example
3(5 + 6), (A + 1)(B – 1), etc.
20
Before Starting Calculations...
1-1
k Stacks
The unit employs memory blocks, called stacks, for storage of low priority values and
commands. There is a 10-level numeric value stack, a 26-level command stack, and
a 10-level program subroutine stack. If you execute a formula so complex it exceeds
the amount of stack space available, an error message appears on the display (Stk
ERROR during calculations or Ne ERROR during execution of a program subroutine).
Example
Numeric Value Stack
Command Stack
2
b
2
3
c
3
4
d
4
5
e
5
4
f
...
1
g
...
h
×
(
(
+
×
(
+
• Calculations are performed according to the priority sequence. Once a calculation is executed, it is cleared from the stack.
• Storing a complex number takes up two numeric value stack levels.
P.22
• Storing a two-byte function takes up two command stack levels.
k Input, Output and Operation Limitations
The allowable range for both input and output values is 10 digits for the mantissa and
2 digits for the exponent. Internally, however, the unit performs calculations using 15
digits for the mantissa and 2 digits for the exponent.
Example
3 × 10⁵ ÷ 7 – 42857 =
AdEf/hw
dEf/hecifhw
21
1-1
Before Starting Calculations...
k Overflow and Errors
Exceeding a specified input or calculation range, or attempting an illegal input causes
an error message to appear on the display. Further operation of the calculator is
impossible while an error message is displayed. The following events cause an error
message to appear on the display.
• When any result, whether intermediate or final, or any value in memory exceeds
±9.999999999 × 1099 (Ma ERROR).
P.401
• When an attempt is made to perform a function calculation that exceeds the input
range (Ma ERROR).
• When an illegal operation is attempted during statistical calculations (Ma ERROR). For example, attempting to obtain 1VAR without data input.
• When the capacity of the numeric value stack or command stack is exceeded (Stk
ERROR). For example, entering 25 successive ( followed by 2 +3 *4 w.
• When an attempt is made to perform a calculation using an illegal formula (Syn
ERROR). For example, 5 ** 3 w.
• When you try to perform a calculation that causes memory capacity to be exceeded
(Mem ERROR).
• When you use a command that requires an argument, without providing a valid
argument (Arg ERROR).
• When an attempt is made to use an illegal dimension during matrix calculations
(Dim ERROR).
P.399
• Other errors can occur during program execution. Most of the calculator’s keys
are inoperative while an error message is displayed. You can resume operation
using one of the two following procedures.
• Press the A key to clear the error and return to normal operation.
P.50
• Press d or e to display the error.
k Memory Capacity
Each time you press a key, either one byte or two bytes is used. Some of the functions
that require one byte are: b, c, d, sin, cos, tan, log, In, , and π. Some of the
functions that take up two bytes are d/dx(, Mat, Xmin, If, For, Return, DrawGraph,
SortA(, PxIOn, Sum, and an+1.
When the number of bytes remaining drops to five or below, the cursor automatically
changes from “ _ ” to “ v ”. If you still need to input more, you should divide your
calculation into two or more parts.
• As you input numeric values or commands, they appear flush left on the display. Calculation results, on the other hand, are displayed flush right.
22
Before Starting Calculations...
1-1
k Graphic Display and Text Display
The unit uses both a graphic display and a text display. The graphic display is used
for graphics, while the text display is used for calculations and instructions. The contents of each type of display are stored in independent memory areas.
u To switch between the graphic display and text display
Press !6(G↔T). You should also note that the key operations used to clear
each type of display are different.
u To clear the graphic display
Press !4(Sketch) 1(Cls) w.
u To clear the text display
Press A.
k Editing Calculations
Use the d and e keys to move the cursor to the position you want to change, and
then perform one of the operations described below. After you edit the calculation,
you can execute it by pressing w, or use e to move to the end of the calculation
and input more.
u To change a step
Example
To change cos60 to sin60
cga
ddd
s
u To delete a step
Example
To change 369 × × 2 to 369 × 2
dgj**c
ddD
23
1-1
Before Starting Calculations...
u To insert a step
Example
To change 2.362 to sin2.362
c.dgx
ddddd
![
s
• When you press ![a space is indicated by the symbol ‘‘t’’. The next function or value you input is inserted at the location of ‘‘t’’. To abort the insert operation without inputting anything, move the cursor, press ![again, or press
d, e or w.
24
1-2 Memory
k Variables
This calculator comes with 28 variables as standard. You can use variables to store
values to be used inside of calculations. Variables are identified by single-letter names,
which are made up of the 26 letters of the alphabet, plus r and θ . The maximum size
of values that you can assign to variables is 15 digits for the mantissa and 2 digits for
the exponent. Variable contents are retained even when you switch power off.
u To assign a value to a variable
Example
To assign 123 to variable A
AbcdaaAw
Example
To add 456 to variable A and store the result in variable B
AaA+efgaaBw
u To display the contents of a variable
Example
To display the contents of variable A
AaAw
uTo clear a variable
Example
To clear variable A
AaaaAw
• To clear all variables, select “Memory Usage” from the MEM Mode.
u To assign the same value to more than one variable
[value]a [first variable name]a3(~)
[last variable name]w
• You cannot use “ r ” or “θ ” as a variable name in the above operation.
25
1-2
Memory
Example
To assign a value of 10 to variables A through F
Abaa!aA
3(~)Fw
k Function Memory
P.31
Function memory is convenient for temporary storage of often-used expressions.
For longer term storage, we recommend that you use the GRAPH Mode for expressions and the PRGM Mode for programs.
u To display the Function Memory Menu
K6(g)6(g)3(FMEM)
1(STO) ........ Stores functions
1 2 3 4 5 6
2(RCL) ........ Recalls functions
3(fn) ............ Specifies input as a function.
4(SEE) ........ Displays a list of stored functions
u To store a function
Example
To store the function (A+B) (A–B) as function memory number 1.
K6(g)6(g)3(FMEM)A
(aA+aB)
(aA-aB)
1 2 3 4 5 6
1(STO)
1 2 3 4 5 6
1(f1)
• If the function memory number you assign a function to already contains a function, the previous function is replaced with the new one.
26
Memory
1-2
u To recall a function
Example
To recall the contents of function memory number 1
K6(g)6(g)3(FMEM)A
1 2 3 4 5 6
2(RCL)
1 2 3 4 5 6
1(f1)
• The recalled function appears at the current location of the cursor on the display.
u To display a list of available functions
K6(g)6(g)3(FMEM)
1 2 3 4 5 6
4(SEE)
u To delete a function
Example
To delete the contents of function memory number 1
K6(g)6(g)3(FMEM)A
1 2 3 4 5 6
1(STO)
1 2 3 4 5 6
1(f1)
• Executing the store operation while the display is blank deletes the function in the
function memory you specify.
27
1-2
Memory
u To use stored functions
Once you store a function in memory, you can recall it and use it for a calculation.
This feature is very useful for quick and easy input of functions when programming
or graphing.
Example
To store x3 + 1, x2 + x into function memory, and then graph:
y = x3 + x2 + x + 1
Use the following View Window parameters.
Xmin
= –4
Ymin
= –10
Xmax = 4
Ymax = 10
Xscale = 1
Yscale =
1
!Zc1(Y=)J
K6(g)6(g)3(FMEM)
AvMd+b
1(STO)1(f1 )(stores (x3 + 1))
Avx+v
1(STO)2(f2 )(stores (x2 + x))
A!4(Sketch)1(Cls)w
!4(Sketch)5(GRPH)1(Y=)
K6(g)6(g)3(FMEM)
3(fn)1(f1)+2(f2 )w
P.125
• For full details about graphing, see “8. Graphing”.
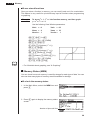
k Memory Status (MEM)
You can check how much memory is used for storage for each type of data. You can
also see how many bytes of memory are still available for storage.
u To check the memory status
1. In the Main Menu, select the MEM icon and
press w.
2. Press w again to display the memory status
screen.
Number of bytes still free
28
Memory
1-2
3. Use f and c to move the highlighting and view the amount of memory (in
bytes) used for storage of each type of data.
The following table shows all of the data types that appear on the memory status
screen.
Data Type
Meaning
Program
Program data
Statistics
Statistical calculations and graphs
Matrix
Matrix memory data
List File
List data
Y=
Graph functions
Draw Memory
Graph drawing conditions (View Window,
enlargement/reduction factor, graph
screen)
Graph Memory
Graph memory data
View Window
View Window memory data
Picture
Graph screen data
Dynamic Graph
Dynamic Graph data
Table
Function Table & Graph data
Recursion
Recursion Table & Graph data
Equation
Equation calculation data
Alpha Memory
Alpha memory data
Function Mem
Function memory data
29
1-2
Memory
k Clearing Memory Contents
You have a choice of two differenct procedures that you can use to clear memory
contents.
• Clearing specific data within a selected data type
• Clearing all data within a specific data type
u To clear specific data within a selected data type
1. In the memory status screen, use f and c to move the highlighting to the
data type you want to clear.
2. Press 1 (DEL). If you selected a data type that contains multiple memory areas, a function menu like the one shown below appears to let you specify which
memory you want to clear.
1 2 3 4 5 6
* This menu appears when you
select List File.
3. Press the function key that corresponds to the data you want to clear.
1 2 3 4 5 6
4. Press 1 (YES) to clear the data or 6 (NO) to abort the operation without
clearing anything.
u To clear all data within a specific data type
1. In the memory status screen, use f and c to move the highlighting to the
data type whose data you want to clear.
2. Press 1 (DEL). The following confirmation menu appears if you selected a data
type in which all data can be cleared by a single operation.
1 2 3 4 5 6
3. Press 1 (YES) to clear the data or 6 (NO) to abort the operation without
clearing anything.
30
1-3 Option (OPTN) Menu
The option menu gives you access to scientific functions and features that are not marked on
the calculator’s keyboard. The contents of the option menu differ according to the mode you are
in when you press the K key.
u Option Menu in the RUN and PRGM Modes
K
1 2 3 4 5 6
P.263
1 (LIST) ....... List function menu
P.101
2 (MAT) ....... Matrix operation menu
P.80
3 (CPLX) ..... Complex number calculation menu
4 (CALC) ..... Functional analysis menu
P.307
5 (STAT) ...... Paired-variable statistical estimated value menu
6 (g) ........... Next menu
6(g)
1 2 3 4 5 6
P.56
2 (HYP) ....... Hyperbolic calculation menu
P.52
3 (PROB) .... Probability/distribution calculation menu
P.53
4 (NUM) ...... Numeric calculation menu
P.53
5 (ANGL) ..... Menu for angle/coordinate conversion, sexagesimal input/conversion
6 (g) ........... Next menu
6(g)
P.54
1 (ESYM) .... Engineering symbol menu
P.159
2 (PICT) ...... Graph save/recall menu
P.26
3 (FMEM) .... Function memory menu
P.61
4 (LOGIC) ... Logic operator menu
1 2 3 4 5 6
6 (g) ........... Previous menu
Note that the K key is disabled while binary, octal, decimal, or hexadecimal is set
as the default number system.
31
1-3
Option (OPTN) Menu
u Option Menu during numeric data input in the STAT, MAT, LIST,
TABLE, RECUR and EQUA Modes
K
1 2 3 4 5 6
6(g)
1 2 3 4 5 6
The meanings of the option menu items are described in the sections that cover
each mode.
u Option Menu during formula input in the GRAPH, DYNA, TABLE
and RECUR Modes
K
1 2 3 4 5 6
6(g)
1 2 3 4 5 6
The meanings of the option menu items are described in the sections that cover
each mode.
32
1-4 Variable Data (VARS) Menu
You can use the variable data menu to recall the data listed below.
• View Window values
• Enlargement/reduction factor
• Single-variable/paired-variable statistical data
• Graph functions
• Dynamic Graph set up data
• Table & Graph table range and table contents
• Recursion formula, table range, and table contents
• Equation coefficients and solutions
The variable data menu does not appear if you press J while binary, octal, decimal, or hexadecimal is set as the default number system.
To recall variable data, press J to display the variable data menu.
J
1 2 3 4 5 6
1 (V-WIN) .... View Window values
2 (FACT) ..... x and y-axis enlargement/reduction factor
3 (STAT) ...... Single/paired-variable statistical data
P.36
4 (GRPH) .... Graph functions stored in the GRAPH Mode
P.37
5 (DYNA) .... Dynamic Graph set up data
6 (g) ........... Next menu
6 (g)
1 2 3 4 5 6
P.38
1 (TABL) ...... Table & Graph function table range and table contents
P.38
2 (RECR) .... Recursion formula table range and table contents
P.40
3 (EQUA) .... Solutions and coefficients of linear equations with two through
six unknowns, quadratic equations, and cubic equations
6 (g) ........... Previous menu
• Note that the EQUA item appears for function key 3 only when you access the
variable data menu from the RUN or PRGM Mode.
33
1-4
Variable Data (VARS) Menu
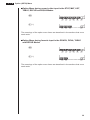
u To recall View Window values
P.127
Pressing 1 (V-WIN) while the variable data menu is on the screen displays a View
Window value menu.
1 (V-WIN)
1 2 3 4 5 6
1 (X) ............ x-axis menu
2 (Y) ............ y-axis menu
3 (T,θ) .......... T,θ menu
4 (R-X) ........ x-axis menu for Dual Graph right hand screen
5 (R-Y) ........ y-axis menu for Dual Graph right hand screen
6 (R-T, θ) ...... T,θ menu for Dual Graph right hand screen
The following menu appears whenever you press 1 (X), 2 (Y), 4 (R-X), or 5
(R-Y) while the View Window value menu is on the display.
1 (min) ......... Minimum
2 (max) ........ Maximum
3 (scal) ........ Scale
1 2 3 4 5 6
The following menu appears whenever you press 3 (T,θ ) or 6 (R-T,θ ) while the
view window value menu is on the display.
1 (min) ......... Minimum
2 (max) ........ Maximum
3 (ptch) ........ Pitch
1 2 3 4 5 6
u To recall enlargement and reduction factors
P.153
Pressing 2 (FACT) while the variable data menu is on the screen displays an
enlargement/reduction factor menu.
2(FACT)
1 2 3 4 5 6
1 (Xfct) ........ x-axis enlargement/reduction factor
2 (Yfct) ........ y-axis enlargement/reduction factor
34
Variable Data (VARS) Menu
1-4
u To recall single/paired-variable statistical data
Pressing 3 (STAT) while the variable data menu is on the screen displays a statistical data menu.
3(STAT)
1 2 3 4 5 6
1 (X) ............ Single/paired-variable
x-data menu
2 (Y) ............ Paired-variable y-data menu
3 (GRPH) .... Statistical graph data menu
4 (PTS) ....... Summary point data menu
P.296
The following menu appears whenever you press 1 (X), while the statistical data
menu is on the display.
1 (X)
1 (n) ............ Number of data
1 2 3 4 5 6
2 (o) ............. Mean of x data
3 (Σx) .......... Sum of x data
4 (Σx2) ......... x data sum of squares
5 (xσn) ......... x data population standard deviation
6 (g) ........... Next menu
6 (g)
1 (xσn-1 ) ....... x data sample standard
deviation
1 2 3 4 5 6
2 (minX) ...... x data minimum value
3 (maxX) ..... x data maximum value
6 (g) ........... Previous menu
P.301
The following menu appears whenever you press 2 (Y) while the statistical data
menu is on the display.
2 (Y)
1 2 3 4 5 6
1 (p) ............. Mean of y data
2 (Σy) .......... Sum of y data
3 (Σy2) ......... y data sum of squares
4 (Σxy) ......... x data and y data sum of products
5 (yσn) ......... y data population standard deviation
6 (g) ........... Next menu
35
1-4
Variable Data (VARS) Menu
6 (g)
1 (yσn-1 ) ....... y data sample standard
deviation
1 2 3 4 5 6
2 (minY) ...... y data minimum value
3 (maxY) ..... y data maximum value
6 (g) ........... Previous menu
The following menu appears whenever you press 3 (GRPH) while the statistical
data menu is on the display.
3 (GRPH)
1(a)-5(e) .. Statistical graph regression
coefficient and multinomial
coefficients
1 2 3 4 5 6
6 (g) ........... Next menu
6 (g)
1 (r) ............. Statistical graph correlation
coefficient
P.301
1 2 3 4 5 6
2 (Q1) .......... First quartile
3 (Med) ....... Median of input data
4 (Q3) .......... Third quartile
5 (Mod) ....... Mode of input data
6 (g) ........... Previous menu
The following menu appears whenever you press 4 (PTS) while the statistical data
menu is on the display.
4 (PTS)
1(x1) ~ 6(y3) .... Coordinates of summary points
1 2 3 4 5 6
u To recall graph functions
P.132
Pressing 4 (GRPH) while the variable data menu is on the screen displays a graph
function menu.
4 (GRPH)
1 2 3 4 5 6
36
Variable Data (VARS) Menu
1-4
Input a storage area number and then press one of the following function keys to
recall the corresponding graph function stored in that storage area.
1 (Y) ............ Rectangular coordinate or inequality function
2 (r) ............. Polar coordinate function
3 (Xt) ........... Parametric graph function Xt
4 (Yt) ........... Parametric graph function Yt
5 (X) ............ X=constant graph function
Example
To recall and draw the graph for the rectangular coordinate
function y = 2 x2 – 3, which is stored in storage area Y2
Use the following View Window parameters to draw the graph.
Xmin = –5
Xmax = 5
Xscale = 1
Ymin = –5
Ymax = 5
Yscale = 1
!4(Sketch)5(GRPH)1(Y=)
J4(GRPH)1(Y)cw
u To recall Dynamic Graph set up data
P.211
Pressing 5 (DYNA) while the variable data menu is on the screen displays a Dynamic Graph set up menu.
5 (DYNA)
1 2 3 4 5 6
1 (Strt) ......... Coefficient range start value
2 (End) ........ Coefficient range end value
3 (Pitch) ...... Coefficient value increment
37
1-4
Variable Data (VARS) Menu
u To recall Table & Graph table range and table content data
Pressing 6 (g) and then 1 (TABL) while the variable data menu is on the screen
displays a Table & Graph data menu.
6 (g)1 (TABL)
1 2 3 4 5 6
P.237
1 (Strt) ......... Table range start value (F Start command)
2 (End) ........ Table range end value (F End command)
3 (Pitch) ...... Table value increment (F pitch command)
4 (Reslt) ...... Matrix of table contents (F Result command)
• The Reslt item appears for function key 4 only when the above menu is displayed in the RUN or PRGM Mode.
Example
To recall the contents of the numeric table for the function
y = 3x2 – 2, while the table range is Start=0 and End=6, and pitch=1
4(Reslt)
w
u To recall recursion formula, table range and table content data
Pressing 6 (g) and then 2 (RECR) while the variable data menu is on the screen
displays a recursion data menu.
6 (g)2 (RECR)
1 2 3 4 5 6
1 (FORM) .... Recursion formula data menu
2 (RANG) .... Table range data menu
3 (Reslt) ...... Matrix of table contents (R Result command)
38
Variable Data (VARS) Menu
1-4
To recall recursion formula data
The following menu appears whenever you press 1 (FORM) while the recursion
data menu is on the display.
P.250
1 (FORM)
1 (an) ........... an expression
1 2 3 4 5 6
2 (an+1) ......... an+1 expression
3 (an+2) ......... an+2 expression
4 (bn) ........... bn expression
5 (bn+1) ......... bn+1 expression
6 (bn+2) ......... bn+2 expression
To recall table range data
The following menu appears whenever you press 2 (RANG) while the recursion
data menu is on the display.
P.251
2 (RANG)
1 (Strt) ......... Table range start value
(F Start command)
1 2 3 4 5 6
2 (End) ........ Table range end value
(F End command)
3 (a0) ........... Zero term a0 value
4 (a1) ........... First term a1 value
5 (a2) ........... Second term a2 value
6 (g) ........... Next menu
6 (g)
1 (b0) ........... Zero term b0 value
1 2 3 4 5 6
2 (b1) ........... First term b1 value
3 (b2) ........... Second term b2 value
4 (anSt) ........ Origin of an recursion formula convergence/divergence graph
(WEB graph)
5 (bnSt) ........ Origin of bn recursion formula convergence/divergence graph
(WEB graph)
6 (g) ........... Previous menu
39
1-4
Variable Data (VARS) Menu
To recall matrix of table contents
Whenever you press 3 (Reslt) while the recursion data menu is on the display, the
recursion formula numeric table appears on the screen in matrix format.
• This operation is available only from the RUN or PRGM Mode.
Example
To recall the contents of the numeric table for recursion formula
an = 2n + 1, while the table range is Start=1 and End=6
3(Reslt)
w
• The table contents recalled by the above operation are stored automatically in
Matrix Answer Memory (MatAns).
• An error (Dim ERROR) occurs if you perform the above operation when there is
no function or recursion formula numeric table in memory.
u To recall equation coefficients and solutions
Pressing 6 (g) and then 3 (EQUA) while the variable data menu is on the screen
displays an equation data menu.
P.117
6(g)3(EQUA)
1 2 3 4 5 6
P.120
1 (S-Rlt) ...... Matrix of solutions for linear equations with two through six
unknowns
2 (S-Cof) ..... Matrix of coefficients for linear equations with two through six
unknowns
3 (P-Rlt) ...... Matrix of solutions for a quadratic or cubic equation
4 (P-Cof) ..... Matrix of coefficients for a quadratic or cubic equation
40
Variable Data (VARS) Menu
Example 1
1-4
To recall the solutions for the following linear equations with two
unknowns
2x + 3y = 8
3x + 5y = 14
1(S-Rlt)
w
Example 2
To recall the coefficients for the following linear equations with
three unknowns
4x + y – 2z = –1
x + 6y + 3z = 1
–5x + 4y + z = –7
2(S-Cof)
w
Example 3
To recall the solutions for the following quadratic equation
2x2 + x – 10 = 0
3(P-Rlt)
w
Example 4
To recall the coefficients for the following quadratic equation
2x2 + x – 10 = 0
4(P-Cof)
w
41
1-4
Variable Data (VARS) Menu
• The coefficients and solutions recalled by the above operation are stored automatically in Matrix Answer Memory (MatAns).
• When the solutions for a linear equation with 2 through 6 unknowns contain complex numbers, only the real number parts are stored in Matrix Answer Memory
(MatAns).
• Coefficient and solution memory data for a linear equation with 2 though 6 unknowns cannot be recalled at the same time.
• The following conditions cause an error (Mem ERROR) to be generated.
When there are no coefficients input for the equation
When there are no solutions obtained for the equation
42
1-5 Program (PRGM) Menu
To display the program menu, first enter the RUN or PRGM Mode from the Main
Menu, and then press ! W.
!W
1 (COM) ...... Program command menu
1 2 3 4 5 6
2 (CTL) ........ Program control command
menu
3 (JUMP) ..... Jump command menu
4 (?) ............ Input command
5 (^) ........... Output command
6 (g) ........... Next menu
6 (g)
1 (CLR) ....... Clear command menu
1 2 3 4 5 6
2 (DISP) ...... Display command menu
3 (REL) ....... Conditional jump relational operator menu
4 (I/O) .......... Input/output control command menu
5 (:) ............. Multistatement connector
6 (g) ........... Previous menu
The following function key menu appears if you press ! W in the RUN Mode or
the PRGM Mode while binary, octal, decimal, or hexadecimal is set as the default
number system.
!W
1 2 3 4 5 6
The functions assigned to the function keys are the same as those in the Comp
Mode.
P.313
For details on the commands that are available in the various menus you can access
from the program menu, see “19. Programming”.
43