1
This document was downloaded from Vocational
Economics Inc. (www.vocecon.com). For more
information
on this document, visit:
http://www.vocecon.com/resources/data.aspx
VALE 2000
User’s Manual
Revised 2002
A. M. Gamboa, Jr., PhD, MBA
Dave Gibson, MBA, CPA
Gwen Holland, MSEd
Ronald Missun, PhD
Paul Prachyl, PhD, CRC
Darryl Rowe
John Tierney, MA
Mary Watson, BSBA
Vocational Econometrics, Inc.
One Riverfront Plaza, Suite 2100
Louisville, Kentucky 40202
502-589-1041
2000, 2002 Vocational Econometrics, Inc. All rights reserved. No part of this
document may be reproduced or transmitted in any form or by any means, electronic
or mechanical, for any purpose, without express written permission of Vocational
Econometrics, Inc.
Information in this document is subject to change without notice. Companies, names,
and data used in examples herein are fictitious unless otherwise noted.
Microsoft, Windows, Access, Excel, and Word are registered trademarks of Microsoft
Corporation.
Table of Contents
Table of Contents
Foreword .............................................................................................................................v
History
......................................................................................................................v
Acknowledgments.............................................................................................................vi
Part I
Introduction..........................................................................................................1
Chapter 1
Before You Begin...........................................................................................1
Manual Format ..............................................................................................................1
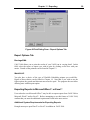
Navigation .....................................................................................................................1
Control Definitions ........................................................................................................3
System Help ..................................................................................................................5
Chapter 2
Installation ....................................................................................................7
Quick Start.....................................................................................................................7
System Requirements ....................................................................................................7
ReadMe File ..................................................................................................................8
Installation.....................................................................................................................8
Microsoft Access .....................................................................................................11
Removal ......................................................................................................................13
Chapter 3
Occupational Disability Definition...............................................................15
Part II Entering Your Data............................................................................................17
Chapter 4
Managing Cases...........................................................................................17
Using the Case Select Form to Manage Your Cases...................................................17
Adding a New Case .....................................................................................................18
Selecting an Existing Case ..........................................................................................18
Copying an Existing Case ...........................................................................................19
Editing an Existing Case .............................................................................................20
Deleting an Existing Case ...........................................................................................20
Printing an Existing Case ............................................................................................20
Maintenance Form.......................................................................................................20
Chapter 5
Data Entry - Case Data................................................................................21
Case Reference ............................................................................................................21
Attorney Name ............................................................................................................22
Attorney's Client ..........................................................................................................22
Gender .........................................................................................................................22
Prepared By.................................................................................................................22
Client Identification.....................................................................................................23
Death Case...................................................................................................................23
Show Earnings .............................................................................................................23
CPI Adjustment ...........................................................................................................23
Birth Date ....................................................................................................................23
Report Date .................................................................................................................23
Injury Date...................................................................................................................23
i
ii
Table of Contents
Case Comments ...........................................................................................................24
Chapter 6
Data Entry - Scenarios.................................................................................25
Case Scenarios.............................................................................................................26
Case Analyses .............................................................................................................34
Chapter 7
Data Entry - Past Loss.................................................................................37
Past Loss......................................................................................................................37
Discount Pre-Injury Earnings ......................................................................................37
Actual Earnings From Date of Injury to Report Date .................................................38
Chapter 8
Maintenance ................................................................................................39
Defaults .......................................................................................................................39
Attorneys .....................................................................................................................39
Consultants..................................................................................................................40
CPI...............................................................................................................................40
Education.....................................................................................................................41
Error Log and Diagnostics ..........................................................................................42
Chapter 9
Defaults .......................................................................................................43
Case ID Tab.................................................................................................................43
Client ID Tab...............................................................................................................44
Worklife Tab ...............................................................................................................46
Financial Tab ...............................................................................................................47
Other Tab.....................................................................................................................48
Program Flow Tab.......................................................................................................49
Chapter 10 Menus and Toolbars ...................................................................................51
Start Menu...................................................................................................................51
Menu Bar .....................................................................................................................52
Toolbar ........................................................................................................................55
Part III Using Your Data.................................................................................................57
Chapter 11 Reporting....................................................................................................57
Report Selection Tab ...................................................................................................58
Report Options Tab .....................................................................................................59
Exporting Reports to Microsoft Word or Excel....................................................59
Chapter 12 Case Summary Report................................................................................61
Chapter 13 VALE Report..............................................................................................63
VALE Summary Report ..............................................................................................63
VALE Census Report ..................................................................................................65
VALE DOT Report .....................................................................................................66
Chapter 14 Worklife Probability Report .......................................................................69
Worklife Probability Standard Report.........................................................................70
Worklife Probability Offset Report.............................................................................72
Part IV Reference ............................................................................................................75
Chapter 15 VALE Sources ............................................................................................75
Occupational Data.......................................................................................................75
Table of Contents
Earnings and Employment Data..................................................................................76
Current Year Escalation..............................................................................................79
Data Modified for VALE ............................................................................................79
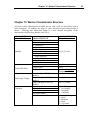
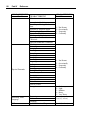
Chapter 16 Worker Characteristic Structure ................................................................87
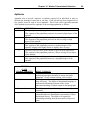
Aptitudes .....................................................................................................................89
Census/DOT Data .......................................................................................................91
Data, People, Things .................................................................................................103
Value Levels for Environmental Conditions and Physical Demands .......................104
Environmental Conditions .........................................................................................105
Physical Demands .....................................................................................................106
Reasoning, Math, Language ......................................................................................110
SVP (Specific Vocational Preparation) .....................................................................114
Specific Worker Characteristic Details .....................................................................115
Logical Operators ......................................................................................................115
Chapter 17 VALE Calculations ...................................................................................117
Scanning the DOT.....................................................................................................117
Compilation of Results..............................................................................................117
Chapter 18 Worklife Probability Sources and Calculations ........................................121
Probability of Life .....................................................................................................121
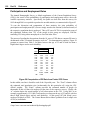
Participation and Employment Rates ........................................................................122
LPE Applied ..............................................................................................................125
Changes from the Previous Version of VALE 2000..................................................126
Life Table ..................................................................................................................128
Rates of Participation and Employment....................................................................129
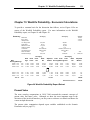
Chapter 19 Worklife Probability - Economic Calculations ..........................................131
Present Value .............................................................................................................131
Base Earnings ............................................................................................................133
Adjusted Earnings .....................................................................................................133
Future Value ..............................................................................................................134
Chapter 20 Education Dollar Source ...........................................................................137
Current Population Reports Data ..............................................................................137
Historical Income Tables ..........................................................................................139
Chapter 21 CPI Index Source and Calculations ..........................................................141
Part V Help...................................................................................................................143
Chapter 22 Troubleshooting........................................................................................143
Problems ....................................................................................................................143
Solutions ....................................................................................................................145
Chapter 23 Support Services.......................................................................................149
Free Support ..............................................................................................................149
Fee Support ...............................................................................................................149
Before You Call ........................................................................................................150
Premium Support.......................................................................................................150
Index
...........................................................................................................................151
iii
iv
Table of Contents
Foreword
Foreword
Welcome to VALE 2000 User’s Manual, your guide to placing a value on the loss of
expected earnings due to disability or death. In this manual, yo u will learn how to enter
information relevant to the analysis and how to generate and analyze loss computation
reports. In addition, this manual provides valuable reference information detailing many
of the sources used in the system's computations.
VALE 2000 is a tool for forensic experts. We emphasize the word “tool” because no
computer system can ever be an expert witness. Only a highly trained person is capable
of rendering an expert opinion. Computer programs merely provide an expedient means
to produce data that the expert is capable of producing manually (albeit much more
slowly). Thus, a major purpose of this manual is to provide the expert with the
information needed to replicate and confirm these computations.
This manual has five parts:
Introduction provides an introduction to the mechanics of the system and instructions on
installing the software. It also provides the US Department of Commerce’s definition of
occupational disability upon which the disability statistics are based.
Entering Your Data describes the data entry screens used by the system. These chapters
provide a valuable reference for the use of each field and highlight issues for
consideration when entering a case for analysis.
Using Your Data reviews the reports generated by the system. This is an important
resource for a thorough understanding of the output of the program.
Reference details underlying data and computations. This is a “must read” for users who
provide expert testimony using the output of the system.
Help provides information on troubleshooting and on obtaining support services.
History
VALE 2000 is the result of many years of government data collection. Data collected by
the US Department of Commerce, Bureau of the Census, and the US Department of
Labor form the basis of VALE 2000. The initial version of VALE was published in 1986,
and the first peer review article on the software was published in the Rehabilitation
Counseling Bulletin in June of 1987. Companion software titled Worklife Profile was
published in 1987 and sold as an adjunct to VALE. It enabled the user to perform both
the vocational and the economic aspects of an assessment designed to define the effect of
v
vi
Foreword
physical or mental impairment on lifetime loss of earning capacity. VALE has been
updated annually since its inception, with a variety of modifications occurring over the
years.
In the late 1980s, earnings for workers were reported out in the form of nondisabled and
disabled national dollars, and in the early 1990s, earnings for specific local labor markets
throughout the nation were incorporated.
Worklife Profile initially provided an assessment of probable worklife expectancy by
gender, level of educational attainment, and disability status. The user of the software
could modify the worklife expectancy for a disabled person by rendering an opinion as to
where a specific individual would fall on the continuum of disability to nondisability. In
1997, a disaggregation of the probability data permitted an analysis of probable worklife
expectancy for persons both severely disabled and not severely disabled.
VALE 2000 is a significantly revised piece of software that enables the user to define,
based on government data sources, earnings for nondisabled and disabled individuals by
gender and level of educational attainment. In addition, the user is able to report out
earnings based on a variety of vocational criteria as contained in the Dictionary of
Occupational Titles. Earnings data are reported for local, regional, or national labor
markets for employed persons with and without disability.
VALE 2000 combines a multitude of government data into one easy-to-use software
package. The software was designed for use by vocational experts, accountants,
statisticians, vocational rehabilitation counselors, economists, and psychologists involved
in defining the effect of disability on the loss of ability to perform work and earn money.
Acknowledgments
VALE 2000 is the result of a 15 year evolution involving a variety of professionals.
Vocational experts, vocational rehabilitation counselors, counseling psychologists,
clinical psychologists, economists, accountants, statisticians, sociologists, educators, and
social science researchers have contributed in varying degrees to the software as it
presently exists.
A variety of professionals were involved in the refinement of the original software
packages, and VALE 2000 is, most notably, the result of a development team consisting
of Dave Gibson, Darryl Rowe, and Gwen Holland. A special thanks is extended to John
P. Tierney for his conceptual assistance in the development of VALE over a 15 year
period and for his help in producing VALE 2000.
A. M. Gamboa, Jr., PhD, MBA
Chief Executive Officer
Vocational Economics, Inc.
Chapter 1
Part I
Before You Begin
Introduction
Chapter 1
Before You Begin
VALE 2000 User’s Manual and VALE 2000 follow many conventions that are standard
across Windows™ systems. This chapter outlines those conventions for users relatively
new to Windows™ software.
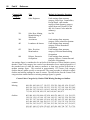
Manual Format
To facilitate reading of this manual, standard formatting conventions identify special
information.
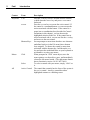
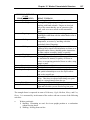
Formatting Convention
Triangular bullet (Ø)
Italic Type
SMALL CAPITALS
Type of Information
Step-by-step procedures. A numbered list will follow,
providing all the steps needed to complete a given
process.
Specialized terms. This will be either the name of a
book, a term used for the first time, or a placeholder for
items you must specify.
Command keys. The text identifies the name of a key to
press on your keyboard. (See the Navigation section
below.)
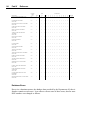
Navigation
Moving through windows and around a screen, or navigation, is standardized to a
considerable degree for any Windows™ software. For that reason, this manual dedicates
minimal attention to those details, and assumes user familiarity with the Windows™
standards. Defined below are a few basic terms used throughout the manual.
1
2
Part I
Context
Keyboard
Introduction
Term
TA B
ENTER
Shortcut Keys
Mouse
Click
Select
All
Active Control
Description
Press the T A B key to move forward between controls,
or hold down the SHIFT key and press T A B to move
backward.
Press the ENTER key to execute the active control. If
the control is a command button, ENTER executes the
action associated with the button. If the control is a
menu item or combination box (described in Control
Definitions in this chapter), ENTER chooses the
highlighted selection in the list. If the control has no
action associated with it, ENTER acts like the T A B key
and moves to the next control.
Screen prompts or menu items that have one character
underlined (such as in the File menu) have shortcut
keys assigned. To choose the control or menu item
associated with the shortcut key, hold down the ALT
key and press the underlined letter on your keyboard as
an alternative to using your mouse.
When prompted to “click” on an object, move the
mouse pointer over that object, press, and immediately
release the left mouse button. (The right mouse button
has no function in version 1.0 of VALE 2000.)
To select a control with your mouse, simply “click” on
it.
The control that currently has the focus of the system is
the active control. An active control has either
highlighted contents or a blinking cursor.
Chapter 1
Control Definitions
Tab
Before You Begin
3
Command Button
Text
Box
Combination Box
Check
Box
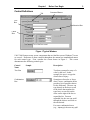
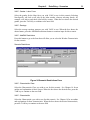
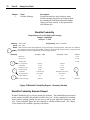
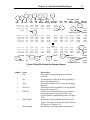
Figure 1 Typical Window
VALE 2000 features many screen components that are familiar to most Windows™ users
as controls. References to these controls throughout the manual use standardized names
for each control type. First, consider the screen shown in Figure 1. This screen
demonstrates the following control types:
Control
Name
Text Box
Combination
Box
Sample
Description
Text boxes prompt for entry of a
value by the user. In this
example, the user is to type the
client's date of injury.
Sometimes referred to as “dropdown” boxes, combination boxes
provide a list of possible choices
for the field entry. The user can
type directly in the box to scroll
to the choice that matches the
typed text, or can click on the
arrow on the right of the box to
expand the list. From an
expanded list, the user can scroll
through the choices and click on
the one desired.
For some combination boxes
(e.g., Attorneys) the user may add
a name that does not appear in the
4
Part I
Introduction
Control
Name
Sample
Description
a name that does not appear in the
box. In this case, the system
prompts for addition of the entry
to the standard list.
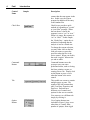
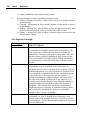
Check Box
Check boxes provide a quick
method of responding to “yes/no”
or “true/false” prompts. When
the box shows a check, the
response is set to “yes” or “true.”
When it is empty, the response is
“no” or “false.” In this sample,
the “Death Case “ option box is
unchecked, indicating that the
analysis is not for a death case.
To change the current selection,
you may either click on the box
with your mouse or press the
space bar when the box is the
active control. When you do this,
the result “toggles” between the
yes and no states.
Command
Button
Command buttons cause the
system to carry out some
predefined action, such as closing
the form, printing a report, or
creating a new case. Simply click
on the button or press ENTER
when the button is the active
control.
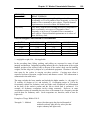
Tab
Tabs enable one screen to contain
multiple pages or parts. The
sample at the left presents three
tabs: Case Data, Scenarios, and
Past Loss. Each tab has a
different set of controls and
options for the user to consider.
You can move to a different tab
simply by clicking it.
Option
Button
Use of option buttons (not
included in Figure 1) may occur
when there is a small, finite
number of options, from which
the user must choose one. These
Chapter 1
Control
Name
Sample
Before You Begin
Description
the user must choose one. These
are similar to “radio buttons” in
that when one is turned on
(selected) the others are turned
off. Select one of the options by
clicking it with your mouse or
using the up and down arrows on
your keyboard when the option
group is active.
System Help
This manual is the primary source of assistance for the VALE 2000 user. It contains all of
the documentation necessary to understand the user interface and theory behind the
system for a forensic expert. In addition to the manual, the system provides two forms of
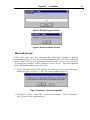
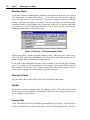
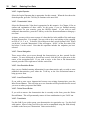
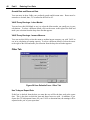
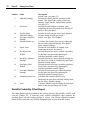
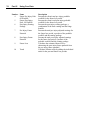
on- line assistance: control tips and status bar prompts. Figure 2 depicts the two forms.
Status Bar
The status bar at the lower, left- hand corner of the VALE 2000 screen contains a detailed
prompt for whatever control is currently active (the control in which the cursor rests). In
the sample, the active control is a text box for entry of the Case Reference. The label on
the screen simply says “Case Reference.” The status bar text provides the more detailed
prompt “Enter a unique name to identify this case on reports.”
This scenario is true for all controls. The limitations of screen size usually restrict the
descriptiveness of the label. Therefore, the status bar provides a more detailed prompt.
Control Tips
Control tips provide a method of presenting an abbreviated prompt for a control without
making it active. When you move the mouse pointer over a control and let it sit there for
a couple of seconds, a control tip appears next to the pointer. In Figure 2, the mouse
pointer is sitting over the “Case Reference” control, and the control tip reads, “Case
reference for report naming.”
Control tips are usually less detailed than a status bar prompt and are sometimes just a
rewording of the control's screen label. They are most useful for items that have no
screen label such as tool bar items and command buttons. That is, if only a graphic
appears, the control tip will provide a written description of the control.
5
6
Part I
Introduction
Control Tip
Status Bar
Figure 2 Sample Screen
Chapter 2
Chapter 2
Installation
Installation
Installation of VALE 2000 is a simple process, as outlined in this chapter. Whether you
are a novice or experienced computer user, these instruc tions should guide you through
the setup process in a few minutes.
Quick Start
Users that are inexperienced with the setup of Windows™ software should skip to the
System Requirements section of this chapter. More experienced users can review this
section and skip the remainder of the chapter. Please be sure to review the
README.TXT file before proceeding.
Except as noted below, installation of VALE 2000 is similar to all other Windows™
software setup programs. You should close all applications and disable virus detection
software before installation.
System Requirements
Before beginning the setup program, confirm that your computer meets the following
minimum requirements:
•
Pentium 133MHz Processor or higher
•
64 MB of RAM or higher
•
Free hard-disk space of up to 161 MB (This number indicates a maximum initial
installation; hard-disk space requirements vary depending on existing configuration.)
•
CD Drive
•
VGA color graphics monitor or higher
•
Microsoft Windows 95 OSR2 (or Windows 95 with Internet Explorer 4.0 or later)
or Windows 98 (referred to simply as Windows throughout this manual); not
tested on Windows ME
•
Microsoft Windows NT 4 SP6, Windows 2000, or Windows XP
You may verify items 1 and 2 by selecting the “System” icon of your Windows Control
Panel. The General tab displays the processor type and RAM under the “Computer”
7
8
Part I
Introduction
heading. The amount of free disk space displays in your Windows Explorer. For more
information on either of these standard utilities, see your Windows system
documentation or on- line help.
ReadMe File
The installation CD contains a file named “README.TXT.” This document contains the
most recent information on topics such as known conflicts with other software or
hardware, corrections or additions to the manual, or various technical nuances not
covered in the manual. We recommend that you read the contents before you install
VALE 2000. You may open the file with the Write utility that comes with Microsoft
Windows™ or with Microsoft Word™ just by double-clicking the file from Explorer.
Installation
Before beginning the installation, please close all active applications and disable any
virus protection software. This reduces the chances of conflicts that may cause an error
during setup.
Ø VALE 2000 Installation
1. Insert the setup CD. The setup program may start automatically at this point. If it
does, skip to step 3.
2. If your CD does not start automatically, go into Windows Explorer and select the
“setup” file on the CD-ROM drive. In most systems, this will appear with the
filename “setup.exe.” If you are missing the .exe file extension, make sure you select
the setup file with the file type identified as “Application.”
3. The first screen you will see (Figure 3) informs you that the program is copying files
needed for installation. You do not need to do anything here.
Figure 3 First Installation Screen
4. In some cases, you will see Figure 4 next. If you do, click “OK” and the program
will update necessary system files on your computer. When this is complete, you will
need to reboot your computer in order to continue with installation.
Chapter 2
Installation
Figure 4 System File Update Screen
5. If at this point, you see a screen informing you that you need to install Microsoft
Access 2000, see the Microsoft Access section on page 11.
6. The screen in Figure 5 should appear remind ing you to close any open applications.
You may see a different screen if VALE 2000 finds an application still running that is
a known conflict. (Leaving these applications open during installation may keep the
program from installing all the files VALE 2000 needs for its computations.) Click
the “OK” button.
Figure 5 Setup Introduction
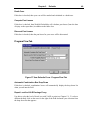
7. Next, a prompt for the path in which to install the system appears, as shown in Figure
6. The default path displays, and should suffice for most situations. However, you
may select a different path by pressing the “Change Directory” button. Once you are
satisfied with the path, press the installation icon.
9
10
Part I
Introduction
Figure 6 Setup Path Selection
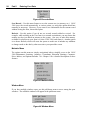
8. The program next adds a new item to the program group on your computer (Figure 7).
Click “Continue.”
9. Figure 8 will appear to inform you of the progress of the installation.
10. When installation is complete (Figure 9), restart your computer.
Figure 7 Choose Program Group
Chapter 2
Installation
Figure 8 Setup Progress Screen
Figure 9 Setup Complete Screen
Microsoft Access
VALE 2000 relies upon data structures and relationships common in database
management systems. In fact, the underlying engine that runs VALE 2000 is Microsoft
Access 2000. However, you do not need to own Microsoft Access to use VALE 2000.
The setup process installs a runtime version of Access for you. This version provides
all the functionality needed to run VALE 2000.
1. If you don't have Access 2000 installed, the following set of screens will appear
following Figure 3 or Figure 4. Click “OK” to the prompt in Figure 10.
Figure 10 Access Setup Introduction
2. In Figure 11, choose "Install Now" and accept the defaults. Choose “Customize”
only if you are a very experienced user.
11
12
Part I
Introduction
Figure 11 Ready to Install Screen
3. This will be followed by several installing and configuring screens, such as the one
shown in Figure 12.
Figure 12 Installation Progress Screen
4. Click “Yes” to reboot your computer (Figure 13).
Figure 13 Installer Information
Chapter 2
Installation
13
5. You will see Figure 14 informing you of the progression of the runtime installation.
When this is complete, you will continue with the VALE 2000 program installation in
Figure 5.
Figure 14 Runtime Installation Progression
Removal
In the event that you need to remove VALE 2000 from your computer, do not simply
delete the files in the program path. This will not completely remove all components of
the system. Instead, follow the steps outlined below.
Ø VALE 2000 Removal
1. From the Windows™ Control Panel, choose “Add/Remove Programs.”
Windows™ Add/Remove Programs Properties window displays.
The
2. Choose “VALE 2000 ” and press the “Remove” button.
3. When asked if you are sure, press the “Yes button.
4. When the removal program finishes, restart your computer.
This process leaves the data files in the VALE 2000 program path. If you are sure you
will not need these, you may manually delete them also.
14
Part I
Introduction
Chapter 3
Chapter 3
Occupational Disability Definition
Occupational Disability Definition
Both the Worklife Expectancy and the Earning Capacity sections of the VALE 2000
program allow you to select parameters based on disability status. The program uses the
definition of occupational disability as defined by the US Department of Commerce,
Bureau of the Census. 1 In this definition, a person is considered to have a work disability
if one or more of the following conditions are met:
Not Severely Disabled:
1. Identified by the March Supplement question “Does anyone in this household have a
health problem or disability which prevents them from working or which limits the
kind or amount of work they can do?”
2. Identified by the March Supplement question “Is there anyone in this household who
ever retired or left a job for health reasons?”
3. Received VA disability income in previous year.
Severely Disabled:
4. Identified by the core questionnaire as currently not in the labor force because of a
disability that is expected to last for at least six months.
5. Identified by the March Supplement as a person who did not work at all in the
previous year because of illness or disability.
6. Under 65 years old and covered by Medicare in previous year.
7. Under 65 years old and received Supplemental Security Income (SSI) in previous
year.
1
This definition can be found on the Census Bureau web site at http://www.census.gov/
hhes/www/disable/cps/cpsworkd.html
15
16
Part I
Introduction
Chapter 4
Part II
Managing Cases
Entering Your Data
Chapter 4
Managing Cases
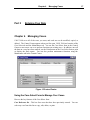
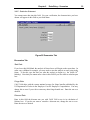
VALE 2000 saves all of the cases you enter, and each one can be modified, copied, or
deleted. The Control Center appears when you first open VALE 2000 and consists of the
Case Select tab and the Maintenance tab. You use the Case Select form in the Control
Center to start a new case or to perform functions on existing cases. In addition, once all
the data on a case have been entered, use the Print button on the Case Select form to print
or display the final reports. You can also perform maintenance functions using the
Maintenance tab in the Control Center.
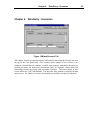
Figure 15 Control Center
Using the Case Select Form to Manage Your Cases
Here are the key features of the Case Select form:
Case Reference list - This box lists cases that have been previously entered. You can
select any case from this list to copy, edit, delete, or print.
17
18
Part II
Entering Your Data
Sort by . . . option buttons - You can use these buttons to alter the order in which cases
appear on the Case Reference list.
Filter by . . . text boxes - You can use these boxes to select a subset of your cases to
appear on the Case Reference list.
Add Case button - You can use this button to go to a blank case form to enter data on a
new case.
Copy Case button - Once a case is highlighted, you can use this button to create a
duplicate of the case.
Edit Case button - Once a case is highlighted, you can use this button to go to the Case
form where you can view and edit the data.
Delete Case button - Once a case is highlighted, you can use this button to delete it from
VALE 2000.
Print button - Once a case is highlighted, you can use this button to go to the Print
Dialog form where you can view or print final reports.
Each of these functions is described in detail below.
Adding a New Case
Ø To add a new case
1. Click on the Add Case button or press ALT- A or press ENTER when the Add Case
button has focus.
2. Complete the Case form as described in the next chapters.
Selecting an Existing Case
Ø To select an existing case from a list of cases
1. Move the mouse pointer down the list until the case you want has focus. Use the
scroll bar and buttons on the right side of the window if necessary to show more
cases.
2. Click anywhere on the highlighted case.
Sorting
The list in the Case Reference box contains the following information about your existing
cases: Case Reference, Attorney, Consultant Name, and Report Date. In order to
Chapter 4
Managing Cases
simplify case selection, you may sort the list by any of these four criteria. Select the one
you want by clicking on the appropriate Sort by . . . option button.
Note: Sorting occurs by the first letter in the field and, therefore, will be most useful if
you enter all client names last name first, e.g. Jones, John. If you enter names like John
Smith, they sort by first name instead of last name. Also, use a consistent rule for entries
in the Case Reference field, like Attorney/Client (e.g. Smith/Jones), and sorting by this
field will be a very easy way to find cases.
Filtering
The list in the Case Reference box contains all existing cases. To make it easier to find a
case, you can display only a subset of your cases using the Filter by . . . combination and
text boxes. Note that filtering the cases removes only unselected cases from display in
the list; they are still in the system. To view all your cases, delete all text from all four
Filter by . . . text and combination boxes.
The filter can be based on a full name like "Smith, John," or you can insert * as a wildcard anywhere in the string. Some examples: s* will list all names that begin with s,
*mc* will list all names that have mc anywhere in them, and *son will list all names that
end in son. If you enter a filter without a wild-card, VALE 2000 appends the wild-card
character at the end.
Note: Filters are additive. For example, if you have Smith in the Attorney box and Jones
in the Consultant Name box, only cases with attorney Smith and consultant Jones display.
Ø To filter all cases by a particular field
1. Click in the text box for the field you wish to filter. Start typing the name or
reference you wish to find.
Ø To remove all filters and display all cases
1. Select the text in each of the four Filter by boxes and press the DELETE or
BACKSPACE key to delete.
Copying an Existing Case
Ø To make a duplicate copy of an existing case
1. Select the case as described above.
2. Click on the Copy Case button or press ENTER when the Copy Case button has
focus.
3. This will open the Case form for the duplicate case, identified as a duplicate in the
Case Reference field. For example, if the original case had a Case Reference of
19
20
Part II
Entering Your Data
"Smith/Jones," the copy has a Case Reference of "Copy of Smith/Jones." Once in the
Case form, yo u can edit the Case Reference or any other field of the duplicate. See
the next chapters for additional details about entering and editing data.
Editing an Existing Case
Ø To edit an existing case
1. Select a case as described above.
2. Click on the Edit Case button or press ALT- E or press ENTER when the Edit Case
button has focus.
3. This will open the Case form for the selected case. See the following chapters for
additional details about editing data.
Deleting an Existing Case
Ø To delete an existing case
1. Select the case as described above.
2. Click on the Delete Case button or press ALT- D or press ENTER when the Delete
Case button has focus.
3. This will bring up a window asking whether you want to continue with this action.
Deleting an existing case is permanent, and all of your data on the selected case will
be lost if you continue. Choose Yes to continue or No to keep your data.
Printing an Existing Case
Ø To print or display the report for an existing case
1. Select a case as described above.
2. Click on the Print button or press ALT- I or press ENTER when the Print button
has focus.
3. This will open the Print Dialog form for the existing case.
additional details about printing and displaying reports.
See Chapter 11 for
Maintenance Form
Use this button to access the Maintenance features of VALE 2000. See Chapter 8 for
more information on the Maintenance features.
Chapter 5
Chapter 5
Data Entry – Case Data
Data Entry - Case Data
This chapter focuses on entering basic data using the Case Data tab near the top of the
Case form. The forms in this section reflect the VALE 2000 default settings. You may
alter these defaults to simplify the data entry process. See Chapter 9 to learn what
defaults are available, and how to alter them.
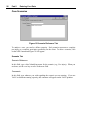
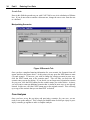
Figure 16 Case Data Form
When you add a new case, the Case Data form is displayed. Enter data on this screen as
described below. Information entered in these fields is used to identify the case on
reports and on the Case Select form. Use the T A B key to move quickly among the fields
on the form. When done, move to the next data entry screen by clicking the Scenarios
tab to continue the data entry process.
Case Reference
Type in this field the reference by which you want to refer to the case. Use a system to
name cases, as this reference is available on the Case Select form to help find existing
cases. One system would be to use the attorney’s last name and client’s last name as the
Case Reference, e.g. Smith/Jones. When you are done, use the T A B key to move to the
next field.
21
22
Part II
Entering Your Data
Attorney Name
If you have selected a default attorney, that name will already be in the box (see Chapter
9 for information on setting default values). If you want to use this attorney, then just
press T A B again to move to the next field. If you want to change the name to a different
attorney, start typing the attorney’s last name. As you enter letters, the system attempts
to match the letters you are typing to an existing entry in the list. If it arrives at the name
you wish to use, you can stop typing and press T A B to move into the next field (the
highlighted name appears in the Attorney box).
Figure 17 Attorney - Client Information Form
If there is no match, continue typing the attorney’s name. When you press T A B to move
out of the field, the Client Information form shown above will open, giving you the
option of adding this new attorney to your attorney list.
If you click on the OK button, this name will be available in your list for this and future
cases. If you click on the Cancel button, you will return to the Attorney field, and it will
have returned to its previous value. Before selecting OK, make sure the name is exactly
as you want it to appear on the report and in your list of attorneys.
Attorney's Client
Type the client's name in this field as you wish it to appear on the reports.
Gender
Select male or female as appropriate for the Attorney's Client. This is the field to which
the life expectancy data will refer. When the box shows the correct status, press the T A B
key to continue to the next field.
Prepared By
VALE 2000 allows you to have multiple experts named for your reports. You identify an
expert for a particular case by selecting him or her in the Prepared By box. This box
Chapter 5
Data Entry – Case Data
operates exactly like the Attorney Name box. When you have finished work on this field,
press T A B to move to the next sectio n of the form.
Client Identification
In this section, you enter key information about the client and the analysis that will be
used for several computations, such as life expectancy, past losses, and others.
Death Case
If the client is deceased, check this box by clicking on it or by pressing the space bar
when the field is highlighted.
Show Earnings
If you want the VALE runs (the assessment of labor market access and earning capacity)
for this case to display dollar amounts, check this box by clicking on it or by pressing the
space bar when the field is highlighted. If the box is not checked, the VALE runs will
display labor market access only.
CPI Adjustment
If you want CPI adjustments on the dollar amounts in the report, check this box by
clicking on it or by pressing the space bar when the field is highlighted. If the box is not
checked, the program will use the dollars as entered into the program.
Birth Date
Enter the client’s date of birth and press the T A B key to continue to the next field when
done.
Report Date
VALE 2000 will default to the date you enter the case. If you wish to use another date,
type over the date in the field. This is the date that ends the calculation of past loss and
begins future loss. Also, if you have the CPI Adjustment box checked (see above),
dollars will be adjusted to the year of the report date.
Injury Date
Enter the client’s date of injury and press the T A B key to continue to the next field.
23
24
Part II
Entering Your Data
Case Comments
Use this field to enter any description or information about this case, up to 255
characters. These comments will be displayed on the Case Summary report.
Chapter 6
Chapter 6
Data Entry – Scenarios
Data Entry - Scenarios
Figure 18 Blank Scenario Tab
This chapter focuses on entering scenario and analysis data using the Scenario tab near
the top of the Case Entry form. The Scenarios form consists of two sections, Case
Scenarios, which define the earnings, worklife, and economic information necessary to
perform pre- injury and post- injury assessments, and Case Analyses, which define the
relationship between pre- injury and post- injury scenarios. The forms shown in this
section reflect the VALE 2000 defaults. You may alter these defaults to simplify the data
entry process. See Chapter 9 to learn what defaults are available, and how to alter them.
25
26
Part II
Entering Your Data
Case Scenarios
Figure 19 Scenario Reference Tab
To analyze a case, you need to define scenarios. Each scenario represents a complete
pre-injury or a complete post-injury possibility for the client. To enter a scenario, click
on the NEW button and Figure 19 will appear.
Scenario Tab
Scenario Reference
In this field, type a brief identifying name for the scenario (e.g., Pre- injury). When you
are done, use the T A B key to move to the next field.
Comments
In this field, type whatever you wish regarding the scenario you are entering. If you use
VALE to determine earning capacity, this comment will appear on the VALE printout.
Chapter 6
Data Entry – Scenarios
Worklife Tab
Figure 20 Worklife Tab
Gender - Participation and Employment
Select male or female as appropriate for your worklife expectancy analysis. When the
box shows the correct gender, press the TAB key to continue to the next field.
Educational Level
Select the educational level you wish to use for this scenario. When the box shows the
correct level, press the TAB key to continue to the next field.
Disability Status (Worklife)
Select the disability status you wish to use for this scenario. When the box shows the
correct status, press the TAB key to continue to the next field.
2nd Disability Stats (if Range)
If you wish to place the client in a range between two average disability points, select the
first end of the range in the Disability Status (Worklife) field and the second endpoint in
the 2nd Disability Stats (if Range) field. When the two fields show the correct endpoints
of your range, press the TAB key to continue to the Continuum Placement field.
27
28
Part II
Entering Your Data
Continuum Placement
This field will be unavailable for use unless you have selected a disability status in the 2nd
Disability Stats (if Range) field. Enter in this field the decimal that represents the client's
placement on the continuum for this scenario.
For example, if you wis h to use a continuum placement that is halfway between the
worklife for average not severely disabled and average nondisabled, select Disabled - Not
Severely in the Disability Status (Worklife) field. Second, select Not Disabled in the 2nd
Disability Stats (if Range) field. The Continuum Placement field will now be available
for use. Enter this field and type in .5 to represent your halfway placement.
Remember when using this field that the higher the decimal, the higher the continuum
placement. In the above example, typing .75 in this field will place the client threefourths of the way between your two endpoints, closer to average nondisabled.
When the box shows the desired placement, press the TAB key to continue to the next
field.
End Age
In this field, type the age at which you want the worklife expectancy calculation to end.
VALE 2000 ships with a default age of 90, the highest age currently available. Typing 90
will take the analysis through age 89 and will end on the client's 90th birthday.
Probabilities of LPE
In this field, you choose how you want the worklife expectancy calculated in terms of the
probabilities of life, participation, and employment (see Chapter 18 for an explanation of
these calculations). If a box is checked, the program will calculate the value of the field.
For example, VALE 2000 ships with all boxes checked except for the past loss Life box.
This represents a typical analysis for a non-death case. Since we know that the client is
still living, we do not wish to calculate the probability of life for the past loss, but do
want to calculate the probability of life for the future loss. If you wish to calculate a full
worklife expectancy to the End Age, then remove all four checks. The program will then
calculate the lifetime loss assuming no reduction in worklife expectancy attributable to
the probabilities of life, participation, and employment.
Earning Capacity Tab
Earnings Source
This field has three options, Other, Education, and VALE.
for the Education (national averages) and VALE options.
from another source, such as actual earnings, choose the
When the box shows the desired earnings source, press the
next field.
VALE 2000 provides values
If you wish to use a dollar
Other option from this list.
TAB key to continue to the
Chapter 6
Data Entry – Scenarios
Earnings Source - Other
Figure 21 Earning Capacity Tab - Other
Other - Earning Capacity
If you have chosen the Other option in Earnings Source, the only field available will be
Earning Capacity. Enter into this field the value you wish to use for the client's annual
earnings.
Earnings Source - Education
If you have chosen the Education option in Earnings Source, other fields will become
available to you.
Figure 22 Earning Capacity Tab - Education
29
30
Part II
Entering Your Data
Education - Disability Status
Select the disability status you wish to use for the education dollars in this scenario.
When the box shows the desired status, press the TAB key to continue to the next field.
Education - Gender - Earnings
Select the gender you wish to use for the education dollars in this scenario. When the box
shows the desired gender, press the TAB key to continue to the next field.
Education - Education Proxy
Select the educational level you wish to use for the education dollars in this scenario.
Earnings Source - VALE
Figure 23 Earning Capacity Tab - VALE
VALE - Disability Status
Select the disability status for the dollars you wish VALE to use in this scenario. When
the box shows the desired status, press the TAB key to continue to the next field.
VALE - Gender - Earnings
Select the gender for the dollars you wish VALE to use in this scenario. When the box
shows the desired gender, press the TAB key to continue to the next field.
VALE - Labor Market
Select the labor market you wish VALE to use in this scenario. When the box shows the
desired region, press the TAB key to continue to the next field.
Chapter 6
Data Entry – Scenarios
VALE - Gender - Labor Force
Select the gender for the labor force you wish VALE to use in this scenario. Selecting
Non-Specific will look at all jobs in the labor market, whereas selecting female, for
example, will look at only those jobs held by women. When the box shows the desired
gender, press the TAB key to continue to the next field.
VALE - Earnings
Select the average earnings measure you wish VALE to use. When the box shows the
desired status, press the Add/Edit Restrictions button to continue input for this scenario.
VALE - Add/Edit Restrictions
Press this button to go to the form that will allow you to select the Worker Characteristics
for the scenario.
Scenario Restrictions
Figure 24 Scenario Restrictions Form
VALE - Characteristic Class
Select the Characteristic Class you wish to use for this scenario. See Chapter 16 for an
outline and explanation of these classes. When the box shows the desired class, press the
TAB key to continue to the next field.
VALE - Characteristic
Select the Characteristic you wish to use for this scenario. See Chapter 16 for an outline
and explanation of these characteristics. When the box shows the desired characteristic,
press the TAB key to continue to the next field.
31
32
Part II
Entering Your Data
VALE - Logical Operator
Select the Logical Operator that is appropriate for this scenario. When the box shows the
desired operator, press the TAB key to continue to the next field.
VALE - Characteristic Value
Select the Characteristic Value that is appropriate for this scenario. See Chapter 16 for an
outline and explanation of these values. At this point, if you are finished entering
characteristics for your scenario, press the OK/Exit button. If you wish to enter
additional characteristics, press the TAB key or the New Restriction button to bring up a
new form.
At times, you may wish to enter a range of values that lies in the middle of the total range
for that characteristic. For example, you may wish to do a run looking at jobs requiring
an SVP of 3, 4, 5, or 6. To do this, select Between in the Logical Operator field. When
you do this, a second Characteristic Value will appear. Select 3 in the first value field,
and select 6 in the second. Note that this operation includes the endpoints you have
selected.
VALE - Record Navigation
These arrows allow you to move through the characteristics you have entered for this
scenario. To move backward or forward one record, click the left or right arrow in the
center of the navigation field. If you wish to move to the first or last characteristic
entered, press the left or right arrow with the vertical line.
VALE - New Restriction Button
Once you are finished entering information for one characteristic and you wish to enter
additional characteristics, press either the TAB key or the New Restriction button to
bring up a new form.
VALE - Insert Record Button
If you wish to enter a new characteristic between two existing characteristics, press the
Insert Record Button. This will bring up a new form that will be placed before the record
you were on when you pressed the button.
VALE - Delete Record Button
If you wish to remove the characteristic that is currently on the form, press the Delete
Record Button. This will permanently remove it from consideration in your VALE run.
VALE - Parenthesis
Use this field if you wish to group your characteristics in a particular way. Use this field
with caution. Most of what you wish to do can be accomplished using the fields already
available on the form (see Characteristic Value section above).
Chapter 6
Data Entry – Scenarios
VALE - Restriction Statement
You cannot enter data into this field. For your verification, the characteristics you have
chosen will appear in this field as you finish them.
Figure 25 Economics Tab
Economics Tab
Start Date
If you leave this field blank, the analysis of future losses will begin on the report date. In
some cases, children for example, you may need to start the analysis at some point in the
future. To do this, type the date you want the analysis to begin (e.g., the child's 18th
birthday). Note that you cannot enter a date in this field if you also want to calculate past
loss.
Fringe Rate
VALE 2000 ships with the current national average for fringe benefits published by the
US Department of Labor in the Employer Cost for Employee Compensation. You may
change this to zero if you wish or enter any other fringe benefit rate. Enter the rate as a
decimal.
Discount Rate
Enter in this field the discount rate you wish VALE 2000 to use in its calculation of
lifetime loss. If you do not want to consider a discount rate, change the rate to zero.
Enter the rate as a decimal.
33
34
Part II
Entering Your Data
Growth Rate
Enter in this field the growth rate you wish VALE 2000 to use in its calculation of lifetime
loss. If you do not want to consider a discount rate, change the rate to zero. State the rate
as a decimal.
Manipulating Scenarios
Figure 26 Scenario Tab
Once you have completed entering information for your scenario, the Scenario form will
appear similar to the picture above. At this point, you may press the NEW button to enter
a second scenario. If, however, you wish to change the existing scenario in some way,
click the EDIT button next to the scenario name. This will take you back into the
scenario entry screens for editing. If you decide you no longer need a particular scenario
for your case, click the DEL button next the scenario name you wish to delete. At times,
you will want to enter an additional scenario that is similar in most ways to one already
entered. In this case, click the COPY button next to the original scenario. This will bring
up a copy of the scenario that you can then EDIT as desired.
Case Analyses
Once you have set up the pre- injury and post- injury scenarios for your case, you are
ready to set up the analyses. This is simply an identification of which pre- injury or postinjury scenarios go together to make a complete analysis.
Chapter 6
Data Entry – Scenarios
Name
Enter the name by which you want to identify the analysis. For a case with one analysis,
a name as simple as "Analysis" could be sufficient. Otherwise, a more specific name is
recommended.
Pre-injury
In this field, select the scenario you want to use as pre- injury for the Name you entered
by choosing it from the drop down list or typing the name in the field.
Post-injury
In this field, select the scenario you want to use as post- injury for the Name you entered.
If the case is one of death or total disability, skip this field and enter nothing.
EDIT and DEL buttons
Once an analysis is set up, you may use these buttons to edit them or to delete them as
desired.
35
36
Part II
Entering Your Data
Chapter 7
Chapter 7
Data Entry – Past Loss
Data Entry - Past Loss
This chapter focuses on entering past loss data using the Past Loss tab near the top of the
Case Entry form. The form shown in this section reflects the VALE 2000 defaults. You
may alter these defaults to simplify the data entry process. See Chapter 9 to learn what
defaults are available, and how to alter them.
Figure 27 Past Loss Form
Past Loss
If you wish to calculate past loss for your case, activate this field by clicking on the Past
Loss box or by pressing the SPACE BAR when the field is highlighted. When this box
is activated, VALE 2000 will calculate loss of past earnings from the date of injury to the
report date.
Discount Pre-Injury Earnings
If you wish to discount the past loss, activate this field by clicking on the box or by
pressing the SPACE BAR when the field is highlighted. See Chapter 19 for a
description of the calculation.
37
38
Part II
Entering Your Data
Actual Earnings From Date of Injury to Report Date
When calculating past loss, type in this field the total amount earned by the client from
the date of injury to the report date. Note that for accuracy, this should be stated in terms
of current dollars (or a value consistent with your pre- injury earning capacity) and should
include fringe benefits if benefits were included pre- injury.
Chapter 8
Chapter 8
Maintenance
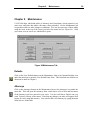
Maintenance
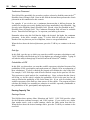
VALE 2000 ships with blank tables of Attorneys and Consultants, which expand as you
enter cases, and other data tables with some values preloaded. Use the Maintenance tab
to open these tables to make changes or additions. You can also open any of these tables
using the icons at the top of the screen just below the menu bar (see Figure 46). Hold
your cursor over an icon to see which table it opens.
Figure 28 Maintenance Tab
Defaults
Click on the User Defaults button on the Maintenance form or the Options/Defaults icon
under the menu bar to open the User Default Entry form. This form and user defaults are
discussed in detail in Chapter 9.
Attorneys
Click on the Attorneys button on the Maintenance form or the Attorneys icon under the
menu bar. This will open the Attorneys form, which shows a list of first and last names
of the attorneys you have entered in your cases. Use the scroll bar to find the one you
want. You may edit any of the names. Note that any changes you make will appear in all
reports for cases using that attorney. You can also add a new attorney by typing the name
in the last row of the table.
39
40
Part II
Entering Your Data
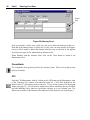
Delete
Icon
Figure 29 Attorney Form
Each row includes a delete icon, which you can use to delete the attorney on that row.
Note that if the attorney name is used in any of your cases, an error message will appear,
and you will be unable to delete that attorney until the cases in which he or she appears
are deleted (see page 20 for information on deleting cases).
When finished with the Attorney form, click on the Close button to return to the
Maintenance form.
Consultants
The Consultants form operates just like the Attorneys form. Please refer to that section
(above) for details.
CPI
Open the CPI Maintenance form by clicking on the CPI button on the Maintenance form
or the Consumer Price Indices icon under the menu bar. VALE 2000 defaults are the
indices from 1971 through the most recent year. If you use the system's CPI adjustment
feature (see page 23), you will need to update these indices when they become available
and add additional years when the report date advances to a new calendar year. The
indices are available on the Internet at the Bureau of Labor Statistics site (stats.bls.gov).
Chapter 8
Maintenance
Figure 30 CPI Maintenance Form
When done with the CPI Maintenance form, click on the Close button to return to the
Maintenance form.
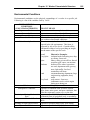
Education
Open the Education Maintenance form by clicking on the Education button on the
Maintenance form or the Education icon under the menu bar. The dollars available in
VALE 2000 are described in Chapter 20.
Figure 31 Education Earnings Maintenance Form
The Education Earnings Maintenance form works similarly to the Attorney form (see
page 39 for details). Make your selection in each column for the year of the dollar,
disability status, gender, education level, then enter the dollar in the last column. You
may edit existing dollars or add dollars for new years in the blank field on the bottom of
the form. Note that any changes you make will appear in all reports for cases using that
category.
41
42
Part II
Entering Your Data
When done with the Education Earnings Maintenance form, click on the Close button to
return to the Maintenance form.
Error Log and Diagnostics
These should be used if necessary following contact with Vocational Econometrics
technical personnel. They may not be available to users of the current version of VALE
2000.
Chapter 9
Chapter 9
Defaults
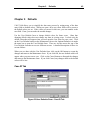
Defaults
VALE 2000 allows you to simplify the data entry process by setting many of the data
entry fields to default values. When you open a new case, these fields will be preset to
the default values you set. If the values are correct for this case, you can continue to the
next field. If not, you can make the needed changes.
Use the User Defaults form to change default values for future cases. (Note that
changing default values does not change any data in existing cases. It alters only the
default values that will appear when you next open the Case form for a new case). Click
on the User Defaults button on the Maintenance form or the Options/Defaults icon under
the menu bar to open the User Defaults form. There are six tabs across the top of the
User Defaults form that access six different screens. A detailed description of these six
screens follows.
When you are done with the User Defaults form, click on the OK button to accept the
changes and return to the Maintenance form. If you click OK, the new default values will
appear when you start a new case. Click on the Cancel button to disregard the changes
and return to the Maintenance form. If you click Cancel, any changes made to the default
values will be lost.
Case ID Tab
Figure 32 User Defaults Form - Case ID Tab
43
44
Part II
Entering Your Data
Attorney
VALE 2000 ships with no default set for attorney. If you do most of your work for one
attorney, you may find it helpful to use his or her name as the default value for this field
on the Case Data form. To select a default attorney, click on the arrow to the right of the
field and select an attorney from the drop down list that appears. If the name you want to
use does not appear on the list, you can use the Maintenance feature to add the name to
your Attorneys table, and then it will be available to you on this list. (See page 39 for
information about adding a new attorney.)
Consultant
This default operates in the same manner as the Attorney default.
Case Comments and Scenario Comments
You can use these to add default comments for your cases or scenarios if desired.
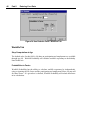
Client ID Tab
Figure 33 User Defaults Form - Client ID Tab
Education Level
VALE 2000 ships with a default value of Non-Specific. If you do most of your work with
clients at a specific education level, you may find it helpful to use this level as the default
value for this field on the Worklife form. To select a default education level, click on the
arrow to the right of the field and select the level from the drop down list that appears.
Chapter 9
Defaults
Disability Status
The VALE 2000 default for Disability Status is Not Disabled. To select a different
default, click on the arrow to the right of the field and select the disability status from the
drop down list that appears.
Gender - Actual (Life)
The VALE 2000 default for this field is Male. You may select male or female as the
default value for the calculation of life expectancy in the Worklife Probability
calculation. To select a different default, click on the arrow to the right of the field and
select the desired gender from the drop down list that appears.
Gender - Labor Force
The VALE 2000 default for the labor force gender is Non-Specific. You may select a
default value for the gender you wish VALE to use when calculating the number of
people employed in a specific labor market (see also page 31). To select a different
default, click on the arrow to the right of the field and select the desired gender from the
drop down list that appears.
Gender - Earnings
The VALE 2000 default for the earnings gender is Not Specific. You may select a default
value for the gender you wish VALE to use when calculating earning capacity. To select
a different default, click on the arrow to the right of the field and select the desired gender
from the drop down list that appears.
Gender - Participation and Employment
The VALE 2000 default for this field is Male. You may select a default value for the
gender you wish Worklife Probability to use when calculating worklife expectancy. To
select a different default, click on the arrow to the right of the field and select the desired
gender from the drop down list that appears.
45
46
Part II
Entering Your Data
Figure 34 Use Defaults Form - Worklife Tab
Worklife Tab
Stop Computation at Age
The default value for this field is 90 (data on participation and employment are available
through age 89). Worklife Probability will calculate worklife expectancy to the birthday
listed in this box.
Probabilities to Factor
Worklife Probability has the ability to calculate worklife expectancy by independently
using or ignoring the life factor and the participation and employment factor for past and
for future losses. If a given box is checked, Worklife Probability will include that factor
in its calculations.
Chapter 9
Defaults
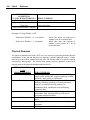
Financial Tab
Figure 35 User Defaults Form - Financial Tab
Show Earnings
If this box is checked (the default value), then VALE will display the earning capacity for
your run. If it is not checked, the program will display labor market access only.
Inflate by CPI
If this box is checked (the default value), then VALE will update the labor market dollars
to the year of your report date using the CPI. If it is not checked, the program will
display dollars for the chosen labor market without updating.
Earning Proxy
You can use this field to select the earning capacity type you usually use in your
calculations. To select a different default, click on the arrow to the right of the field and
make your selection from the drop down list that appears.
Fringe Benefit Rate
You can enter in this field a fringe benefit rate of your choice. The default is the current
national average rate based on the Employer Costs for Employee Compensation available
from the Bureau of Labor Statistics.
47
48
Part II
Entering Your Data
Growth Rate and Discount Rate
You can enter in these fields your preferred growth and discount rates. Rates must be
entered as a decimal; thus, 5% is entered in the field as .05.
VALE Proxy Earnings - Labor Market
You can leave this field blank or use it to select the labor market you usually use in your
calculations. To select a different default, click on the arrow to the right of the field and
make your selection from the drop down list that appears.
VALE Proxy Earnings - Income Measure
You can use this field to select the mean or median income measure you wish VALE to
use in its calculation of earning capacity. To select a different default, click on the arrow
to the right of the field and make your selection from the drop down list that appears.
Other Tab
Figure 36 User Defaults Form - Other Tab
Use Today as Report Date
If this box is checked, then the date you enter the case will be the date used as the report
date. This is the date at which the past and future losses are split. In addition, if you
choose the CPI Adjustment feature for your VALE or education runs, the earnings will be
adjusted to the year of your report date.
Chapter 9
Defaults
Death Case
If this box is checked, then your case will be marked and calculated as a death case.
Compute Past Losses
If this box is checked, then Worklife Probability will calculate past losses (from the date
of injury to the report date) in addition to the future loss.
Discount Past Losses
If this box is checked, then the past losses for your cases will be discounted.
Program Flow Tab
Figure 37 User Defaults Form - Program Flow Tab
Automatic Combination Box Drop Down
If this box is checked, combination boxes will automatically display the drop down list
when you tab into the field.
Report Level for VALE Earnings Proxy
Use this to select the level of detail you wish VALE to print (see Chapter 13). To select a
different default, click on the arrow to the right of the field and make your selection from
the drop down list that appears.
49
50
Part II
Entering Your Data
Worklife Probability Report
Use this to select the type of report you wish Worklife Probability to print (see Chapter
14). To select a different default, click on the arrow to the right of the field and make
your selection from the drop down list that appears.
Show Date/Time Stamp on Reports
If this box is checked, the printouts will show the date and time you ran them at the
bottom of the page.
Chapter 10 Menus and Toolbars
Chapter 10 Menus and Toolbars
VALE 2000 provides two tools that give you alternative ways of navigating among the
various windows: pull-down menus and buttons on a toolbar. This chapter describes
these features in detail. In addition, you may access maintenance and troubleshooting
features using these tools.
Start Menu
Consistent with other Windows™ 9x applications, VALE 2000 creates a start menu group
to provide access to its programs. This enables you to open VALE 2000 as well as to start
some other components of the application without having the main program open. The
choices ava ilable are described below.
VALE 2000
This is the main point of entry to the VALE 2000 application. You may also provide
other methods to start the program by creating a shortcut to the “VALE2000.MDE” file
on your desktop or toolbar.
Compact and Repair
If used frequently, VALE 2000's data files will naturally expand as you add and delete
data. This expansion may cause the files to be inefficiently stored on your computer's
hard drive. To optimize the storage, a "Compact and Repair" option is added to your
Start Menu. This routine should be run on a periodic basis -- monthly or possibly weekly
for frequent users. Before starting this routine, you should exit VALE 2000 and, if you
are on a network, make sure others are not using the system either. When you select this
option, the screen in Figure 38 appears.
Figure 38 Compact and Repair Screen
Choose “Do Nothing” to exit the routine without compacting. Choose “Compact Only”
to compact but not repair the files. Choose “Compact and Repair” to compact and repair
51
52
Part II
Entering Your Data
the files. We recommend the “Compact and Repair” option. It adds only a small amount
of time over the “Compact Only” option, and can do no harm.
ReadMe
This provides access to the “README.TXT” file, which contains updates to the manual,
technical tips, and other up-to-date data. For more information, see page 8.
Menu Bar
Six pull-down menus are located in the menu bar near the top of the VALE 2000 window.
You can display the pull-down menus either by clicking on one of the selections (File,
Edit, Records, Maintain, Window or Help) or by using a shortcut key (for example, press
ALT - F to pull down the File menu). The underlined letter in the menu name indicates the
shortcut key to use for that menu. Once displayed, you can select any of the choices by
using your mouse or the shortcut key for that selection.
File Menu
This menu contains six selections, four of which are common to many Windows™
applications: Page Setup, Print Preview, Print, and Exit. Note that VALE 2000 provides
built- in control of the Page Setup and Print features for its reports. They are provided on
this menu for users that desire to print the system screens. This section describes these
selections, plus the Refresh Path option.
Figure 39 File Menu
Page Setup – The Page Setup window contains three tabs which allow you to adjust the
margins on your page, change the paper source or orientation, and adjust columns.
Print Preview – Use this option to preview anything before you print it.
Print – This menu choice opens the standard Print window, where you can select
printers, the number of copies to print, and print. (To print a report to your default printer
without opening the Print dialog box, you may find it easier to use the Print button in the
toolbar.) This command is useful if you want to print a copy of the currently active form.
Chapter 10 Menus and Toolbars
Refresh Path – Use this option to give VALE 2000 information about the location of
your data files. This is generally necessary only if you move the data files for some
reason. When chosen, the screen in Figure 40 displays.
Figure 40 Data Path Refresh Screen
You may either enter the new path to your data or click on the Select button. If you click
on the Select button, a form will appear to help you navigate to the proper directory. The
path must contain the DYNATABL.MDB file, so use this feature with caution.
Exit – Use this to exit VALE 2000.
Edit Menu
This menu contains four selections, all of which are common to Windows™ applications:
Undo, Cut, Copy, and Paste.
Figure 41 Edit Menu
Undo – Use this to undo your most recent action.
Cut – Use this to cut text from a field. The text will disappear from that field and will be
available to paste.
Copy – Use this to make a copy of text in one location, leaving it there, but making it
available to paste.
Paste – Use this to paste text gathered using the Cut or Copy commands.
Records Menu
This menu contains two options: Save Record and Refresh.
53
54
Part II
Entering Your Data
Figure 42 Records Menu
Save Record – Use this menu feature to save the current case (or attorney, etc.). VALE
2000 saves the record automatically at various points, so using this option should not
normally be necessary. However, if you want to save information for the current record
without closing the form, choose this option.
Refresh – Use this option if you do not see records recently added or revised. For
example, while working on the Case form in a network environment, you may know that
another user has just added an attorney to the system. One way to make that attorney
available for selection on your form is to close VALE 2000, and restart it. Another option
is to choose Refresh, which will cause the system to make sure it includes any additions
or changes made to the data by other users since you opened the screen.
Maintain Menu
The options on this menu are simply navigational aids to simplify access to the VALE
2000 Maintenance functions: Attorneys, Consultants, Education Earnings, Consumer
Prices Indices, and Options/Defaults. See Chapter 8 for a detailed description of these
features.
Figure 43 Maintain Menu
Window Menu
If you have multiple windows open, use this pull-down menu to move among the open
windows. The available windows will appear in the pull-down menu.
Figure 44 Window Menu
Chapter 10 Menus and Toolbars
55
Help Menu
Use this menu to display information about the version of VALE 2000. You will need the
information under the “About VALE 2000” option if you call for support service for a
problem with VALE 2000.
Figure 45 Help Menu
Toolbar
OfficeLinks
Options/Defaults
Consumer Price Indices
Education Earnings
Attorneys
Consultants
Control Panel
Cut
Copy
Paste
Undo/Can’t Undo
Print
Print Preview
VALE 2000 has a toolbar that will help you to navigate among the different windows
involved in entering your data. It also includes typical Windows™ features like Print,
Copy, and Undo.
Figure 46 Toolbar
Figure 46 shows the names of the 13 buttons on the toolbar. You can also see a name of
a button at any time by moving your mouse pointer over the button. If you pause for a
moment over the button (without clicking), the name will appear.
The first six buttons give easy access to common Windows™ functions: Print, Print
Preview, Cut, Copy, Paste, and Undo (described earlier in this chapter). The next six
buttons are navigational tools to help you move among the various forms: Control Center,
Attorneys, Consultants, Education Earnings, Consumer Price Indices, and
Options/Defaults. The last five of these buttons take you to the one of the maintenance
areas. Refer to Chapter 8 for more information about these functions. The Control
56
Part II
Entering Your Data
Center button brings you to the Case Select form. Use this button if you do not see any
windows on your screen.
Use the last button, OfficeLinks to export a report to Microsoft WordT M. Chapter 11
outlines the procedure for this.
Chapter 11 Reporting
Part III
Using Your Data
Chapter 11 Reporting
Once data entry is complete, you are ready to print or display the report. To do this, press
the Print Current Case button at the top of your data entry screen or select the desired
case on the Case Select form and press the Print button.
Some users may also be able to export the report to Microsoft WordT M and/or ExcelT M if
they have these packages.
The reporting functions are described in detail below.
Figure 47 Print Dialog Form - Report Selection Tab
57
58
Part III
Using Your Data
Report Selection Tab
Print Report
VALE 2000 allows you to print three types of reports. To select a certain type of report,
check the box next to the report name by clicking on it with your mouse. The details
regarding these report types will be given in the next chapters.
Destination
VALE 2000 allows you a choice of displaying your reports on the screen or printing them.
With your mouse, click on your destination. Note that VALE 2000 will sometimes
prevent you from displaying reports on the screen if there are numerous reports or the
reports are large. If the choice to display is not available to you, try selecting just one
analysis or one scenario as described below. Also, if you wish to change the number of
copies to be printed, click the up or down arrows next to the number until the desired
number of copies appears.
Print Reports from
VALE 2000 automatically enters in the This Case field the Case Reference of the case
you selected for printing. If you wish to print a different case, select it from the drop
down list. All of the analyses that you set up for this case will be available on the This
Analysis list. If you wish to print all results from a particular case, do nothing. If you
want to see the results from one analysis only, select the analysis from the list. Similarly,
if you want to print a VALE run from one scenario only, select the scenario from the This
Scenario list. Again, leave this field blank if you wish to print everything.
Chapter 11 Reporting
Figure 48 Print Dialog Form - Report Options Tab
Report Options Tab
Earnings/LMA
VALE 2000 allows you to print the results of your VALE run in varying detail. In this
field, select the report or reports you wish to print by clicking on the box with your
mouse. Details on the printouts can be found in Chapter 13.
Worklife/LC
You also have a choice of the type of Worklife Probability printout you would like.
Details of these choices can be found in Chapter 14. Note that if you wish to use the
Offset option, the growth and discount rates must be equal. The program does not allow
differing rates with this print option.
Exporting Reports to Microsoft Word or Excel
Users who also own Microsoft Office may be able to export reports from VALE 2000 to
Microsoft Word and/or Excel. Before attempting to use this feature of VALE 2000,
confirm that you meet the additional requirements listed in the next section.
Additional System Requirements for Exporting Reports
Enough memory to open Word or Excel in addition to VALE 2000.
59
60
Part III
Using Your Data
Microsoft Excel 97 or later
Microsoft Word 97 or later
Exporting Reports
Once you have confirmed that you meet the system requirements, you may export a
report from VALE 2000 to Microsoft Word or Excel by following the steps listed
below:
Ø Exporting Reports
1. Select the case using the Case Select Form.
2. Click on the Print button
3. Click on the Preview destination button.
4. Choose the desired scenario and desired report type.
5. Click on the Print button.
6. Make the window with the report you wish to export the active window by clicking
on it.
7. Click on the OfficeLinks icon below the menu bar and select Publish It with MS
Word or Analyze It with MS Excel.
When this procedure is complete, Word or Excel (whichever you chose) will open,
displaying the exported document.
Note that not all reports may be available for
previewing.
Chapter 12 Case Summary Report
Chapter 12 Case Summary Report
As described in the previous chapter, VALE 2000 presents your data in three basic types
of reports: the Case Summary Report, the VALE Report, and the Worklife Probability
Report. This chapter describes the Case Summary Report.
The report on the next page shows you a Case Summary for a fictitious case regarding
John Doe. Many of the items in the report are simply echoing your input. The items that
are calculated in some way are described below:
Number
1
2
3
4
5
6
Name
Loss Range
Age
Pre-Injury Worklife
Expectancy
Pre-Injury Earning
Package
Post-Injury Worklife
Expectancy
Post-Injury Earning
Package
Description
Displays the lifetime loss calculated based on
your input
Displays the client's age as of the Report Date
Displays the pre- injury worklife expectancy of
the client
Displays the pre- injury annual earning capacity,
including fringe benefits
Displays the post- injury worklife expectancy of
the client
Displays the post- injury annual earning
capacity, including fringe benefits
61
62
Part III
Using Your Data
Case Summary
Sample - Smith/Doe
Mar 10, 1999
Attorney:
Client:
Loss Range:
Comments:
2
Smith, John
Prepared by:Name, Consultant
1
Doe, John
Gender: Male Age:
38.69 Date of Injury: 8/17/96
$348,282 - $441,933
Two analyses conducted based on actual earnings and on labor market data.
Preinjury
Analysis
Analysis - Actual
Analysis - VALE
Name
Pre-Injury - Actual
Pre-Injury - VALE
Postinjury
Worklife
Exp.
21.9
21.9
3
Earning
Package
Name
39,360 Post -Injury - Actual
37,845 Post -Injury - VALE
4
Worklife
Exp.
16.0
16.0
5
Earning
Package
Loss
29,520
33,092
441,933
348,282
6
1
Chapter 13 VALE Report
63
Chapter 13 VALE Report
This chapter describes your options for printing VALE reports. As with the Case
Summary report, many of the items in the report simply echo your input. The items that
are calculated in some way are described below.
The reports in this chapter are for the same fictitious case regarding John Doe. The
examples are for a pre- injury run requesting mean earnings for nondisabled male workers
in the national labor market. The parameter entered was General Learning Ability equal
to Medium, for a tabulation of average earnings for those jobs requiring an average
degree of the aptitude. See Chapter 15 through Chapter 17 for a description of the data
sources and calculations in VALE.
Through the options presented on the Report Options tab in the Print Dialog form (see
page 59), VALE 2000 allows you to print VALE reports in varying degrees of detail:
Report Type
Summary
Census (Selected Only)
Census (All)
D.O.T.
Description
Summarizes your results using the six broad occupational groups
(see Chapter 15).
Prints those Census Codes categories in which occupational codes
are present that match your scenario parameters. Summarizes
information for each code on the total number of employed
persons in the code, the selected number of employed persons in
the code, the total number of occupational titles in the code, and
the number of occupational titles in the code that match your
parameters. In addition, it lists the earnings associated with that
code.
In addition to presenting information available on the Census
(Selected Only) report, this selection also lists those Census Codes
categories in which there were no occupational titles that match
your scenario parameters.
In addition to presenting information available on the Census
(Selected Only) report, this selection also lists the occupational
titles that match your scenario parameters. Depending on your
parameters, this can result in a very long report.
VALE Summary Report
Figure 49 presents that portion of the VALE Summary Report that is calculated based on
the parameters you entered. Details are present below the figure.
64
Part III
Using Your Data
2
1
3
Labor Market
Group Title
Number
Employed
4
5
With Parameters
Percent
Employed
Number
Selected
Percent
Selected
1 - Managerial and Professional Specialty
28,252,000
30.2%
1,944,888
2.1%
2 - Technical, Sales, and Administrative Support
26,787,000
28.6%
18,016,242
19.3%
3 - Service Occupations
10,173,000
10.9%
5,740,214
6.1%
1,529,000
1.6%
687,827
0.7%
5 - Precision Production, Craft, and Repair
11,493,000
12.3%
9,968,366
10.7%
6 - Operators, Fabricators, and Laborers
15,341,000
16.4%
6,495,050
6.9%
93,575,000
100.0%
42,852,587
45.8%
4 - Farming, Forestry, and Fishing
Total
6
1997 Mean Annual Earnings = $30,057
1999 Mean Annual Earnings = $30,768 (CPI adjustment of 2.37%)
7
Figure 49 VALE Summary Report
Number
1
Name
Group Title
2
Labor Market Number
Employed
3
Labor Market Percent
Employed
With Parameters Number
Selected
4
5
With Parameters Percent
Selected
6
1997 Mean Annual
Earnings
7
1999 Mean Annual
Earnings
Description
Presents the number and name of the broad Census
group being summarized.
Presents the total number of people employed in each
broad group for the labor market you chose for the
run.
Presents the percent of people employed in each
broad group for the labor market you chose.
Presents the number of people employed in each
broad group that match the parameters you entered
(see Chapter 17).
Presents the percent of people employed in each
broad group that match the parameters you entered.
The percent relates to the total number of people in
the labor market, not the number of people in the
group.
Presents the average earnings for the run based on the
parameters entered and the labor market chosen (see
Chapter 17).
Presents the average earnings for the run after
updating to report year dollars using CPI (see 0).
Chapter 13 VALE Report
65
VALE Census Report
If desired, you can print more detailed information regarding the results of your VALE
run. The next level of report summarizes the run at the Census Code level. Figure 50
presents those Census Codes in which occupational codes are present that match your
scenario parameters (the level of printout you will get by choosing Census (Selected
Only) on the Report Options tab).
V A L E
1
5
4
6
Selected Census Code Listing: Sample - Smith/Doe
3
Vocational Assessment of Lost Earnings
2
Census
Code
Census
Group #1 Managerial and Professional Specialty
005
Administrators / Officials, Public
017
Managers, Food Serving & Lodging
018
Managers, Properties And Real Estate
021
Managers, Service Organizations,
022
Managers And Administrators, N.E.C.
Total
DOT's
56
16
19
31
170
Selected
DOT's
3
5
1
8
17
Total
Employed
583,000
892,000
325,000
505,000
4,955,00
Selected
Employed
31,232
278,750
17,105
130,323
495,500
7
Earnings
$49,711
$36,211
$39,926
$43,694
$61,380
Figure 50 VALE Census (Selected Only) Report
Number
1
Name
Census Code
2
Census
3
Total DOTs
4
Selected DOTs
5
Total Employed
6
Selected Employed
7
Earnings
Description
Presents the number of the Census Code being
summarized.
Presents the name of the Census Code being
summarized.
Presents the total number of occupational titles within
each Census Code presented.
Presents the number of occupational titles that match
the parameters entered for the run.
Presents the total number of people employed in each
Census Code for the labor market chosen.
Presents the number of people employed in each
Census Code that match the parameters entered for
the run (see Chapter 17).
Presents the earnings for each Census Code. In this
example, the earnings requested are for nondisabled
males.
66
Part III
Using Your Data
The Census (All) report option (Figure 51) is very similar to the Selected Only option
(Figure 50). In addition to all of the information presented in the Selected Only report, it
lists all Census Codes regardless of whether any of the occupational titles within the code
match the parameters entered for the run.
V A L E
Vocational Assessment of Lost Earnings
Complete Census Code Listing: Sample - Smith/Doe
Census
Code
Group #1
003
004
005
006
007
Total
DOT's
Census
Selected
DOT's
Total
Employed
Selected
Employed
Earnings
Managerial and Professional Specialty
Legislators
Chief Executives / General Admin,
Administrators / Officials, Public
Administrators, Protective Services
Financial Managers
1
1
56
13
8
3
13,000
13,000
583,000
54,000
652,000
*None*
*None*
31,232
*None*
*None*
$44,112
$44,112
$49,711
$45,054
$60,281
Figure 51 VALE Census (All) Report
VALE DOT Report
The VALE DOT reports add another level of detail to the Census reports just described.
In addition to all of the information presented in the Census (Selected Only) report
(Figure 50), it presents the number and name of the occupational titles that match the
parameters entered for the run (see Figure 52).
Chapter 13 VALE Report
67
V A L E
Vocational Assessment of Lost Earnings
Selected Occupation Listing: Sample - Smith/Doe
Census
Code
Total
DOT's
Census
Selected
DOT's
Total
Employed
Selected
Employed
Earnings
005
Administrators / Officials, Public
169.167-0 Park Ranger
185.167-0 Supervisor, Liquor Stores And
56
3
583,000
31,232
169.167-0 Public Health Registrar
017
Managers, Food Serving & Lodging
185.137-0 Manager, Fast Food Services
187.167-1 Manager, Liquor Establishment
320.137-0 Manager, Lodging Facilities
16
5
892,000
278,750
$36,211
187.167-0 Manager, Camp
320.137-0 Manager, Boarding House
018
Managers, Properties And Real Estate
186.167-0 Manager, Apartment House
19
1
Figure 52 VALE DOT Report
325,000
17,105
$49,711
$39,926
68
Part III
Using Your Data
Chapter 14 Worklife Probability Report
Chapter 14 Worklife Probability Report
This chapter describes your options for printing Worklife Probability reports. As with the
Case Summary and VALE reports, many of the items in the report simply copy your
input. The items that are calculated in some way are described below. To review
information pertaining to the calculations underlying this report, see Chapter 18 and
Chapter 19.
The reports in this chapter are for the same fictitious case regarding John Doe. The
example assumes that Mr. Doe is a high school graduate who was nondisabled prior to
the injury in question. As a result of injury, he is restricted to work of a sedentary to light
nature and has a worklife like that of an average not severely disabled male.
Through the options presented on the Report Options tab in the Print Dialog form (see
page 59), VALE 2000 allows you to print two different types of Worklife Probability
reports:
Report Type
Standard Report
Offset Report
Description
This option calculates both probable worklife and adjusted
earnings for every year. Choose this option if you wish to use a
net discount rate.
This option calculates only probable worklife for each year.
Lifetime earnings are calculated based on the total worklife
expectancy in combination with the earnings package. This
option is only available with a total offset.
Regardless of the report type chosen, the top portion of the Worklife printout will be the
same, as presented in Figure 53.
Number
1
Name
Notes
2
Current Wage Base
3
Future Worklife Value
4
Future Worklife Percent
Description
Notes created by the program which
summarize your analysis choices.
Presents the pre- injury and post- injury annual
earning capacity based on your scenario inputs.
Presents the pre- injury and post- injury
worklife expectancy as of the report date by
summing the individual Probable Worklife
figures (see next section).
Presents as a percentage the loss of worklife
expectancy from pre-injury to post- injury.
69
70
Part III
Using Your Data
Number
5
Name
Lifetime Earnings
Description
Presents the total pre- injury and post- injury
lifetime earnings based on your scenario inputs
by summing the individual Adjusted Earnings
figures (see next section). It also presents the
total lifetime loss.
Worklife Probability
Computation of Lost Worklife and Earnings
Sample - Smith/Doe
Analysis - VALE
1
Attorney: Smith, John
Prepared by: Name, Consultant
Client: Doe, John
Notes: Both scenarios factor the probabilities of life, participation, and employment. Past losses are computed
for periods between the injury date and date of analysis. Base earnings for past losses are stated in current
period dollars, and are not adjusted for discount and growth rates.
Summary:
Pre-Injury - VALE
7/1/60
Injury Date
8/17/96
Fringe Rate
3
5
General
Birth Date
Analysis Date
Cur. Wage Base
2
Post-Injury - VALE
3/10/99
$30,768
$26,904
23.0%
23.0%
Education Level
12 years
12 years
Gender Life/PE
Continuum
M/M
Not Disabled
M/M
Disabled, Not Severely
Growth/Discount
Future Worklife
Pure Offset
21.9
Pure Offset
16.0
Lifetime Earnings
$915,730
-
$567,448
4
27%
=
$348,282
Figure 53 Worklife Probability Report - Summary Portion
Worklife Probability Standard Report
Worklife Probability gives you two options for printouts. The Standard Report presented
in this section calculates the probable worklife each year. It then combines the resulting
figure with the earning package for that year to end up with Adjusted Earnings for each
year. These individual figures are then summed to calculate lifetime totals. See Chapter
18 for details of the worklife expectancy calculation.
Chapter 14 Worklife Probability Report
3
1
2
Date
5
4
6
7
8
Pre-Injury - VALE
Age Years
8/17/96 36.1
7/1/97 37.0
7/1/98 38.0
0.87
1.00
0.69
PAST
Prob.
Life
2.6
Post-Injury - VALE
Prob. Prob.
Base
Adjusted
PE
Wrklife Earnings Earnings
0.997
0.994
0.991
0.906
0.906
0.906
0.786
0.901
0.620
71
30,768
30,768
30,768
29,746
34,098
23,464
Prob.
Life
Prob.
PE
Prob.
Base
Adjusted
Wrklife Earnings Earnings
11
10
39,500
12
87,308
9
39,500
Estimated Past Loss
3/10/99
7/1/99
7/1/00
7/1/01
7/1/02
38.7
39.0
40.0
41.0
42.0
0.31
1.00
1.00
1.00
1.00
0.991
0.988
0.985
0.982
0.978
0.906
0.906
0.906
0.906
0.906
0.278
0.895
0.892
0.890
0.886
30,768
30,768
30,768
30,768
30,768
10,521
33,871
33,757
33,682
33,530
0.991
0.988
0.985
0.982
0.978
0.733
0.733
0.733
0.733
0.733
0.225
0.724
0.722
0.720
0.717
26,904
26,904
26,904
26,904
26,904
7/1/31
7/1/32
7/1/33
7/1/34
71.0
72.0
73.0
74.0
1.00
1.00
1.00
1.00
0.636
0.610
0.584
0.556
0.191
0.191
0.191
0.191
0.121
0.117
0.112
0.106
30,768
30,768
30,768
30,768
4,579
4,428
4,239
4,012
0.636
0.610
0.584
0.556
0.065
0.065
0.065
0.065
0.041
0.040
0.038
0.036
26,904
26,904
26,904
26,904
828,422
16
FUTURE
36.3
21.9
13
19
TOTAL
38.9
14
16.0
Estimated Future Loss
15
915,730
18
Estimated Total Loss:
Figure 54 Worklife Probability Standard Report
Number Name
1
Date
2
Age
3
Years
4
Prob. Life
5
Prob. PE
6
Prob. Wrklife
7
Base Earnings
Description
Presents the date beginning the period being
analyzed.
Presents the age of the client at the beginning of
the period being analyzed.
Presents the number of years in the period being
analyzed.
Presents the client's probability of living through
the period (see page 121).
Presents the client's probability of participation
and employment for the period based on age,
gender, education, and disability status (see page
122).
Presents the client's probable worklife for each
period. This figure is the product of the Life and
PE figures (see Chapter 18).
Presents the Current Wage Base discounted to
present value (see page 133).
47,808
7,446
23,959
23,892
23,826
23,727
17
1,357
1,324
1,257
1,191
527,948
300,474
567,448
348,282
72
Part III
Using Your Data
Number Name
8
Adjusted Earnings
9
Past Years
10
12
Past Pre-Injury
Adjusted Earnings
Post-Injury Adjusted
Earnings
Estimated Past Loss
13
Future Years
14
Pre-Injury Prob.
Wrklife
15
Pre-Injury Adjusted
Earnings
16
Post-Injury Prob.
Wrklife
17
Post-Injury Adjusted
Earnings
18
Estimated Future Loss
19
Total
11
Description
present value (see page 133).
Presents the client's probable earnings for the
period. This figure is the product of the base
earnings, fringe benefits, and probable worklife
(see page 133).
Presents the total number of calendar years
comprising the past loss period (from the date of
injury to the report date).
Presents the total amount of pre- injury adjusted
earnings during the past loss period.
Echoes your input. See Chapter 7.
Calculates the estimated past loss by subtracting
the post- injury adjusted earnings from the preinjury adjusted earnings.
Presents the total number of calendar years
comprising the future loss period.
Presents the total pre- injury worklife expectancy
for the future loss period by summing the
individual probable worklife figures.
Presents the total pre- injury adjusted earnings for
the future loss period by summing the individual
adjusted earnings figures.
Presents the total post- injury worklife expectancy
for the future loss period by summing the
individual probable worklife figures.
Presents the total post- injury adjusted earnings
for the future loss period by summing the
individual adjusted earnings figures.
Calculates the estimated future loss by
subtracting the post- injury adjusted earnings from
the pre- injury adjusted earnings.
Calculates lifetime totals by adding the individual
totals for the past and future loss periods.
Worklife Probability Offset Report
The Offset Report option presented in this section calculates the probable worklife each
year (see Chapter 18). It sums the yearly worklife probabilities, then combines the
resulting figure with the earning package to end up with lifetime Adjusted Earnings.
Details of this report that vary from the Standard Report are present in this section.
Chapter 14 Worklife Probability Report
Pre-Injury - VALE
Date
Age Years
8/17/96 36.1
7/1/97 37.0
7/1/98 38.0
0.87
1.00
0.69
PAST
2.6
Prob. of
Life
Prob. of
Part/ E m p
0.997
0.994
0.991
Prob. of
Life
Prob. of
Part/ E m p
Prob. of
Worklife
1
0.786
0.901
0.620
2.307
3
x Earning Package
Post-Injury - VALE
Prob. of
Worklife
0.906
0.906
0.906
73
2
37,845
= Past Potential
87,308
Actual Earnings
39,500
Loss
3/10/99
7/1/99
7/1/00
7/1/01
7/1/02
38.7
39.0
40.0
41.0
42.0
0.31
1.00
1.00
1.00
1.00
0.991
0.988
0.985
0.982
0.978
0.906
0.906
0.906
0.906
0.906
0.278
0.895
0.892
0.890
0.886
0.991
0.988
0.985
0.982
0.978
0.733
0.733
0.733
0.733
0.733
7/1/30
7/1/31
7/1/32
7/1/33
7/1/34
70.0
71.0
72.0
73.0
74.0
1.00
1.00
1.00
1.00
1.00
0.661
0.636
0.610
0.584
0.556
0.191
0.191
0.191
0.191
0.191
0.126
0.121
0.117
0.112
0.106
0.661
0.636
0.610
0.584
0.556
0.065
0.065
0.065
0.065
0.065
FUTURE
36.3
8
= Future Potential
0.225
0.724
0.722
0.720
0.717
5
6
21.890
2
x Earning Package
10
4
47,808
37,845
x Earning Package
828,427
= Future Potential
7
0.043
0.041
0.040
0.038
0.036
15.954
33,092
9
527,950
Loss
300,477
TOTALS
Total Earnings
915,735
Total Earnings
567,450
Loss
Figure 55 Worklife Probability Offset Report
Number Name
1
Past Pre-Injury Prob.
Of Worklife
2
Pre-Injury Earning
Package
3
Pre-Injury Past
Potential
Description
Presents the client's pre- injury total probable
worklife for the past loss period.
Presents the pre- injury earning package, a
combination of the base earnings and the fringe
benefits.
Presents the total pre- injury adjusted earnings for
the past loss period, a product of the probable
worklife and the earning package.
348,286
74
Part III
Using Your Data
Number Name
4
Future Pre-Injury Prob.
Of Worklife
5
Future Post-Injury
Prob. Of Worklife
6
Post-Injury Earning
Package
7
Pre-Injury Future
Potential
8
Post-Injury Future
Potential
9
Future Loss
10
Totals
Description
Presents the client's total pre- injury probable
worklife for the future loss period.
Presents the client's total post- injury probable
worklife for the future loss period.
Presents the post-injury earning package, a
combination of the base earnings and the fringe
benefits.
Presents the total pre- injury adjusted earnings for
the future loss period, a product of the probable
worklife and the earning package.
Presents the total post- injury adjusted earnings
for the future loss period, a product of the
probable worklife and the earning package.
Calculates the estimated future loss by
subtracting the post- injury future potential from
the pre- injury future potential.
Calculates lifetime totals by adding the individual
totals for the past and future loss periods.
Chapter 15 VALE Sources
Part IV
Reference
Chapter 15 VALE Sources
VALE utilizes sources of information on job characteristics, employment, and earnings.
The Dictionary of Occupational Titles (DOT) is used to define job-specific
characteristics. Data from the 1990 Census provide information regarding employment
and earnings. Both the job-specific characteristics and employment figures used by
VALE are static from year to year. Earnings are updated annually through information
contained in the March supplement of the Current Population Survey (CPS).
Occupational Data
The Dictionary of Occupational Titles (DOT), 4th Edition, Revised 1991 contains 12,741
separate job titles that are cross-referenced by worker characteristics required to perform
work satisfactorily. The classification of job titles and worker characteristics is the
responsibility of the U.S. Department of Labor, Employment and Training
Administration. VALE utilizes 12,708 of these job titles, excluding 33 military
occupations to focus on the civilian labor force.
Each of these 12,708 job titles is cross-walked to one of 501 Census Code occupational
categories by the National Crosswalk Service Center, an agent of the National
Occupational Information Coordinating Committee (NOICC). In addition, as later
defined, thirty-one titles have been added to accommodate Census Code occupational
categories that are void of DOT job titles, giving a total of 12,739 titles. These additional
titles are also cross-walked to the Census Code occupational categories. Each of these
three-digit Census Code categories is grouped into one of six broad occupational groups
as follows:
1.
2.
3.
4.
5.
6.
Managerial and Professional Specialty
Technical, Sales, and Administrative Support
Service Occupations
Farming, Forestry, and Fishing
Precision Production, Craft, and Repair
Operators, Fabricators, and Laborers
75
76
Part IV
Reference
Earnings and Employment Data
Data on earnings by Census Code occupational categories are available from several
sources. Earnings for disabled and nondisabled persons by gender are reported in the
0.05 percent of the 1990 Census of Population and Housing. Data are also reported by
Census Code occupational categories in the March supplement of the Current Population
Survey (CPS), which is released by the Bureau of Labor Statistics. Earnings and
employment data for a VALE labor market is first derived from the 1990 Census data.
The most recent CPS data are utilized to adjust earnings to dollar values in terms of the
CPS year. Applied to these CPS-adjusted annual earnings are ratios that permit
conversion to local labor market dollars that are specific for disabled and nondisabled
workers. These ratios are applied to the 1990 Census means and medians for the local
labor market. This computation is performed to create the labor market data files that
accompany the VALE software. Discussion regarding the calculation and application of
these ratios is contained in sections Census Data and CPS Data.
Employment data are derived from the 1990 Census. These data are used to report the
number of employed persons by three-digit Census Code category at the local labor
market level. Unlike the earnings data, the employment data are static and therefore not
modified by any other data source. A more detailed description of how VALE uses
Census and CPS data follows.
Census Data
The U.S. Department of Commerce, Bureau of the Census, surve ys the earnings for fulltime wage and salary workers by detailed three-digit Census Code categories every ten
years. Both mean and median earnings are derived for all persons (disabled and
nondisabled combined), disabled persons, and nondisabled persons. The data are genderspecific and may be summarized at the national, state, and local labor market levels. The
1990 Census provides this informatio n based on 1989 earnings and employment.
The mean earnings from the 1990 Census by broad occupational group are listed below.
These mean earnings are segregated by gender and disability status. In addition the ratios
of average disabled dollars to all person dollars and average nondisabled dollars to all
person dollars are reported by gender. These ratios are the basis for the earning
variability that exists by disability status.
Census Summary Group Ratios
Earnings
Group Disability Status Total Male Female
1
All Persons
Nondisabled
Disabled
Total
Ratios
Male
Female
40,861 49,037 28,627
41,025 49,346 28,697 100.40% 100.63% 100.24%
34,876 39,237 25,400 85.35% 80.02% 88.73%
Chapter 15 VALE Sources
Group Disability Status
2
All Persons
Nondisabled
Disabled
Earnings
Ratios
Total Male Female Total
Male
Female
26,376 34,562 20,053
26,444 34,772 20,099 100.26% 100.61% 100.23%
24,264 29,351 18,291 91.99% 84.92% 91.21%
3
All Persons
Nondisabled
Disabled
18,785 22,993 14,160
18,858 23,138 14,224 100.39% 100.63% 100.45%
17,301 20,463 12,608 92.10% 89.00% 89.04%
4
All Persons
Nondisabled
Disabled
19,808 20,736 12,762
19,975 20,917 12,918 100.84% 100.87% 101.22%
17,158 17,944 9,729 86.62% 86.54% 76.23%
5
All Persons
Nondisabled
Disabled
27,913 28,621 20,184
27,999 28,716 20,234 100.31% 100.33% 100.25%
25,623 26,135 18,541 91.80% 91.31% 91.86%
6
All Persons
Nondisabled
Disabled
22,482 24,434 16,166
22,568 24,541 16,217 100.38% 100.44% 100.32%
20,401 21,926 14,776 90.74% 89.74% 91.40%
Since there are a limited number of disabled workers within each of the three-digit
Census Code categories, it is not possible to define accurately average earnings for
disabled persons at the three-digit Census code level. This is true only to a limited degree
at the national level, but exists to a greater degree at the state and local levels. Therefore,
to portray reasonably the earnings variance that exists for disabled persons who work, a
conversion geared to the six broad occupational groups is appropriate. Once these
conversion ratios are obtained, they are applied to earnings figures from the most current
CPS data. The ratios are applied to all the three-digit Census Code categories that fall
within the relevant broad occupational group.
For example, the first broad occupational group is Managerial and Professional Specialty.
This includes all three-digit Census Code category numbers between 003 and 199. The
CPS earnings figures from each of these three-digit Census Code categories are
multiplied by 1.0040 and 0.8535 to arrive at average nondisabled and average disabled
earnings respectively. These earning figures expressed in CPS year dollars represent the
best estimate of earnings for workers in the occupational group Managerial and
Professional Specialty by disability status.
At the local level, i.e. state or metropolitan area, local dollars are obtained through the
use of a conversion factor similar to the one used above for establishing discrepant
patterns of the earnings of disabled and nondisabled persons. Problems with the sample
size make it difficult to report local dollars by three-digit Census Code and virtually
impossible to report local dollars for disabled persons without statistical interpolation.
In the example below, 1990 Census mean earnings for all persons at the national level are
compared to 1990 Census mean earnings at a local level (New York City). This is done
77
78
Part IV
Reference
for each of the six broad occupational groupings. The ratio revealing the variability
existing at the local level is then applied to CPS earnings figures in each of the three-digit
occupational categories within their respective broad occupational groupings. The same
ratio is applied to all persons, men, and women by disability status. For example, suppose
you want VALE to estimate earnings for Optometrists in New Yo rk City. VALE would
take the CPS earnings for Optometrists and multiply them by 1.19, since this occupation
falls in the first broad occupational group, namely Managerial and Professional Specialty.
Census Summary Group Ratios
Group
1
2
3
4
5
6
National
40,861
26,343
18,785
19,808
27,983
22,481
NYC
48,659
31,176
23,222
22,517
31,037
23,749
Ratio
1.19
1.18
1.24
1.14
1.11
1.06
The ratios used to differentiate between disabled and nondisabled workers and earning
patterns for workers in various regions of the country are obtained through the 1990
Census. The dollars reported by VALE represent a single best estimate of earnings that
vary as a function of region and disability versus nondisability status.
CPS Data
The U.S. Department of Labor, Bureau of Labor Statistics, collects national earnings data
for full-time wage and salary wo rkers on an annual basis. Both mean and median
national earnings as well as the national number of employed persons are reported by
detailed three-digit Census Code category. These earnings are reported for all persons
combined and also by gender. The data are contained in an annual report entitled “Usual
Weekly Earnings of Employed Wage and Salary Workers Who Usually Work Full- Time
by Detailed (3 digit Census Code) Occupation, and Sex; Unpublished Tabulations from
the Current Population Survey, Table A-26.”
When VALE reports mean or median earnings, it begins with data from the 1990 Census.
The 1989 earnings contained in the census data are utilized to obtain the census to
summary ratios for local labor markets and by disability status. This data source is
utilized to obtain variability in earnings by locality and disability status. Applying these
ratios to the most current CPS data provides the best estimate of earnings stated in CPS
year dollars by disability status and locality. This conversion process to arrive at a labor
market’s earnings for a CPS year is actually performed to create the base data files that
VALE uses. Thus, this portion of the computation is already complete before any VALE
run.
For example, suppose you want VALE to estimate the average earnings of nondisabled
male Fire Fighters in New York City stated in terms of CPS year dollars. The New York
Chapter 15 VALE Sources
City labor market data recognize that Fire Fighters are part of the broad occupational
group Service Occupations (group 3). The census to summary ratios by disability status
and locality derived from the 1990 Census are retrieved. In this case, the census to
summary ratio for nondisabled males in group 3 is 100.63% or 1.0063. The census to
summary ratio for workers in New York City working in group 3 is 1.24. After retrieving
these ratios, the average earnings of workers in Census Code 417 (Fire Fighters) from the
CPS data is multiplied by 1.0063 and again by 1.24 to arrive at the estimated average
earnings of nondisabled male Fire Fighters in New York City. This estimate is stated in
terms of CPS year dollars.
Current Year Escalation
Since the earnings information developed from the CPS is usually one year in arrears, the
above process does not result in the most current earnings. VALE allows optional (casespecific) adjustment to current- year dollars using the “Consumer Price Index, All Urban
Consumers (CPI-U), U.S. City Average, All Items” which is provided by the U.S.
Department of Labor, Bureau of Labor Statistics (see 0).
Data Modified for VALE
Outliers
VALE reports mean and median earnings by detailed three-digit Census Code category
for Males, Females, and Both Sexes. Since there are 501 Census Code categories, this
implies that VALE contains 1503 mean and median earnings figures that are gender
specific and non-specific. In some cases, the CPS is missing earnings figures for Males,
Females, or Both Sexes. In other cases, sample sizes are too small at the detailed threedigit Census Code category level to provide reliable estimates. There are also
occurrences where estimates are considered unreliable because the standard error for the
mean or median is at least sixty percent of the size of the mean or median. In these latter
cases, the dollar figures are considered to be “Outliers.” The remainder of this section
will explain how the CPS is adjusted for cases of missing earnings figures and Outliers.
Of the 1503 gender specific and non-specific Census Code categories, there were
approximately 69 which were missing from the annual report entitled “Usual Weekly
Earnings of Employed Wage and Salary Workers Who Usually Work Full-Time by
Detailed (3 digit Census Code) Occupation, and Sex; Unpublished Tabulations from the
Current Population Survey, Table A-26.” These include approximately 10 for males, 53
for Females, and six for Both Sexes. If the mean and median earnings for the Both Sexes
category were missing, they were replaced by the earnings available in the next higher
summary category for the Census Code. The table below provides details on the Census
Code categories that were missing earnings figures for the Both Sexes category and how
they were imputed.
79
80
Part IV
Reference
Census Code
Category
258
259
284
Title
Method for Imputing Earnings
Sales Engineers
Used earnings from summary
category, Sales Reps, Commodities,
Except Retail; split number
employed from summary category
equally between 258 and 259 (the
only two Census Codes under the
summary)
See 258
Sales Reps, Mining,
Manufacturing &
Wholesale
Auctioneers
Used earnings from summary
category, Sales-related Occupations
403
Launderers & Ironers
Used earnings from summary
category, Private Household
Occupations
655
Misc. Precision
Used earnings from summary
Metalworkers
category, Precision Metalworking
Occupations
868
Helpers, Extractive
Used earnings from summary
Occupations
category, Helpers, Construction and
Extractive Occupations
An earnings figure is considered to be an Outlier if the Bureau of Labor Statistics reports
that the Census Code category has a total of two thousand or fewer employed people or if
the standard error of either the mean or median is at least sixty percent of the mean or
median earnings figure. This resulted in approximately 152 Census Code category
Outliers that are gender specific or non-specific. The same procedure is utilized to replace
Outliers and missing earnings for men or women. The table below lists the Census Code
categories that contain Outliers or missing earnings figures by gender.
Census Code s Categories by Gender With Missing Earnings or Outliers
Females
Missing
Outliers
049, 054, 063, 088, 117, 136, 233, 258, 259, 284, 403, 454, 474, 497,
499, 514, 516, 519, 526, 543, 553, 554, 555, 557, 565, 566, 583, 584,
588, 596, 597, 598, 613, 614, 615, 644, 645, 655, 656, 659, 669, 705,
713, 814, 825, 828, 829, 833, 845, 848, 867, 868, 875
003, 004, 019, 028, 046, 047, 058, 068, 074, 089, 113, 116, 124, 125,
126, 138, 139, 145, 146, 147, 148, 149, 153, 168, 215, 226, 228, 306,
309, 325, 347, 366, 404, 413, 416, 425, 455, 462, 473, 483, 489, 494,
495, 496, 498, 505, 506, 509, 515, 517, 527, 534, 535, 536, 538, 539,
544, 556, 563, 564, 577, 587, 589, 593, 594, 595, 616, 617, 634, 635,
636, 643, 646, 653, 654, 676, 693, 695, 696, 699, 704, 707, 714, 724,
725, 728, 729, 755, 764, 766, 773, 786, 798, 823, 826, 834, 843, 853,
Chapter 15 VALE Sources
725, 728, 729, 755, 764, 766, 773, 786, 798, 823, 826, 834, 843, 853,
855, 864, 865, 866, 876
Males
Missing
Outliers
Both Sexes
Missing
Outliers
149, 204, 205, 258, 259, 284, 325, 403, 655, 868
086, 088, 097, 117, 125, 136, 144, 145, 148, 153, 193, 285, 306, 309,
404, 405, 425, 466, 474, 483, 489, 499, 649, 659, 684, 729, 743, 793,
814, 825, 833, 845
258, 259, 284, 403, 655, 868
088, 117, 136, 149, 153, 306, 325, 473, 474, 494, 499, 659, 728, 814,
825, 833, 845
Imputing Missing Values for Earnings by Gender and Outliers
Missing values are imputed by examining the ratio of mean or median earnings at the
detailed three-digit Census Code category level to the mean or median earnings at the
next largest summary category level that the Census Code falls into. For example, let us
look at Census Code 473 (Farmers) where earnings are Outliers for the Both Sexes
category. VALE will check first if Male earnings are reported for Census Code 473. If
they are reported, and if they are not also an outlier, earnings are imputed for the Both
Sexes category using the following formula:
(MC / MS) * BS = BC
Here the values of MC and BC are the Census Code category mean or median earnings
for the group of Males and Both Sexes, respectively. The values of MS and BS are the
mean or median earnings of the next largest Summary Group containing Census Code
473 for the group of Males and Both Sexes, respectively. For Census Code 473, this
summary group is Farm Operators and Managers. In this case the ratio of Census Code
category earnings to Summary Group earnings is estimated as roughly the same for the
groups Male and Both Sexes. If the Male Census Code category mean or median (MC) is
on the list of Outliers, the Female ratio of Census Code to Summary Group earnings (FC
/ FS) is used to impute the value of earnings for the Both Sexes group. If both the Male
and Female earnings at the Census Code level are on the Outliers list, the earnings at the
summary category level will be used (i.e., MS = MC, FS = FC, BS = BC).
The table below illustrates the modifications made for VALE in this example. The table
shows mean weekly earnings by summary group (Farm Operators and Managers) and for
Census Code 473 (Farmers) for both sexes and males. In this case, the both sexes mean
81
82
Part IV
Reference
dollar needs to be estimated based on the other three earnings figures. The table shows
that male Farmers earned an average of $400 per week while the average weekly earnings
for males in the broader occupational group of Farm Operators and Managers was $522.
Therefore male Farmers, on average, earned (400/522)*100 or approximately 77 percent
less than the average farm operator and manager. If one pooled men and women together
into a “Both Sexes” group, it is reasonable to believe that the Both Sexes group of
Farmers would have average earnings roughly 77 percent less than the average Both
Sexes earnings of all Farm Operators and Managers (BS). This calculation which is
made for VALE is shown at the bottom of the table. So VALE uses an imputed value of
$382 for the Both Sexes average earnings for Farmers. Similar calculations are also
performed for median dollars.
Mean Weekly Earnings by Gender Group and Occupational Group
Level
Summary
Group
Census
Code
Title
Farm Operators and Managers
Male
MS = 522
Both Sexes
BS = 498
Farmers
MC = 400
BC = 382
(400 / 522) * 498 = BC = 382
A similar technique is utilized to impute earnings missing for either Male or Female
groups. When the earnings for Males or Females is missing or on the list of Outliers, it
will be imputed by employing the Census to Summary Group ratio for Both Sexes
whenever possible. In this case, VALE imputes the gender specific Census Code
category earnings (GC) using information on the ratio of Census Code category earnings
to Summary Group earnings for Both Sexes (BC / BS) and gender specific Summary
Group earnings (GS). The following formula shows the calculation VALE makes in this
situation:
(BC / BS) * GS = GC
If the Both Sexes Census Code category earnings is also on the Outliers list, the Census
to Summary Group ratio for the opposite gender (OC / OS) is adopted in place of the
Both Sexes Census to Summary Group ratio (BC / BS). If the Census to Summary Group
ratio for the opposite gender is also on the Outliers list, the earnings for the summary
category will be used.
Method for Splitting Combined Census Codes
There are eleven instances in the annual report entitled “Usual Weekly Earnings of
Employed Wage and Salary Workers Who Usually Work Full- Time by Detailed (3 digit
Census Code) Occupation, and Sex; Unpublished Tabulations from the Current
Chapter 15 VALE Sources
83
Population Survey, Table A-26” where two Census Code categories are combined into
one listing. For use in VALE, these are split to correspond with the data gathered in the
1990 census. The following pairs of Census Code categories have been split: (003, 004),
(473, 474), (475, 476), (505, 506), (563, 564), (567, 569), (575, 576), (585, 587), (634,
635), (637, 639), and (653, 654).
To derive the number employed for the individual Census Code categories, the number
employed is divided by two and the result placed in each Census Code category. If the
number employed reported by the Bureau of Labor Statistics is an odd number, the “extra
person” is assigned to the first Census Code category. For instance, the Both Sexes
Census Code categories 003 and 004 have been combined in the tabulations from the
Current Population Survey and have a total number emp loyed of 21. After the split,
Census Code category 003 will be assigned a total number employed of 11 and Census
Code category 004 will be assigned a total number employed of 10.
The mean and median earnings figures will not be adjusted in any way. Therefore, both
of these Census Code categories are assigned the same mean and median annual earnings.
Census Codes Without DOT Titles
Thirty-one of the Census Code categories are void of occupational titles. None of the
12,708 civilian job titles from the DOT are cross-walked by the NOICC to these thirtyone Census Code categories. Therefore, in order to utilize the employment and earnings
data contained in these thirty-one Census Code categories, worker characteristics
conforming to comparable occupational titles were created. The thirty-one Census Code
categories and the worker characteristics assigned to them are listed below.
CENSUS
CODE
CAT.
003
SVP
8
R
5
M
4
L
5
G
2
V
2
N
3
S
4
P
4
Q
4
K
4
F
4
M
4
E
5
C
5
Strength
L
EARTH, ENVIRONMENTAL, AND MARINE
SCIENCE TEACHERS
000.227-000
113
7
6
6
6
1
1
1
2
2
2
3
3
3
4
4
L
BIOLOGICAL SCIENCE TEACHERS
000.227-000
114
8
6
6
6
1
1
2
1
2
2
3
3
3
5
3
L
CHEMISTRY TEACHERS
000.227-000
115
8
6
5
5
1
1
1
3
3
2
3
3
3
5
3
L
PHYSICS TEACHERS
000.227-000
116
8
6
6
6
1
1
1
1
3
2
4
4
4
5
4
L
NATURAL SCIENCE TEACHERS, N.E.C.
000.227-000
117
7
5
4
5
2
2
3
3
3
3
4
4
4
5
3
L
PSYCHOLOGY TEACHERS
000.227-000
118
8
6
6
5
1
1
2
3
3
2
4
4
4
5
5
L
ECONOMICS TEACHERS
000.227-000
119
8
6
5
5
1
1
2
3
3
2
4
4
4
5
5
L
HISTORY TEACHERS
000.227-000
123
8
6
5
5
1
1
2
3
3
2
4
4
4
5
5
L
POLITICAL SCIENCE TEACHERS
000.227-000
124
8
6
5
5
1
1
2
3
3
2
4
4
4
5
5
L
SOCIOLOGY TEACHERS
000.227-000
125
8
6
5
5
1
1
2
3
3
2
4
4
4
5
5
L
JOB TITLE/#
LEGISLATORS
000.117-000
GED
-APTITUDES-
84
Part IV
Reference
CENSUS
CODE
CAT.
SVP
R
M
L
G
V
N
S
P
Q
K
F
M
E
C
Strength
SOCIAL SCIENCE TEACHERS, N.E.C.
000.227-000
126
8
6
5
5
1
1
2
3
3
2
4
4
4
5
5
L
ENGINEERING TEACHERS
000.227-000
127
8
6
5
5
1
1
2
2
2
2
3
3
3
5
4
L
MATHEMATICAL SCIENCE TEACHERS
000.227-000
128
8
6
5
5
1
1
2
3
3
2
4
4
4
5
5
L
COMPUTER SCIENCE TEACHERS
000.227-000
129
8
6
5
5
1
1
2
3
3
2
4
4
4
5
5
L
MEDICAL SCIENCE TEACHERS
000.227-000
133
8
6
6
6
1
1
2
1
2
2
3
2
2
5
4
L
AGRICULTURE AND FORESTRY
TEACHERS
000.227-000
136
8
6
6
6
1
1
2
3
3
2
3
3
3
5
4
L
EDUCATION TEACHERS
000.227-000
139
7
6
5
5
1
1
2
3
3
2
4
4
4
5
5
L
ENGLISH TEACHERS
000.227-000
143
7
6
5
6
1
1
2
3
3
2
4
4
4
5
5
L
LAW TEACHERS
000.227-000
145
8
6
5
6
1
1
1
3
3
2
4
4
4
5
5
L
SOCIAL WORK TEACHERS
000.227-000
146
7
6
5
5
1
1
2
3
3
2
4
4
4
5
5
L
THEOLOGY TEACHERS
000.227-000
147
8
6
5
6
1
1
2
3
3
2
4
4
4
5
5
L
TRADE AND INDUSTRIAL TEACHERS
000.227-000
148
7
6
5
5
1
1
2
2
2
2
3
3
3
3
3
L
HOME ECONOMICS TEACHERS
000.227-000
149
8
6
5
5
1
1
2
3
3
2
3
3
3
4
3
L
AIRCRAFT ENGINE MECHANICS
000.281-000
508
7
4
4
4
3
3
3
2
2
4
3
3
2
4
4
M
SHEETMETAL DUCT INSTALLERS
000.361-000
596
4
3
3
3
3
4
4
3
3
4
3
3
3
4
5
M
FAMILY CHILD CARE PROVIDERS
000.677-000
466
3
3
2
3
4
4
4
4
4
4
4
4
4
4
5
M
EARLY CHILDHOOD TEACHER'S
ASSISTANTS
000.677-000
467
3
3
2
3
4
4
4
4
4
4
4
4
4
4
5
M
NOT SPECIFIED MECHANICS AND
REPAIRERS
000.684-000
549
4
3
2
2
3
4
4
3
3
4
3
3
3
5
5
M
MACHINE OPERATORS, NOT SPECIFIED
000.685-000
779
3
2
1
2
4
4
4
4
4
4
4
4
3
5
5
M
JOB TITLE/#
GED
-APTITUDES-
Database Errors
Due to its voluminous nature, the database data provided by the Department of Labor is
found to contain several errors. In an effort to correct some of these errors, data for some
DOT numbers were changed as follows:
Chapter 15 VALE Sources
DOT TITLE
DOT NUMBER
Immunohematologist
078.221-010
ERROR
Not cross-walked to any
CCN
CORRECTION
Renumbered DOT 078.261 -046;
IMMUNOHEMATOLOGIST to
078.221-010 to coincide with DOT
manuals.
Immunohematologist
078.261-046
Not in DOT Cross
walked to CCN 208
Renumbered to 078.221-010 to
coincide with DOT manuals.
Inst., Business Ed
090.222-010
Assigned to CCN 159
Reassigned to CCN 135 - Business,
Commerce & Marketing Teachers
Teacher, Industrial
Arts
091.221-010
Assigned to CCN 157
Reassigned to CCN 148 - Trade &
Industrial Teachers
Instructor, Physical
Education
099.224-010
Assigned to CCN 159
Reassigned to CCN 138 - Physical
Education Teacher
Teacher, Art
149.021-010
Assigned to CCN 159
Reassigned to CCN 137 - Art,
Drama & Music Teachers
Teacher, Drama
150.027-014
Assigned to CCN 159
Reassigned to CCN 137 - Art,
Drama & Music Teachers
Teacher, Music
152.021-010
Assigned to CCN 159
Reassigned to CCN 137 - Art,
Drama & Music Teachers
Consultant
189.167-010
Assigned to CCN 000
Assigned to CCN 037 Management Related
Occupations N.E.C.
85
86
Part IV
Reference
Chapter 16 Worker Characteristic Structure
Chapter 16 Worker Characteristic Structure
All of the worker characteristics available for use with VALE are listed below with a
brief description. In addition, the range of values allowed for each characteristic is
shown. Following this abbreviated listing is a more detailed description of the
characteristics and how they interact with VALE.
CHARACTERISTIC
CLASS
CHARACTERISTIC
G - General Learning Ability
V -Verbal
N - Numerical
S - Spatial
P - Form Perception
Aptitudes
Q - Clerical Perception
K - Motor Coordination
F - Finger Dexterity
M - Manual Dexterity
E - Eye-Hand-Foot Coordination
C - Color Discrimination
Census Code
Census Group
Census/DOT Data
DOT Code
Data, People, Things
Environmental
Conditions
Data (4th digit of DOT job
number)
People (5th digit of DOT job
number)
Things (6th digit of DOT job
number)
Exposure to Weather
Extreme Cold
Extreme Heat
Wet and/or Humid
Noise Intensity Level
CHARACTERISTIC
VALUE
1 to 5 (5 is low)
3 to 889
1 to 6
(see the Dictionary of
Occupational Titles)
0 to 6 (6 is low)
0 to 8 (8 is low)
0 to 7 (7 is low)
1 - Not Present
2 - Occasionally
3 - Frequently
4 - Constantly
1 - Very Quiet
2 - Quiet
3 - Moderate
4 - Loud
5 - Very Loud
87
88
Part IV
Reference
CHARACTERISTIC
CLASS
CHARACTERISTIC
Vibration
Physical Demand s
Reasoning, Math,
Language
SVP
Atmospheric Cond itions
Proximity to Moving Mechanical
Parts
Exposure to Electrical Shock
Working High, Exposed Places
Exposure to Radiation
Working with Explosives
Exposure to Toxic or Caustic
Chemicals
Other Environmental Conditions
Climbing
Balancing
Stooping
Kneeling
Crouching
Crawling
Reaching
Handling
Fingering
Feeling
Talking
Hearing
Tasting/Smelling
Near Acuity
Far Acuity
Depth Perception
Accommodation
Color Vision
Field of Vision
Strength
Reasoning
Math
Language
Specific Vocational Preparation
CHARACTERISTIC
VALUE
1 - Not Present
2 - Occasionally
3 - Frequently
4 - Constantly
1 - Not Present
2 - Occasionally
3 - Frequently
4 - Constantly
1 - Sedentary
2 - Light
3 - Medium
4 - Heavy
5 - Very Heavy
1 to 6 (1 is low)
1 to 9 (1 is low)
Chapter 16 Worker Characteristic Structure
Aptitudes
Aptitudes refer to specific capacities or abilities required of an individual in order to
facilitate the learning of some task or job duty. Each job title has been assigned one of
five specific levels for each of eleven aptitudes. These levels reflect equivalent amounts
of the aptitudes possessed by segments of the working population, as follows:
LEVEL
1
2
3
4
5
DEFINITION
The top ten percent of the population.
This segment of the population possesses an extremely high degree of the
aptitude.
The highest third exclusive of the top 10 percent of the population.
This segment of the population possesses an above average or high
degree of the aptitude.
The middle third of the population.
This segment of the population possesses a medium degree of the
aptitude, ranging from slightly below to slightly above average.
The lowest third exclusive of the bottom 10 percent of the population.
This segment of the population possesses a below average or low degree
of the aptitude.
The lowest 10 percent of the population.
This segment of the population possesses a negligible degree of the
aptitude.
APTITUDE
(VALE
CHARACTERISTIC)
G - General Learning
V - Verbal
N - Numerical
S - Spatial
WHAT IT MEANS
The ability to "catch on" or understand instructions and
underlying principles; the ability to reason and make
judgments. Closely related to doing well in school.
The ability to understand meaning of words and to use
them effectively. The ability to comprehend language, to
understand relationships between words, and to
understand meanings of whole sentences and paragraphs.
The ability to perform arithmetic operations quickly and
accurately.
Ability to think visually of geometric forms and to
comprehend the two-dimensional representation of threedimensional objects. The ability to recognize the
relationships resulting from the movement of objects in
space.
89
90
Part IV
Reference
APTITUDE
(VALE
CHARACTERISTIC)
P - Form Perception
Q - Clerical Perception
K - Motor Coordination
F - Finger Dexterity
M - Manual Dexterity
E - Eye-Hand-Foot
Coordination
C - Color Discrimination
WHAT IT MEANS
Ability to perceive pertinent detail in objects or in
pictorial or graphic material. Ability to make visual
comparisons and discriminations and see slight
differences in shapes and shadings of figures and widths
and lengths of lines.
Ability to perceive pertinent detail in verbal or tabular
material. Ability to observe differences in copy, to
proofread words and numbers, and to avoid perceptual
errors in arithmetic computation. A measure of speed of
perception is required in many industrial jobs even when
the job does not have verbal or numerical content.
Ability to coordinate eyes and hands or fingers rapidly
and accurately in making precise movements with speed.
Ability to make movement response accurately and
swiftly.
Ability to move fingers, and manipulate small objects
with fingers, rapidly or accurately.
Ability to move hands easily and skillfully. To work with
hands in placing and turning motions.
Ability to move the hand and foot coordinately with each
other in accordance with visual stimuli.
The ability to match or discriminate between colors in
terms of hue, saturation, and brilliance. To identify a
particular color or color combination from memory and be
able to perceive harmonious or contrasting color
combinations.
Examples of Usage Within VALE:
'General Learning Ability = 3'
'Finger Dexterity < 3'
'Manual Dexterity <= 3'
selects jobs that require an average degree of
general learning ability.
selects jobs that require a below average or
negligible degree of finger dexterity
selects jobs that require an average, below average,
or negligible degree of manual dexterity.
Chapter 16 Worker Characteristic Structure
Census/DOT Data
Census Code
In order for a job to be accessed by VALE, it must be cross-walked to one of 501 threedigit Census Code Category Numbers (CCNs). Using this variable, you may specify a
range of CCNs to include or omit in a given report. Census Code categories are
numbered in broken sequence beginning with '3' and ending with '889', as shown below.
CENSUS CODE
3
4
5
6
7
8
9
13
14
15
16
17
18
19
21
22
23
24
25
26
27
28
29
33
34
35
36
37
43
44
45
46
47
48
49
JOB TITLE
Legislators
Chief Executives/General Admin, Public
Administrators/Officials, Public Admin
Administrators, Protective Services
Financial Managers
Personnel and Labor Relations Managers
Purchasing Managers
Managers, Market/Advertising, Public Rel
Administrators, Educ and Related Fields
Managers, Medicine and Health
Postmasters and Mail Superintendents
Managers, Food Serving & Lodging Estabs
Managers, Properties and Real Estate
Funeral Directors
Managers, Service Organizations, NEC
Managers and Administrators, NEC
Accountants and Auditors
Underwriters
Other Financial Officers
Management Analysts
Personnel, Training, and Labor Rel Spec
Purchasing Agents and Buyers, Farm Prod
Buyers, Whsle/Retail Trade Exc Farm Prod
Purchasing Agents and Buyers NEC
Business and Promotion Agents
Construction Inspectors
Inspectors/Compliance Officers, Exc Const
Management Related Occupations, NEC
Architects
Aerospace Engineers
Metallurgical and Materials Engineers
Mining Engineers
Petroleum Engineers
Chemical Engineers
Nuclear Engineers
91
92
Part IV
Reference
CENSUS CODE
53
54
55
56
57
58
59
63
64
65
66
67
68
69
73
74
75
76
77
78
79
83
84
85
86
87
88
89
95
96
97
98
99
103
104
105
106
113
114
115
116
117
118
119
JOB TITLE
Civil Engineers
Agricultural Engineers
Electrical and Electronic Engineers
Industrial Engineers
Mechanical Engineers
Marine and Naval Architects
Engineers, NEC
Surveyors and Mapping Scientists
Computer Systems Analysts and Scientists
Operations & Systems Researchers/Analysts
Actuaries
Statisticians
Mathematical Scientists, NEC
Physicists and Astronomers
Chemists, Except Biochemists
Atmospheric and Space Scientists
Geologists and Geodesists
Physical Scientists, NEC
Agricultural and Food Scientists
Biological and Life Scientists
Forestry and Conservation Scientists
Medical Scientists
Physicians
Dentists
Veterinarians
Optometrists
Podiatrists
Health Diagnosing Practitioners, NEC
Registered Nurses
Pharmacists
Dietitians
Respiratory Therapists
Occupational Therapists
Physical Therapists
Speech Therapists
Therapists, NEC
Physicians' Assistants
Earth, Environmental, Marine Sci Teachers
Biological Science Teachers
Chemistry Teachers
Physics Teachers
Natural Science Teachers, NEC
Psychology Teachers
Economics Teachers
Chapter 16 Worker Characteristic Structure
CENSUS CODE
123
124
125
126
127
128
129
133
134
135
136
137
138
139
143
144
145
146
147
148
149
153
154
155
156
157
158
159
163
164
165
166
167
168
169
173
174
175
176
177
178
179
183
184
JOB TITLE
History Teachers
Political Science Teachers
Sociology Teachers
Social Science Teachers, NEC
Engineering Teachers
Mathematical Science Teachers
Computer Science Teachers
Medical Science Teachers
Health Specialties Teachers
Business, Commerce, Marketing Teachers
Agriculture and Forestry Teachers
Art, Drama, and Music Teachers
Physical Education Teachers
Education Teachers
English Teachers
Foreign Language Teachers
Law Teachers
Social Work Teachers
Theology Teachers
Trade and Industrial Teachers
Home Economic Teachers
Teachers, Postsecondary, NEC
Postsecondary Teachers, Subj Unspecified
Teachers, Prekindergarten & Kindergarten
Teachers, Elementary School
Teachers, Secondary School
Teachers, Special Education
Teachers, NEC
Counselors, Educational and Vocational
Librarians
Archivists and Curators
Economists
Psychologists
Sociologists
Social Scientists, NEC
Urban Planners
Social Workers
Recreation Workers
Clergy
Religious Workers, NEC
Lawyers
Judges
Authors
Technical Writers
93
94
Part IV
Reference
CENSUS CODE
185
186
187
188
189
193
194
195
197
198
199
203
204
205
206
207
208
213
214
215
216
217
218
223
224
225
226
227
228
229
233
234
235
243
253
254
255
256
257
258
259
263
264
265
JOB TITLE
Designers
Musicians and Composers
Actors and Directors
Painters, Sculptors, Craftsmen, Print-Maker
Photographers
Dancers
Artists, Performers, Related Workers, NEC
Editors and Reporters
Public Relations Specialists
Announcers
Athletes
Clinical Lab Technologists/Technicians
Dental Hygienists
Health Record Technologists/Technicians
Radiologic Technicians
Licensed Practical Nurses
Health Technologists/Technicians, NEC
Electrical and Electronic Technicians
Industrial Engineering Technicians
Mechanical Engineering Technicians
Engineering Technicians, NEC
Drafting Occupations
Surveying and Mapping Technicians
Biological Technicians
Chemical Technicians
Science Technicians, NEC
Airplane Pilots and Navigators
Air Traffic Controllers
Broadcast Equipment Operators
Computer Programmers
Tool Programmers, Numerical Control
Legal Assistants
Technicians, NEC
Supervisors/Proprietors, Sales Occupation
Insurance Sales Occupations
Real Estate Sales Occupations
Securities/Financial Serv Sales Occup
Advertising & Related Sales Occupations
Sales Occupations, Other Business Serv
Sales Engineers
Sales Rep, Mining, Manufacturing, Wholesale
Sales Workers, Motor Vehicles and Boats
Sales Workers, Apparel
Sales Workers, Shoes
Chapter 16 Worker Characteristic Structure
CENSUS CODE
266
267
268
269
274
275
276
277
278
283
284
285
303
304
305
306
307
308
309
313
314
315
316
317
318
319
323
325
326
327
328
329
335
336
337
338
339
343
344
345
346
347
348
353
JOB TITLE
Sales Workers, Furniture/Home Furnishings
Sales Workers Radio, TV, Hi-Fi, Appliances
Sales Workers, Hardware/Building Supplies
Sales Workers, Parts
Sales Workers, Other Commodities
Sales Counter Clerks
Cashiers
Street and Door-To-Door Sales Workers
News Vendors
Demonstrators, Promoters and Models, Sales
Auctioneers
Sales Support Occupations, NEC
Supervisors, General Office
Supervisors, Computer Equipment Operators
Supervisors, Financial Records Processing
Chief Communications Operators
Supervisors, Distrib, Schedul, Adjust Clrks
Computer Operators
Peripheral Equipment Operators
Secretaries
Stenographers
Typists
Interviewers
Hotel Clerks
Transportation Ticket/Reservation Agents
Receptionists
Information Clerks, NEC
Classified-Ad Clerks
Correspondence Clerks
Order Clerks
Personnel Clerks, Exc Payroll/Timekeeping
Library Clerks
File Clerks
Records Clerks
Bookkeepers, Accounting, Auditing Clerks
Payroll and Timekeeping Clerks
Billing Clerks
Cost and Rate Clerks
Billing, Posting, Calculat Machine Oper
Duplicating Machine Operators
Mail Preparing/Paper Handling Mach Oper
Office Machine Operators, NEC
Telephone Operators
Communications Equipment Oper, NEC
95
96
Part IV
Reference
CENSUS CODE
354
355
356
357
359
363
364
365
366
368
373
374
375
376
377
378
379
383
384
385
386
387
389
403
404
405
406
407
413
414
415
416
417
418
423
424
425
426
427
433
434
435
436
438
JOB TITLE
Postal Clerks, Exc Mail Carriers
Mail Carriers, Postal Service
Mail Clerks, Exc Postal Service
Messengers
Dispatchers
Production Coordinators
Traffic, Shipping, and Receiving Clerks
Stock and Inventory Clerks
Meter Readers
Weighers, Measurers, Checkers & Samplers
Expediters
Material Recording, Sched Clerks, NEC
Insurance Adjusters, Examiners, Investig
Investigators and Adjusters, Exc Insuranc
Eligibility Clerks, Social Welfare
Bill and Account Collectors
General Office Clerks
Bank Tellers
Proofreaders
Data-Entry Keyers
Statistical Clerks
Teachers' Aides
Administrative Support Occup, NEC
Launderers and Ironers
Cooks, Private Household
Housekeepers and Butlers
Child Care Workers, Private Household
Private Household Cleaners and Servants
Supervisors, Firefighting/Fire Prev Occup
Supervisors, Police and Detectives
Supervisors, Guards
Fire Inspection/Fire Prev Occupations
Firefighting Occupations
Police and Detectives, Public Service
Sheriffs, Bailiffs, Law Enforc Officers
Correctional Institution Officers
Crossing Guards
Guards and Police, Exc Public Service
Protective Service Occupations, NEC
Supervisors, Food Prep/Service Occup
Bartenders
Waiters and Waitresses
Cooks
Food Counter/Fountain/Related Occupation
Chapter 16 Worker Characteristic Structure
CENSUS CODE
439
443
444
445
446
447
448
449
453
454
455
456
457
458
459
461
462
463
464
465
466
467
468
469
473
474
475
476
477
479
483
484
485
486
487
488
489
494
495
496
497
498
499
503
JOB TITLE
Kitchen Workers, Food Preparation
Waiters/Waitresses' Assistants
Miscellaneous Food Preparation Occup
Dental Assistants
Health Aides, Except Nursing
Nursing Aides, Orderlies, and Attendants
Supervisors, Cleaning/Blding Serv Worker
Maids and Housemen
Janitors and Cleaners
Elevator Operators
Pest Control Occupations
Supervisors, Personal Service Occup
Barbers
Hairdressers and Cosmetologists
Attendants, Amusement/Recreation Facility
Guides
Ushers
Public Transportation Attendants
Baggage Porters and Bellhops
Welfare Service Aides
Family Child Care Providers
Early Childhood Teacher's Assistants
Child Care Workers, NEC
Personal Service Occupations, NEC
Farmers, Except Horticultural
Horticultural Specialty Farmers
Managers, Farms, Except Horticultural
Managers, Horticultural Specialty Farms
Supervisors, Farm Workers
Farm Workers
Marine Life Cultivation Workers
Nursery Workers
Supervisors, Related Agricult Occupations
Groundskeepers and Gardeners, Except Farm
Animal Caretakers, Except Farm
Graders and Sorters, Agricult Products
Inspectors, Agricultural Products
Supervisors, Forestry/Logging Workers
Forestry Workers, Except Logging
Timber Cutting/Logging Occupations
Captains & Officers, Fishing Vessels
Fishers
Hunters and Trappers
Supervisors, Mechanics and Repairers
97
98
Part IV
Reference
CENSUS CODE
505
506
507
508
509
514
515
516
517
518
519
523
525
526
527
529
533
534
535
536
538
539
543
544
547
549
553
554
555
556
557
558
563
564
565
566
567
569
573
575
576
577
579
583
JOB TITLE
Automobile Mechanics
Automobile Mechanic Apprentices
Bus, Truck, Stationary Engine Mechanics
Aircraft Engine Mechanics
Small Engine Repairers
Automobile Body and Related Repairers
Aircraft Mechanics, Exc Engine
Heavy Equipment Mechanics
Farm Equipment Mechanics
Industrial Machinery Repairers
Machinery Maintenance Occupations
Electronic Repairers, Commun/Indust Equip
Data Processing Equipment Repairers
Household Appliance/Power Tool Repairers
Telephone Line Installers and Repairers
Telephone Installers and Repairers
Misc Elec/Electronic Equip Repairers
Heating, Air Cond, Refrigeration Mechanics
Camera, Watch, Musical Instrument Repairer
Locksmiths and Safe Repairers
Office Machine Repairers
Mechanical Controls and Valve Repairers
Elevator Installers and Repairers
Millwrights
Specified Mechanics and Repairers, NEC
Not Specified Mechanics and Repairers
Supervisors, Brickmasons, Stonemasons, Tile
Supervisors, Carpenters/Related Workers
Supervisors, Elec/Power Transm Installers
Superv Painters, Paperhangers/Plasters
Superv, Plumbers, Pipefitters, Steamfitters
Supervisors, Construction, NEC
Brickmasons and Stonemasons
Brickmason and Stonemason Apprentices
Tile Setters, Hard and Soft
Carpet Installers
Carpenters
Carpenter Apprentices
Drywall Installers
Electricians
Electrician Apprentices
Electrical Power Installers/Repairers
Painters, Construc tion and Maintenance
Paperhangers
Chapter 16 Worker Characteristic Structure
CENSUS CODE
584
585
587
588
589
593
594
595
596
597
598
599
613
614
615
616
617
628
634
635
636
637
639
643
644
645
646
647
649
653
654
655
656
657
658
659
666
667
668
669
674
675
676
677
JOB TITLE
Plasterers
Plumbers, Pipefitters, and Steamfitters
Plumber, Pipefitter, Steamfitter Apprent
Concrete and Terrazzo Finishers
Glaziers
Insulation Workers
Paving, Surfacing, Tamping Eq uip Operator
Roofers
Sheetmetal Duct Installers
Structural Metal Workers
Drillers, Earth
Construction Trades, NEC
Supervisors, Extractive Occupations
Drillers, Oil Well
Explosives Workers
Mining Machine Operators
Mining Occupations, NEC
Supervisors, Production Occupations
Tool and Die Makers
Tool and Die Maker Apprentices
Precision Assemblers, Metal
Machinists
Machinists Apprentices
Boilermakers
Precision Grinders, Fitters, Tool Sharpen
Patternmakers and Model Makers, Metal
Lay-Out Workers
Precious Stones/Metals Workers-Jewelers
Engravers, Metal
Sheet Metal Workers
Sheet Metal Worker Apprentices
Miscellaneous Precision Metal Workers
Patternmakers and Model Makers, Wood
Cabinet Makers and Bench Carpenters
Furniture and Wood Finishers
Miscellaneous Precision Woodworkers
Dressmakers
Tailors
Upholsterers
Shoe Repairers
Misc Precision Apparel/Fabric Workers
Hand Molders and Shapers, Exc Jewelers
Patternmakers, Lay-Out Workers, Cutters
Optical Goods Workers
99
100
Part IV
Reference
CENSUS CODE
678
679
683
684
686
687
688
689
693
694
695
696
699
703
704
705
706
707
708
709
713
714
715
717
719
723
724
725
726
727
728
729
733
734
735
736
737
738
739
743
744
745
747
748
JOB TITLE
Dental Lab/Medical Appliance Technicians
Bookbinders
Elec/Electronic Equipment Assemblers
Miscellaneous Precision Workers, NEC
Butchers and Meat Cutters
Bakers
Food Batchmakers
Inspectors, Testers, and Graders
Adjusters and Calibrators
Water/Sewage Treatment Plant Operators
Power Plant Operators
Stationary Engineers
Miscellaneous Plant and System Operators
Lathe/Turning Machine Set-Up Operators
Lathe and Turning Machine Operators
Milling and Planing Machine Operators
Punching/Stamping Press Machine Oper
Rolling Machine Operators
Drilling and Boring Machine Operators
Grinding, Abrading, Buffing Mach Op
Forging Machine Operators
Numerical Control Machine Operators
Misc Metal, Plastic, Stone, Glass Mach Op
Fabricating Machine Operators, NEC
Molding and Casting Machine Operators
Metal Plating Machine Operators
Heat Treating Equipment Operators
Misc Metal/Plastic Processing Mach Op
Wood Lathe, Routing, Planing Machine Oper
Sawing Machine Operators
Shaping and Joining Machine Operators
Nailing and Tacking Machine Operators
Miscellaneous Woodworking Machine Oper
Printing Press Operators
Photoengravers and Lithographers
Typesetters and Compositors
Miscellaneous Printing Machine Oper
Winding and Twisting Machine Operators
Knitting, Looping, Taping, Weaving Mach Op
Textile Cutting Machine Operators
Textile Sewing Machine Operators
Shoe Machine Operators
Pressing Machine Operators
Laundering and Dry Cleaning Machine Oper
Chapter 16 Worker Characteristic Structure
CENSUS CODE
749
753
754
755
756
757
758
759
763
764
765
766
768
769
773
774
777
779
783
784
785
786
787
789
793
795
796
797
798
799
803
804
806
808
809
813
814
823
824
825
826
828
829
833
JOB TITLE
Miscellaneous Textile Machine Operators
Cementing and Gluing Machine Operators
Packaging and Filling Machine Operators
Extruding and Forming Machine Operators
Mixing and Blending Machine Operators
Separating, Filtering, Clarifying Mach Op
Compressing/Compacting Machine Operators
Painting/Paint Spraying Machine Oper
Roasting/Baking Machine Operators, Food
Washing/Cleaning/Pickling Machine Oper
Folding Machine Operators
Furnace/Kiln/Oven Operators, Exc Food
Crushing and Grinding Machine Operators
Slicing and Cutting Machine Operators
Motion Picture Projectionists
Photographic Process Machine Operators
Miscellaneous Machine Operators, NEC
Machine Operators, Not Specified
Welders and Cutters
Solderers and Brazers
Assemblers
Hand Cutting and Trimming Occupations
Hand Molding, Casting, and Forming Occup
Hand Printing, Coating, Decorating Occup
Hand Engraving and Printing Occupations
Miscellaneous Hand Working Occupations
Production Insp, Checkers, and Examiners
Production Testers
Production Samplers and Weighers
Graders and Sorters, Exc Agricultural
Supervisors, Motor Vehicle Operators
Truck Drivers
Driver-Sales Workers
Bus Drivers
Taxicab Drivers and Chauffeurs
Parking Lot Attendants
Motor Transportation Occupations, NEC
Railroad Conductors and Yardmasters
Locomotive Operating Occupations
Railroad Brake, Signal, and Switch Oper
Rail Vehicle Operators, NEC
Ship Captains/Mates, Except Fishing Boats
Sailors and Deckhands
Marine Engineers
101
102
Part IV
Reference
CENSUS CODE
834
843
844
845
848
849
853
855
856
859
864
865
866
867
868
869
874
875
876
877
878
883
885
887
888
889
JOB TITLE
Bridge, Lock and Lighthouse Tenders
Supervisors, Material Moving Equip Oper
Operating Engineers
Longshore Equipment Operators
Hoist and Winch Operators
Crane and Tower Operators
Excavating and Loading Machine Operators
Grader, Dozer, and Scraper Operators
Industrial Truck/Tractor Equipment Oper
Miscellaneous Material Moving Equip Oper
Superv, Handlers, Equip Cleaners/Laborers
Helpers, Mechanics and Repairers
Helpers, Construction Traders
Helpers, Surveyors
Helpers, Extractive Occupations
Construction Laborers
Production Helpers
Garbage Collectors
Stevedores
Stock Handlers and Baggers
Machine Feeders and Offbearers
Freight/Stock/ Material Handlers, NEC
Garage/Service Station Related Occup
Vehicle Washers and Equipment Cleaners
Hand Packers and Packagers
Laborers, Except Construction
Example of Usage Within VALE:
'Census Code > 389'
selects from only those jobs in Census Code
categories 403 through 889. Note that this produces
the same result as 'Group > 2' (refer to the definition
of 'Census Group').
Census Group
The Census Group number of a job represents the broad occupational category under
which the job is classified. The one-page VALE summary provided with all VALE
reports lists job selections by these six broad occupational categories (groups):
Chapter 16 Worker Characteristic Structure
GROUP NUMBER
1
2
3
4
5
6
OCCUPATIONAL CATEGORY
Managerial and Professional Specialty Occupations
(contains Census Code Numbers (CCNs) 3 through 199)
Technical, Sales, and Administrative Support Occupations
(contains CCNs 203 through 389)
Service Occupations
(contains CCNs 403 through 469)
Farming, Forestry, and Fishing Occupations
(contains CCNs 473 through 499)
Precision Production, Craft, and Repair Occupations
(contains CCNs 503 through 699)
Operators, Fabricators, and Laborers
(contains CCNs 703 through 889)
Examples of Usage Within VALE:
'Census Group = 4'
'Census Group > 4'
'Census Group >= 4'
selects only those jobs in group 4.
selects only those jobs in groups 5 through 6.
selects only those jobs in groups 4 through 6.
DOT Code
Using this characteristic, you may specify a range of DOT job numbers to include or omit
in a given report. You will rarely make selections using this variable. Instead, the
'Census Group' or 'Census Code' characteristics (explained in the preceding sections) may
be easier to use and usually yield the same result.
Example of Usage Within VALE:
'DOT Code Between
250.157-010 and 299.687-014'
selects jobs from DOT number 250.157-010
(Superintendent, Sales) through DOT number
299.687-014 (Sandwich-Board Carrier). Note that
this range includes all sales occupations.
Data, People, Things
The middle three digits of the DOT occupational code are the worker functions ratings of
the tasks performed in the occupation. Every job requires a worker to function to some
degree in relation to data, people, and things. A separate digit expresses the worker's
relationship to each of these three groups.
103
104
Part IV
Reference
Worker functions involving more complex responsibility and judgment are assigned
lower numbers in these three lists while functions which are less complicated have higher
numbers. For example, "synthesizing" and "coordinating" data are more complex tasks
than "copying" data; "instructing" people involves a broader responsibility than "taking
instructions-helping"; and "operating" things is a more complicated task than "handling"
things.
DATA
0 Synthesizing
1 Coordinating
2 Analyzing
3 Compiling
4 Computing
5 Copying
6 Comparing
PEOPLE
0 Mentoring
1 Negotiating
2 Instructing
3 Supervising
4 Diverting
5 Persuading
6 Speaking-Signaling
7 Serving
8 Taking Instructions Helping
THINGS
0 Setting Up
1 Precision Working
2 Operating-Controlling
3 Driving-Operating
4 Manipulating
5 Tending
6 Feeding-Offbearing
7 Handling
Examples of Usage Within VALE:
'Data = 3'
'People < 5'
selects jobs that require data compilation.
selects jobs that require interaction with people,
from taking instructions or helping to speaking or
signaling.
selects jobs that require interaction with things,
from handling to manipulating.
'Things <= 4'
Value Levels for Environmental Conditions and Physical
Demands
Analysts use the following symbols to indicate the absence or presence (and when
present, the frequency of occurrence) of the Environmental Conditions and Physical
Demands (except strength).
CODE
1
2
3
FREQUENCY
Not Present
Occasionally
Frequently
4
Constantly
DEFINITION
Activity or condition does not exist.
Activity or condition exists up to 1/3 of the time.
Activity or condition exists from 1/3 to 2/3 of the
time.
Activity or condition exists 2/3 or more of the time.
Chapter 16 Worker Characteristic Structure
Environmental Conditions
Environmental conditions are the physical surroundings of a worker in a specific job.
Following is a list of the variables used by VALE.
ENVIRONMENTAL
CONDITIONS
(VALE CHARACTERISTIC)
Exposure to Weather
Extreme Cold
Extreme Heat
Wet and/or Humid
Noise Intensity Level
WHAT IT MEANS
Exposure to outside atmospheric conditions.
Exposure to non weather-related cold temperatures.
Exposure to non weather-related hot temperatures.
Contact with water or other liquids or exposure to
non weather-related humid cond itions.
The noise intensity level to which the worker is
exposed in the job environment. This factor is
expressed by one of five levels. Consider all the
benchmarks within a level as providing an insight
into the nature of the specific levels.
Level
Very Quiet
Vibratio n
Atmospheric Conditions
Proximity to Moving Mechanical
Parts
Exposure to Electrical Shock
Working in High Exposed Places
Exposure to Radiation
Illustrative Examples
isolation booth for hearing test; deep
sea diving; forest trail
Quiet
library, many private offices; funeral
reception, golf course, art museum
Moderate
business office where typewriters
are used; department store; grocery
store; light traffic; fast food
restaurant at off- hours
Loud
can manufacturing department; large
earth- moving equipment, heavy
traffic
Very Loud
rock concert - front row;
jackhammer work, rocket engine
testing area during test
Exposure to shaking object or surface.
Exposure to conditions such as fumes, noxious
odors, dusts, mists, gases, and poor ventilation, that
affect the respiratory system, eyes, or the skin.
Exposure to possible bodily injuries from moving
mechanical parts of equipment, tools, or machinery.
Exposure to possible bodily injury from electrical
shock.
Exposure to possible bodily injury from falling.
Exposure to possible bodily injury from radiation.
105
106
Part IV
Reference
ENVIRONMENTAL
CONDITIONS
(VALE CHARACTERISTIC)
Working with Explosives
Exposure to Toxic or Caustic
Chemicals
Other Environmental Condition
WHAT IT MEANS
Exposure to possible injury from explosions.
Exposure to possible bodily injury from toxic or
caustic che micals.
Examples of Usage Within VALE:
'Exposure to Weather = 2 - Occasional
'Exposure to Weather < 3 - Frequently
selects jobs where the exposure to
weather is on an occasional basis.
selects jobs where the exposure to
weather is not present or is on an
occasional basis.
Physical Demands
The physical demands used with VALE serve as a means of expressing both the physical
requirements of the job and the physical capacities (specific physical traits) a worker
must have to meet those required by many jobs, and also the name of a specific capacity
possessed by many people. The worker must possess physical capacities at least in an
amount equal to the physical demands made by the job.
PHYSICAL DEMAND
(VALE
CHARACTERISTIC)
Climbing
Balancing
Stooping
Kneeling
Crouching
Crawling
WHAT IT MEANS
Ascending or descending ladders, stairs, scaffolding,
ramps, poles, and the like, using feet and legs or hands
and arms. Body agility is emphasized.
Maintaining body equilibrium to prevent falling when
walking, standing, crouching, or running on narrow,
slippery, or erratically moving surfaces; or
maintaining body equilibrium when performing
gymnastic feats.
Bending body downward and forward by bending
spine at the waist, requiring full use of the lower
extremities and back muscles.
Bending legs at knees to come to rest on knee or
knees.
Bending body downward and forward by bending legs
and spine.
Moving about on hands and knees or hands and feet.
Chapter 16 Worker Characteristic Structure
PHYSICAL DEMAND
(VALE
CHARACTERISTIC)
Reaching
Handling
Fingering
Feeling
Talking
Hearing
Tasting/Smelling
Near Acuity
Far Acuity
Depth Perception
Accommodation
Color Vision
Field of Vision
WHAT IT MEANS
Extending hand(s) and arm(s) in any direction.
Seizing, holding, grasping, turning, or otherwise
working with hand or hands. Fingers are involved
only to the extent that they are an extension of the
hand, such as to run a switch or shift automobile
gears.
Picking, pinching, or otherwise working primarily
with fingers rather than with the whole hand or arm as
in handling.
Perceiving attributes of objects, such as size, shape,
temperature, or texture, by touching with skin,
particularly that of fingertips.
Expressing or exchanging ideas by means of the
spoken word to impart oral information to clients or to
the public and to convey detailed spoken instructions
to other workers accurately, loudly, or quickly.
Perceiving the nature of sounds by ear.
Distinguishing, with a degree of accuracy, differences
or similarities in intensity or quality of flavors or
odors, or recognizing particular flavors or odors, using
tongue or nose.
Clarity of vision at 20 inches or less.
Clarity of vision at 20 feet or more.
Three-dimensional vision. Ability to judge distances
and spatial relationships so as to see objects where
and as they actually are.
Adjustment of lens of eye to bring an object into sharp
focus. This factor is required when doing near point
work at varying distances from the eye.
Ability to identify and distinguish colors.
Observing an area that can be seen up and down or to
right and left while eyes are fixed on a given point.
The strength factor is expressed in terms of Sedentary, Light, Medium, Heavy, and Very
Heavy. It is measured by involvement of the worker with one or more of the following
activities:
a.
Worker position(s):
1) Standing: Remaining on one's feet in an upright position at a workstation
without moving about.
2) Walking: Moving about on foot.
107
108
Part IV
Reference
3) Sitting: Remaining in the normal seated position.
b.
Worker movement of objects (including extremities used):
1) Lifting: Raising or lowering an object from one level to another (includes
upward pulling).
2) Carrying: Transporting an object, usually holding it in the hands or arms or
on the shoulder.
3) Pushing: Exerting force upon an object so that the object moves away from
the force (includes slapping, striking, kicking, and treadle actions).
4) Pulling: Exerting force upon an object so that the object moves toward the
force (includes jerking).
Five Degrees of Strength
STRENGTH
LEVEL
Sedentary
Light
Medium
WHAT IT MEANS
Sedentary work involves exerting up to 10 pounds of force
occasionally or a negligible amount of force frequently to lift,
carry, push, pull, or otherwise move objects, including the
human body. Sedentary work involves sitting most of the time,
but may involve walking or standing for brief periods of time.
Jobs may be defined as Sedentary when walking and standing
are required only occasionally and all other Sedentary criteria
are met.
Light work involves exerting up to 20 pounds of force
occasionally, or up to 10 pounds of force frequently, or a
negligible amount of force constantly to move objects. Physical
demand requirements are in excess of those for Sedentary work.
Even though the weight lifted may be only a negligible amount,
a job/occupation is rated Light work when it requires: (1)
walking or standing to a significant degree; (2) sitting most of
the time while pushing or pulling arm or leg controls; or (3)
working at a production rate pace while constantly pushing or
pulling materials even though the weight of the materials is
negligible. (The constant stress and strain of maintaining a
production rate pace, especially in an industrial setting, can be
and is physically demanding of a worker even though the
amount of force exerted is negligible.)
Medium work involves exerting 20 to 50 pounds of force
occasionally, or 10 to 25 pounds of force frequently, or an
amount greater than negligible and up to 10 pounds constantly
to move objects. Physical demand requirements are in excess of
those for Light work.
Chapter 16 Worker Characteristic Structure
STRENGTH
LEVEL
Heavy
WHAT IT MEANS
Heavy work involves exerting 50 to 100 pounds of force
occasionally, or 25 to 50 pounds of force frequently, or 10 to 20
pounds of force constantly to move objects. Physical demand
requirements are in excess of those for Medium work.
Very Heavy work involves exerting in excess of 100 pounds of
force occasionally, or in excess of 50 pounds of force
frequently, or in excess of 20 pounds of force constantly to
move objects. Physical demand requirements are in excess of
those for Heavy work.
Very Heavy
Limits of Weights Lifted/Carried or Force Exerted
RATING
Sedentary
Light
Medium
Heavy
Very Heavy
OCCASIONALLY
*-10
*-20
20-50
50-100
100+
FREQUENTLY
*
*-10
10-25
25-50
50+
CONSTANTLY
N/A
*
*-10
10-20
20+
* = negligible weight; N/A - Not Applicable
In the preceding chart, lifting, pushing, and pulling are expressed in terms of both
intensity and duration. Judgments regarding intensity involve consideration of the weight
handled, position of the worker's body or the part of the worker's body used in handling
weights, and the aid given by helpers or by mechanical equipment. Duration is the total
time spent by the worker in carrying out these activities. Carrying most often is
expressed in terms of duration, weight carried, and distance carried. This information is
summarized in the table below.
The range excludes the lower number and includes the higher number, i.e., the range 1025 excludes 10 (begins at 10+) and includes 25. Overlapping ranges of *-10 in the
Occasionally column for Sedentary work and Light work occupations are differentiated
on the basis of the worker's posture and the rate at which work is performed. For
example, all Sedentary occupations involve sitting constantly. However, in some
occupations workers sit constantly but exert force of an amount or at a frequency rate that
exceeds those for Sedentary work. Such occupations are, therefore, rated at least for
Light wo rk.
Examples of Usage Within VALE:
'Strength = 3 - Medium'
selects jobs that require the physical demands of
medium work only (this does not select jobs that
require sedentary and light work).
109
110
Part IV
Reference
'Strength <> 5 -Very Heavy'
'Strength <= 2 - Light'
'Climbing = 2 - Occasionally'
'Balancing <= 3 - Frequently'
selects jobs that require sedentary, light, medium, and
heavy work ('<>' is the same as 'not equal to').
selects jobs that require either sedentary or light work.
selects jobs that require climbing on an occasional
basis.
selects jobs that do not require balancing or require it
on an occasional or frequent basis.
Reasoning, Math, Language
Reasoning, Math, and Language represent General Educational Development (GED)
levels. GED embraces those aspects of education (formal and informal) which contribute
to the worker's (a) reasoning development and ability to follow instructions, and (b)
acquisition of "tool" knowledges such as language and mathematical skills. This is
education of a general nature which does not have a recognized, fairly specific
occupational objective. Ordinarily, such education is obtained in elementary school, high
school, or college. However, it derives also from experience and self-study.
As noted above, GED involves three types of skill: reasoning (R), mathematics (M), and
language (L). Each skill is further defined in terms of six levels, as outlined on the
following page.
Examples of Usage Within VALE:
'Reasoning = 3'
'Math < 3'
'Language <= 3'
selects only jobs that require a reasoning level of 3.
selects only jobs that require math levels of 1 or 2.
selects only jobs that require language levels 1, 2, or
3.
Chapter 16 Worker Characteristic Structure
LEVEL
6
5
111
REASONING
DEVELOPMENT
MATHEMATICAL
DEVELOPMENT
LANGUAGE
DEVELOPMENT
Apply principles of
logical or scientific
thinking to a wide
range of
intellectual and
practical problems.
Deal with
nonverbal
symbolism
(formulas,
scientific
equations, graphs,
musical notes, etc.)
in its most difficult
phases. Deal with
a variety of
abstract and
concrete variables.
Apprehend the
most abstruse
classes of
concepts.
Apply principles of
logical or scientific
thinking to define
problems, collect
data, establish
facts, and draw
valid conclusions.
Interpret an
extensive variety
of technical
instructions in
mathematical or
diagrammatic
form. Deal with
several abstract
and concrete
variables.
Advanced Calculus:
Work with limits, continuity,
real number systems, mean
value theorems, and implicit
function theorems.
Modern Algebra:
Apply fundamental concepts of
theories of groups, rings, and
fields. Work with
differential equations, linear
algebra, infinite series,
advanced operations
methods, and functions of
real and complex variables.
Statistics:
Work with mathematical
statistics, mathematical
probability and applications,
experimental design,
statistical inference, and
econometrics.
Same as Level 5
Algebra:
Work with exponents and
logarithms, linear equations,
quadratic equations,
mathematical induction and
binomial theorem, and
permutations.
Calculus:
Apply concepts of analytic
geometry, differentiations,
and integration of algebraic
functions with applications.
Statistics:
Apply mathematical operations
to frequency distributions,
reliability and validity of
tests, normal curve, analysis
of variance, correlation
techniques, chi-square
application and sampling
theory, and factor analysis.
Reading:
Read literature, book and play
reviews, scientific and
technical journals, abstracts,
financial reports, and legal
documents.
Writing:
Write novels, plays, editorials,
journals, speeches, manuals,
critiques, poetry, and songs.
Speaking:
Conversant in the theory,
principles, and methods of
effective and persuasive
speaking, voice and diction,
phonetics, and discussion
and debate.
112
Part IV
LEVEL
4
3
Reference
REASONING
DEVELOPMENT
MATHEMATICAL
DEVELOPMENT
LANGUAGE
DEVELOPMENT
Apply principles of
rational systems to
solve practical
problems and deal
with a variety of
concrete variables
in situation where
only limited
standardization
exists. Interpret a
variety of
instructions
furnished in
written, oral,
diagrammatic, or
schedule form.
(Examples of
rational systems
include:
bookkeeping,
internal
combustion
engines, electric
wiring systems,
house building,
farm management,
and navigation)
Apply commonsense
understanding to
carry out
instructions
furnished in
written, oral, or
diagrammatic
form. Deal with
problems
involving several
concrete variables
in or from
standardized
situations.
Algebra:
Deal with system of real
numbers, linear, quadratic,
rational, exponential,
logarithmic, angle and
circular functions, and
inverse functions; related
algebraic solution of
equations and inequalities;
limits and continuity; and
probability and statistical
inference.
Geometry:
Deductive axiomatic geometry,
plane and solid, and
rectangular coordinates.
Shop Math:
Practical application of
fractions, percentages, ratio
and proportion,
measurement, logarithms,
practical algebra, geometric
construction, and essentials
of trigonometry.
Reading;
Read novels, poems,
newspapers, periodicals,
journals, manuals,
dictionaries, thesauruses, and
encyclopedias.
Writing:
Prepare business letters,
expositions, summaries, and
reports, using prescribed
format and conforming to all
rules of punctuation,
grammar, diction, and style.
Speaking:
Participate in panel discussions,
dramatizations, and debates.
Speak extemporaneously on
a variety of subjects.
Compute discount, interest,
profit, and loss; commission,
markup, and selling price;
ratio and proportion; and
percentage. Calculate
surfaces, volumes, weights,
and measures.
Algebra:
Calculate variables and
formulas; monomials and
polynomials; ratio and
proportion variables; and
square roots and radicals.
Geometry:
Calculate plane and solid
figures, circumference, area,
and volume. Understand
kinds of angles and
properties of pairs of angles.
Reading:
Read a variety of novels,
magazines, atlases, and
encyclopedias.
Read safety rules, instructions in
the use and maintenance of
shop tools and equipment,
and methods and procedures
in mechanical drawing and
layout work.
Writing:
Write reports and essays with
proper format, punctuation,
spelling, and grammar, using
all parts of speech.
Speaking:
Speak before an audience with
poise, voice control, and
confidence, using correct
English and well-modulated
voice.
Chapter 16 Worker Characteristic Structure
113
REASONING
DEVELOPMENT
MATHEMATICAL
DEVELOPMENT
LANGUAGE
DEVELOPMENT
2
Apply commonsense
understanding to
carry out detailed
but uninvolved
written or oral
instructions. Deal
with problems
involving a few
concrete variables
in or from
standardized
situations.
Add, subtract, multiply, and
divide all units of measure.
Perform the four operations
with like common and
decimal fractions. Compute
ratio, rate, and percent.
Draw and interpret bar
graphs. Perform arithmetic
operation involving all
American monetary units.
1
Apply commonsense
understanding to
carry out simple
one- or two-step
instructions. Deal
with standardized
situations with
occasional or no
variables in or
from these
situations
encountered on the
job.
Add and subtract two-digit
numbers.
Multiply and divide 10's and
100's by 2, 3, 4, 5. Perform
the four basic arithmetic
operations with coins as part
of a dollar. Perform
operations with units such as
cup, pint, and quart; inch,
foot, and yard; and ounce
and pound.
Reading:
Passive vocabulary of 5,0006,000 words. Read at rate of
190-215 words per minute.
Read adventure stories and
comic books, looking up
unfamiliar words in
dictionary for meaning,
spelling, and pronunciation.
Read instructions for
assembling model cars and
airplanes.
Writing:
Write compound and complex
sentences, using cursive
style, proper end
punctuation, and employing
adjectives and adverbs.
Speaking:
Speak clearly and distinctly
with appropriate pauses and
emphasis, correct
pronunciation, variations in
word order, using present
perfect, and future tenses.
Reading:
Recognize meaning of 2,500
(two- or three-syllable)
words. Read at rate of 95120 words per minute.
Compare similarities and
differences between words
and between series of
numbers.
Writing:
Print simple sentences
containing subject, verb, and
object, and series of
numbers, names, and
addresses.
Speaking:
Speak simple sentences, using
normal word order, and
present and past tenses.
LEVEL
114
Part IV
Reference
SVP (Specific Vocational Preparation)
The SVP represents the amount of time required to learn the techniques, acquire
information, and develop the facility needed for average performance in a specific jobworker situation. The training may be acquired in a school, work, military, vocational, or
an institutional environment. It does not include orientation training required of every
fully qualified worker to become accustomed to the special conditions of any new job.
Specific vocational training includes training given in any of the following
circumstances:
a. Vocational education (such as high school commercial or shop training, technical
school, art school, and that part of college training which is organized around a
specific vocational objective);
b. Apprentice training (for apprenticeable jobs only);
c. In-plant training (given by an employer in the form of organized classroom study);
d. On-the-job training (serving as a learner or trainee on the job under the instruction of
a qualified worker);
e. Essential experience in other jobs (serving in less responsible jobs which lead to the
higher grade job or serving in other jobs that qualify).
Below is an explanation of the various levels of Specific Vocational Preparation.
LEVEL
1
2
3
4
5
6
7
8
9
TIME
Short demonstration
Anything beyond short demonstration up to and including 30
days.
Over 30 days up to and including 3 months.
Over 3 months up to and including 6 months.
Over 6 months up to and including 1 year.
Over 1 year up to and including 2 years.
Over 2 years up to and including 4 years.
Over 4 years up to and including 10 years.
Over 10 years.
Examples of Usage Within VALE:
'SVP = 3'
'SVP < 3'
'SVP <= 3'
'SVP Between 3 and 6'
selects only jobs that require SVP at level 3.
selects jobs that require SVP at levels 1 or 2.
selects jobs that require SVP at levels 1, 2, or 3.
selects jobs that require SVP at levels 3, 4, 5, or 6.
Chapter 16 Worker Characteristic Structure
Specific Worker Characteristic Details
See The Revised Handbook for Analyzing Jobs (1991). U.S. Department of Labor,
Employment and Training Administration. ISBN: 1-56370-051-4.
Logical Operators
Below is a list of the Logical Operators available for use when selecting Worker
Characteristics in the VALE program. The operators provide a means of selecting the
specific Characteristic Value you wish to use for the Worker Characteristic you have
chosen.
LOGICAL OPERATORS
=
>
<
>=
<=
Between
<>
WHAT IT MEANS
Is Equal To
Is Greater Than
Is Less Than
Is Greater Than or Equal To
Is Less Than or Equal To
Is Between Two Values (note that this includes the
endpoints of the range you select)
Is Not Equal To
115
116
Part IV
Reference
Chapter 17 VALE Calculations
Chapter 17 VALE Calculations
Every time VALE is used, the program scans 12,739 job titles. Each of the job titles from
the DOT is cross-referenced by the worker characteristics needed to satisfactory perform
work in the occupation. The U.S. Department of Labor, Employment and Training
Administration, assigns these characteristics. Each of these job titles is cross-walked to
one of 501 Census Code categories by the National Crosswalk Service Center, which is
an agent of the National Occupational Information Coordinating Committee.
Furthermore, each Census Code category is clustered within one of six broad
occupational groups.
Scanning the DOT
Assume that you wish to perform a VALE run search of all occupations requiring an
average level of general learning ability (General Learning Ability at level 3, the middle
one-third of the general population). The first thing VALE examines is the G-aptitude of
each of the DOTs contained in the first three-digit Census Code category. Assume that
VALE finds ten of these job titles in the first three-digit Census Code category. VALE
will inspect each of these ten job titles to see how many are defined by the Department of
Labor as requiring a G-aptitude of 3. If four of these ten job titles require a G-aptitude of
3, VALE estimates a person with an average level of general learning ability will be able
to satisfactorily perform work in forty percent (four out of every ten) of all jobs available
in the first Census Code category.
At this point, VALE will find the number of people employed in jobs classified under the
first Census Code category. Let us assume that 100 people are employed in the local
labor market within the first Census Code category. Since VALE estimated that 40
percent of the people employed in this Census Code Category are performing work
requiring a G-aptitude of 3, it will report that 40 of these 100 employed people have jobs
requiring an average level of general learning ability. It also estimates that all of the 40
selected workers earn the average earnings for all workers in the first Census Code. Once
VALE has estimated labor market access and earnings within the first Census Code
category, it will repeat this process for the remaining 500 Census Code categories.
Compilation of Results
When all 12,739 job titles have been processed by Census Code category, VALE begins
the task of compiling its findings. VALE now focuses on the six broad occupational
groups. All Census Code categories cross-referenced to the first broad occupational
group are identified. The 40 employed persons selected in the above example are added
117
118
Part IV
Reference
to the selection results of the other Census Code categories within the first broad
occupational group. The process is repeated for the remaining five groups. The six
results are then reported in a summary table. This table reports the total number of
workers employed, the percent employed, the number of workers selected, and the
percent selected in each of the six broad occupational groups for the relevant labor
market.
VALE can report either median or mean earnings. Let us begin by examining how
VALE computes median earnings. Assume that only the following small sample was
selected from a national run:
Census Code
Category Number
205
206
207
208
Selected Number of
Employed Persons
16,653
9,267
245,091
145,457
Census Code
Category Median
Annual Earnings
$19,517
$29,208
$22,634
$22,552
When sorted in ascending order by median annual earnings, the following data are
obtained:
Census Code
Category Number
205
208
207
206
Selected Number of
Employed Persons
16,653
145,457
245,091
9,267
416,468
Census Code
Category Median
Annual Earnings
$19,517
$22,552
$22,634
$29,208
VALE then determines the midpoint of all selected employed persons ({416,468 divided
by 2}+ 1 = 208,235 2 ) and proceeds to determine the Census Code category which
contains the midpoint worker once earnings are sorted from smallest to largest. This is
the first Census Code category of the sorted data where the cumulative frequency (total
2
To determine the “midpoint worker,” VALE first takes the total selected number of
employed persons and divides it by two. It then takes this number and adds one to it.
The first integer greater than or equal to this result is the “midpoint worker.” Therefore,
if the total selected number of employed persons is an even number, like 416468, then the
midpoint worker is one more than half of 416468 or 208235. If the total number selected
happened to be an odd number, like 416467, then half of this number plus one equals
208234.5. VALE will go to the next largest integer, 208235, and consider that worker
the midpoint worker.
Chapter 17 VALE Calculations
number of selected persons in a Census Code category or previous Census Code
category) equals or exceeds 208,235.
Using the example above, the highest Census Code category of the rank-ordered data
contains 9,267 people. Since there are no previous categories before this one, the
cumulative frequency for Census Code category 206 is simply 9,267. This cumulative
frequency is less than 208,235 so it is not the Census Code category containing the
midpoint worker. The second highest rank-ordered Census Code category has 245,091
employed persons. The cumulative frequency for this category is the total number of
people in the first two categories combined which is 9,267 + 245,091 = 254,358. This
cumulative frequency does exceed 208,235 indicating that the midpoint worker is
somewhere in Census Code category 207. In this case VALE would report annual
median earnings of $22,634. This median level of annual earnings would be for all
people in the United States working at jobs requiring an average degree of general
learning ability.
Now let us assume that you are interested in mean annual earnings instead of median
annual earnings. Assume that only the following small sample was selected from a
national run:
Census Code
Category Number
205
206
207
208
Selected Number of
Employed Persons
16,653
9,267
245,091
145,457
416,468
Census Code
Category Mean
Weekly Earnings
$19,517
$29,208
$22,634
$22,552
Computing mean annual earnings does not require sorting of the data. However, one
cannot simply add the four numbers in the Census Code Category Mean Weekly
Earnings column together and divide by four to get mean annual earnings. This would be
incorrect because this calculation would give equal weight to the mean earnings in each
of the four Census Code categories. Clearly a larger percentage of people perform work
in Census Code category 207 than Census Code category 206.
In this situation, VALE computes a weighted average (WA). A simple way to compute
this weighted average is to sum together the total earnings of people in each of the four
Census Code categories and divide by the total number of selected employed persons. In
the example above, the total amount of earnings for the selected people working in
Census code category 205 is simply the average earnings for that occupational category
multiplied by the selected number of workers in that occupational category. In this
example, that would be $19,517 * 16,653 or $325,016,601. If we do this for the
remaining three Census Code categories, add the four figures together, and divide by the
total number of selected employed persons, we will have calculated the weighted
average. In this example, the weighted average is:
119
120
Part IV
Reference
WA = ( ($19,517 * 16,653) + ($29,208 * 9,267) + ($22,634 * 245,091) +
($22,552 * 145,457) ) / 416,468
= $22,627
This mean level of annual earnings would be for all people in the United States working
at jobs requiring an average degree of general learning ability.
Chapter 18 Worklife Probability Calculations
121
Chapter 18 Worklife Probability Sources and Calculations
Worklife expectancies in VALE 2000 are computed using the “LPE” model. This model
computes a person’s probability of working in any particular year by combining his or her
probabilities of life (L), participation (P), and employment (E) into a joint probability. This
appendix documents the source and derivation of these probabilities and demonstrates the
computation of a sample worklife expectancy statistic.
Probability of Life
The first building block of our worklife expectancy statistics is the probability of life (the “L”
of the LPE model). As we project the probability that a given person will be employed
several years in the future, we must weight this by the probability he or she will still be alive.
To do this, we employ the Life Survivors Data from Figure 62. 3 Extracted from the National
Center for Health Statistics, this table projects the number of persons of each gender still
alive at a given age. For both genders, the starting point was 100,000 live births.
We can use these values to determine the probability that a person of age x will live to age y.
For example, the probability that a male aged 25 (x) will live to the age of 70 (y) is
determined by dividing the number of survivors at the age of 70 by the number at the age of
25, or 68,632 ÷ 97,704 = 0.702. That is, the formula applied to determine the probability of
life at age y, given a current age of x, for each future year is:
P( L ) =
Surv y
Surv x
Thus, when computing a worklife statistic for a given age (x), the above formula is applied
for each subsequent age, substituting the appropriate number of survivors at age y, while
holding the number at age x constant. This is demonstrated in Figure 59 in the “LPE
Applied” section of this appendix.
3
This table is gender-, not education-specific for the United States population as a whole.
Thus, the probabilities of life are not education-specific.
122
Part IV
Reference
Participation and Employment Rates
The Annual Demographic Survey, or March supplement, of the Current Population Survey
(CPS) is the source of the probabilities of participation and employment used to derive the
worklife expectancy statistics. Specifically, the public use data files from this survey for
1992 through 2001 were pooled to produce the needed statistics, as summarized in Figure 63.
To ease the discussion and computation of these statistics, the joint probability of
participation and employment (PE) is more simply stated as the fraction (in decimal terms) of
the respective population that is employed. Thus, a PE rate of 0.750 for a particular group of
the population indicates that 75% of the people in this group are employed, with the
remaining 25% being either unemployed or out of the labor force.
The process of pooling the observations from the 10 years of CPS data to compute PE rates is
documented on the Vocational Economics web site. 4 For demonstrative purposes, Figure 56
presents an extract from Table 5 for Males between the age of 55 and 64 with less than a
High School degree and no work disability.
Year
Not Disabled
Est. Pop. (000)
Total
Empl.
n
Age Group: 55 to 64 Years Old
1992
1993
1994
1995
1996
1997
1998
1999
2000
2001
1,836
1,685
1,469
1,332
1,431
1,383
1,252
1,269
1,244
1,211
1,311
1,207
1,034
965
1,073
1,037
968
977
960
897
1,119
979
868
801
727
689
639
620
634
614
14,112
0.739
10,429
7,690
PE
Figure 56 Computation of PE Rate from Pooled CPS Years
In this exhibit, one line is listed for each of the 10 pooled years. The “Total” column reflects
the estimated total population size (in thousands) for this particular cell, using the CPS
official weights. The “Empl.” column provides the estimated number of people (in
thousands) in this cell that was employed at the time of the respective survey. Finally, the
“n” column depicts the actual number of cell observations in the CPS. Using 2001 as an
example, approximately 1,211,000 (Total) males were between the age of 55 and 64 with less
than a High School degree and no work disability. Of this group, 897,000 (Empl.) were
employed in March of 2001. The Census Bureau derived these quantities from a sample size
of 614 (n) individuals.
4
http://www.vocecon.com/technical/ftp/data/appdpe.pdf
Chapter 18 Worklife Probability Calculations
123
These three quantity columns are summed for the 10 pooled years, resulting in totals of
14,112,000 (Total), 10,429,000 (Empl.), and 7,690 (n). The average PE rate for these years
is then computed simply by dividing the total number employed (10,429,000) by the total
estimated population sizes (14,112,000), or 0.739. Stated more simply, for the 10 years
ended in 2001, approximately 73.9% of males between the age of 55 and 64 with less than a
High School degree and no work disability were employed.
This process is repeated for each potential combination of gender, age, education, and
disability status. The resulting PE’s are extracted and summarized in Figure 63 on page 130.
Insufficient Observations
An observant reader might notice that the above description of the PE computation process
meticulously computes the total number of observations (n) in the 10 pooled years, but
makes no use of it. Actually, this quantity plays an important role in monitoring our PE
statistics to protect against potential distortion from small sample sizes.
When considering the categorization for two genders, four levels of education, eight age
groups, and three disability categories, our computations subdivide our sample into 192
different cells. As a result, some of the cells for those with a work disability will have a
limited number of observations – perhaps so limited as to give an unreliable estimate of the
true rate of employment.
To remedy this situation, we identified all cells with fewer than 40 pooled observations, and
imputed a revised estimate as follows:
•
•
A “Disability Ratio ” for the appropriate gender and age group was computed by
comparing the average employment rate for persons with a work disability to the rate for
those with no work disability. This ratio is computed for each of the severe and not
severe work disability categories.
This Disability Ratio is multiplied by the corresponding rate of employment for a person
of the same age, education, and gender with no work disability.
Figure 57 details the five cells adjusted in this manner. For each cell, we present the original
sample size, the employment rate computed from that sample size, the rate for those with no
work disability, the disability ratio, and the imputed PE rate substituted for the original
estimate. Consider the first entry for an example. Males between 16 and 24, with at least a
baccalaureate degree and a not severe work disability, had only 29 (n) observations. Using
the CPS weights, these 29 individuals showed an employment rate of 0.716 (Original Rate).
The observed employment rate for males of the same age and education, but with no work
disability was 0.814 (Non-Dis. Rate). In general, all males with a not severe work disability
of this same age have rates of employment that are 94.2% (Disab. Ratio) of their counterparts
without a disability. Since the sample size is small, we discard the original rate and impute
the employment rate to be used by multiplying the nondisabled rate by the disability ratio,
resulting in 0.767 (Imputed Rate).
124
Part IV
Reference
Gender
Male
Male
Male
Male
Female
Education Disability Status
College Degree Disabled, Not Sev.
College Degree Disabled, Severe
College Degree Disabled, Severe
Some College
Disabled, Severe
College Degree Disabled, Severe
Age
Group
16 to 24
16 to 24
85 to 89
85 to 89
16 to 24
n
29
13
26
25
29
Original Non-Dis. Disab. Imputed
Rate
Rate
Ratio
Rate
0.716
0.814 94.2%
0.767
0.452
0.814 27.2%
0.221
0.000
0.110 0.0%
0.000
0.000
0.048 0.0%
0.000
0.241
0.851 32.3%
0.275
Figure 57 Adjustment for Insufficient Observations
CPS Extraction
The process employed to derive the quantities and PE rates is identical to that used by the
Census Bureau in its disability cross-tabulations. 5 One could compute the PE rate for any
specific year of a cell by dividing the total employed by the estimated population size from a
cell. The resulting rate should match that shown by the Census Bureau in its Table 2 of
cross-tabulations, using the “Percent Employed – Total” column of the Census table. The
exceptions here will be for 1992-1994, which are not posted on the Census web site, and for
the 75-84 and 85-89 age groups, which are not included in the Census Table 2.
Note also, that when using Census Table 2, statistics for those with a not severe work
disability must be imputed using data from the “With a work disability” and “With a severe
work disability” categories. Since the former category includes persons with both a severe
and a not severe work disability, subtracting the latter from it results in a category of workers
with a not severe work disability.
For those that wish to replicate the extraction from the CPS data files, Figure 58 identifies the
key variables used to select and categorize the responses.
Figure 58 CPS Extraction Variables
Variable
5
Description
A-Sex
Gender, where 1 identifies Males and 2 identifies females
A-HGA
Highest grade achieved: 31-38 indicate less than a high school
degree, 39 indicates a high school degree or equivalent, 40-42
indicates some college below baccalaureate, and 43-46 indicates
baccalaureate or higher
A-Age
Age
PEMLR
Monthly Labor Force Recode, where values of 1 or 2 indicate
employed workers
MarSupWt
March supplement Weight – approximate population size represented
by each observation
http://www.census.gov/hhes/www/disable/disabcps.html
Chapter 18 Worklife Probability Calculations
Variable
125
Description
Dis-HP
Health problem or a disability which prevents or limits working;
corresponds to the 1st disability criteria in Chapter 3 when equal to 1
Dis-CS
Retire or leave a job for health reasons; corresponds to the 2nd
disability criteria in Chapter 3 when equal to 1
Vet-Typ1
Veterans disability payments; corresponds to the 3rd disability
criteria in Chapter 3 when equal to 1
RsnNotW
Illness or disability reason for not working; corresponds to the 4th
disability criteria in Chapter 3 when equal to 1
PEMLR
Monthly Labor Force Recode, prevented from working due to
disability; corresponds to the 5th disability criteria in Chapter 3 when
equal to 6
MCare
Medicare coverage; corresponds to the 6th disability criteria in
Chapter 3 when equal to 1 and age below 65
SSIVal
Supplemental Security income; corresponds to the 7th disability
criteria in Chapter 3 when non-zero and age below 65
LPE Applied
Using the procedures described in the “Probability of Life” (L) and “Participation and
Employment Rates” (PE) sections, we can now compute the worklife expectancy statistic
using the LPE approach. Figure 59 presents a sample computation for a 60-year-old male
with at least a baccalaureate degree and no work disability. Each row represents one year of
potential employment. The columns of the exhibit are as follows:
•
Start Age – Age at the beginning of this computation row
•
End Age – Age at the end of this computation row
•
Base Age Survivors – Number of survivors from Figure 62 for a 60-year-old male
(constant for all rows)
•
At End Age Survivors – Number of survivors from Figure 62 for a male at the age
represented by the “End Age” column of the respective row
•
Prob. Of Life (L) – Probability that a 60-year-old male will live to the age indicated
in the “End Age” column, computed by dividing “At End Age Survivors” by “Base
Age Survivors”
•
Prob. Of Emp. (PE) – Extracted from Figure 63 for males with at least a
baccalaureate degree and no work disability
•
Prob. Of Work (LPE) – Probability a male with a baccalaureate degree and no work
disability will be employed in the respective year, computed by multiplying “Prob. of
Life (L)” by “Prob. Of Emp. (PE).”
126
Part IV
Reference
The “Prob. Of Work (LPE)” column is summed to 7.7 years to derive the worklife
expectanc y for a 60-year-old male with at least a baccalaureate degree and no work
disability.
Figure 59 Computation of Worklife Expectancy
60-Year-Old Male with a Baccalaureate Degree, No Work Disability
Start End
Age Age
60
61
61
62
62
63
63
64
64
65
65
66
66
67
67
68
68
69
69
70
70
71
71
72
72
73
73
74
74
75
75
76
76
77
77
78
78
79
79
80
80
81
81
82
82
83
83
84
84
85
85
86
86
87
87
88
88
89
89
90
Surivivors
Base At End
Age
Age
84,232 83,115
84,232 81,913
84,232 80,619
84,232 79,226
84,232 77,730
84,232 76,135
84,232 74,437
84,232 72,628
84,232 70,695
84,232 68,632
84,232 66,448
84,232 64,157
84,232 61,759
84,232 59,256
84,232 56,651
84,232 53,954
84,232 51,180
84,232 48,333
84,232 45,410
84,232 42,406
84,232 39,312
84,232 36,136
84,232 32,905
84,232 29,672
84,232 26,487
84,232 23,377
84,232 20,382
84,232 17,542
84,232 14,889
84,232 12,453
Prob. Of
Life (L)
0.987
0.972
0.957
0.941
0.923
0.904
0.884
0.862
0.839
0.815
0.789
0.762
0.733
0.703
0.673
0.641
0.608
0.574
0.539
0.503
0.467
0.429
0.391
0.352
0.314
0.278
0.242
0.208
0.177
0.148
Prob. Of
Prob. Of
Emp. (PE) Work. (LPE)
0.807
0.797
0.807
0.784
0.807
0.772
0.807
0.759
0.807
0.745
0.370
0.334
0.370
0.327
0.370
0.319
0.370
0.310
0.370
0.302
0.370
0.292
0.370
0.282
0.370
0.271
0.370
0.260
0.370
0.249
0.164
0.105
0.164
0.100
0.164
0.094
0.164
0.088
0.164
0.082
0.164
0.077
0.164
0.070
0.164
0.064
0.164
0.058
0.164
0.051
0.110
0.031
0.110
0.027
0.110
0.023
0.110
0.019
0.110
0.016
Total (Worklife Expectancy)
7.708
Changes from the Previous Version of VALE 2000
Users of the previous version of VALE 2000 may notice a variance in the worklife
expectancy statistics that is occasionally significant. Figure 60 presents a comparison of
some of the estimates from this version to the corresponding estimates from the older
version. These comparisons are made for the “All Levels of Education” category.
Chapter 18 Worklife Probability Calculations
Age Current
Not Disabled
25
35.6
50
14.1
Disabled, Not Sev.
25
27.5
50
9.4
Males
Older
% Chg. Current
127
Females
Older % Chg.
33.9
12.8
5%
10%
29.7
11.2
28.5
10.2
4%
10%
26.0
8.4
6%
12%
21.5
7.2
19.8
6.2
9%
16%
Figure 60 Comparison to Previous Version
Note that all example worklife expectancies show an increase. This is generally true of all
the worklife expectancy statistics in this version, with the exception of younger workers with
a severe work disability, who show an overall decrease. Using the worklife expectancies for
a 25-year-old female, both with no work disability and with a not severe work disability,
Figure 61 decomposes the change from the previous version into the following categories:
•
Update Life Tables – The previous version used life tables published in 1996, the
most current at that time. This edition employs more current data, published in 2002.
In all cases, the impact on worklife expectancy is insignificant.
•
Adjust 93 CPS Weights – The cross-tabulations published by the Census Bureau for
1993 were available in two versions. One version employed weights derived from the
1980 decennial census. These weights were utilized for all years since the mideighties. In 1993, the Census Bureau began use of the 1990 decennial census to
estimate weights, which provided the second version.
Our previous version employed the version based on the 1990 census, assuming the
most current data are best. However, the weights published by the Census Bureau
with the public use data files for the 1993 CPS contain the 1980 census weights.
Since this edition of our tables relies upon extracting data from the public use data
files, it inherits different weights for 1993. The impact is significant for some
isolated cells for which we compute employment rates, but overall has an
insignificant impact on worklife expectancy.
•
Census Error for Seniors – Our previous version relied entirely upon crosstabulations from the Census Bureau for probabilities of participation and
employment. Census Table 2, in its current form, provides all of these probabilities.
(See page 122 for more detail.) However, for the previous version, these probabilities
for persons 65-74 years of age could be obtained only from Census Table 4 for years
before 1996.
It now appears that the Census Bureau’s Table 4 was programmed incorrectly,
resulting in significant understatement of the probabilities for this age group. The
impact for our worklife expectancy statistics varies. The statistics for persons with a
not severe work disability are more profoundly impacted than for those with no work
disability. In addition, worklife expectancies for older workers are more materially
impacted than those for younger workers, increased by more than 20% in many
128
Part IV
Reference
instances. The Census Bureau has now corrected its Table 4, and has incorporated
the computation for this age group in Table 2 for all years on its web site.
•
Extend Probabilities Through 89 – The previous version stopped computation of
probabilities at the age of 74 (taking the person to his or her 75th birthday). This limit
arose primarily from the fact that the Census cross-tabulations stopped at this age.
Since the current edition relies upon extracts from the CPS public use data files, we
can extend these probabilities through the age of 89 (to the person’s 90th birthday).
As one would expect, the impact of this extension is more significant for older
workers.
•
Extend CPS Pooling to 10 Years – Probabilities of participation and employment
for the previous version were derived by pooling CPS statistics for six years (1992 –
1997). This edition extends this another four years, through 2001. All four added
surveys took place during a prolonged strong economy for the United States.
(Remember, the 2001 survey took place in March of 2001, before the economic
downturn.) As a result, the probabilities and resulting worklife expectancies show
material increases. This is most observable for those with a not severe work
disability. This is to be expected. In an economy approaching full employment,
employers are more likely to hire persons whom they otherwise might have excluded
– including those with work disabilities. The impact of the 2002 CPS (not yet
available at time of publication), taken during increased unemployment, should
provide fodder for interesting analyses.
Previous Version
Update Life Tables
Adjust 93 CPS Weights
Census Error for Seniors
Extend Probabilities Through 89
Extend CPS Pooling for 10 Years
Current Version
Not Disabled
Disabled, Not Sev
Years
% Chg.
Years
% Chg.
28.5
19.8
0.1
0.4%
0.0
0.0%
0.1
0.4%
-0.1
-0.5%
0.1
0.4%
0.5
2.5%
0.3
1.1%
0.2
1.0%
0.6
2.1%
1.1
5.6%
29.7
4.2%
21.5
8.6%
Figure 61 Components in Change from Previous Version
25-Year-Old Female
Life Table
Figure 62 presents the life survivors data used to compute the probability of life component
of LPE model for worklife expectancy. For a detailed description of the computation
process, see page 121.
Chapter 18 Worklife Probability Calculations
129
Figure 62 Life Survivors Data
Age
16
17
18
19
20
21
22
23
24
25
26
27
28
29
30
31
32
33
34
35
36
37
38
39
40
Male Female Age Male Female Age Male Female
98,788 99,050 41 94,998 97,281 66 76,135 85,179
98,704 99,011 42 94,733 97,129 67 74,437 83,991
98,605 98,968 43 94,449 96,965 68 72,628 82,711
98,496 98,922 44 94,141 96,789 69 70,695 81,331
98,379 98,876 45 93,808 96,599 70 68,632 79,843
98,254 98,830 46 93,445 96,393 71 66,448 78,251
98,121 98,784 47 93,050 96,171 72 64,157 76,555
97,982 98,736 48 92,624 95,929 73 61,759 74,747
97,842 98,688 49 92,168 95,668 74 59,256 72,813
97,704 98,639 50 91,683 95,384 75 56,651 70,741
97,569 98,588 51 91,168 95,077 76 53,954 68,535
97,435 98,535 52 90,620 94,744 77 51,180 66,199
97,303 98,480 53 90,033 94,381 78 48,333 63,726
97,168 98,422 54 89,399 93,986 79 45,410 61,104
97,030 98,361 55 88,710 93,554 80 42,406 58,317
96,887 98,297 56 87,957 93,079 81 39,312 55,365
96,739 98,229 57 87,134 92,556 82 36,136 52,249
96,585 98,156 58 86,239 91,982 83 32,905 48,965
96,423 98,075 59 85,271 91,356 84 29,672 45,518
96,253 97,987 60 84,232 90,677 85 26,487 41,923
96,074 97,891 61 83,115 89,939 86 23,377 38,253
95,886 97,787 62 81,913 89,134 87 20,382 34,551
95,686 97,674 63 80,619 88,259 88 17,542 30,865
95,473 97,553 64 79,226 87,310 89 14,889 27,248
95,244 97,422 65 77,730 86,283 90 12,453 23,749
From: Anderson, Robert N. and Peter B. DeTurk. National Vital Statistics Reports; vol 50
no 6. United States Life Tables, 1999. Hyattsville, Maryland: National Center for Health
Statistics, 2002. http://www.cdc.gov/nchs/data/nvsr/nvsr50/nvsr50_06.pdf
Rates of Participation and Employment
The joint probabilities of participation and employment (PE) used to compute the worklife
expectancies published in this document are summarized in Figure 63. As documented in the
Participation and Employment Rates section on page 122, these data are extracted from the
Annual Demographic Survey (March supplement) of the Current Populatio n Survey from the
years 1992 – 2001.
130
Part IV
Reference
Figure 63 PE Rate Summary
Disability Status
Age Groups
16 to 24 25 to 34 35 to 44 45 to 54 55 to 64 65 to 74 75 to 84 85 to 89
Males
Less Than High School
Not Disabled
Disabled, Not Sev.
Disabled, Severe
Disabled, All Levels
0.417
0.393
0.115
0.200
0.818
0.616
0.115
0.223
0.851
0.668
0.093
0.200
0.872
0.636
0.049
0.162
0.739
0.396
0.033
0.106
0.198
0.082
0.006
0.054
0.072
0.038
0.004
0.028
0.025
0.014
0.000
0.010
HS Degr. or Equiv.
Not Disabled
Disabled, Not Sev.
Disabled, Severe
Disabled, All Levels
0.767
0.615
0.215
0.379
0.899
0.743
0.171
0.387
0.917
0.753
0.117
0.330
0.925
0.747
0.064
0.301
0.754
0.475
0.044
0.194
0.238
0.131
0.003
0.101
0.099
0.052
0.001
0.042
0.035
0.022
0.000
0.017
Some College
Not Disabled
Disabled, Not Sev.
Disabled, Severe
Disabled, All Levels
0.636
0.735
0.244
0.532
0.909
0.780
0.203
0.517
0.937
0.802
0.115
0.472
0.937
0.805
0.071
0.435
0.774
0.518
0.058
0.276
0.284
0.155
0.009
0.127
0.124
0.063
0.003
0.053
0.048
0.035
0.000
0.029
College Degree
Not Disabled
Disabled, Not Sev.
Disabled, Severe
Disabled, All Levels
0.814
0.767
0.221
0.626
0.933
0.850
0.232
0.566
0.961
0.849
0.155
0.582
0.959
0.849
0.138
0.597
0.807
0.581
0.092
0.365
0.370
0.205
0.011
0.174
0.164
0.082
0.009
0.073
0.110
0.018
0.000
0.015
All Levels of Education
Not Disabled
Disabled, Not Sev.
Disabled, Severe
Disabled, All Levels
0.585
0.551
0.159
0.310
0.900
0.746
0.159
0.383
0.928
0.775
0.110
0.356
0.934
0.774
0.066
0.337
0.771
0.491
0.045
0.198
0.267
0.127
0.006
0.094
0.106
0.052
0.003
0.041
0.043
0.019
0.000
0.014
0.352
0.280
0.118
0.175
0.472
0.293
0.123
0.164
0.583
0.406
0.079
0.155
0.632
0.402
0.047
0.120
0.469
0.241
0.028
0.071
0.121
0.062
0.005
0.036
0.031
0.022
0.000
0.013
0.008
0.003
0.000
0.002
0.656
0.488
0.235
0.340
0.708
0.563
0.180
0.322
0.779
0.586
0.112
0.286
0.780
0.598
0.063
0.254
0.576
0.359
0.043
0.153
0.155
0.072
0.004
0.052
0.045
0.029
0.000
0.022
0.011
0.009
0.000
0.006
0.660
0.554
0.259
0.427
0.770
0.617
0.230
0.437
0.813
0.633
0.150
0.384
0.835
0.680
0.105
0.358
0.641
0.424
0.058
0.197
0.189
0.119
0.007
0.091
0.063
0.030
0.006
0.025
0.030
0.007
0.000
0.005
0.851
0.675
0.275
0.526
0.833
0.767
0.308
0.587
0.824
0.745
0.204
0.526
0.863
0.722
0.143
0.460
0.678
0.449
0.105
0.265
0.221
0.143
0.003
0.113
0.074
0.032
0.000
0.026
0.021
0.006
0.000
0.005
0.558
0.435
0.180
0.289
0.736
0.568
0.180
0.336
0.782
0.602
0.117
0.306
0.801
0.609
0.072
0.261
0.592
0.352
0.042
0.137
0.161
0.082
0.005
0.055
0.046
0.027
0.001
0.019
0.014
0.006
0.000
0.003
Females
Less Than High School
Not Disabled
Disabled, Not Sev.
Disabled, Severe
Disabled, All Levels
HS Degr. or Equiv.
Not Disabled
Disabled, Not Sev.
Disabled, Severe
Disabled, All Levels
Some College
Not Disabled
Disabled, Not Sev.
Disabled, Severe
Disabled, All Levels
College Degree
Not Disabled
Disabled, Not Sev.
Disabled, Severe
Disabled, All Levels
All Levels of Education
Not Disabled
Disabled, Not Sev.
Disabled, Severe
Disabled, All Levels
Chapter 19 Worklife Probability Economics
131
Chapter 19 Worklife Probability - Economic Calculations
To provide a common basis for the discussion that follows, review Figure 64 for an
extract of the Worklife Probability report. For more information on the Worklife
Probability report, see Chapter 14 and Chapter 18.
Summary:
Birth Date
Injury Date
Analysis Date
Cur. Wage Base
Fringe Rate
Education Level
Gender Life/PE
Continuum
Growth/Discount
Future Worklife
Lifetime Earnings
Date
EarningsEarnings
8/8/00 18.0
1.00
8/8/01 19.0
1.00
8/8/02 20.0
1.00
8/8/54 72.0
8/8/55 73.0
8/8/56 74.0
TOTAL
1.00
1.00
1.00
Prob. Prob.
Age Years
Pre-Injury
Post-Injury
$24,184
23.0%
12 years
F/F
Not Disabled
4.00%/5.04%
32.3
$753,419
$20,521
23.0%
12 years
F/F
Disabled, Not Severely
4.00%/5.04%
23.0
$458,850
Pre-Injury
Prob.
Base
Life
PE
-
General
8/8/82
3/15/98
3/17/99
=
Post-Injury
Adjusted
Prob. Prob. Prob.
Base
Wrklife EarningsEarnings Life
PE
29%
$294,569
Adjusted
Wrklife
0.999
0.998
0.998
0.644
0.644
0.644
0.643
0.643
0.643
23,616
23,382
23,150
18,678
18,493
18,309
0.999
0.998
0.998
0.473
0.473
0.473
0.473
0.472
0.472
20,039
19,840
19,644
11,658
11,518
11,405
0.747
0.728
0.707
0.126
0.126
0.126
0.094
0.092
0.089
13,799
13,662
13,527
1,595
1,546
1,481
0.747
0.728
0.707
0.030
0.030
0.030
0.022
0.022
0.021
11,709
11,593
11,478
317
314
296
57.0
753,419
458,850
Estimated Total Loss:
294,569
Figure 64 Worklife Probability Report Extract
Present Value
The more complex computations in VALE 2000 surround the economic concepts of
present value and future value. Although we show the most important steps in the
derivation of the involved formulae, you may want to reference a textbook on finance for
a more in-depth discussion.
The present value computation depends upon variables established on the Scenario
Economics tab (see page 33):
132
Part IV
Reference
Growth Rate - Entered as a decimal, this is the rate at which wages will grow on an
annual basis.
Discount Rate - Also entered as a decimal, this reflects the annual investment rate
assumed for the loss award. It is used to state future values in a current (present) value.
Future Losses
As we begin our discussion of future losses, it is important to distinguish this term from
the concept of future value, which we discuss in a separate section of this chapter. Future
losses are losses that occur in future periods. They may be stated either in today's dollars
(present value ) or in the dollars of the period in which they occur (future value). Thus,
this section deals with computation of the present value of future losses.
Net Discount Rate
When computing the present value of future cash flows, we must first state them in terms
of future value using the growth rate (g). We can compute the future value of an amount
in one year by increasing it by g or multiplying it by 1+g.
We reduce a future value to present value using the discount rate (d), or recognizing that
we invest the result at a rate of d. That means that the invested present value is worth
1+d multiplied by the present value a year from now. Thus the present value of this oneyear cash flow is the inverse or the cash flow divided by 1+d.
This leaves us with the following formula for the present value of $1 one year from now:
PV =
1+ g
1+d
Equation 1 Present Value of $1 After One Year
This is, in effect, the multiplier used to state any value one year in the future in present
value terms. Obviously, if the growth and discount rates are equal, the multiplier is 1,
and the present value of any cash flow is equal to the beginning value. If we assume a
growth rate of 4% and a discount rate of 5.04% (as is used in Figure 64), this would result
in a present value of 0.9901. Instead of applying both the growth and discount rate for
each year of the computation, VALE 2000 uses a simplified approach by using a net
discount rate (dn ). Since a discount rate is in the denominator of the equation, we need to
take the inverse of Equation 1, and subtract the 1 added to both the numerator and
denominator, or:
dn =
1+d
−1
1+ g
Equation 2 Net Discount Rate
Chapter 19 Worklife Probability Economics
For our example with a 4% growth rate and 5.04% discount rate, this equation results in a
net discount rate of 1.00%. Note that many people make the mistake of assuming the net
discount rate is 1.04%, or the discount rate minus the growth rate. Although this is close,
it is not technically correct.
Base Earnings
After calculating Probable Worklife, (see Chapter 14 and Chapter 18), Worklife
Probability calculates the present value of the Base Earning figure for each individual
period.
The program calculates present value as of the end of the period in relation to the report
date. In our example, the end of the first period of time is August 8, 2001, and the report
date is March 17, 1999. Therefore, the base earnings for this period are calculated for
approximately 2.4 years. Equation 3 shows the formula that calculates Base Earnings
(be), with y representing the number of years in the future for which the base earnings are
being calculated, and wb representing the Current Wage Base (see Chapter 14).
be =
wb
(1 + dn ) y
Equation 3 Present Value of an Amount y Years in the Future
For the first pre-injury period in our example, wb is $24,184, dn is 1.00% and y is
approximately 2.39 (from March 17, 1999 to August 8, 2001). Applying these figures to
Equation 3 results in a Base Earning figure (be) for the period of $23,616.
For those reports using a total offset, where the growth rate and discount rate are equal,
the Base Earning figure will be equal to the Current Wage Base shown in the Summary
section (in this example, $24,184).
Adjusted Earnings
Once the Base Earnings are calculated, Worklife Probability calculates the Adjusted
Earnings, the figure that represents the client’s probable earnings for the period given the
variables chosen. The figure considers the Base Earnings calculated in the previous
section in combination with fringe benefits and Probable Worklife for the period (see
Chapter 14 and Chapter 18).
Equation 4 shows the formula that calculates Adjusted Earnings (ae), with fb representing
the fringe benefits rate (stated as a decimal) and wl representing the Probable Worklife
for the period.
133
134
Part IV
Reference
ae = be * (1 + fb) * wl
Equation 4 Adjusted Earnings
In our example, the program takes the base earnings of $23,616, adds fringe benefits of
23% (by multiplying by 1.23), then multiplies by the Probable Worklife figure of .643.
This results in the Adjusted Earnings figure of $18,678.
Past Losses
As the name implies, past losses are those losses that occurred before the date of the
report. The program will discount past losses only if you checked the “Discount Past
Losses” box on the Defaults form (see page 49) or the “Discount Pre-Injury Earnings”
box on the Past Loss tab (see page 37). Since these losses extend backwards, the
computation of their present value is the inverse of the present value of future losses. To
document this computation, we use many of the techniques and annotations used for the
previous sections. Therefore, an understanding of those sections is necessary before
reading this one.
VALE 2000 measures present value computations of past loss from the date of injury to
the report date.
To recognize that the period is going backward in time, we must reverse the impact of the
net discount rate as shown in Equation 3 for the calculation of future loss. Equation 5
shows this calculation.
be = wb * (1 + d n ) y
Equation 5 Present Value of an Amount y Years in the Past
Future Value
Most experts prefer to present damages in terms of present value. Indeed, this is the
requirement for most courts. However, some states (i.e. New York and Michigan)
require the use of future value terms. That is, damages need to be presented in terms of
the dollar value of the year in which they will be incurred. VALE 2000 performs
computations to accommodate specifically those requirements.
As used in VALE 2000, future losses are any losses that occur after the report date. We
can state future losses in terms of present value (the value at the report date) or future
value (the value at the time the loss occurs).
To calculate future value, the user enters a nominal growth rate and a discount rate of
zero (see page 33). The formulae described in the Present Value section of this chapter
(beginning on page 131) are then used. Use of the formulae will result in a net discount
rate (see Equation 2) that is negative; otherwise, the calculations are the same.
Chapter 19 Worklife Probability Economics
Past Losses
You might expect that computation of the future value of past losses is the inverse of
future value for future losses. More simply, we should state past losses in terms of the
dollar value in those past periods. However, keep in mind that the design of VALE 2000
is to meet the future value requirement of a couple of isolated states. These states express
past losses in present value terms. Thus, when VALE 2000 computes future value, it
merely echoes the value used for present value computations for past losses.
135
136
Part IV
Reference
Chapter 19 Worklife Probability Economics
Chapter 20 Education Dollar Source
The source of the disabled and nondisabled education dollars is the same as the source for
the participation and employment rates for worklife expectancy, the March Supplement
to the Current Population Survey. The specific sources for producing the education
dollars are:
U.S. Census Bureau, Current Population Reports, "Disability: Selected Characteristics of
Persons 16 to 74, Table 3. Work Experience and Mean Earnings in 1995/1996/1997/
1998/1999/2000--Work Disability Status of Civilians 16 to 74 Years Old by Sex:
1996/1997/1998/1999/2000/2001."
http://www.census.gov/hhes/www/disable/disabcps.html
U.S. Bureau of Labor Statistics. Consumer Price Index, All Urban Consumers, U.S. City
Average. http://stats.bls.gov/data/home.htm (Source used for updating education dollars
to report year dollars.)
While the first source provides data based on disability status and various educational
levels, data are not reported for various college degree levels. Therefore, the following
source is used to break out college levels:
U.S. Census Bureau, "Historical Income Tables - People, Table P-26. Educational
Attainment--Full- Time, Year-Round Workers 25 Years Old and Over by Mean Earnings
and Sex: 1991 to 2000." http://www.census.gov/hhes/income/histinc/p26.html
The remainder of this chapter provides the detail from these sources and describes how
they are used.
Current Population Reports Data
The education dollars used by VALE 2000 are based on a weighted average of six years
of data from the Current Population Reports. To obtain the education dollars used in
VALE 2000, the earnings from each year are brought up to 2002 dollars using the CPI
Index. The 2002 dollars are then weighted by the number from the survey to derive an
overall average. The raw data used in this calculation are as follows:
137
138
Part IV
Reference
CPS RAW DATA
MEAN EARNINGS, YEAR-ROUND, FULL-TIME, AGE 25-64
ALL EDUCATIONAL LEVELS
With No Work
Disability
Current
Year
Year
#
Earnings
All Persons
1995 76660 $36,430
1996 78770 $38,239
1997 81010 $39,589
1998 83560 $40,903
1999 85167 $42,738
2000 86972 $45,262
Male
1995 45379 $42,512
1996 46694 $44,307
1997 47891 $45,892
1998 49367 $47,091
1999 49788 $50,054
2000 50804 $53,234
Female
1995 31281 $27,606
1996 32076 $29,406
1997 33119 $30,474
1998 34193 $31,970
1999 35378 $32,442
2000 36168 $34,064
With a Work
Disability
LESS THAN 12 YEARS
12 YEARS
13 TO 15 YEARS
With No Work
Disability
With a Work
Disability
With No Work
Disability
With a Work
Disability
#
Current
Year
Earnings
#
Current
Year
Earnings
#
Current
Year
Earnings
#
Current
Year
Earnings
#
Current
Year
Earnings
2377
2291
2219
2252
2431
2261
$30,848
$30,754
$30,098
$31,854
$34,156
$33,968
7213
7365
7473
7697
7489
7596
$21,269
$22,502
$24,273
$22,978
$23,362
$25,644
273
285
262
214
243
291
$17,496
$16,622
$19,294
$19,174
$19,761
$21,325
24973
25794
26368
26664
26772
27138
$28,153
$29,303
$29,865
$30,230
$31,607
$33,196
793
764
718
731
887
740
1500
1415
1372
1441
1466
1367
$35,579
$35,957
$33,703
$35,583
$38,258
$37,656
4878
5073
5112
5181
4937
4945
$23,573
$24,759
$27,246
$25,659
$25,689
$29,180
161
186
162
119
130
169
$19,937
$19,008
$22,097
$23,985
$22,939
$25,447
14422
14938
15401
15623
15591
15858
$32,609
$34,196
$34,430
$34,201
$36,757
$38,432
877
876
847
811
965
894
$22,759
$22,356
$24,258
$25,235
$27,926
$28,329
2335
2292
2361
2516
2552
2652
$16,456
$17,508
$17,837
$17,454
$18,861
$19,051
112
99
100
95
113
122
$13,980
$12,121
$14,733
$13,173
$16,101
$15,618
10550
10856
10967
11041
11181
11280
$22,063
$22,570
$23,454
$24,611
$24,425
$25,835
With No Work
Disability
16 YEARS OR MORE
With a Work
Disability
With No Work
Disability
With a Work
Disability
#
Current
Year
Earnings
#
Current
Year
Earnings
#
Current
Year
Earnings
#
Current
Year
Earnings
$24,567
$26,014
$23,107
$25,240
$27,823
$28,232
21160
21827
22140
23042
23884
24572
$33,608
$35,379
$35,972
$37,361
$38,932
$40,536
769
756
716
731
775
716
$28,498
$32,133
$29,180
$31,134
$35,362
$34,564
23314
23784
25028
26156
27021
27666
$52,546
$55,430
$57,606
$60,179
$62,502
$66,681
541
487
523
575
526
513
$50,137
$44,334
$45,514
$45,891
$49,703
$48,575
474
466
437
428
532
462
$29,184
$31,055
$25,546
$26,188
$32,612
$30,604
11937
12218
12375
12817
13104
13527
$39,123
$41,148
$41,513
$42,883
$45,652
$48,040
477
464
456
511
486
434
$30,835
$37,828
$31,680
$34,896
$39,609
$38,898
14142
14465
15003
15745
16156
16475
$62,004
$64,274
$67,623
$70,359
$73,903
$78,967
387
299
317
382
318
302
$55,777
$51,279
$53,832
$50,619
$51,898
$53,457
319
298
281
303
355
279
$17,706
$18,122
$19,317
$23,903
$20,656
$24,306
9223
9609
9765
10225
10780
11044
$26,471
$28,043
$28,949
$30,439
$30,762
$31,346
292
292
260
220
289
282
$24,684
$23,086
$26,529
$22,385
$28,213
$27,897
9171
9319
10025
10411
10865
11192
$37,961
$41,701
$42,615
$44,785
$45,549
$48,596
154
188
206
193
208
211
$35,963
$33,303
$32,746
$36,529
$46,351
$41,578
Chapter 21 CPI Index Source & Calculations
Historical Income Tables
While the data from the Current Population Reports provide information on earnings by
disability status and by educational level, they do not report data that breaks out varying
college degree levels. To do this, information from the Historical Income Tables is used.
Like the previous calculation, these data are weighted by the earnings and number
contained in the table. Once the overall average for each group has been calculated, a
differential from the "Bachelor's or More" group to each individual group is determined.
These differentials are applied to the average from the Current Population Reports to
derive education dollars for each college degree level that are disability specific.
Historical Income Tables Raw Data
2000
1999
1998
1997
1996
1995
2000
1999
1998
1997
1996
1995
2000
1999
1998
1997
1996
1995
Male
Female
Male
Female
Number
00 $
Number
00 $ Number
00 $ Number 00 $
Bachelor’s or More
Professional Degree
17385
78758
11580 48411
1274 120588
509 72430
17138
76191
11240 46985
1267 135102
470 74613
16733
73590
10713 47102
1264 123992
468 82108
15864
71846
10425 45260
1321 128749
488 79261
15339
69796
9634 46013
1277 123388
413 99161
15054
69298
9404 42582
1208 125369
421 67420
Bachelor’s Degree
Doctorate Degree
11393
70332
7895 43831
1038 96451
353 61474
11138
65624
7606 42487
1008 111973
346 71406
11058
64724
7276 42835
998 97348
329 69103
10349
60595
7172 40678
966 99751
318 64699
9898
58049
6686 40779
893 94488
322 67960
9597
59453
6432 38596
853 87373
283 62261
Master’s Degree
3680
85373
2823 55252
3725
78064
2818 51518
3414
76702
2639 49911
3228
76282
2447 49381
3272
77692
2213 48719
3395
72624
2268 46822
139
140
Part IV
Reference
Chapter 21 CPI Index Source & Calculations
Chapter 21 CPI Index Source and Calculations
The CPI Index is provided to assist in bringing Education and VALE dollars up to report
year dollars when desired. The source of the CPI data is
US Department of Labor, Bureau of Labor Statistics. Consumer Price Index, All Urban
Consumers (CPI-U), US City Average, All Items.
Year CPI-U
1970
38.8
1971
40.5
1972
41.8
1973
44.4
1974
49.3
1975
53.8
1976
56.9
1977
60.6
1978
65.2
1979
72.6
1980
82.4
Year
1981
1982
1983
1984
1985
1986
1987
1988
1989
1990
1991
CPI-U
90.9
96.5
99.6
103.9
107.6
109.6
113.6
118.3
124.0
130.7
136.2
Year CPI-U
1992
140.3
1993
144.5
1994
148.2
1995
152.4
1996
156.9
1997
160.5
1998
163.0
1999
166.6
2000
172.2
2001
177.1
2002
179.9
6
Quite often, the VALE or education dollar source for a particular wage predates an
analysis by one or more years. When this happens, you may increase the wage to reflect
the inflation that has occurred since it was established. VALE 2000 provides a
mechanism to perform this computation automatically. This provides the benefit of being
able to use a wage from one year without needing to adjust the wage manually.
The CPI Adjustment check box on the Case Data screen (see page 23) controls whether
or not a wage is inflated. If this box is checked, VALE 2000 computes inflation
adjustments.
Page 40 documents use of the CPI Index screen to load the Consumer Price Indices for
any year. These indices are the basis for all inflation adjustments made by the system.
Each inflation computation uses exactly two indices:
Base Year - The index for the year in which the wage was established, or CPIb.
6
The 2002 CPI Index is estimated based on the monthly index for June 2002.
141
142
Part IV
Reference
Report Year - The index for the year in which the report is generated (as determined by
the Report Date field in the Case Data screen), or CPIr.
The inflation multiplier is computed by dividing the report year index by the base year
index, or:
M=
CPIr
CPIb
Equation 6 Inflation Multiplier
For example, assume that VALE calculated a mean dollar of $23,502 in 1996 dollars and
that the 1996 CPI was 156.9. Also assume that the report is being written in 1998, with a
CPI of 163.0. The resulting multiplier is 163.0 ÷ 156.9 or 1.039. (This can be interpreted
as showing 3.9% inflation from 1996 to 1998.) The inflated wage would be $23,502 x
1.039, or $24,419. The VALE portion of the program will print $24,419 as the 1998
earning capacity, and Worklife Probability will use this dollar in its calculations of
lifetime expected earnings.
This process also works to deflate a wage. This happens when the base year index is
greater than the report year index. If the report and base years were reversed in the
previous example, the multiplier would be 156.9 ÷ 163.0, or 0.963. The $23,502 base rate
would adjust to $22,632. Obviously, if the base year and report year are the same, the
multiplier is 1.000 (no inflation).
Chapter 22 Troubleshooting
Part V
Help
Chapter 22 Troubleshooting
If you are having a problem with VALE 2000, this chapter could provide a solution. This
chapter explores solutions to actual problems or errors with the system. Although we
expect such problems to be rare, this discussion should smooth the problem-solving
phase.
First, we explore some potential problems, their symptoms, probable causes, and possible
solutions. Later, in the Solutions section, we provide more detail on the solutions
introduced in the Problems section. You should use the Problems section to point you to
the potential solutions, then read the Solutions section for the appropriate detail. Note
that the possible solutions listed usually do not include calling Technical Support. This
does not mean that you do not have that option. The reason we do not list Technical
Support for a particular problem is that the suggested solutions from Technical Support
would likely be the same as detailed below.
Problems
The problems listed below are in order of decreasing probability of occurrence. Each
problem may list multiple possible solutions. We list these solutions in the recommended
order of application.
Slow Response
Symptoms Response time moving between forms and opening reports is
slow
Probable Cause Insufficient resources or fragmented data files
Possible Solutions Close Other Applications - reduce the drain on your computer's
resources from other requirements
Compact and Repair - improve the efficiency of VALE 2000's
data storage
143
144
Part V
Help
Defragment Hard Drive - improve the efficiency of your
computer's data storage
Reboot Computer - free memory not released by closed
applications
Confirm Resources - verify that you have sufficient
“horsepower” to run VALE 2000
Corrupt Files
Symptoms Receive error message stating that data are corrupt or unable to
read data
Probable Cause PC was turned off or “crashed” while VALE 2000 was running
Possible Solutions Compact and Repair - repair corrupt data
Restore from Backup - revert to an uncorrupt backup version
Reboot Computer - free memory not released by closed
applications
Reinstall Software - start from scratch
Missing Records
Symptoms Data entered previously do not show up
Probable Cause Corrupt files or data filters turned on
Possible Solutions Clear Filters - clear data selection filters
Compact and Repair - repair corrupt data
Restore from Backup - revert to an uncorrupt backup version
Unable to Find Data
Symptoms Receive error message stating that VALE 2000 could not find the
"BASETABL.MDB" and/or the "DYNATABL.MDB" files
Probable Cause You have moved the data files for the system to another location
or the data have become corrupt
Possible Solutions Refresh Path - set pointers to the proper data file
Compact and Repair - repair corrupt data
Restore from Backup - revert to an uncorrupt backup version
Reinstall Software - start from scratch
Chapter 22 Troubleshooting
Unable to Start System
Symptoms System will not start or open
Probable Cause Insufficient resources or damaged files
Possible Solutions Close Other Applications - reduce the drain on your computer's
resources from other requirements
Compact and Repair - repair corrupt files
Reboot Computer - free memory not released by closed
applications.
Confirm Resources - verify that you have sufficient
“horsepower” to run VALE 2000
Critical System Error
Symptoms Receive an error message from VALE 2000 saying to contact
Technical Support
Probable Cause Unknown
Possible Solutions Contact Technical Support
Windows Complains of Insufficient Memory
Symptoms Receive an error message complaining of insufficient memory
Probable Cause Insufficient resources to operate all open programs
Possible Solutions Check Free Disk Space - verify that you have sufficient free disk
space to run the programs
Solutions
The solutions listed below are in alphabetic order for ease of reference. You should first
identify the problem in the preceding section, and then trace the suggested solutions to
this section.
Check Free Disk Space
Ensure that you always have 2.5 to 3 times as much free disk space as you ha ve RAM
(random access memory) installed in your computer. For example: a 16 megabyte
computer would require at least 40 megabytes of disk space for its critically important
145
146
Part V
Help
swap file, possibly as much as 48 megabytes. This would be in addition to any temporary
files that the various applications you have open at the time may create.
A short-term solution may be to free up some disk space by deleting temporary files
(usually stored in C:\ Windows\Temp) that are at least 6 months old, then “e mptying” the
Recycle Bin.
Clear Filters
If you cannot find a case you previously entered in the Case Select screen, you may have
filters turned on that actually exclude it from the current case list. Make sure that the
filters you enter are not so restrictive as to exclude your target case. For more
information, see page 19.
Close Other Applications
One of the advantages of modern 32-bit software is the ability to run multiple
applications simultaneously. However, many users forget that their computers have
resource limits that may constrain this ability. If your system is running slowly, you
should close all applications and windows that are not necessary to your current tasks.
(This includes any extra forms or report views you may have open within VALE 2000.)
If other applications must be open, minimize them to reduce their resource requirements.
Also remember that although it may look great, high-resolution wallpaper is a significant
drain on yo ur computer's resources.
Compact and Repair
As discussed on page 51, you should periodically compact and repair your VALE 2000
data to assure operating efficiency. The “Compact and Repair” option available from the
start menu performs two important tasks:
1. Through frequent use of VALE 2000, your data records can become stored in
noncontiguous space on your computer's hard drive. This makes the system become
increasingly inefficient and slow. “Compacting” the data corrects this inefficiency.
2. If your computer “crashes” or shuts down abnormally while VALE 2000 is open,
some pointers used in the system's data structure may become corrupt. “Repairing”
the data corrects these errors.
Confirm Resources
If you have problems with memory or processing speed, confirm that your computer
meets the minimum requirements stated in Chapter 2. If you just meet the basic
requirements, minimize other drains on your system resources as described in Close
Other Applications above.
Chapter 22 Troubleshooting
Contact Technical Support
Although not always listed, this is an optional solution for all of the problems listed
above. See Chapter 23 for more information on support options.
Defragment Hard Drive
As you use your computer, data from your most frequently updated applications become
“fragmented.” That means that the operating system may store a single data file in
several noncontiguous areas of your hard drive. This makes subsequent accesses less
efficient and more time consuming. Several software utilities (one of which, “Disk
Defragmenter,” comes with Windows™ 9x) exist to remedy this inefficiency. You
should run such a utility on a regular basis: monthly or possibly weekly for heavy users.
Reboot Computer
All applications in a Windows™ 9x environment should free all memory used as they
close. However, due to software bugs or other complications, this does not always
happen. If you experience unexpected memory or resource shortages, chances are that
part of your computer's memory is still being used by an application no longer open. The
only way to remedy this is to reboot your computer. (Choose “Shut Down” from the start
menu, and then select the “Restart the Computer” option.)
Reinstall Software
A drastic last step, but we have to talk about it. Such a step should probably come only
from a general failure of your computer.
Ø To reinstall VALE 2000:
1. Uninstall the old version as described on page 13. If the program tells you that it
cannot find something in Staging, click “OK.” The uninstall process should leave
your data files intact. Then reinstall the software as described in Chapter 2.
2. If step 1 is unsuccessful, contact Technical Support.
Refresh Path
If you moved your data file ("BASETABL.MDB" and/or "DYNATABL.MDB") to keep
it separate from the program files, you need to tell the system where to find the data. See
page 53 for more information.
Restore from Backup
Proper safeguard standards dictate regular backup of your computer's data. In some
cases, you may need to restore saved VALE 2000 files to solve a system problem. If
147
148
Part V
Help
simply trying to recover a lost record or case, the only file you need to restore is
"BASETABL.MDB" and/or the "DYNATABL.MDB." However, if you are trying to
recover from a general system failure, you should restore the entire directory containing
VALE 2000.
Chapter 23 Support Services
149
Chapter 23 Support Services
Vocational Econometrics, Inc. provides technical support to assist customers in the
implementation of VALE 2000. Included with the purchase of each license is free
technical support for 30 days from the date of purchase. Before you call, please make
sure you have tried to resolve the problem through the following steps:
•
Compact and repair your database. If you have made several updates and
computations since the last time you performed this step, your application may
become unstable. For more information see Chapter 10.
•
Review the “Troubleshooting” (Chapter 22) chapter to see if it addresses your
questions.
Free Support
Each license comes with free technical support for 30 days from the date of purchase.
This encompasses any problems associated with the installation or operation of the VALE
2000 software. Before calling, please have the information described below in “Before
You Call” available.
Not included as Free Support are questions that are of a consulting nature. That is,
assistance on topics such as analyzing a case or testimony preparation falls under Fee
Support.
Fee Support
Technical support past the first 30 days and case consulting are billed by the hour.
Billings are to credit cards in 30- minute increments, with a minimum of 30 minutes.
Hourly rates are subject to change without notice. Table 1 presents the rates in effect at
the time of the publication of this manual.
Type
Technical
Consulting
Description
Installation and operation of software
Analysis and application of data for use
in a case
Table 1 Support Fees
Rate
$100 / Hour
$150 / Hour
150
Part V
Help
Before You Call
To ensure efficient service, please have the information in Table 2 available. The
telephone number for technical support is (502) 589-0995, available between 8:30 and
5:00 Eastern Standard Time.
Type of
Support
All
Information
Comments
Serial number, Licensee name
and company
Technical
Computer processor type (e.g.
Pentium), Windows version,
total RAM, and total hard
drive disk size and space
available.
Path used to install the
software.
Available by clicking the Help
menu and choosing “About VALE
2000.”
Available by clicking the Help
menu and choosing “About VALE
2000.” Then, click the “System
Information” button.
Technical
Fee
Credit card type, number,
expiration date, and name
shown on card.
This is needed only if you did not
use the setup routine's default path
when you installed the system.
Visa or MasterCard only
Table 2 Before You Call Information
Premium Support
An optional Premium Support package is available for an annual fee (currently $95, but
subject to change without notice). This package includes several benefits:
•
Guaranteed response to telephone queries within one business day. (Standard support
guarantees two business days.)
•
Fee support discounts of 10%
•
Automatic notification (via e-mail) of any service upgrades (technical “fixes” to the
current VALE 2000 version)
•
Version upgrade discounts of 10%
•
Automatic distribution (via e- mail) of new national functional wages
•
Automatic distribution (via e- mail) of new annual Consumer Price Index data
•
Automatic distribution (via e- mail) of any documentation updates
Index
151
Index
A
Supplemental Security Income , 125
Veterans’ Disability, 125
Weights, 122, 123, 124, 127
Age , 121, 122, 123, 124, 125, 127, 128
Anderson, Robert , 129
D
Attorney, 3, 18, 19, 21, 22, 39, 40, 44, 54, 62
B
Base Year, 141, 142
Birth Date, 23
C
Case Entry Form, 25, 37
Case Reference, 5, 17, 18, 19, 21, 58
Case Select Form, 17, 19, 21, 56, 57, 60, 146
Add Case Button, 18, 21
Copy Case Button, 18, 19
Delete Case Button, 18, 20
Edit Case Button, 18, 20
Filtering, 18, 19
Maintenance Tab, 17
Print Button, 17, 18, 20, 52, 57, 60
Sorting, 18, 19
Census Codes, 63, 65, 66, 75, 76, 77, 78, 79, 80, 81,
82, 83, 87, 91, 102, 103, 117, 118, 119
Census Group, 64, 76, 77, 78, 79, 87, 102, 103, 117
Census, Decennial, 127
Client, 19, 21, 22, 23, 28, 44, 62
Comments, 24, 26, 44, 62
Compact and Repair, 51, 143, 144, 145, 146, 149
Consultant, 18, 19, 39, 40, 44, 62, 85
Consumer Price Index, 23, 40, 41, 42, 47, 48, 64, 79,
141, 142, 150
Control Center, 17
Maintenance Tab, 39
Control Panel, 7, 13
Control Tips, 5
Current Population Survey, 75, 76, 77, 78, 79, 83
Data Extraction, 124–25
Health Problem Limitation, 125
Left Job for Health Reasons, 125
March Supplement, 15, 75, 76, 122, 124, 129
Medicare , 125
Monthly Labor Force Recode, 124, 125
Multi-year Averaging, 122, 123, 128
Out of Labor Force from Disability, 125
Public Use Data Files , 122, 127, 128
Senior Ages , 127
Death Case, v, 4, 23, 35, 49
DeTurk, Peter B., 129
Diagnostics, 42
Dictionary of Occupational Titles, 67, 75, 83, 84, 85,
87, 103, 117
Disability, v, 15, 27, 28, 30, 45, 71, 76, 77, 78, 79
Disability Ratio, 123
Dis ability Status, 123
E
Earnings, 15, 23, 28, 29, 30, 31, 37, 38, 45, 47, 48, 49,
59, 61, 64, 65, 69, 70, 75, 76, 78, 79, 80, 81, 82,
118, 119, 133, 134, 142
Adjusted, 69, 70, 72, 73, 74, 133, 134
Base, 72, 73, 74, 133, 134
Mean, 48, 76, 78, 79, 80, 81, 82, 83, 118, 119, 120
Median, 48, 76, 78, 79, 80, 81, 82, 83, 118, 119
Earnings Source, 28, 29, 30
Education, 27, 28, 29, 30, 44, 48, 71, 85, 110, 121,
122, 123, 124, 126, 137, 141
Employer Costs for Employee Compensation, 47
End Age, 28
Equation, 132, 133
Error Log, 42
F
Fringe Benefits, 33, 38, 47, 61, 72, 73, 74, 133, 134
Future Value, 131, 132, 134, 135
G
Gender, 22, 27, 30, 31, 45, 62, 71, 76, 78, 79, 80, 81,
82, 123, 124
Men , 121, 122, 123, 124, 125, 126
Women, 124, 127
H
Help, 5, 55, 143, 150
152
Part V
Help
I
Inflate Wages, 47, 141, 142
Injury Date, 23
Insert Record, 32
Installation, 7, 149, 150
L
Labor Force, 15, 31, 45, 75
Labor Market, 30, 31, 45, 48, 62, 64, 65, 76, 78, 117,
118
Labor Market Access, 23, 47, 59, 117
Life
Probability, 121, 125, 128
Survivors , 121, 125, 128
Tables , 127, 129
Life Expectancy, 22, 23, 45
Logical Operator, 32
Loss
Future, 132, 134
Past, 23, 28, 33, 37, 38, 49, 72, 73, 134, 135
M
Maintenance Form, 20, 39, 40, 41, 42, 43
Memory, 7, 59, 144, 145, 146, 147, 150
Menus, 2, 51, 52, 53, 54, 55, 60
Microsoft
Access, 2, 7, 9, 11
Excel, 2, 59, 60
Windows, 2, 1, 3, 7, 8, 13, 51, 52, 53, 55, 145, 147,
150
Word, 2, 8, 59, 60
Destination, 58
Report Options, 59, 63, 65, 69, 70, 71, 72, 73
Report Selection, 57, 58
Proxy, 30, 47, 48, 49
R
Rate
Discount, 33, 34, 48, 59, 132, 133, 134
Growth, 34, 48, 132, 133, 134
Net Discount, 69, 132, 133, 134
README.DOC File, 8, 52
Removal, 13
Report Date, 18, 23, 33, 37, 38, 40, 47, 48, 49, 61, 69,
72, 133, 134, 142
Report Year, 64, 141, 142
Reports
Case Summary, 24, 61, 62
VALE, 63, 64, 65, 66
Worklife Probability, 69, 70, 71, 72, 73
Restrictions, 15, 31, 32, 33, 63, 64, 65, 66
S
Scenarios, 21, 25, 26, 27, 28, 30, 31, 32, 34, 35, 44,
58, 60, 63, 65, 131
Status Bar, 5
Support Services, 149
System Requirements, 7, 59, 60
T
Toolbars, 51, 52, 55
U
N
National Center for Health Statistics , 121, 129
National Crosswalk Service Center, 75, 117
National Occupational Information Coordinating
Committee, 75, 117
Navigation, 1, 32
O
Outliers, 79, 80, 81, 82
P
Participation and Employment Rates , 121, 122–
23, 125, 127, 128, 129
Path
Data, 53
Program, 13
Prepared By, 22
Present Value, 72, 131, 132, 133, 134, 135
Printing, 17, 18, 20, 52, 55, 57, 58, 59, 60, 63, 69
U.S. Census Bureau, 122, 124, 127, 128
Unemployment, 122, 128
US Department of Commerce
Bureau of the Census, 15, 76
US Department of Labor, 33, 84, 117
Bureau of Labor Statistics, 40, 47, 76, 78, 79, 80,
83, 141
Employment and Training Administration, 75, 115,
117
User Defaults, 25, 37, 39, 40, 43, 44, 46, 47, 48, 49,
134
V
Vocational Econometrics, 2, 42, 149
W
Weighted Average, 119
Worker Characteristics, 31, 32, 87, 115
Aptitudes, 87, 89
Index
Census/DOT Data, 87, 91
Data, People, Things, 87, 103, 104
Environmental Conditions, 87, 104, 105
Logical Operators, 115
Physical Demands, 83, 88, 104, 106, 108, 109
Reasoning, Math, Language, 88, 110
Specific Vocational Preparation, 32, 83, 88, 114
Worklife Expectancy, 15, 27, 28, 45, 46, 61, 69, 70,
72
Continuum, 27, 28
Employment Rate, 27, 28, 45, 46, 71
Life, 23, 28, 45, 46, 71
LPE, 28
Participation Rate, 27, 28, 45, 46, 71
Worklife Expectancy Models
Life, Participation, Employment (LPE), 121,
125, 126, 128
Worklife Probability, 45, 46, 49, 50, 59, 69, 70, 121,
131, 133, 142
153