1
CodeWarrior™
Development Tools for
StarCore DSP
Targeting Manual
Revised: 2002/11/21
Metrowerks, the Metrowerks insignia, and CodeWarrior are registered
trademarks of Metrowerks Corp. in the US and/or other countries. All other trade
names, trademarks and registered trademarks are the property of their respective
owners.
Intel and Pentium are registered trademarks of Intel Corporation.
Windows is a registered trademark of Microsoft Corporation.
Solaris is a registered trademark of Sun Microsystems, Inc.
© Copyright. 2002. Metrowerks Corp. ALL RIGHTS RESERVED.
Metrowerks reserves the right to make changes without further notice to any
products herein to improve reliability, function or design. Metrowerks does not
assume any liability arising out of the application or use of any product described
herein. Metrowerks software is not authorized for and has not been designed,
tested, manufactured, or intended for use in developing applications where the
failure, malfunction, or any inaccuracy of the application carries a risk of death,
serious bodily injury, or damage to tangible property, including, but not limited
to, use in factory control systems, medical devices or facilities, nuclear facilities,
aircraft or automobile navigation or communication, emergency systems, or other
applications with a similar degree of potential hazard.
Documentation stored on electronic media may be printed for personal use only.
Except for the forgoing, no portion of this documentation may be reproduced or
transmitted in any form or by any means, electronic or mechanical, without prior
written permission from Metrowerks.
ALL SOFTWARE, DOCUMENTATION AND RELATED MATERIALS ARE SUBJECT
TO THE METROWERKS END USER LICENSE AGREEMENT FOR SUCH PRODUCT.
How to Contact Metrowerks:
Corporate Headquarters
World Wide Web
Ordering & Technical Support
Metrowerks Corporation
9801 Metric Blvd.
Austin, TX 78758
U.S.A.
http://www.metrowerks.com
Voice: (800) 377-5416
Fax: (512) 997-4901
Table of Contents
1 Introduction
9
Read the Release Notes . . . . . . . . . . . . . . . . . . . 9
Related Documentation . . . . . . . . . . . . . . . . . . . 9
2 Installing CodeWarrior for the StarCore DSP
11
System Requirements . . . . . . . . . . . . . . . . . . .
Windows Operating System Requirements . . . . . . . .
Solaris Operating System Requirements . . . . . . . . .
Installing the CodeWarrior Software . . . . . . . . . . . .
Installing the CodeWarrior Software on Windows . . . . .
Installing the CodeWarrior Software on the Solaris Operating
System . . . . . . . . . . . . . . . . . . . . . . .
3 StarCore Development Tools Overview
.
.
.
.
.
.
.
.
.
.
.
.
.
.
.
.
.
.
.
.
.
.
.
.
.
.
.
.
.
.
.
.
.
.
.
.
.
.
.
.
.
.
.
.
.
.
.
.
.
.
.
.
.
.
.
.
.
.
.
.
.
.
.
.
.
4 CodeWarrior for the StarCore DSP: A Tutorial
.
.
.
.
.
.
.
.
.
.
.
5 Target Settings
.
.
.
.
.
.
.
.
.
.
.
12
15
Metrowerks Enterprise C Compiler
StarCore 100 Assembler . . . . .
StarCore 100 Linker . . . . . . .
CodeWarrior Debugger . . . . .
StarCore Utilities . . . . . . . .
Using Stationery . . . .
Creating a Project . . . .
Create a New Project .
Add a New Source File
View Target Settings .
Build the Project . . .
Debugging a Project. . .
Start Debugging . . .
Set a Breakpoint . . .
Show Registers . . .
Finish Debugging . .
11
11
11
12
12
.
.
.
.
.
.
.
.
.
.
.
.
.
.
.
.
.
.
.
.
.
.
.
.
.
.
.
.
.
.
.
.
.
.
.
.
.
.
.
.
.
.
.
.
15
16
16
16
17
19
.
.
.
.
.
.
.
.
.
.
.
.
.
.
.
.
.
.
.
.
.
.
.
.
.
.
.
.
.
.
.
.
.
.
.
.
.
.
.
.
.
.
.
.
.
.
.
.
.
.
.
.
.
.
.
.
.
.
.
.
.
.
.
.
.
.
.
.
.
.
.
.
.
.
.
.
.
.
.
.
.
.
.
.
.
.
.
.
.
.
.
.
.
.
.
.
.
.
.
.
.
.
.
.
.
.
.
.
.
.
.
.
.
.
.
.
.
.
.
.
.
19
21
21
21
24
27
27
28
28
31
32
33
Target Settings Overview . . . . . . . . . . . . . . . . . 33
StarCore DSP Targeting Manual
ECM–3
T a b le of C on t e n t s
Changing Target Settings . . . . . . .
Saving New Target Settings in Stationery
Restoring Target Settings . . . . . . .
StarCore Linker Target Settings Panels .
StarCore-Specific Target Settings Panels . .
Target Settings . . . . . . . . . . . .
Assembler Preprocessors . . . . . . .
StarCore Environment . . . . . . . .
Enterprise Linker . . . . . . . . . .
DSP Linker . . . . . . . . . . . . .
DSP Librarian . . . . . . . . . . . .
C Language . . . . . . . . . . . . .
Listing File Options . . . . . . . . .
Code & Language Options . . . . . .
Enterprise Compiler . . . . . . . . .
I/O & Preprocessors . . . . . . . . .
Optimizations Target . . . . . . . . .
Passthrough, Hardware . . . . . . . .
Remote Debugging . . . . . . . . .
SC100 Debugger Target . . . . . . . .
SC100 ELF Dump . . . . . . . . . .
SC100 ELF to LOD . . . . . . . . . .
SC100 ELF to S-Record . . . . . . . .
6 Debugging
.
.
.
.
.
.
.
.
.
.
.
.
.
.
.
.
.
.
.
.
.
.
.
.
.
.
.
.
.
.
.
.
.
.
.
.
.
.
.
.
.
.
.
.
.
.
.
.
.
.
.
.
.
.
.
.
.
.
.
.
.
.
.
.
.
.
.
.
.
.
.
.
.
.
.
.
.
.
.
.
.
.
.
.
.
.
.
.
.
.
.
.
.
.
.
.
.
.
.
.
.
.
.
.
.
.
.
.
.
.
.
.
.
.
.
.
.
.
.
.
.
.
.
.
.
.
.
.
.
.
.
.
.
.
.
.
.
.
.
.
.
.
.
.
.
.
.
.
.
.
.
.
.
.
.
.
.
.
.
.
.
.
.
.
.
.
.
.
.
.
.
.
.
.
.
.
.
.
.
.
.
.
.
.
.
.
.
.
.
.
.
.
.
.
.
.
.
.
.
.
.
.
.
.
.
.
.
34
35
35
35
36
38
40
43
45
46
47
48
50
52
55
60
62
64
65
67
70
72
72
75
Stack Crawl Depth . . . . . . . . . . . . . . . . . . . . 75
Register Windows . . . . . . . . . . . . . . . . . . . . 75
Register Details Window . . . . . . . . . . . . . . . . . 76
Tips for Debugging Assembly Code . . . . . . . . . . . . . 78
Cycle Counter in the Simulator . . . . . . . . . . . . . . . 79
Loading a .eld File without a Project. . . . . . . . . . . . . 80
System-Level Connect . . . . . . . . . . . . . . . . . . . 81
Initialization File . . . . . . . . . . . . . . . . . . . . . 82
Example Initialization File . . . . . . . . . . . . . . . 82
Customizing an Initialization File and JTAG Initialization File for
8101 Hardware . . . . . . . . . . . . . . . . . . . . 83
Setting the IMMR Value . . . . . . . . . . . . . . . . 83
ECM–4
StarCore DSP Targeting Manual
T a b l e o f C on t e n t s
Initialization File Commands . . . . .
Kernel Awareness . . . . . . . . . . .
Command-Line Debugging . . . . . . .
Tcl Support . . . . . . . . . . . . .
Command-Line Debugging Tasks . . .
Command-Line Debugging Commands
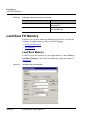
Load Save Fill Memory . . . . . . . . .
Load/Save Memory . . . . . . . . .
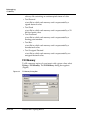
Fill Memory . . . . . . . . . . . . .
Save Restore Registers. . . . . . . . . .
.
.
.
.
.
.
.
.
.
.
.
.
.
.
.
.
.
.
.
.
.
.
.
.
.
.
.
.
.
.
.
.
.
.
.
.
.
.
.
.
.
.
.
.
.
.
.
.
.
.
.
.
.
.
.
.
.
.
.
.
.
.
.
.
.
.
.
.
.
.
.
.
.
.
.
.
.
.
.
.
7 Multi-Core Debugging
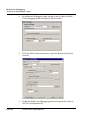
Setting Up to Debug Multiple Targets . .
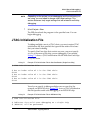
JTAG Initialization File . . . . . . . .
LDebugging with Multiple Cores . . . .
Using Multi-Core Debugging Commands
Synchronized Stop . . . . . . . . . .
135
.
.
.
.
.
.
.
.
.
.
.
.
.
.
.
.
.
.
.
.
.
.
.
.
.
.
.
.
.
.
.
.
.
.
.
.
.
.
.
.
.
.
.
.
.
8 iCache Performance Analysis
.
.
.
.
.
.
.
.
.
.
.
.
.
.
.
.
.
.
.
.
.
.
.
.
.
.
.
.
.
.
.
.
.
.
.
.
.
.
.
.
.
.
.
.
.
9 Enhanced On-Chip Emulation (EOnCE)
EOnCE Features . . . . . . . . . . . .
EOnCE Configurator Panels Description . .
EE Pins Controller panel . . . . . . .
Address event detection channel panels
Data Event Detection Channel panel . .
Event Counter panel . . . . . . . . .
Event Selector panel . . . . . . . . .
. 135
. 137
. 139
. 140
. 141
143
iCacheViewer Window . . . . . . . . . . . .
iCache Performance Tool . . . . . . . . . . .
Input Files for the iCache Performance Tool . .
Starting the iCache Performance Tool . . . . .
iCache Performance Menu and iCache Toolbar
All Cores View . . . . . . . . . . . . . .
Core View . . . . . . . . . . . . . . . .
Function View . . . . . . . . . . . . . . .
PC View . . . . . . . . . . . . . . . . .
StarCore DSP Targeting Manual
. 84
. 91
. 92
. 92
. 94
. 98
. 128
. 128
. 130
. 132
. 143
. 145
. 145
. 146
. 150
. 152
. 153
. 154
. 155
157
.
.
.
.
.
.
.
.
.
.
.
.
.
.
.
.
.
.
.
.
.
.
.
.
.
.
.
.
.
.
.
.
.
.
.
.
.
.
.
.
.
.
.
.
.
.
.
.
.
.
.
.
.
.
.
.
. 157
. 158
. 159
. 162
. 165
. 168
. 170
ECM–5
T a b le of C on t e n t s
Trace Unit panel . . . . . . . . . . . . . . . . . . . . 173
EOnCE Example: Counting Factorial Function Calls . . . . . . 176
EOnCE Example: Using the Trace Buffer . . . . . . . . . . . 192
10 Code Profiler
203
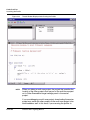
Profiler Examples . . . . . . . . . . . . . .
Launching the Profiler. . . . . . . . . . . .
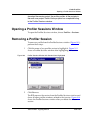
Opening a Profiler Sessions Window . . . . .
Removing a Profiler Session . . . . . . . . .
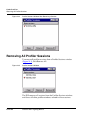
Removing All Profiler Sessions . . . . . . . .
View a List of Functions . . . . . . . . . . .
View an Instruction-Level Report . . . . . . .
View Function Details . . . . . . . . . . . .
View a Function Call Tree . . . . . . . . . .
View Source Files Information . . . . . . . .
View Profile Information Line by Line . . . . .
Save a Profile. . . . . . . . . . . . . . . .
Load a Profile . . . . . . . . . . . . . . .
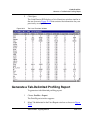
Generate a Tab-Delimited Profiling Report . . .
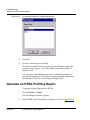
Generate an HTML Profiling Report. . . . . .
Generate an XML Profiling Report . . . . . .
Set Up to Profile Assembly Language Programs
.
.
.
.
.
.
.
.
.
.
.
.
.
.
.
.
.
.
.
.
.
.
.
.
.
.
.
.
.
.
.
.
.
.
.
.
.
.
.
.
.
.
.
.
.
.
.
.
.
.
.
.
.
.
.
.
.
.
.
.
.
.
.
.
.
.
.
.
.
.
.
.
.
.
.
.
.
.
.
.
.
.
.
.
.
.
.
.
.
.
.
.
.
.
.
.
.
.
.
.
.
.
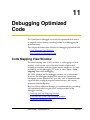
11 Debugging Optimized Code
227
Code Mapping View Window . . . . . . . .
Viewing the Code Mapping Window . . . .
User Interface of the Code Mapping Window
Analyzing Optimized Code . . . . . . . .
Run Control for Optimized Code . . . . . . .
Breakpoints . . . . . . . . . . . . . . .
Step Functions . . . . . . . . . . . . . .
.
.
.
.
.
.
.
.
.
.
.
.
.
.
.
.
.
.
.
.
.
.
.
.
.
.
.
.
.
.
.
.
.
.
.
.
.
.
.
.
.
.
12 High-Speed Simultaneous Transfer and Data Visualization
HSST . . . . . . . . . .
Host-Side Client Interface
Target Library Interface .
Data Visualization . . . .
ECM–6
StarCore DSP Targeting Manual
. 203
. 204
. 207
. 207
. 208
. 209
. 210
. 211
. 213
. 214
. 215
. 217
. 218
. 219
. 220
. 222
. 224
.
.
.
.
.
.
.
.
.
.
.
.
.
.
.
.
.
.
.
.
.
.
.
.
.
.
.
.
.
.
.
.
.
.
.
.
.
.
.
.
.
.
.
.
.
.
.
.
. 227
. 228
. 228
. 230
. 231
. 231
. 233
237
.
.
.
.
.
.
.
.
.
.
.
.
. 237
. 237
. 244
. 250
T a b l e o f C on t e n t s
Starting Data Visualization
Data Target Dialog Boxes .
Memory . . . . . . . .
Registers . . . . . . . .
Variables . . . . . . . .
HSST . . . . . . . . . .
Graph Window Properties
.
.
.
.
.
.
.
.
.
.
.
.
.
.
.
.
.
.
.
.
.
.
.
.
.
.
.
.
.
.
.
.
.
.
.
.
.
.
.
.
.
.
.
.
.
.
.
.
.
.
.
.
.
.
.
.
.
.
.
.
.
.
.
.
.
.
.
.
.
.
.
.
.
.
.
.
.
.
.
.
.
.
.
.
.
.
.
.
.
.
.
.
.
.
.
.
.
.
13 Debugger Communications Protocols
Command Converter Server . . . . . . . . . .
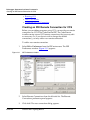
Creating an IDE Remote Connection for CCS .
Running CCS . . . . . . . . . . . . . . .
The CCS Console . . . . . . . . . . . . .
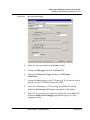
Configuring a CCS Connection . . . . . . .
Metrowerks Target Resident Kernel . . . . . . .
MetroTRK Limitations and Restrictions . . . .
Downloading MetroTRK to the MSC8101 Board
Remote Debugger Settings for MetroTRK . . .
Simulator . . . . . . . . . . . . . . . . . .
MSC8102 Simulator . . . . . . . . . . . .
SC100 Simulator . . . . . . . . . . . . . .
257
.
.
.
.
.
.
.
.
.
.
.
.
.
.
.
.
.
.
.
.
.
.
.
.
.
.
.
.
.
.
.
.
.
.
.
.
.
.
.
.
.
.
.
.
.
.
.
.
.
.
.
.
.
.
.
.
.
.
.
.
14 StarCore DSP Utilities
. 257
. 258
. 260
. 260
. 261
. 261
. 262
. 263
. 264
. 266
. 266
. 267
269
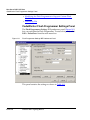
Flash Programmer . . . . . . . . . . . . . . . . . . .
CodeWarrior Flash Programmer Settings Panel . . . . .
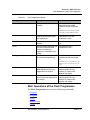
Main Operations of the Flash Programmer . . . . . . .
Board Support . . . . . . . . . . . . . . . . . . . .
Modifying the Flash Programmer to Support Custom Flash
Modules . . . . . . . . . . . . . . . . . . . . . .
Personality File . . . . . . . . . . . . . . . . . . .
ELF/DWARF File Dump Utility . . . . . . . . . . . . .
ELF to S-Record File Conversion Utility . . . . . . . . . .
Installing elfsrec . . . . . . . . . . . . . . . . . . .
Using elfsrec . . . . . . . . . . . . . . . . . . . .
Using StarCore-Specific elfsrec Options . . . . . . . . .
SC100-stat Utility . . . . . . . . . . . . . . . . . . . .
StarCore DSP Targeting Manual
. 251
. 252
. 252
. 253
. 254
. 255
. 255
. 269
. 270
. 271
. 274
. 274
. 288
. 289
. 291
. 291
. 291
. 292
. 292
ECM–7
T a b le of C on t e n t s
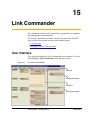
15 Link Commander
295
User Interface . . . . . . . . . . . .
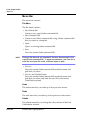
Menu Bar . . . . . . . . . . . . .
Unassigned Sections . . . . . . . .
Unassigned Symbols . . . . . . . .
LCF Pane . . . . . . . . . . . . .
Creating a Linker Command File . . . .
Assign Memory Addresses to Symbols
Create Memory Ranges . . . . . . .
Create Segments . . . . . . . . . .
Assign Sections . . . . . . . . . .
Create an Entry Point . . . . . . . .
.
.
.
.
.
.
.
.
.
.
.
.
.
.
.
.
.
.
.
.
.
.
.
.
.
.
.
.
.
.
.
.
.
.
.
.
.
.
.
.
.
.
.
.
.
.
.
.
.
.
.
.
.
.
.
.
.
.
.
.
.
.
.
.
.
.
.
.
.
.
.
.
.
.
.
.
.
.
.
.
.
.
.
.
.
.
.
.
.
.
.
.
.
.
.
.
.
.
.
16 Assembly and C Benchmarks
C Benchmarks . . . . . . .
Running the C Benchmarks
Additional Examples . . .
Assembly Benchmarks . . .
Index
ECM–8
. 295
. 296
. 297
. 297
. 297
. 298
. 298
. 298
. 298
. 298
. 298
299
.
.
.
.
.
.
.
.
.
.
.
.
.
.
.
.
.
.
.
.
.
.
.
.
.
.
.
.
.
.
.
.
.
.
.
.
.
.
.
.
.
.
.
.
.
.
.
.
.
.
.
.
.
.
.
.
. 299
. 300
. 301
. 302
305
StarCore DSP Targeting Manual
1
Introduction
This manual describes how to use the CodeWarrior™ Integrated
Development Environment (IDE).
This chapter contains the following topics:
• Read the Release Notes
• Related Documentation
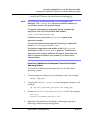
Read the Release Notes
Please read the release notes. They contain important information
about new features, bug fixes, and incompatibilities that might not
have made it into the documentation due to release deadlines. You
can find the release notes on the CodeWarrior CD in the Release
Notes folder.
Related Documentation
This section directs you to useful sections of this manual and other
useful documentation.
If you are new to the CodeWarrior IDE:
• See “StarCore Development Tools Overview” on page 15.
• See “CodeWarrior for the StarCore DSP: A Tutorial” on page 19.
For everyone:
• For general information about the CodeWarrior IDE and
debugger, refer to the IDE User Guide.
StarCore DSP Targeting Manual
ECM–9
In t ro d u c t io n
Related Documentation
To learn more about the StarCore processor and development
tools:
• See the SC100 Assembly Language Tools User’s Manual. (This
manual provides information about the assembler and linker
and related command-line interfaces.)
• See the Metrowerks Enterprise C Compiler User’s Manual. (This
manual provides information about the compiler and its
command-line interface.)
• See the SC140 DSP Core Reference Manual. (The preceding
manual provides more information about the EOnCE module
and the events that you can debug using EOnCE.)
• See the SC100 Application Binary Interface Reference Manual.
You can download electronic versions of the manuals in the
preceding list from the following World Wide Web page:
http://e-www.motorola.com/webapp/sps/library/
docu_lib.jsp
For more information on S-records:
• See the DSP Linker/Librarian Reference Manual.
ECM–10
StarCore DSP Targeting Manual
2
Installing CodeWarrior for
the StarCore DSP
This chapter describes how to install the CodeWarrior development
tools and contains the following topics:
• System Requirements
• Installing the CodeWarrior Software
System Requirements
The system requirements for Windows®-hosted and Solaris-hosted
tools differ:
• Windows Operating System Requirements
• Solaris Operating System Requirements
Windows Operating System Requirements
To install the CodeWarrior IDE and the StarCore Simulator
software, you need:
• Hardware: Intel® Pentium®-class microprocessor, 64 MB of
RAM, and an available parallel port.
• Operating System: Windows 98, Windows ME, Windows NT
4.0, Windows 2000, or Windows XP
• Other: 350 MB free hard disk space on the disk where you are
installing the software.
Solaris Operating System Requirements
To install the CodeWarrior IDE on a Solaris host, you need:
• 250 MB of free disk space
StarCore DSP Targeting Manual
ECM–11
In stal lin g C o d e Wa rr io r for th e S t ar Co r e D S P
Installing the CodeWarrior Software
• CD-ROM drive
• Solaris 2.6, Solaris 7, or Solaris 8 operating system (required for
local hardware debugging)
• PCI capability (required for local hardware debugging)
Installing the CodeWarrior Software
The installation procedure for the Windows-hosted and Solarishosted tools differ:
• Installing the CodeWarrior Software on Windows
• Installing the CodeWarrior Software on the Solaris Operating
System
Installing the CodeWarrior Software on
Windows
Use the CodeWarrior installer to automatically install all necessary
components and files. If you have any questions regarding the
installer, read the instructions built into the CodeWarrior installer.
NOTE
You must have administrative privileges to install this software on
Windows NT, Windows 2000, or Windows XP.
To install CodeWarrior Development Tools for the StarCore DSP,
perform the following steps:
1
Run setup.exe.
2
Follow the displayed instructions.
3
Restart your computer.
Installing the CodeWarrior Software on the
Solaris Operating System
This section describes how to install the CodeWarrior software for
the Solaris operating system. To install, you must:
• Install the CodeWarrior development tools for the Solaris
operating system
ECM–12
StarCore DSP Targeting Manual
I n s t a ll in g C od e W a r rio r f or t h e St a rC o re D SP
Installing the CodeWarrior Software on the Solaris Operating System
• Install the PCI drivers (for local hardware debugging)
NOTE
You must have a valid license file to run the compiler and
debugger. The license.dat file in the installation directory of
your product contains the product license.
To request a permanent or evaluation license, complete the
registration form at this World Wide Web address:
http://www.metrowerks.com
Evaluation users must enter Evaluation in place of the
registration number.
You can send an email message about licensing or registration
issues to license@metrowerks.com.
An electronic registration card resides in the Registration
subdirectory of the Release_Notes directory. The electronic
registration card contains additional information about alternate
ways to register and license your product if you do not have
Internet access.
Install the CodeWarrior Development Tools for the Solaris
Operating System
To install the CodeWarrior development tools for the Solaris
operating system:
1
Create a temporary directory for installing the tools. For example:
mkdir temp_dir
2
Copy the file install_sc140.tar to the temporary directory. For
example:
cp install_StarCore_Solaris.tar temp_dir
3
Extract the install_StarCore_Solaris.tar file. For example:
tar xvf
install_StarCore_Solaris.tar
4
Determine the default user shell that is running by typing the
following command and pressing Enter:
StarCore DSP Targeting Manual
ECM–13
In stal lin g C o d e Wa rr io r for th e S t ar Co r e D S P
Installing the CodeWarrior Software on the Solaris Operating System
echo $SHELL
NOTE
5
You must be running the C shell to complete the installation.
Otherwise, consult your system administrator or user's manual for
instructions on changing the user shell.
If you are running the C shell (/bin/csh), start the installation
script by running install_sc140.cshell.
The script lists the steps to guide you through the installation. The
script also presents a menu of options.
6
Select 3, Install StarCore 140 Software Development Tools and
follow the instructions presented.
7
Select 4, Exit.
8
Restart your start-up file. For example:
source $HOME/.cshrc
NOTE
The $HOME/.cshrc file exclusively manages environment
variables for CodeWarrior Development Tools for the StarCore
DSP. Therefore, you must set those variables manually from the
command line unless you first edit the .cshrc file to remove the
StarCore directory source command.
Install the PCI drivers
To install the PCI (Peripheral Component Interconnect) drivers:
1
Navigate to the StarCore/motcc_pci path on the host machine.
2
From a command line prompt in the preceding directory, type the
following to install the drivers:
./install
3
ECM–14
Restart the host machine.
StarCore DSP Targeting Manual
3
StarCore Development
Tools Overview
This chapter is an overview of the StarCore DSP-specific
development tools included with CodeWarriorTM for the StarCoreTM
DSP
• Metrowerks Enterprise C Compiler
• StarCore 100 Assembler
• StarCore 100 Linker
• StarCore 100 Assembler
• CodeWarrior Debugger
• StarCore Utilities
Metrowerks Enterprise C Compiler
The Metrowerks Enterprise C Compiler:
• Conforms to the American National Standards Institute (ANSI)
C standard.
• Conforms to the StarCore Application Binary Interface (ABI)
standard.
• Supports a set of digital signal processor (DSP) extensions.
• Supports International Telecommunications Union (ITU)/
European Telecommunications Standards Institute (ETSI)
primitives for saturating arithmetic. Additional parameters are
available for non-saturating arithmetic and double-precision
arithmetic.
• Allows for standard C constructs for representing special
addressing modes.
• Supports a wide range of runtime libraries and runtime
environments.
StarCore DSP Targeting Manual
ECM–15
St a r C o re D e v e l o pm e n t T o o ls Ov e rv ie w
StarCore 100 Assembler
• Optimizes for size (smaller code), speed (faster code), or a
combination of both, depending on options that you set.
The compiler links all application modules before optimizing. By
examining the entire linked application before optimizing, the
compiler produces highly optimized code. The compiler performs
many optimizations, including the following:
• Software pipelining
• Instruction paralleling and scheduling
• Data and address register allocation
• Loop invariant code motion
StarCore 100 Assembler
The assembler changes assembly language source code to machine
language object files or executable programs. (The assembly
language source code can be either originally written in assembly
language or generated by the compiler.)
The assembler embeds information about errors, warnings, and
assembly code in the listing files.
StarCore 100 Linker
The linker combines object files into a single executable file. You
specify the link mappings of your program in a linker command
file. As an alternative to editing a linker command file in a text
editor, you can use the Link Commander utility. The Link
Commander lets you manipulate the linker command file using
graphical representations of your memory segments and program
sections.
CodeWarrior Debugger
The CodeWarrior debugger lets you debugs your software on both
simulator and hardware targets. If debugging on a simulator target,
you have the additional option of analyzing code performance
using the iCacheViewer.
You may debug both unoptimized and optimized code.
ECM–16
StarCore DSP Targeting Manual
St a r C o re D e v e l o pm e n t T o o ls O v e r v i e w
StarCore Utilities
StarCore Utilities
The CodeWarriorTM for the StarCoreTM DSP software development
tools also include some utilities:
• A flash programmer.
• An ELF file dump utility for dumping StarCore DSP ELF object
module formatted files in a human-readable form (implemented
as a post-linker).
• A utility that converts ELF files to S-record files (implemented as
a post-linker).
• A standalone utility called sc100-stat that reads a .eld file and
returns certain statistics for the file.
• A utility that converts ELF files to LOD files (implemented as a
post-linker).
StarCore DSP Targeting Manual
ECM–17
St a r C o re D e v e l o pm e n t T o o ls Ov e rv ie w
StarCore Utilities
ECM–18
StarCore DSP Targeting Manual
4
CodeWarrior for the
StarCore DSP: A Tutorial
This chapter provides step-by-step instructions for developing
typical StarCore DSP projects using the CodeWarrior IDE, including
the CodeWarrior debugger.
This chapter includes the following topics:
• Using Stationery
• Creating a Project
• Debugging a Project
Using Stationery
Most new projects build upon project stationery. Project stationery
is a collection of projects for the various StarCore debug targets.You
can use these prebuilt projects as templates for constructing your
own new projects.
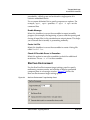
To use project stationery as a template
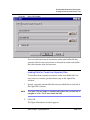
1
Select File > New
2
Select StarCore Stationery from the list
3
Set a Location and Project Name
4
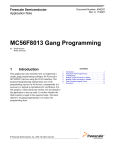
Click the OK button
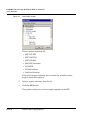
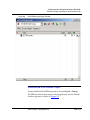
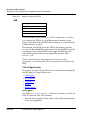
The New Project window appears (Figure 4.1)
StarCore DSP Targeting Manual
ECM–19
C o de W a r rio r f o r t he St a r C o re D SP : A T u t or ia l
Using Stationery
Figure 4.1
New Project window
There is project stationery for:
• MSC8101ADS
• MSC8101EVM
• MSC8102ADS
• MSC8201 Simulator
• SC140 SDP
• SC140 Simulator
• StarCore Librarian
Some of the project stationery have variants for assembly source
projects and endian options.
5
Select a project stationery from the list
6
Click the OK button.
The project window for your new project appears in the IDE.
ECM–20
StarCore DSP Targeting Manual
C od e W a r rio r f o r t h e St a r C or e D S P: A Tu t o ri a l
Creating a Project
Creating a Project
In this tutorial, we create a new project using the SC140_Simulator
project stationery, add our own source code and target settings, and
compile the project
• Create a New Project
• Add a New Source File
• View Target Settings
• Build the Project
Create a New Project
Create a new project using the SC140_Simulator > C > Big Endian
project stationery as described in “Using Stationery” on page 19.
Add a New Source File
1
Choose File > New.
The New window appears.
2
Click the File tab.
3
Type the following in the File name field:
my_main.c
4
Click the Add to Project checkbox to enable it.
5
Ensure that the Project pop-up menu displays the name of your
project.
6
In the Targets list box, click the checkbox by the name of the target
to which to add the new file.
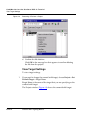
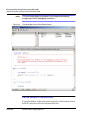
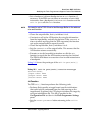
Figure 4.2 shows the New window as it now appears.
StarCore DSP Targeting Manual
ECM–21
C o de W a r rio r f o r t he St a r C o re D SP : A T u t or ia l
Add a New Source File
Figure 4.2
7
New Window When Creating a Text File
Click Set to navigate to a different directory and save the file or click
OK in the New window to accept the default location.
An editor window appears with the name you specified and the
CodeWarrior IDE adds the file to the specified project.
8
Type the following lines of source code in the editor window:
#include <stdio.h>
int a = 5;
int b = 10;
int c = 0;
void main(void)
{
printf("Hello StarCore!\n");
do {
ECM–22
StarCore DSP Targeting Manual
C od e W a r rio r f o r t h e St a r C or e D S P: A Tu t o ri a l
Add a New Source File
a++;
b++;
c = a + b;
printf("The current value of a is: %d \n", a);
printf("The current value of b is: %d \n", b);
printf("The current value of c is: %d \n", c);
} while (c < 100);
}
9
10
Choose File > Save and close the file.
Remove the placeholder source file.
(The SC140_main.c file included with the stationery is a
placeholder for your own project files.)
a. In the Project window, select SC140_main.c.
b. Right-click on SC140_main.c.
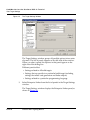
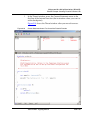
c. Select Delete from the pop-up menu, as shown in Figure 4.3.
StarCore DSP Targeting Manual
ECM–23
C o de W a r rio r f o r t he St a r C o re D SP : A T u t or ia l
View Target Settings
Figure 4.3
Removing a File from a Project
d. Confirm the file deletion.
Click OK in the message box that appears to confirm deleting
the file from the project.
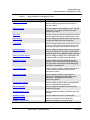
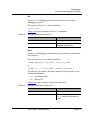
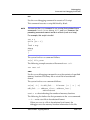
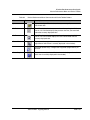
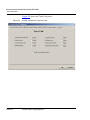
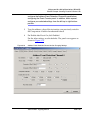
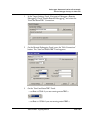
View Target Settings
To view target settings:
1
If you need to change the current build target, choose Project > Set
Default Target > Target Name.
Target Name is the name of the target that you are specifying as the
current build target.
The Project window (Figure 4.4) shows the current build target.
ECM–24
StarCore DSP Targeting Manual
C od e W a r rio r f o r t h e St a r C or e D S P: A Tu t o ri a l
View Target Settings
Figure 4.4
The Project Window and Current Build Target
build target
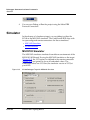
2
NOTE
Choose Edit > Target Name Settings, where Target Name is the
name of the current build target.
For this example, choose Edit > C for SC Simulator Settings.
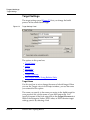
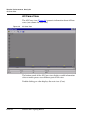
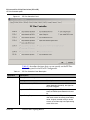
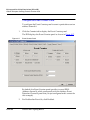
The Target Settings window appears (Figure 4.5).
StarCore DSP Targeting Manual
ECM–25
C o de W a r rio r f o r t he St a r C o re D SP : A T u t or ia l
View Target Settings
Figure 4.5
The Target Settings Window
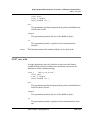
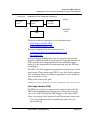
The Target Settings window groups all possible options into a series
of panels. The list of panels appears on the left side of the window.
When you select a panel, the options in that panel appear on the
right side of the dialog box.
Different panels affect:
• Settings related to all build targets
• Settings that are specific to a particular build target (including
settings that affect code generation and linker output)
• Settings related to a particular programming language
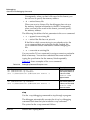
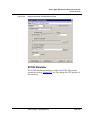
3
Select Enterprise Linker from the list of panels in the Target Settings
window.
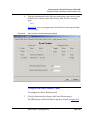
The Target Settings window displays the Enterprise Linker panel, as
shown in Figure 4.6.
ECM–26
StarCore DSP Targeting Manual
C od e W a r rio r f o r t h e St a r C or e D S P: A Tu t o ri a l
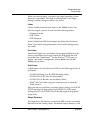
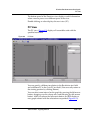
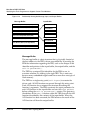
Build the Project
Figure 4.6
Enterprise Linker Panel
The Output File Name text box contains the name of the output file.
This file has the extension .eld.
Examine the other settings before closing the Target Settings
window.
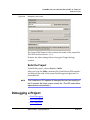
Build the Project
To build the project:, choose Project > Make.
After you issue the Make command, the CodeWarrior IDE compiles
and links all the code in the current build target and generates an
executable file.
NOTE
The CodeWarrior IDE updates all changed files before compiling so
that it compiles the latest version of each file. (The IDE tracks these
dependencies automatically.)
Debugging a Project
• Start Debugging
• Set a Breakpoint
• Show Registers
StarCore DSP Targeting Manual
ECM–27
C o de W a r rio r f o r t he St a r C o re D SP : A T u t or ia l
Start Debugging
• Finish Debugging
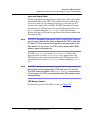
Start Debugging
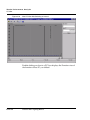
To run the project, choose Project > Debug.
The debugger displays a message box while downloading your
application to the target board.
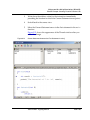
A debugger window (Figure 4.7) appears.
Figure 4.7
Debugger window
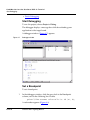
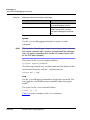
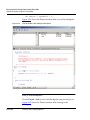
Set a Breakpoint
To set a breakpoint:
1
In the debugger window, click the gray dash in the Breakpoint
column, next to the following line of code:
printf("The current value of b is: %d \n", b);
A red marker appears (Figure 4.8).
ECM–28
StarCore DSP Targeting Manual
C od e W a r rio r f o r t h e St a r C or e D S P: A Tu t o ri a l
Set a Breakpoint
NOTE
Figure 4.8
You also can set a breakpoint by clicking next to a valid line of code
in the Breakpoint column of the Editor window.
Debugger window after Setting a Breakpoint
Breakpoint
Marker
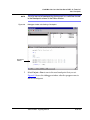
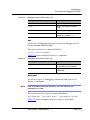
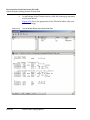
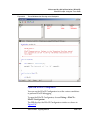
2
Select Project > Run to run to the new breakpoint that you set.
Figure 4.9 shows the debugger window after the program runs to
the new breakpoint.
StarCore DSP Targeting Manual
ECM–29
C o de W a r rio r f o r t he St a r C o re D SP : A T u t or ia l
Set a Breakpoint
Figure 4.9
Debugger window after Running to Breakpoint
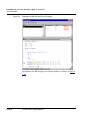
In addition, the IDE displays an output window, as shown in Figure
4.10.
ECM–30
StarCore DSP Targeting Manual
C od e W a r rio r f o r t h e St a r C or e D S P: A Tu t o ri a l
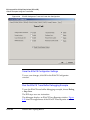
Show Registers
Figure 4.10
Example Program Output Window
You successfully set a breakpoint and ran the debugger to that
breakpoint.
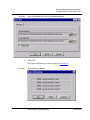
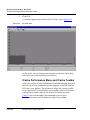
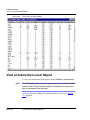
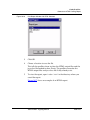
Show Registers
To display registers,
1
Choose View > Registers.
The Registers Window (Figure 4.11) appears, displaying a cascading
list of register options, depending on your target processor.
Figure 4.11
Registers Window
StarCore DSP Targeting Manual
ECM–31
C o de W a r rio r f o r t he St a r C o re D SP : A T u t or ia l
Finish Debugging
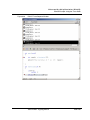
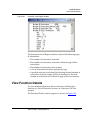
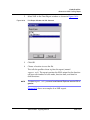
2
Choose a register from the menu.
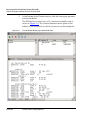
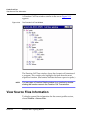
For this example, double-click SC140 > General Purpose.
The CodeWarrior IDE displays an information window for the
selected registers.
Figure 4.12
General Purpose Registers Window
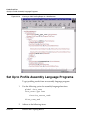
Finish Debugging
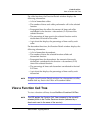
Choose Debug > Kill to finish debugging.
Alternatively, you can choose Project > Run to continue debugging
in the debugger window.
At this point you have been introduced to the major components of
CodeWarriorTM for the StarCoreTM DSP. You have seen the project
manager, source code editor, and target settings panels.
ECM–32
StarCore DSP Targeting Manual
5
Target Settings
Each build target in a CodeWarrior project has its own settings,
some of which are general CodeWarrior project settings and some
of which are specific to the platform target.
This chapter and manual describe only the target settings panels
that are specific to software development for the StarCore DSP. The
settings that you choose affect the compiler, linker, and assembler.
This chapter contains the following topics:
• Target Settings Overview
• StarCore-Specific Target Settings Panels
Target Settings Overview
When you create a project using stationery, the build targets
included in the stationery already include default target settings.
You can use those default target settings (if the settings are
appropriate), or you can change them.
NOTE
Use the StarCore project stationery when you create a new project.
StarCore DSP Targeting Manual
ECM–33
T a rg e t Se t t in g s
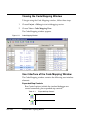
Changing Target Settings
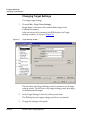
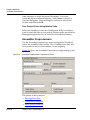
Changing Target Settings
To change target settings:
1
Choose Edit > Target Name Settings.
Target Name is the name of the current build target in the
CodeWarrior project.
After you choose this command, the IDE displays the Target
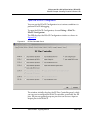
Settings window, as shown in Figure 5.1.
Figure 5.1
Target Settings window
The left side of the Target Settings window contains a list of target
settings panels. The list shows only target settings panels that apply
to the current build target.
2
In the Target Settings Panels list, click a panel name.
The IDE displays the target settings panel that you selected.
3
ECM–34
Change the settings in the panel.
StarCore DSP Targeting Manual
T a r g e t S e t t in g s
Saving New Target Settings in Stationery
4
Click OK.
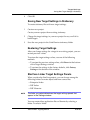
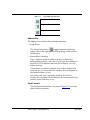
Saving New Target Settings in Stationery
To create stationery files with new target settings:
1
Create a new project.
Create your new project from existing stationery.
2
Change the target settings in your new project for any or all of its
build targets.
3
Save the new project in the CodeWarrior stationery folder.
Restoring Target Settings
After you change settings for a target in an existing project, you can
restore previous values.
To restore the target settings values, use one of the following
methods:
• To restore the previous setting values, click Revert at the bottom
of the Target Settings window.
• To restore the settings to the factory defaults, click Factory
Settings at the bottom of the window.
StarCore Linker Target Settings Panels
When you develop StarCore projects, you can choose among the
following linkers to create object code from source files:
• Enterprise linker
• DSP linker
• DSP Librarian
NOTE
The linker you select determines the target settings panels that
appear in the Settings window.
You can create either application files or libraries by selecting a
linker. To select a linker:
StarCore DSP Targeting Manual
ECM–35
T a rg e t Se t t in g s
StarCore-Specific Target Settings Panels
1
Choose Edit > Target Name Settings.
2
In the Target Settings Panels list, click Target Settings.
3
To tell the IDE to build libraries, choose DSP Librarian from the
Linker pop-up menu. Go to step 5.
NOTE
Output files must use the .elb file extension when using the DSP
Librarian.
Otherwise, go to step 4.
4
To tell the IDE to build an application, choose one of the following
items from the Linker pop-up menu:
• Motorola DSP Linker
Use the Motorola DSP Linker when creating applications
with only assembly source files.
• Motorola Enterprise Linker
Use the Motorola Enterprise Linker when creating
applications with either C source files or C and assembly
source files. This linker expects a C source file that contains a
main() function.
Go to step 5.
5
Click OK.
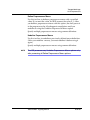
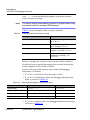
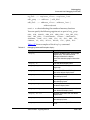
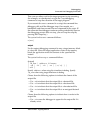
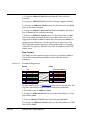
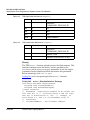
StarCore-Specific Target Settings Panels
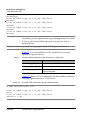
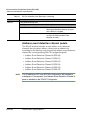
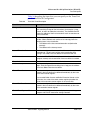
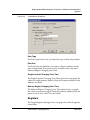
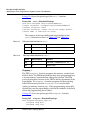
Table 5.1 lists and briefly describes the StarCore-specific target
settings panels.
Table 5.1
StarCore-Specific Target Settings Panels
Panel
Description
Target Settings
Includes a variety of settings, including those for
target operating system, microprocessor, and build
target name.
Assembler Preprocessors
Includes assembler-related settings, including
settings for where the assembler looks for files and
how it handles those files.
ECM–36
StarCore DSP Targeting Manual
T a r g e t S e t t in g s
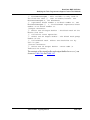
StarCore-Specific Target Settings Panels
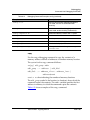
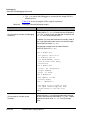
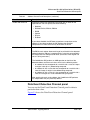
Table 5.1
StarCore-Specific Target Settings Panels
Panel
Description
StarCore Environment
Includes settings for endianness, memory mode, and
whether to display generated command lines in a
message window.
Enterprise Linker
Contains settings for the Enterprise Linker. The IDE
passes the -Xlink option to the linker for each
option that you select.
DSP Linker
Contains settings that specify link options for building
StarCore applications with the Motorola DSP Linker.
DSP Librarian
Contains settings to build libraries for StarCore and
to specify the output file name of the library.
C Language
Contains settings related to the version of C that you
are using. (If you are using the default version, you
do not need to specify any settings on this panel.)
Listing File Options
Contains settings to specify the format and contents
of the source listing file. You also can specify other
assembler options in the Additional Options text box.
Code & Language Options
Contains settings to specify the symbol options and
assembler options for the StarCore Assembler.
Enterprise Compiler
Contains settings to specify the behavior of the
compiler, such as where the IDE stops processing
files and whether the compiler includes debugging
information in the output file.
I/O & Preprocessors
Contains settings to specify additional directories for
the IDE to search and to define and undefine
preprocessor macros.
Optimizations Target
Contains settings to specify several types of
optimization, including space optimization, time
optimization, and whether the IDE applies
optimizations globally.
Passthrough, Hardware
Contains settings to specify options and arguments
to pass to specified tools components.
Remote Debugging
Contains settings that define the communication
protocol for the target
SC100 Debugger Target
Contains settings that determine the behavior of the
debugger.
SC100 ELF Dump
Contains settings for the ELF file dump utility.
SC100 ELF to LOD
Specifies the output file for the elflod utility.
SC100 ELF to S-Record
Contains the settings for the elfsrec utility.
StarCore DSP Targeting Manual
ECM–37
T a rg e t Se t t in g s
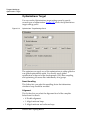
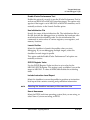
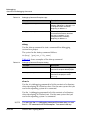
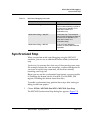
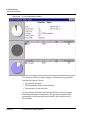
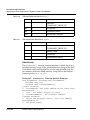
Target Settings
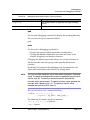
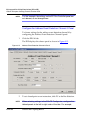
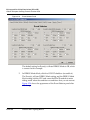
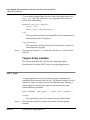
Target Settings
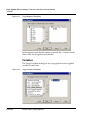
The target settings panel (Figure 5.2) lets you change the build
process of the current build target.
Figure 5.2
Target Settings Panel
The options in this panel are:
• Target Name
• Linker
• Pre-Linker
• Post-Linker
• Output Directory
• Save Project Entries Using Relative Paths
Target Name
Use this text box to set or change the name of a build target. When
you use the Targets view in the Project window, you see the name
you entered for this option.
The name you specify is the name you assign to the build target for
your personal use, not the name of your final output file. You
specify the name of the final output file in the Output file name text
field of the Enterprise Linker, DSP Linker, or DSP Librarian target
settings panels. By selecting a link
ECM–38
StarCore DSP Targeting Manual
T a r g e t S e t t in g s
Target Settings
When you select a linker, you specify the target operating system
and chip, if applicable. The other available panels in the Target
Settings window change to reflect your choice.
Linker
Choose a linker from the items listed in the Linker list box. For
StarCore targets, you can choose from the following linkers:
• Enterprise linker
• DSP Linker
• DSP Librarian
In the CodeWarrior IDE, build targets are defined by the chosen
linker. Your linker setting determines which other settings panels
are visible.
Pre-Linker
Some build targets have pre-linkers that perform additional work
(such as data-format conversion) before the IDE builds the final
executable file. CodeWarriorTM for the StarCoreTM DSP does not
require a pre-linker; consequently, choose None from the PreLinker pop-up menu.
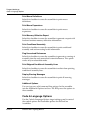
Post-Linker
CodeWarriorTM for the StarCoreTM DSP has the following choices of
post-linker:
• SC100 ELF Dump (uses the ELF file dump utility)
• SC100 ELF to LOD (uses the elflod utility)
• SC100 ELF to S-Record (uses the elfsrec utility)
• Shell Tool Post Linker (supports writing scripts to automate
build actions)
After you select a post-linker, you must specify settings in the SC100
ELF Dump target settings panel, the SC100 ELF to LOD target
settings panel, or the SC100 ELF to S-Record target settings panel,
respectively.
Output Directory
This field shows the directory to which the IDE saves the executable
file built from the current project. The default output directory is the
StarCore DSP Targeting Manual
ECM–39
T a rg e t Se t t in g s
Assembler Preprocessors
same directory in which the project file resides. To save the
executable file to a different directory, click Choose to display a
standard dialog box. Use the dialog box controls to select a new
location and then click OK.
Save Project Entries Using Relative Paths
Select this checkbox to cause the CodeWarrior IDE to use relative
paths to locate the files in your project. (Relative paths are useful for
distinguishing between two or more files with identical names.)
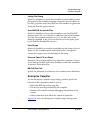
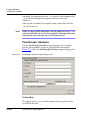
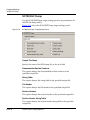
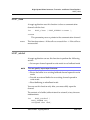
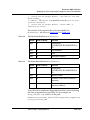
Assembler Preprocessors
Use the Assembler Preprocessors target settings panel to indicate
where the assembler looks for files, how it handles those files, and
what processor and revision number you are targeting.
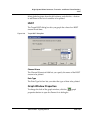
Figure 5.3 shows the Assembler Preprocessors target settings panel.
Figure 5.3
Assembler Preprocessors Target Settings Panel
The options in this panel are:
• Reassign Error Files
• Overwrite Existing File
• Read Options from File
ECM–40
StarCore DSP Targeting Manual
T a r g e t S e t t in g s
Assembler Preprocessors
• Path For Include Files
• Use Access Paths Panel for Include Paths
• Processor
• Revision
• Display Banner
• Preprocessor Definitions
• Enable Message
• Create List File
• Check All Possible Errors in Execution
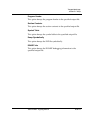
Reassign Error Files
You can redirect the standard error file to one other than the default,
errfil by typing a file name in this field. If you do not select the
Overwrite Existing File checkbox, the assembler appends to the file
specified in this text box (rather than overwriting the file).
Overwrite Existing File
Select this checkbox to cause the assembler to overwrite the file
specified file in the Reassign Error Files checkbox with error
information if the file already exists.
Read Options from File
Specify a file that contains command-line assembler optimization
options.
Path For Include Files
You can use this text box to specify the standard search path for
include files. You can specify multiple paths in this option,
delimiting each path with a comma. You can specify absolute or
relative paths.
The assembler first searches for include files in the current
directory or the directory specified in the INCLUDE directive, if
applicable. If the assembler does not find the file, it then prefixes the
file name (and optional path name, if applicable) specified in the
INCLUDE directive with a path name specified in this option. The
StarCore DSP Targeting Manual
ECM–41
T a rg e t Se t t in g s
Assembler Preprocessors
assembler then searches each newly created directory path name for
the file.
NOTE
The assembler issues error messages when header files are in
paths separate from source files (and sometimes when the header
files are in the same directory as the source file). If you see an
error such as the following, you must define the path where the file
is located in the Path for Include Files text box:
Could not open source file myfile.h
Specify multiple paths by using comma delimiters.
Use Access Paths Panel for Include Paths
Select this checkbox to use access paths specified as user paths in the
Access Paths target settings panel instead of specifying them in the
Path for Include Files text box.
Processor
The Processor text field specifies the processor that you are
targeting.
Revision
Specify the revision of the processor you are working with in the
Revision text field. As revisions of silicon are available, changes
may be made to the software components that require knowing the
silicon revision.
Display Banner
Select this checkbox to cause the assembler to display banner
information. (This option has no effect on hosts where the signed
banner is not displayed by default.)
Preprocessor Definitions
The Preprocessor Definitions text box defines substitution strings
that will be used on all the following source lines. This option is
equivalent to the DEFINE directive. The string argument must be
ECM–42
StarCore DSP Targeting Manual
T a r g e t S e t t in g s
StarCore Environment
preceded by a blank space and enclosed in single quotes if it
contains embedded blanks.
Use a comma-delimited list to specify preprocessor options. For
example, "opt1, opt2" produces -D opt1 -D opt2 on the
command line.
Enable Message
Select this checkbox to cause the assembler to report assembly
progress (for example, the beginning of passes and the opening and
closing of input files) to the standard error output stream. This helps
you to ensure that assembly is proceeding normally.
Create List File
Select this checkbox to cause the assembler to create a listing file
called lstfil.lst.
Check All Possible Errors in Execution
Select this option to cause the assembler to check for additional
restrictions. Passes -s all to the assembler.
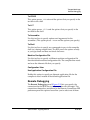
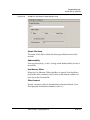
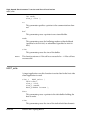
StarCore Environment
Use the StarCore Environment target settings panel to specify
endianness, memory mode, and whether to display generated
command lines in a message window. Figure 5.4 shows the
StarCore Environment target settings panel.
Figure 5.4
StarCore Environment Target Settings Panel
StarCore DSP Targeting Manual
ECM–43
T a rg e t Se t t in g s
StarCore Environment
Target Architecture
Select the architecture that you are programming for. Your choice
determines certain assembler, compiler, and linker settings. You
may select from SC110, SC140, SC140e, MSC8101, and MSC8102.
Big-Endian
Select this checkbox to run the application in an environment that
uses big-endian byte ordering (meaning that the most significant
bits reside in the lower address). Otherwise, the compiler generates
little-endian configurations.
If you enable this option, the command-line adapter passes the bigendian option to the compiler, assembler, and linker.
Big Memory Mode
Enable this option to use big memory mode for your application,
which is needed if your application does not fit into 64 KB of
memory space. In that case, the application must use 32-bit absolute
addresses.
The StarCore architecture instruction set supports both 16- and 32bit addresses. If the application is small enough to allow all static
data to fit into the lower 64KB of the address space, the compiler can
generate more efficient code. This mode (small memory mode) is
the default and requires that all addresses be 16 bits long.
Display generated command lines in message window
Enable this option to display the command line instructions as they
are passed to the build tools. The IDE displays the command lines in
the Errors and Warnings window.
Generate Relative Paths on Command-line When Possible
Enable this option to use relative paths in the compiler, linker and
assembler command lines. Paths to source files, object files, and
include paths will be relative to the project path. If this checkbox is
disabled, the generated command lines contain absolute paths.
ECM–44
StarCore DSP Targeting Manual
T a r g e t S e t t in g s
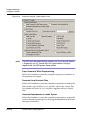
Enterprise Linker
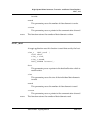
Enterprise Linker
The Enterprise Linker target settings panel passes the -Xlink
option to the linker for each option selected. Figure 5.5 shows the
Enterprise Linker target settings panel.
Figure 5.5
Enterprise Linker Target Settings Panel
The options in this panel are:
• Output file name
• Display All Errors and Warnings
• Map File
• Use Custom Start-Up File
• Dead Code Stripping
• Shared to Private Memory (8102 only)
• Additional Options
Output file name
Use this text box to specify the name of the object file to be created.
Use a .eld extension.
StarCore DSP Targeting Manual
ECM–45
T a rg e t Se t t in g s
DSP Linker
Display All Errors and Warnings
Select this checkbox to display all error messages and warnings.
Map File
Use this text box to create a linker map to a map file. Map files use
the .map extension.
Use Custom Start-Up File
Enable this option to specify that you wish to link a custom startup
file into your application instead of the default file. Enabling this
checkbox activates the text box in which you can specify the
filename and path of your custom startup file.
Dead Code Stripping
Enable this option to strip unreferenced symbols from your
application. This can reduce the memory footprint of your output
file.
Shared to Private Memory (8102 only)
Enable this option to allow calls from shared memory to private
memory. If this option is disabled, such calls generate error
messages.
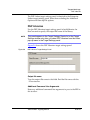
Additional Options
Use this text box to specify additional options and arguments for the
linker.
DSP Linker
Use the DSP Linker target settings panel to specify link options for
building StarCore applications with the Motorola DSP Linker.
NOTE
ECM–46
This panel appears in the Target Settings Panels list of the Target
Settings window only after you choose Motorola DSP Linker from
the Linker pop-up menu in the Target Settings panel.
StarCore DSP Targeting Manual
T a r g e t S e t t in g s
DSP Librarian
The DSP Linker target settings panel is identical to the Enterprise
Linker target settings panel, other than excluding the Additional
Options and Start-up File options.
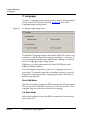
DSP Librarian
Use the DSP Librarian target settings panel to build libraries for
StarCore and to specify the output file name of the library.
NOTE
This panel appears in the Target Settings Panels list of the Target
Settings window only after you select DSP Librarian from the Linker
pop-up menu in the Target Settings panel.
Figure 5.6 shows the DSP Librarian target settings panel.
Figure 5.6
DSP Librarian Target Settings Panel
Output file name
Type the output file name in this field. End the file name with the
.elb extension.
Additional Command Line Arguments
Enter any additional command line arguments to pass to the IDE in
this text box.
StarCore DSP Targeting Manual
ECM–47
T a rg e t Se t t in g s
C Language
C Language
Use the C Language target settings panel to specify settings related
to the version of C that you are using. Figure 5.7 shows the C
Language target settings panel.
Figure 5.7
C Language Target Settings Panel
The default C language mode is the normal ANSI/ISO version with
extensions, with all source files using the standard .c extension. If
you are using the default mode, refrain from enabling any options
on the C Language target settings panel.
Otherwise, you must select either the Strict ANSI Mode or the
K&R/pcc Mode checkbox.
You can compile source files in only one C language version at a
given time. To compile source files in multiple versions, you must
compile the code sequentially, changing your choice of version in
between compilations.
Strict ANSI Mode
Select this checkbox to cause the IDE to assume that all input source
files use the strict ANSI/ISO version of C with no extensions. The
compiler flags any extensions found with warnings.
K & R/pcc Mode
Select this checkbox to cause the IDE to assume that you are using
this version of C.
ECM–48
StarCore DSP Targeting Manual
T a r g e t S e t t in g s
C Language
Type ‘char’ signed
Select this checkbox to cause the compiler to treat all char types as
signed char.
Type ‘char’ unsigned
Select this checkbox to cause the compiler to treat all char types as
unsigned char.
StarCore DSP Targeting Manual
ECM–49
T a rg e t Se t t in g s
Listing File Options
Listing File Options
You can use the Listing File Options target settings panel to specify
options for the assembler listing file or other assembler options in
the Additional Options text box.
NOTE
You can set additional assembler options in the Code & Language
Options target settings panel.
Figure 5.8 shows the Listing File Options target settings panel.
Figure 5.8
NOTE
Listing File Options Target Settings Panel
You also can use the OPT directive in an assembly source file,
specifying options in the operand field, separated by commas.
If you specify an assembler option in the Assembler Options target
settings panel, the option affects all assembly files in the current
target. To specify options only for particular files, use the OPT
directive in the assembly source file.
ECM–50
StarCore DSP Targeting Manual
T a r g e t S e t t in g s
Listing File Options
Fold Trailing Comment
Select this checkbox to cause the assembler to fold trailing
comments in the listing file.
Form Feed for Page Ejects
Select this checkbox to cause the assembler to create form feeds in
the listing file.
Format Messages
Select this checkbox to cause the assembler to format messages in
the listing file.
Pretty Print Listing
Select this checkbox to cause the assembler to format the listing file
for printing purposes.
Relative Comment Spacing
Select this checkbox to cause the assembler to force relative
comment spacing in the listing file.
Print DC Expansion
Select this checkbox to cause the assembler to print DC expansions
in the listing file.
Print Conditional Assembly Directive
Select this checkbox to cause the assembler to print conditional
assembly directives.
Generate Listing Headers
Select this checkbox to cause the assembler to generate listing
headers in the listing file.
Expand DEFINE Directive Strings
Select this checkbox to cause the assembler to expand DEFINE
directive strings in the listing file.
Print Macro Calls
Select this checkbox to cause the assembler to print macro calls.
StarCore DSP Targeting Manual
ECM–51
T a rg e t Se t t in g s
Code & Language Options
Print Macro Definitions
Select this checkbox to cause the assembler to print macro
definitions.
Print Macro Expansions
Select this checkbox to cause the assembler to print macro
expansions.
Print Memory Utilization Report
Select this checkbox to cause the assembler to generate a report with
load and runtime memory utilization information.
Print Conditional Assembly
Select this checkbox to cause the assembler to print conditional
assembly and section nesting levels information.
Flag Unresolved References
Select this checkbox to cause the assembler to generate a warning at
assembly time for each unresolved external reference. This option
works only in relocatable mode.
Print Skipped Conditional Assembly Lines
Select this checkbox to cause the assembler to refrain from printing
conditional assembly lines.
Display Warning Messages
Select this checkbox to cause the assembler to print all warning
messages.
Additional Options
You can type any valid command-line options for the assembler
into the Additional Options text box. The IDE passes the options to
the assembler.
Code & Language Options
Use the Code & Language Options target settings panel to control
the symbol options and assembler options for the StarCore
Assembler.
ECM–52
StarCore DSP Targeting Manual
T a r g e t S e t t in g s
Code & Language Options
Figure 5.9 shows the Code & Language Options target settings
panel.
Figure 5.9
Code & Language Options Target Settings Panel
Ignore Case in Symbol Names
Select this checkbox to cause the assembler to ignore the case of
symbol, section and macro names.
Write Symbols to Object File
Select this checkbox to cause the assembler to write symbol
information to an object file.
Enable Cycle Counts
Select this checkbox to enable the assembler cycle counter and clear
total cycle count features. The output listing for each instruction
shows cycle counts. Cycle counts assume a full instruction fetch
pipeline and no wait states.
Enable Checksumming
Select this checkbox to cause the assembler to allow checksumming
of instruction and data values and to clear the cumulative
StarCore DSP Targeting Manual
ECM–53
T a rg e t Se t t in g s
Code & Language Options
checksum. (You also can use the @CHK() function to obtain the
checksum value.)
Preserve Comment Lines in Macros
Select this checkbox to cause the assembler to preserve comment
lines of macros.
NOTE
Any comment line in a macro definition that starts with two
consecutive semicolons (;;) is never preserved in the macro
definition.
Continue Check Summing
Select this checkbox to cause the assembler to re-enable
checksumming of instructions and data. This option does not cause
the assembler to clear the cumulative checksum value.
Do Not Restrict Directives in Loops
Select this checkbox to cause the assembler to refrain from
restricting directives in DO loops. You can place directives in DO
loops, including some OPT directives, but this does not always make
sense and may be ignored by the assembler. This option suppresses
errors on particular directives in loops.
Make All Section Symbols Global
Select this checkbox to cause the same effect as explicitly declaring
every section GLOBAL. You must select this checkbox before
explicitly defining any sections in the source file.
Perform Interrupt Location Checks
Certain DSP instructions may not appear in the interrupt vector
locations in program memory. Select this checkbox to cause the
assembler to check for these instructions when the program counter
is in the interrupt vector bounds.
Expand Define Symbols in Strings
Select this checkbox to cause the assembler to expand DEFINE
symbols in quoted strings.
ECM–54
StarCore DSP Targeting Manual
T a r g e t S e t t in g s
Enterprise Compiler
Listing File Debug
Select this checkbox to cause the assembler to use the debug source
file instead of the assembly language source file. For this option to
be valid, you must select the Create List File checkbox to generate a
listing file that this option can use.
Scan MACLIB for Include Files
Select this checkbox to cause the assembler to scan the MACLIB
directory paths for include files in addition to the usual locations.
(Usually, the assembler searches for include files only in the
directory specified as the INCLUDE directory or in the paths given
by the Path For Include Files option.)
Pack Strings
Select this checkbox to cause the assembler to pack strings in the DC
directive. The assembler packs individual bytes in strings into
consecutive target words for the length of the string.
Preserve Object File on Errors
Normally, the assembler deletes any object file it produces if errors
occur during assembly. Select this checkbox to cause the assembler
to preserve these object files.
MACLIB File Path
Specify the pathname of a directory that contains macro definitions.
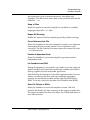
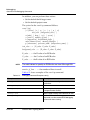
Enterprise Compiler
Use the Enterprise Compiler target settings panel to specify the
behavior of the compiler for events such as:
• Where the IDE stops processing files
• The level of warnings returned by the compiler
• Whether the compiler includes debugging information in the
output
• Other information that affects the format of object files
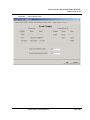
Figure 5.10 shows the Enterprise Compiler target settings panel.
StarCore DSP Targeting Manual
ECM–55
T a rg e t Se t t in g s
Enterprise Compiler
Figure 5.10
NOTE
Enterprise Compiler Target Settings Panel
The IDE uses the preprocessing options only if you choose Project
> Preprocess for a C source file in a Project window. During a
regular build, the IDE ignores these options.
Keep Comments While Preprocessing
Select this checkbox to cause the compiler to preserve comments in
the preprocessor output.
Generate List of #include Files
Select this checkbox to cause the compiler to generate an output file
that contains a list of all the include files used in the source. This
list includes all levels of include files, together with any nested
files.
Generate Dependencies in ‘make’ Syntax
Select this checkbox to cause the compiler to generate an output file
in MAKE format containing a list showing the dependencies between
the input source files.
ECM–56
StarCore DSP Targeting Manual
T a r g e t S e t t in g s
Enterprise Compiler
Stop After Front-End
Select this checkbox to cause the IDE to stop after processing the
input source files through the Front-End. You can use this option to
check that the files are valid source files that meet the essential
requirements for processing by the IDE (for example, that they
contain no syntax errors). This is useful when preparing files for
global optimization.
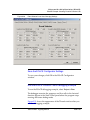
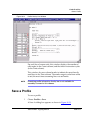
Read options from file
You can create command files containing options and arguments,
which the shell treats as if you included them on the command line.
Each time you invoke the compiler, you can select a command file
with the set of options that suit your requirements.
To specify a shell command file, locate the command file using the
Choose button to set the path of this file. Your command file must
have a .opt file extension.
The IDE does not check whether the options in a command file are
valid.
Keep Error Files
Select this checkbox to cause the IDE to create a file containing all
error messages generated during the compilation rather than
displaying the messages in the Errors and Warnings window. If this
option is not enabled, the IDE displays the error messages during
processing but does not keep them. The file has the same name as
the source file with a .err file extension.
Compact Grouping
Enable this option to let the compiler use multiple instruction line
pairing to display assembly output.
Call Tree File
Select this checkbox to cause the IDE to generate a postscript file
that contains information showing calls in graphical tree form,
which can be printed using a postscript printer.
StarCore DSP Targeting Manual
ECM–57
T a rg e t Se t t in g s
Enterprise Compiler
C List File
Select this checkbox to cause the IDE to generate a C list file that lists
the entire contents of the source file. The file has the same name as
the source file with a .lis file extension.
Quiet Mode
Select this checkbox to cause the IDE to display the minimum
amount of information (errors only). The IDE omits normal notices
and banners.
C List File with #includes
Select this checkbox to cause the compiler to generate a list file that
contains the entire contents of the source file and a list of include
files used by the source. The file has the same name as the source file
and the file extension .lis.
Display Command Lines
Select this checkbox to cause the IDE to display the specified
processing actions without executing them. You can use this option
before you invoke a build to check the actions the IDE will take,
based on the options selected in the target settings panels. This
option does not create object files or link.
C List File with Expansions
Select this checkbox to cause the compiler to create the C list file,
which lists the entire contents of the source file, with the addition of
expansions (such as macro expansions, line splices and trigraphs).
The list file name is the same as the source file with a .lis file
extension.
Verbose Mode
Select this checkbox to cause the IDE to display all the commands
and options being used as it proceeds through different processing
stages and invokes the individual tools. The exact information
output depends on the processing stages provided by the shell.
C List File Expansion & #include
Select this checkbox to cause the IDE to create a listing file that
includes the entire contents of the source file, a list of include files,
ECM–58
StarCore DSP Targeting Manual
T a r g e t S e t t in g s
Enterprise Compiler
and expansions (such as macro expansions, line splices and
trigraphs). The file has the same name as the source file with the file
extension .lis.
Keep .sl Files
Select this option to cause the compiler to not delete its assembly
language output files (.sl files).
Report All Warnings
Enable this option to let the compiler report all possible warnings.
Cross Reference Info File
Select this checkbox to cause the compiler to create a cross-reference
information file that provides details of cross-references in the
source file. The file name has the same name as the source file with a
.xrf file extension.
Position Independent Code
Select this checkbox to cause the compiler to generate positionindependent code.
Init Variables from ROM
During development you normally use a loader to set the values for
global variables and to load these initialized variables into RAM at
startup, together with the executable application.
After finishing development, if your final application does not use a
loader, you must ensure that when the completed application
executes, the initialized variables will be copied from ROM into
RAM. To do this, select this checkbox (Init Variables from ROM).
Struct Fd Offsets as EQUs
Select this checkbox to cause the compiler to create a file that
includes the details of C data structures in the output assembly file.
The output assembly file shows the offsets for all field definitions in
each data structure.
StarCore DSP Targeting Manual
ECM–59
T a rg e t Se t t in g s
I/O & Preprocessors
I/O & Preprocessors
Use the I/O & Preprocessors target settings panel to specify
additional directories for the IDE to search and to define and
undefine preprocessor macros.
Figure 5.11 shows the I/O Preprocessors target settings panel.
Figure 5.11
I/O & Preprocessors target settings panel
Additional Include Directory
Use this text box to add directories to the include file search path.
You can specify absolute or relative paths. Specify each path with a
comma delimiter.
Use Access Paths Panel for Include Paths
Select this checkbox to use access paths specified as user paths in the
Access Paths target settings panel instead of specifying them in the
Path for Include Files text box.
NOTE
ECM–60
On Windows hosts, the command-line limit is 32 kilobytes. If you
receive errors abut having too many include paths, you must
remove recursive paths from the Access Paths panel.
StarCore DSP Targeting Manual
T a r g e t S e t t in g s
I/O & Preprocessors
Define Preprocessor Macro
Use this text box to define a preprocessor macro with a specified
value. If you omit the value, the IDE assumes the value is 1. After
you define a preprocessor macro with this option, the shell passes it
to the preprocessor for all subsequent compilations until you
undefine it using the Undefine Preprocessor Macro option.
Specify multiple preprocessor macros using comma delimiters.
Undefine Preprocessor Macro
Use this text box to undefine a previously defined macro definition.
(After you undefine a macro, you must redefine it before using it
again.)
Specify multiple preprocessor macros using comma delimiters.
NOTE
The IDE processes any Undefine Preprocessor Macro options only
after processing all Define Preprocessor Macro options.
StarCore DSP Targeting Manual
ECM–61
T a rg e t Se t t in g s
Optimizations Target
Optimizations Target
You can use the Optimizations target settings panel to specify
several types of optimization. Figure 5.12 shows the Optimizations
target settings panel.
Figure 5.12
Optimizations Target Settings Panel
The optimizer can apply any of the optimizations in either global or
non-global optimization mode. You usually apply global
optimization at the end of the development cycle, after compiling
and optimizing all source files individually or in groups.
Smart Unrolling
This listbox lets you select the unrolling factor that determines
whether a loop should be unrolled.
Alignment
This list box lets you select the alignment level of the compiler.
Select from five levels:
• 0. Disable alignment
• 1. Align hardware loops
• 2. Align hardware and software loops
ECM–62
StarCore DSP Targeting Manual
T a r g e t S e t t in g s
Optimizations Target
• 3. Align all existing labels
• 4. Align all existing labels and subroutine return points
Modulo Addressing
Enable this checkbox to let the compiler to use modulo addressing.
NOTE
Typically, the number of MAC Units specified is four. However, if
you are compiling for a specific hardware configuration that
comprises less than four MAC units, you must specify the correct
number of units.
Optimizations
Specify one of several different levels of optimizations, as follows:
• Level 0 disables all optimizations and corresponds to the -O0
command-line compiler option.
• Level 1 enables the same optimizations as the -O1 commandline compiler option.
• Level 2 enables the same optimizations as the -O2 commandline compiler option.
• Level 3 performs the same optimizations as the -O3 commandline compiler option.
• Level 3 + Space performs the same optimizations as both the
Level 3 (-O3) and Space (-Os) optimizations.
• Space Optimization optimizes your code for size. In certain
cases, this may be at the expense of program speed, resulting in a
program that is small in size but executes more slowly than a
program without this optimization.
For a general description of the optimization levels, see the Details
area of the Optimizations target settings panel.
NOTE
You can select the Global Optimization checkbox with any of the
preceding optimization levels except Level 0.
Global Optimization
Select this checkbox to apply optimizations across all the files in the
application (the most effective method of optimization). (The
StarCore DSP Targeting Manual
ECM–63
T a rg e t Se t t in g s
Passthrough, Hardware
command line adaptor passes the -cfe option to the compiler and -Og to the shell during the link phase after you select this
checkbox.)
If this option is enabled, the compiler creates object files with the
.obj file extension.
NOTE
When you apply global optimization, the IDE applies a value of -1 for
code size and data size to a file that is globally optimized rather than
reporting the code and data size in the Project window.
Passthrough, Hardware
Use the Passthrough, Hardware target settings panel to specify
options and arguments to pass to specified tools components.
Figure 5.13 shows the Passthrough, Hardware target settings panel.
Figure 5.13
Passthrough, Hardware Target Settings Panel
To Front-End
This option passes -Xcfe and the options that you specify in the
text field to the shell.
ECM–64
StarCore DSP Targeting Manual
T a r g e t S e t t in g s
Remote Debugging
To ICODE
This option passes -Xicode and the options that you specify in the
text box to the shell.
To LLT
This option passes -Xllt and the options that you specify in the
text field to the shell.
To Assembler
Use this text box to specify options and arguments for the
assembler. (This option passes -Xasm and the options you specify.)
To Shell
Use this text box to specify any commands to pass to the compiler
shell (scc) during compile time. The IDE passes the options exactly
as you type them and does not check for errors.
Machine Configuration File
Use this text box to specify a different machine configuration file
than the default machine configuration file. The compiler then reads
and uses the alternate file that you specify.
Configuration View
Use Application Configuration File
Enable this option to specify an alternate application file for the
compiler to read. instead of the default application file.
Remote Debugging
The Remote Debugging panel (Figure 5.13)lets you specify the
connection that the IDE uses to communicate with the target. The
connections themselves are defined in the Remote Connections IDE
preference panel-the options here allow you to select one of them.
StarCore DSP Targeting Manual
ECM–65
T a rg e t Se t t in g s
Remote Debugging
Figure 5.14
Remote Debugging panel
Connection
This list box lets you select the connection for this target from the list
of available remote connections.
Edit Connection
This button lets you edit the definition of the currently selected
remote connection. It is provided as a shortcut, and performs the
same function as selecting Edit > Preferences > Debugger >
Remote Connections > Change from the main menu bar.
Changing the definition of a remote connection changes the
definition universally. If you wish to edit the connection for this
target only, you should create a new connection for this target in the
Remote Connections IDE Preferences panel.
Remote Download Path
This text box lets you specify the path you wish to use for
downloading files.
Launch Remote Host Application
Enable this option to launch an application on the remote computer
to server as ahost application.
ECM–66
StarCore DSP Targeting Manual
T a r g e t S e t t in g s
SC100 Debugger Target
Multi-Core Debugging
Enable this option if you are debugging multiple cores.
Core Index
This text box lets you specify the core index ID of the target core.
This option is only available if the Multi-Core Debugging option is
enabled.
JTAG Clock Speed
This text box lets you specify the clock speed in MHz of your JTAG
connection.
SC100 Debugger Target
Use the SC100 Debugger Target panel to set communications
protocols for SC100 targets.
Figure 5.15 shows the SC100 Debugger Target panel.
Figure 5.15
SC100 Debugger Target Panel
You can use the CodeWarrior debugger to launch StarCore
applications in the CodeWarrior IDE. You can choose to run the
StarCore DSP Targeting Manual
ECM–67
T a rg e t Se t t in g s
SC100 Debugger Target
CodeWarrior debugger either with a simulator or by downloading
application code to a hardware board and then debugging the code
while it runs on the board.
Target
Choose either a simulator or the name of the target hardware.
Reset on Connect
Select this checkbox to cause the CodeWarrior IDE to issue a reset to
the target board each time you download the program for
debugging.
Do Not Reset PC
Enable this option to preserve the program counter if you restart a
debug session.
Load Symbolics Only
Select this checkbox to cause the IDE not to download code to the
target board. (The IDE assumes the code is already there.)
This option is useful if you are debugging a program in ROM. In
addition, this option is useful so that you do not have to repeatedly
download the same program in multiple, consecutive debugging
sessions.
Invalidate Cache-Line Before Execution
Enable this option if you intend to debug code on the MSC8102 or
any other target with an instruction cache. This option only appears
if the target is set to MSC8102.
Use Optimized Code Debugger
Enable this option to debug optimized code. See Optimized Code
Debugging for more information.
Use Target Window for Console I/O
Enable this option to open a console window specifically for this
target. If this option is not enabled, the IDE handles all console
functions within a general console window.
ECM–68
StarCore DSP Targeting Manual
T a r g e t S e t t in g s
SC100 Debugger Target
Enable ICache Performance Tool
Enable this option if you wish to use the ICache Performance Tool to
analyze an MSC8102 or MSC8102 simulator target. This option only
appears if the target is set to MSC8102 or MSC8102 simulator, and is
mutually exclusive to the Launch Profiler option.
Use Initialization File
Specify the name of the initialization file. The initialization file is a
text file that tells the debugger how to initialize the hardware after
reset but before downloading code. Use the initialization file
commands to write values to various registers, core registers, and
memory locations.
Launch Profiler
Select this checkbox to launch the profiler when you start
debugging. If you are debugging multiple targets, select this
checkbox for each target to profile.
This option and the Enable ICache Performance Tool option are
mutually exclusive.
SYPCR Register Value
Use the SYPCR Register Value text box to set a value for the
MSC8101 SYPCR register. This option is only available if you set the
target to MSC8101. A value of 0xFBC3000 disables the watchdog
timer.
Include Instruction-Level Report
Select this checkbox to cause the profiler to produce an instructionlevel report that contains counting and parallelism information.
NOTE
Selecting this checkbox increases profiler execution time.
Kernel Awareness
Select the RTOS (real-time operating system) that you are using, or
select None if you are not using an RTOS.
StarCore DSP Targeting Manual
ECM–69
T a rg e t Se t t in g s
SC100 ELF Dump
SC100 ELF Dump
Use the SC100 ELF Dump target settings panel to set parameters for
the ELF file dump utility.
Figure 5.16 shows the SC100 ELF Dump target settings panel.
Figure 5.16
SC100 ELF Dump Target Settings Panel
Output File Name
Specify the name of the ELF dump file in this text field.
Disassembled Section Contents
This option dumps the disassembled section contents to the
specified output file.
String Table
This option dumps the string table to the specified output file.
File Header
This option dumps the file header to the specified output file.
Section Headers
This option dumps the section headers to the specified output file.
Section Header String Table
This option dumps the section header string table to the specified
output file.
ECM–70
StarCore DSP Targeting Manual
T a r g e t S e t t in g s
SC100 ELF Dump
Program Header
This option dumps the program header to the specified output file.
Section Contents
This option dumps the section contents to the specified output file.
Symbol Table
This option dumps the symbol table to the specified output file.
Dump Symbolically
This option dumps the ELF file symbolically.
DWARF Info
This option dumps the DWARF debugging information to the
specified output file.
StarCore DSP Targeting Manual
ECM–71
T a rg e t Se t t in g s
SC100 ELF to LOD
SC100 ELF to LOD
Use the SC100 ELF to LOD target settings panel to specify the
output file for the elflod utility.
Figure 5.17 shows the SC100 ELF to LOD target settings panel.
Figure 5.17
SC100 ELF to LOD Target Settings Panel
Output File Name
Specify the name of the file to which you want the ELF to LOD postlinker to write the LOD records.
The ELF to LOD post-linker (also known as elflod) writes the
information from the ELF file into a specially formatted ASCII file
called a LOD file. Listing 5.1 shows the format of the LOD file.
Listing 5.1
Format of the LOD file
_START Module_ID Version Rev# Device# Asm_Version Comment
_END Entry_point_address
_DATA Memory_space Address Code_or_Data
_BLOCKDATA Memory_space Address Count Value
_SYMBOL Memory_space Symbol_Address ...
_COMMENT Comment
SC100 ELF to S-Record
Use the SC100 ELF to S-Record target settings panel to specify the
parameters for the elfsrec utility.
Figure 5.18 shows the SC100 ELF to S-Record target settings panel.
ECM–72
StarCore DSP Targeting Manual
T a r g e t S e t t in g s
SC100 ELF to S-Record
Figure 5.18
SC100 ELF to S-Record Target Settings Panel
Output File Name
The name of the file to which the elfsrec post-linker writes the Srecords.
Addressability
You can choose byte-, word-, or long-word-addressability for the Srecord file.
Use Memory Offset
Select the Use Memory Offset checkbox to specify that the elfsrec
post-linker adds a memory offset value to the memory address of
each line in the S-record file.
Offset Amount
Specify a memory offset in hexadecimal or decimal format. (You
must precede hexadecimal numbers with 0x.)
StarCore DSP Targeting Manual
ECM–73
T a rg e t Se t t in g s
SC100 ELF to S-Record
ECM–74
StarCore DSP Targeting Manual
6
Debugging
This chapter describes the StarCore-specific features that are
available to you while debugging your code. The standard features
of the CodeWarrior debugger are described in the IDE User Guide.
This chapter contains the following topics:
• Stack Crawl Depth
• Register Windows
• Register Details Window
• Tips for Debugging Assembly Code
• Cycle Counter in the Simulator
• Loading a .eld File without a Project
• System-Level Connect
• Initialization File
• Kernel Awareness
• Command-Line Debugging
• Load Save Fill Memory
• Load Save Registers
Stack Crawl Depth
The maximum depth of the stack crawl is 26 stack frames.
Register Windows
Choose View > Register Windows to view the selections for
available StarCore registers.
The registers are presented in a tree format. To edit a value, doubleclick on a register value and enter the value you want (in
hexadecimal notation).
StarCore DSP Targeting Manual
ECM–75
D e b u gg i ng
Register Details Window
Register Details Window
You can use the Register Details window to view StarCore registers
and see descriptions of them.
XML files contain the register descriptions.
The XML register description files reside in the following path:
Windows
Solaris
CodeWarrior_dir\bin\Plugins\support\Registers
install_dir/CodeWarrior_ver_dir/CodeWarrior_IDE/
CodeWarrior_Plugins/support/Registers
By default, the CodeWarrior IDE searches all folders in the
preceding directory when searching for a register description file.
Register description files must end with the extension .xml.
The minimum resolution of bitfield descriptions is limited to two
bits. Consequently, the Register Details window cannot display
single-bit overflow registers.
The maximum resolution of bitfield descriptions is 32 bits. Because
the data registers (D0-D15) are 40 bits wide, you cannot view all the
bits in a data register simultaneously. Instead, you must view
groups of bits—high, low, and extended. For example, to view the
bits of the D0 register, use the following XML register description
files:
• D0.E
• D0.L
• D0.H
View Register Descriptions
To see registers and register descriptions:
1
Choose View > Register Details (Windows operating system) or
View > Register Details Window (Solaris operating system) to
view the Register Details window.
The IDE displays the Register Details window as shown in Figure
6.1.
ECM–76
StarCore DSP Targeting Manual
D ebug ging
Register Details Window
Figure 6.1
2
NOTE
Register Details Window
In the Description File text box, type the name of the register to
view. (Alternatively, you can use the Browse button to locate the
register description files.)
Some registers have multiple modes (meaning that the bits of the
register can have multiple meanings depending on the mode the
register is in). If the register you are examining has multiple
modes, browse the register description files to find the correct file
for the register and mode that you are examining.
For example, the ORx registers have multiple modes. The register
description files for these registers have an underscore followed
by a group of letters that indicate the mode, as follows:
ORx_GCPM
ORx_UPM
ORx_SDRAM
(The x is a number between 0 and 11, excluding 8 and 9.)
Similarly, other multi-mode registers have description files that use
an underscore followed by an appropriate suffix.
The Register Details window displays the applicable register values
and descriptions.
StarCore DSP Targeting Manual
ECM–77
D e b u gg i ng
Tips for Debugging Assembly Code
NOTE
You can change the format in which the CodeWarrior IDE displays
the registers by using the Format pop-up menu. You also can
change the text information that the CodeWarrior IDE displays by
using the Text View pop-up menu.
Tips for Debugging Assembly Code
When you set a breakpoint in assembly source code, the source
pane of the Thread window does not show the source code
preceding the last breakpoint reached. You must change the value
of the program counter (which changes the location that the IDE
displays in the program) to view that source code.
NOTE
Ensure that the address value that you enter is less than that of the
current location when you change the program counter value.
(Alternatively, you can view assembly sources in the memory
window.)
Change the Program Counter Value
To change the program counter value:
1
Choose Debug > Change Program Counter.
The Change Program Counter dialog box appears.
2
Enter an address (in hexadecimal notation).
The Source pane in the Thread window updates with the program
counter at the specified location.
ECM–78
StarCore DSP Targeting Manual
D ebug ging
Cycle Counter in the Simulator
Cycle Counter in the Simulator
The SC100 menu contains items that enable you to get the
cumulative machine cycle count and the machine instruction count
when using the simulator for debugging.
Table 6.1 lists and describes the commands in the SC100 menu.
Table 6.1
SC100 Menu Commands
Menu Command
Description
Get Simulator Statistics
Displays the current machine cycle count and machine
instruction count in an alert box.
Reset Machine Cycle Count
Resets the machine cycle count to zero.
Reset Machine Instruction Count
Resets the current machine instruction count to zero.
Due to the nature of the simulator, cycle counting is accurate only
when executing continuously (rather than single-stepping through
instructions). The cycle counter is more useful for profiling than
interactive use.
The following process describes how to determine the number of
machine cycles the simulator uses to execute a chosen algorithm:
1. Set a breakpoint before the beginning of a particular
algorithm.
2. Set a breakpoint after the end of the same algorithm.
3. Execute the program to the first breakpoint.
4. Reset the machine cycle count.
5. Execute the program to the second breakpoint.
6. Get the machine cycle count.
StarCore DSP Targeting Manual
ECM–79
D e b u gg i ng
Loading a .eld File without a Project
Loading a .eld File without a Project
You can load and debug a .eld file without an associated project.
To load a .eld file for debugging without an associated project:
1
Launch the CodeWarrior IDE.
2
Choose File > Open and specify the file to load in the standard
dialog box that appears.
Alternatively, you can drag and drop a .eld file onto the IDE.
3
NOTE
4
NOTE
Choose the appropriate debugging target from the Target pop-up
menu in the SC100 Debugger Target panel.
If your source code files reside in a different directory than the .eld
file, specify the paths to the source code files in the Access Paths
target settings panel.
Choose Project > Debug to begin debugging the application.
When you debug a .eld file without a project, the IDE sets the
Build before running setting on the Build Settings panel of the
IDE Preference panels to Never.
Consequently, if you open another project to debug after
debugging a .eld file, you must change the Build before
running setting before you can build the project.
ECM–80
StarCore DSP Targeting Manual
D ebug ging
System-Level Connect
System-Level Connect
You can use the CodeWarrior debugger to perform a system-level
connect to a target board, either before or after downloading a
program to a target board. After you connect to the target board,
you can examine system registers and memory.
Perform a System-Level Connect
You can perform a system-level connect (by choosing Debug >
Connect) anytime you have a Project window open and your target
board is correctly connected.
The following steps describe how to connect in the context of
developing and debugging code on a target board.
To perform a system-level connect:
1
Use the CodeWarrior debugger to download a program to the
target board.
2
Choose Project > Run to run the program from the first breakpoint.
(By default, the debugger sets a temporary breakpoint on the main
function at program launch.)
3
Choose Debug > Kill.
The debugger stops running.
4
Ensure that the Project window for the program you downloaded is
selected.
5
Choose Debug > Connect.
The debugger connects to the board.
You now can examine registers and the contents of memory on the
board.
StarCore DSP Targeting Manual
ECM–81
D e b u gg i ng
Initialization File
Initialization File
The initialization file is a text file that tells the debugger how to
initialize the hardware after reset but before downloading code. Use
the initialization file commands to write values to various registers,
core registers, and memory locations.
You must select the Use Initialization File checkbox and specify the
name of the initialization file in the SC100 Debugger Target panel.
• Example Initialization File
• Customizing an Initialization File and JTAG Initialization File
for 8101 Hardware
• Setting the IMMR Value
• Initialization File Commands
Example Initialization File
Listing 6.1 shows part of an 8101 initialization file named
8101_Initialization.cfg, which resides in the following
directory:
Windows
CodeWarrior_dir\StarCore_Support\
Initialization_Files\RegisterConfigFiles
Solaris
install_dir/CodeWarrior_ver_dir/starcore_support/
Initialization_Files/RegisterConfigFiles
You can customize the contents of 8101_Initialization.cfg if
needed.
Listing 6.1
Excerpt from an 8101 Initialization File
#--------------------------------------------------------------# 8101 Initialization File
#--------------------------------------------------------------writeAllmem16 0xf0010006 0xfbc3
#SYPCR
writemmr16 IMMR 0x1470
writemmr32 BCR 0x00800000
ECM–82
StarCore DSP Targeting Manual
D ebug ging
Customizing an Initialization File and JTAG Initialization File for 8101 Hardware
...
Customizing an Initialization File and JTAG
Initialization File for 8101 Hardware
Two files define labels for 8101 registers. One uses ordinary data
structures (MMapQ001.h); the other uses packed data structures
(msc8101.h). You can customize either of the files if needed.
If you are using 8101 hardware, include either MMapQ001.h or
msc8101.h in your project. (Alternatively, you can include a
customized version of either file, if you previously created one.)
For Windows, MMapQ001.h resides in the following directory:
CodeWarrior_dir\StarCore_Support\flash_programmer_support
For the Solaris operating system, MMapQ001.h resides in the
following directory:
install_dir/CodeWarrior_ver_dir/starcore_support/flash_programmer_support
For Windows, msc8101.h resides in the following directory:
CodeWarrior_dir\Stationery\StarCore\Msc8101\C_Source_Big_Endian
For the Solaris operating system, msc8101.h resides in the
following directory:
install_dir/CodeWarrior_ver_dir/CodeWarrior_IDE/(Project Stationery)/
MSC8101/C_Source_Big_Endian
Setting the IMMR Value
The IMMR register holds the base address for PPC-bus memorymapped registers. You can write to memory-mapped registers by
using either the register name or by referring to the address of the
register.
StarCore DSP Targeting Manual
ECM–83
D e b u gg i ng
Initialization File Commands
The debugger uses the value of the IMMR to determine the address
of other PPC-bus memory-mapped registers.
The debugger is aware of a change in the IMMR register only if you
write to the IMMR register in the initialization file by name (not by
address).
If you initialize the IMMR by address, the debugger behaves as if
you left the IMMR unchanged. In that case, the debugger uses the
default reset value for the IMMR register (0xF0000000) as the base
address for PPC-bus memory-mapped registers when performing
all other reads and writes to those registers.
(The only exception is if you previously changed the value of the
IMMR register by name.)
Initialization File Commands
Several initialization file commands exist that allow you to:
• Write to a register or memory location of a group of devices in
the JTAG chain (all devices in the chain not previously masked
out using the writeAllMask command)
• Write to a register or memory location of a specified device in
the JTAG chain
• Write to a register or memory location of a default device
(specified in the SC100 Debugger Target panel of the current
project) in the JTAG device chain
writeAllMask
This initialization file command masks certain devices in a JTAG
chain so that the following commands do not write to them:
• writeAllmmr32
• writeAllmem32
• writeAllmmr16
• writeAllmem16
• writeAllmmr40
• writeAllmmr8
• writeAllmmr64
• writeAllmem8
ECM–84
StarCore DSP Targeting Manual
D ebug ging
Initialization File Commands
The syntax of the command follows:
writeAllMask mask_value
For mask_value, specify a 32-bit value that indicates which JTAG
devices to omit writing to.
Table 6.2 lists example mask values and which JTAG devices they
mask.
Table 6.2
Example Mask Values
Mask Value
JTAG Devices Masked
0x00000001
0
0x00000002
1
0x00000003
0 and 1
0x00000004
2
0x00000005
2 and 0
0x00000006
2 and 3
0x00000007
3, 2 and 1
(and so on)
writeAllmem8
This initialization file command writes 8 bits to a specified memory
location on all devices on the JTAG chain (except those previously
masked by the writeAllMask command).
The syntax of the command follows:
writeAllmem8 memory_location value
Specify value as a decimal or hexadecimal value.
writeAllmem16
This initialization file command writes 16 bits to a specified
memory location on all devices on the JTAG chain (except those
previously masked by the writeAllMask command).
The syntax of the command follows:
writeAllmem16 memory_location value
Specify value as a decimal or hexadecimal value.
StarCore DSP Targeting Manual
ECM–85
D e b u gg i ng
Initialization File Commands
writeAllmem32
This initialization file command writes 32 bits to a specified
memory location on all devices on the JTAG chain (except those
previously masked by the writeAllMask command).
The syntax of the command follows:
writeAllmem32 memory_location value
Specify value as a decimal or hexadecimal value.
writeAllmem64
This initialization file command writes 64 bits to a specified
memory location on all devices on the JTAG chain (except those
previously masked by the writeAllMask command).
The syntax of the command follows:
writeAllmem64 memory_location value
Specify value as a decimal or hexadecimal value.
writeAllmmr8
This initialization file command writes to a specified 8-bit memorymapped register on all devices on the JTAG chain (except those
previously masked by the writeAllMask command).
The syntax of the command follows:
writeAllmmr8 memory_mapped_register value
Specify value as a decimal or hexadecimal value.
writeAllmmr16
This initialization file command writes to a specified 16-bit
memory-mapped register on all devices on the JTAG chain (except
those previously masked by the writeAllMask command).
The syntax of the command follows:
writeAllmmr16 memory_mapped_register value
Specify value as a decimal or hexadecimal value.
ECM–86
StarCore DSP Targeting Manual
D ebug ging
Initialization File Commands
writeAllmmr32
This initialization file command writes to a specified 32-bit
memory-mapped register on all devices on the JTAG chain (except
those previously masked by the writeAllMask command).
The syntax of the command follows:
writeAllmmr32 memory_mapped_register value
Specify value as a decimal or hexadecimal value.
writeAllmmr40
This initialization file command writes to a specified 40-bit
memory-mapped register on all devices on the JTAG chain (except
those previously masked by the writeAllMask command).
The syntax of the command follows:
writeAllmmr40 memory_mapped_register value
Specify value as a decimal or hexadecimal value.
writeAllmmr64
This initialization file command writes to a specified 64-bit
memory-mapped register on all devices on the JTAG chain (except
those previously masked by the writeAllMask command).
The syntax of the command follows:
writeAllmmr64 memory_mapped_register value
Specify value as a decimal or hexadecimal value.
writeDevicemem8
This initialization file command writes 8 bits to a specified memory
location of a specified device on the JTAG chain.
The syntax of the command follows:
writeDevicemem8 JTAG_index memory_location value
Specify value as a decimal or hexadecimal value.
StarCore DSP Targeting Manual
ECM–87
D e b u gg i ng
Initialization File Commands
writeDevicemem16
This initialization file command writes 16 bits to a specified
memory location of a specified device on the JTAG chain.
The syntax of the command follows:
writeDevicemem16 JTAG_index memory_location value
Specify value as a decimal or hexadecimal value.
writeDevicemem32
This initialization file command writes 32 bits to a specified
memory location of a specified device on the JTAG chain.
The syntax of the command follows:
writeDevicemem32 JTAG_index memory_location value
Specify value as a decimal or hexadecimal value.
writeDevicemem64
This initialization file command writes 64 bits to a specified
memory location of a specified device on the JTAG chain.
The syntax of the command follows:
writeDevicemem64 JTAG_index memory_location value
Specify value as a decimal or hexadecimal value.
writemem8
This initialization file command writes 8 bits to memory.
The syntax of the command follows:
writemem8 memory_location value
Specify value as a decimal or hexadecimal value.
writemem16
This initialization file command writes 16 bits to memory.
The syntax of the command follows:
writemem16 memory_location value
ECM–88
StarCore DSP Targeting Manual
D ebug ging
Initialization File Commands
Specify value as a decimal or hexadecimal value.
writemem32
This initialization file command writes 32 bits to memory.
The syntax of the command follows:
writemem32 memory_location value
Specify value as a decimal or hexadecimal value.
writemem64
This initialization file command writes 64 bits to memory.
The syntax of the command follows:
writemem64 memory_location value
Specify value as a decimal or hexadecimal value.
writemmr8
This initialization file command writes to an 8-bit memory-mapped
register.
The syntax of the command follows:
writemmr8 memory_mapped_register value
Specify value as a decimal or hexadecimal value.
writemmr16
This initialization file command writes to a 16-bit memory-mapped
register.
The syntax of the command follows:
writemmr16 memory_mapped_register value
Specify value as a decimal or hexadecimal value.
writemmr32
This initialization file command writes to a 32-bit memory-mapped
register.
The syntax of the command follows:
StarCore DSP Targeting Manual
ECM–89
D e b u gg i ng
Initialization File Commands
writemmr32 memory_mapped_register value
Specify value as a decimal or hexadecimal value.
writemmr64
This initialization file command writes to a 64-bit memory-mapped
register.
The syntax of the command follows:
writemmr64 memory_mapped_register value
Specify value as a decimal or hexadecimal value.
writereg8
This initialization file command writes to an 8-bit core register.
The syntax of the command follows:
writereg8 core_register value
Specify value as a decimal or hexadecimal value.
writereg16
This initialization file command writes to a 16-bit core register.
The syntax of the command follows:
writereg16 core_register value
Specify value as a decimal or hexadecimal value.
writereg32
This initialization file command writes to a 32-bit core register.
The syntax of the command follows:
writereg32 core_register value
Specify value as a decimal or hexadecimal value.
writereg40
This initialization file command writes to a 40-bit core register.
The syntax of the command follows:
ECM–90
StarCore DSP Targeting Manual
D ebug ging
Kernel Awareness
writereg40 core_register value
Specify value as a decimal or hexadecimal value.
Kernel Awareness
You can indicate that you are using a supported real-time operating
system (RTOS) by selecting the RTOS on the Kernel Awareness popup menu of the SC100 Debugger Target panel.
If you are not using an RTOS, set the Kernel Awareness pop-up
menu to None.
When you debug an application using the Enea OSE RTOS, the IDE
displays a menu called OSE. This menu has one option, Task Info.
When you select Task Info from the OSE menu, the Tasks window
(Figure 6.2) displays information about all the running tasks.
Figure 6.2
Tasks Window
Clicking a task name in the left pane of the Tasks window selects a
task and causes the right pane of the window to display information
relevant to the currently selected task.
Table 6.3 shows the Tasks window descriptors.
Table 6.3
Tasks Window Descriptors
Label
Description
Name
The name of the task.
Status
The current status of the task (for example, Ready,
Running, or Stopped).
StarCore DSP Targeting Manual
ECM–91
D e b u gg i ng
Command-Line Debugging
Table 6.3
Tasks Window Descriptors
Label
Description
mwThreadID
The ID number assigned to the task thread.
Priority
An integer value that indicates the priority for running a
task.
Type
The type of the task. The possible values follow:
• Prio — prioritized task
• Bkgr — background task
• Int — interrupt task
• Time — timer interrupt task
• Phan — phantom task
• Kill — previously killed task
• Illg — Invalid (illegal) task
• Idle — idle task
Command-Line Debugging
In addition to using the regular CodeWarrior IDE debugger
windows, you also can debug on the command-line. When you
debug on the command-line, you can use:
• Commands included in the Tcl script language
• Additional debugging commands that are specific to the
debugger
Tcl Support
This section describes how the command-line debugger handles Tcl
support.
Automatically resolving clashing commands
Several command-line debugging commands clash with built-in Tcl
commands. The command-line debugger resolves them as shown in
Table 6.4 when the mode is set to auto.
ECM–92
StarCore DSP Targeting Manual
D ebug ging
Tcl Support
Table 6.4
Resolving Clashing Commands
Command
Resolution
load
When you enter the command with one argument containing
.eld or .mcp, the command-line debugger loads the
project. Otherwise, the debugger calls the Tcl load
command.
break
When you enter the command with no argument and in a
script file, the command-line debugger calls the built-in Tcl
break command. Otherwise, the debugger uses the break
command to control breakpoints.
close
When you enter the close command with no argument, the
command-line debugger closes the current debugging
session. Otherwise, the debugger calls the built-in Tcl close
command.
Tcl support for executing script files
Tcl usually executes a script file as one large block; Tcl returns only
after the entire file executes. However, the run debugging
command executes script files line by line. If a particular line is not a
complete Tcl command, the run command appends the next line
until it gets a complete Tcl script block.
For example, the Tcl source command executes the script in
Listing 6.2 as one block, but the run debugging command executes
it as two blocks: the set statement and the while loop.
Listing 6.2
Example Tcl Script
set x 0;
while {$x < 5}
{
puts "x is $x";
set x [expr $x + 1]
}
NOTE
The run debugging command synchronizes the debug events
between blocks in a script file. For example, after a go, next, or
step debugging command, run polls the debugging thread state
StarCore DSP Targeting Manual
ECM–93
D e b u gg i ng
Command-Line Debugging Tasks
and refrains from executing the next line or block until the
debugging thread stops.
However, the Tcl source command does not consider the state of
the debugging thread. Consequently, use the run debugging
command to execute script files that contain these debugging
commands: debug, go, next, stop, and kill.
Tcl support for using a start-up script
You can use a start-up script with the command-line debugger.
(You can specify command-line debugger commands in the script.
For example, you might want to set an alias or a color
configuration.)
Name the start-up script tcld.tcl. The command-line debugger
executes the start-up script the first time you open the commandline debugger window, provided that the file is in the correct
directory for the host platform you are using:
• For Windows, place tcld.tcl in the Windows NT installed
directory.
• For Solaris, place tcld.tcl in your home directory.
NOTE
There is no synchronization of debug events in the startup script.
Consequently, add the run debugging command to the startup
script and place the following debugging commands in another
script to execute them: debug, go, stop, kill, next, and step.
Command-Line Debugging Tasks
This section describes some tasks for command-line debugging.
Open a Command-Line Debugging Window
To open a command-line debugging window, choose Debug >
Command Line Debugger.
When the debugging window opens, it displays several command
hints.
ECM–94
StarCore DSP Targeting Manual
D ebug ging
Command-Line Debugging Tasks
Enter a Single Command-Line Debugging Command
To enter a single debugging command:
1
Type a command (or its shortcut followed by a space) on the
command line.
(For example, the shortcut for the break command is b.)
2
If needed, type any options, separating them from the command
and each other with spaces.
3
Press Enter.
Enter Multiple Command-Line Debugging Commands
To enter multiple debugging commands:
1
Decide which commands (Tcl and debugger-specific) to use.
2
Type the commands into a file.
3
Save the file with a .tcl extension to indicate that it is a Tcl script.
4
Enter the run command to run the script.
View Debugging Command Hints
You can view debugging command hints as follows:
• To view the hint for a particular debugger-specific command,
type the command followed by a space.
The hint shows the syntax for the remainder of the
command.
• To view hints for all debugger-specific commands that you can
use on the command line, press the space bar when the cursor is
at the start of the command line in the debugging window.
StarCore DSP Targeting Manual
ECM–95
D e b u gg i ng
Command-Line Debugging Tasks
Each hint highlights the minimum number of characters (shortcut)
that you must type for the debugger to recognize the command.
(Press the space bar after typing a shortcut for a command to
complete the command automatically.)
Repeat a Command-Line Debugging Command
To reexecute a debugging command in the command-line
debugging window:
1
Type the debugging command and press Enter.
This executes the command the first time.
2
Press Enter again.
This executes the same command again.
Alternatively, type an exclamation point (!) followed by the ID
number of the command and press Enter.
NOTE
To see the ID numbers of commands, execute the history
debugging command.
Review Previously Entered Commands
To sequentially review previously entered commands, press the
Up-Arrow and Down-Arrow keys.
Clear a Command from the Command Line
To clear a command from the command line that you have typed
but not yet executed, press the Escape key.
ECM–96
StarCore DSP Targeting Manual
D ebug ging
Command-Line Debugging Tasks
Stop an Executing Script
To stop a script that is executing, press the Escape key.
Switch between Insert and Overwrite Mode
To switch between insert and overwrite mode when entering
commands on the command line, press the Insert key.
Scroll Text in the Command-Line Debugging Window
The scrolling line number can be set by the config debugging
command.
To scroll text in the command-line debugging window:
• To scroll up one screenful of text, press the Page Up key.
• To scroll down one screenful of text, press the Page Down key.
NOTE
By default, the number of lines scrolled by the Page Up and Page
Down keys is the number of lines displayed in the debugging
window. If you resize the window, the number of lines scrolled
changes accordingly.
You also can use the debugger-specific config command to
change the number of lines scrolled by the Page Up and Page
Down keys.
• To scroll up one line of text, press Ctrl-Up-Arrow key.
• To scroll down one line of text, press Ctrl-Down-Arrow key.
• To scroll left one column, press Ctrl-Left-Arrow key.
• To scroll right one column, press Ctrl-Right-Arrow key.
• To scroll to the beginning of the displayed buffer, press CtrlHome.
• To scroll to the end of the displayed buffer, press Ctrl-End.
StarCore DSP Targeting Manual
ECM–97
D e b u gg i ng
Command-Line Debugging Commands
Copy Text from the Command-Line Debugging Window
To copy text from the window to the clipboard:
1
Drag your mouse over the text to copy.
2
Press Enter or choose Edit > Copy.
Paste Text into the Command-Line Debugging Window
To paste text from the clipboard into the window:
1
Place the mouse cursor on the command line.
2
Click the right mouse button or choose Edit > Paste.
Command-Line Debugging Commands
This section describes the command-line debugging commands.
alias
Use the alias debugging command to:
• Create a pseudonym for a debugging command
• Remove a pseudonym for a debugging command
• List all currently defined aliases
The syntax for the alias command follows:
al[ias] [alias_name] [alias_definition]
Table 6.5 shows examples of the alias command.
ECM–98
StarCore DSP Targeting Manual
D ebug ging
Command-Line Debugging Commands
Table 6.5
Debugging Command Examples: alias
Example
Description
alias .. cd ..
This example creates a command
named .. to go to the parent
directory.
alias
This example lists all the currently
set aliases.
alias ..
This example removes a previously
specified alias (named ..).
break
Use the break debugging command to:
• Set a breakpoint
• Remove a breakpoint
• Display all currently set breakpoints
The syntax for the break command follows:
b[reak] [func_name | machine_addr] |
[file_name line_num [column_number]] |
[func_name | brkpt_num off]
Table 6.6 shows examples of the break command.
Table 6.6
Debugging Command Examples: break
Example
Description
break foo
This example sets a breakpoint on
the function foo.
break foo off
This example removes the
breakpoint from the function foo.
break p:$1048a
This example sets a breakpoint on
the machine address 1048a.
break
This example displays all the
breakpoints.
StarCore DSP Targeting Manual
ECM–99
D e b u gg i ng
Command-Line Debugging Commands
Table 6.6
Debugging Command Examples: break (continued)
Example
Description
break #4 off
This example removes breakpoint
number 4.
(To determine the number assigned
to a particular breakpoint, execute
the break command.)
break sc_main.c 15
This example sets a breakpoint on
line 15 in sc_main.c
bringtofront
Use the bringtofront debugging command to indicate whether
to always display the command-line debugging window in front of
all other windows on the screen.
The syntax for the bringtofront command follows:
bri[ngtofront] [on |off]
Table 6.7 shows examples of the bringtofront command.
Table 6.7
Debugging Command Examples: bringtofront
Example
Description
bringtofront
This example toggles the current
bringtofront setting of the
window.
bringtofront on
This example sets the command-line
debugger window to always display
in front of other windows.
cd
Use the cd debugging command to change to a different directory
or display the current directory.
When typing a directory name, you can press the Tab key to
complete the name automatically.
You can use an asterisk as a wild card when entering directory
names.
The syntax for the cd command follows:
cd [path]
ECM–100
StarCore DSP Targeting Manual
D ebug ging
Command-Line Debugging Commands
Table 6.8 shows examples of the cd command.
Table 6.8
Debugging Command Examples: cd
Example
Description
cd
This example displays the current
directory.
cd c:
This example changes the directory
to the root directory of the C: drive.
cd d:/mw/0622/test
This example changes the directory
to the specified directory on the D:
drive.
cd c:/p*s
This example uses a wild card
character (*) to change the current
directory to a different directory on
the specified drive.
For example, if there is a directory
named Program_Files in the root
directory of the C: drive, this
example changes the current
directory to that directory.
change
Use the change debugging command to change the contents of
registers or memory locations.
You can change the contents of:
• A single register
• A block of registers
• A single memory address
• A block of memory addresses
The syntax for the change command follows:
c[hange] [
|
[
[
register | reg_block
address
| addr_block ]
value ]
8bit |16bit | 32bit | 64bit ]
reg_block ::= register_first..register_last
addr_block ::= address_first..address_last |
address#count
StarCore DSP Targeting Manual
ECM–101
D e b u gg i ng
Command-Line Debugging Commands
count ::= a value indicating the number of memory locations
whose contents to change
NOTE
You cannot change some memory locations or registers when using
a hardware board (for example, ROM memory).
Table 6.9 shows examples of the change command.
Table 6.9
Debugging Command Examples: change
Example
Description
change R1 $123
This example changes the contents
of R1 to 123.
change R1..R5 $5432
This example changes the contents
of R1 through R5 to 5432.
change p:10..17 3456
This example changes memory
address 10 through 17 to 3456.
change p:18..1f $03456
This example changes memory
addresses 18 through 1f to
00003456.
When you change the contents of one or more memory locations,
you do not have to specify the memory access mode (whether the
mode is eight-bit, 16-bit, 32-bit, or 64-bit).
If you do not specify the memory access mode, the debugger
determines it as follows:
• If value is a fractional value, the mode is 16-bit.
• If value is a hexadecimal value, the debugger determines the
mode as shown in Table 6.10:
Table 6.10
Memory Access Mode for Hexadecimal Values
Memory Access Mode
When value Length Is...
Examples
Eight-bit (8bit)
length <= 2
$1, $12, $01
16-bit (16bit)
2 < length <= 4
$0001, $123
32-bit (32bit)
4 < length <= 8
$00000123, $1234567
64-bit (64bit)
length > 8
$123456789
• If value is a decimal value, the debugger determines the mode
as shown in Table 6.11:
ECM–102
StarCore DSP Targeting Manual
D ebug ging
Command-Line Debugging Commands
Table 6.11
Memory Access Mode for Decimal Values
Memory Access Mode
When value Is...
Examples
Eight-bit (8bit)
value <= 0xff
0,54,255
16-bit (16bit)
value > 0xff
256,65535,1000
32-bit (32bit)
0xffff < value <= 0xffffffff
65536,3253532
64-bit (64bit)
value > 0xffffffff
4294967296
cls
Use the cls debugging command to clear the command-line
debugging window.
The syntax for the cls command follows:
cl[s]
close
Use the close debugging command to close the opened default
project.
The syntax for the close command follows:
clo[se]
config
Use the config debugging command to configure the commandline debugging window. You can configure these items:
• Window colors
• Scrolling size
• Mode
• The default build target
• The hexadecimal prefix
• The memory identifier
• The processor name
• The subprocessor name
StarCore DSP Targeting Manual
ECM–103
D e b u gg i ng
Command-Line Debugging Commands
In addition, you can perform these actions:
• Get the default build target name
• Get the default project name
The syntax for the config command follows:
conf[ig]
[ c[olor] [r | m | c | s | e | n]
text_color [background_color] |
m[ode] [ dsp | tcl | auto] |
s[croll] number_of_lines |
h[exprefix] hexadecimal_prefix |
mem[identifier] memory_identifier |
p[rocessor] processor_name [subprocessor_name] ]
text_color ::= [R_value G_value B_value]
background_color ::= [R_value G_value B_value]
R_value ::= the R value of an RGB color
G_value ::= the G value of an RGB color
B_value ::= the B value of an RGB color
NOTE
The valid values to specify an RGB color are from 0 through 255.
number_of_lines ::= the number of lines to scroll
Table 6.12 shows examples of the config command.
Table 6.12
Debugging Command Examples: config
Example
Description
config
Display all current configuration status
information.
config c e $ff $0 $0
Set the error text color to red.
config c r $0 $0 $0 $ff $ff $ff
Set the register display color to black and the
background color to white.
config s $10
Set the page scrolling size to decimal 16 lines.
config m dsp
Set the command-line debugging window to
dsp mode; use the command-line debugging
commands when clashing.
ECM–104
StarCore DSP Targeting Manual
D ebug ging
Command-Line Debugging Commands
Table 6.12
Debugging Command Examples: config (continued)
Example
Description
config m tcl
Set the command-line debugging window to
Tcl mode; use the Tcl commands when
clashing.
config m auto
Set the command-line debugging window to
auto mode; resolve clashing automatically.
config hexprefix 0x
Show hexadecimal numbers with 0x prefix.
config memidentifier m
Set the memidentifier to m.
config processor 8101
Set the processor to 8101.
config target
Get the default build target name.
config project
Get the default project name.
config target debug release x86
Change the default build target to debug
release x86.
copy
Use the copy debugging command to copy the contents of a
memory address or block of addresses to another memory location.
The syntax for the copy command follows:
co[py] addr_group addr
addr_group ::= address | addr_block
addr_block ::= address_first..address_last |
address#count
count ::= a value indicating the number of memory locations
The addr_group symbol is the location (or locations) from which the
command copies the contents. The addr variable specifies the first
address in memory to which the command copies the contents.
Table 6.13 shows examples of the copy command.
StarCore DSP Targeting Manual
ECM–105
D e b u gg i ng
Command-Line Debugging Commands
Table 6.13
Debugging Command Examples: copy
Example
Description
copy p:00..1f p:30
This example copies the contents of
memory addresses 00 through 1f to
a contiguous block of memory
beginning at address 30.
copy p:20#10 p:50
This example copies the contents of
10 consecutive memory locations
that start at address 20 to a
contiguous block of memory
beginning at address 50.
debug
Use the debug command to start a command-line debugging
session for a project.
The syntax for the debug command follows:
de[bug] [project_file_name]
Table 6.14 shows examples of the debug command.
Table 6.14
Debugging Command Examples: debug
Example
Description
debug
This example starts a debugging
session for the open default project.
debug des.mcp
This example starts a debugging
session for the project named
des.mcp.
dir or ls
Use the dir debugging command to list the contents of a directory
when developing on a Windows host. Use the same syntax that you
use for the operating system dir command.
Use the ls debugging command to list the contents of a directory
when developing on a Solaris host. Use the same syntax that you
use for the operating system ls command.
NOTE
ECM–106
You can use the dir debugging command the same way you use
the dir OS command with one exception. You cannot use any
StarCore DSP Targeting Manual
D ebug ging
Command-Line Debugging Commands
option that requires user input from the keyboard (such as /p for the
dir OS command).
Table 6.15 shows examples of the dir and ls commands.
Table 6.15
Debugging Command Examples: dir
Example
Description
dir
This example lists all files in the
current directory.
di *.txt
This example lists all files in the
current directory that have a file
extension of .txt.
dir c:/tmp
This example lists all files in the tmp
directory of the C: drive.
dir /ad
This example lists only the
subdirectories in the current
directory.
ls /usr
This example lists the contents of
the subdirectory called usr.
disassemble
Use the disassemble debugging command to disassemble the
instructions in the specified memory block.
The syntax for the disassemble command follows:
di[sassemble] addr_block
addr_block ::= address_first..address_last |
address#count
count ::= a value indicating the number of memory locations
Table 6.16 shows examples of the disassemble command.
Table 6.16
Debugging Command Examples: disassemble
Example
Description
disassemble
Disassembles instructions from PC
(if changed)/last address.
StarCore DSP Targeting Manual
ECM–107
D e b u gg i ng
Command-Line Debugging Commands
Table 6.16
Debugging Command Examples: disassemble (continued)
Example
Description
disassemble p:0..20
Disassembles program memory
address block 0 to 20.
disassemble p:$50#10
Disassembles 10 memory locations
starting at memory map
hexadecimal 50.
display
Use the display debugging command to:
• Display the contents of a register or memory location
• List all the register sets on a target
• Add one or more register sets, registers, or memory locations to
the default display items
• Remove one or more register sets, registers, or memory locations
from the default display items
The memory output radix is specified by the radix command.
When you display registers or memory locations, the display
command returns the values to Tcl. Consequently, you can embed
the display command to Tcl as follows:
set r0 [display r0]
; puts $r0 ;
set r0M [display p:$r0 32bit] ; puts $r0M
set r0r1 [display r0..r1]
; puts $r0r1 ;
By default, the display command displays memory as 16-bits per
unit; you can change that by specifying unit size as 8bit, 16bit,
32bit, 64bit.
The syntax for the display command follows:
d[isplay] [ regset ] |
[on all] |
[off all] |
[off id_number ] |
[on reg_group | reg_block | addr_group [8bit | 16bit | 32bit | 64bit]] |
[off reg_group | reg_block | addr_group [8bit | 16bit | 32bit | 64bit]]
reg_group ::= a list of register sets separated by spaces
ECM–108
StarCore DSP Targeting Manual
D ebug ging
Command-Line Debugging Commands
reg_block ::= register_first..register_last
addr_group ::= address | addr_block
addr_block ::= address_first..address_last |
address#count
count ::= a value indicating the number of memory locations
You can specify the following register sets as part of a reg_group:
GPR, SIM, EONCE, GEN_SIU, MEM_CTRL, SYS_INT_TIM,
DMA, INT_CTRL, ClocksReset, IOPort, CPMTimers,
SDMAGen, IDMA, FCC, BRG, I2C, SP, SCC, SMC, SPI,
CPMMux, SI, MCC, HDI16, EFCOP, PIC, QBUS, ALL
Table 6.17 shows examples of the display command.
Table 6.17
Debugging Command Examples: display
Example
Description
display
Displays the default items (for example,
register sets). The command-line
debugger executes the display
command whenever program execution
stops.
display on
Lists the default display items.
display regset
Lists all the available register sets on the
target chip.
display on EONCE QBUS
Add the EONCE and QBUS register
sets to the default display items.
display off SIM
Remove the SIM register set from the
default display items.
display on ALL
Add all supported register sets to the
default display items.
display on p:230#10
Add the specified memory locations to
the default display items.
display off p:230#10
Remove the specified memory locations
from the default display items.
display off all
Remove all the items from the default
display items.
display off #2
Remove the item whose ID is 2 from the
default display items.
display R1
Lists the value of register R1 and returns
to Tcl.
StarCore DSP Targeting Manual
ECM–109
D e b u gg i ng
Command-Line Debugging Commands
Table 6.17
Debugging Command Examples: display (continued)
Example
Description
display R1..R5
Lists the contents of registers R1
through R5.
display p:00..$100
Displays the memory contents from
address 0 to hexadecimal 100.
display p:00#$200 8bit
Display hexadecimal 200 memory units’
contents from address 0. Access
memory in 8bit mode.
evaluate
Use the evaluate debugging command to display a C variable
type or value.
The syntax of the evaluate command follows:
e[valuate] [ b | d |f | h | u] variable
The following list defines the options for the first parameter,
[ b | d | f | h | u ], as follows:
• b = binary
• d = decimal
• f = fraction
• h = hex
• u = unsigned
The preceding parameter defines the format in which to display the
value of the variable.
Table 6.18
Debugging Command Examples: evaluate
Example
Description
evaluate
Lists the types for all the variables in the
current and global stack.
evaluate i
Returns the value of the variable i.
exit
Use the exit debugging command to close the command-line
debugging window.
The syntax for the exit command follows:
ECM–110
StarCore DSP Targeting Manual
D ebug ging
Command-Line Debugging Commands
[ex]it
go
Use the go debugging command to start the program that you are
debugging from the current instruction.
The syntax for the go command follows:
g[o] [ all | time_period ]
If you execute the go command interactively, the command returns
immediately. The target program starts to run.
Then you can either wait for the target program to stop executing
(for example, on a breakpoint) or type the stop debugging
command to stop the execution of the target program.
If you execute the go command in a script, the command-line
debugger polls until the debugger stops (for example, on a
breakpoint) and then executes the next command in the script. (If
the command-line debugger continues polling indefinitely because
the debugging process does not stop, you can stop the script by
pressing the Escape key.)
Table 6.19 shows examples of the go command.
Table 6.19
Debugging Command Examples: go
Example
Description
go
This command returns immediately. The program stops at
the first occurrence of a breakpoint. You also can use the
stop debugging command to break the program.
go 1
This command stops polling the target when no
breakpoint is reached within 1 second. It also sets a Tcl
variable called $still_running to 1.
go all
This command starts all the target programs when
debugging multiple cores.
help
Use the help debugging command to display help for the
debugging commands in the command-line debugger window.
The syntax for the help command follows:
h[elp] [command | command_shortcut]
StarCore DSP Targeting Manual
ECM–111
D e b u gg i ng
Command-Line Debugging Commands
Table 6.20 shows examples of the help command.
Table 6.20
Debugging Command Examples: help
Example
Description
help
This example lists all the debugging
commands.
help b
This example displays help for the
break debugging command.
history
Use the history debugging command to list the history of the
commands entered during the current debugging session.
The syntax for the history command follows:
hi[story]
hsst_attach_listener
Use the hsst_attach_listener command to set up a Tcl
procedure that the debugger notifies whenever there is data in an
communication channel.
The syntax for hsst_attach_listener command follows:
hsst_a[ttach_listener] channel_id tcl_proc_name
The following example uses the hsst_attach_listener
command to execute the procedure call_back automatically
when a communication channel has data available from the target.
proc call_back { } {
global hsst_descriptor;
global hsst_nmemb;
global hsst_size;
puts [ hsst_read $hsst_size $hsst_nmemb
$hsst_descriptor ]
}
set cid [ hsst_open channel1 ]
hsst_attach_listener $cid call_back;
hsst_block_mode
Use the hsst_block_mode command to configure a
communication channel in blocking mode. Doing so causes all calls
ECM–112
StarCore DSP Targeting Manual
D ebug ging
Command-Line Debugging Commands
to hsst_read to block until the requested amount of data is
available from the target.
The default setting is for all channels to be in blocking mode.
The syntax for hsst_block_mode follows:
hsst_b[lock_mode] channel_id
The following example configures a channel in blocking mode:
hsst_block_mode $cid
hsst_close
Use the hsst_close debugging command to close a
communication channel with the host machine.
The syntax for the hsst_close command follows:
hsst_c[lose] channel_id
The following example closes a channel and sets the result to the
variable $cid:
hsst_close $cid
hsst_detach_listener
Use the hsst_detach_listener command to detach a listener
that had been previously attached for automatic data notification.
The syntax for hsst_detach_listener follows:
hsst_d[etach_listener] channel_id
The following example detaches a listener that previously was
attached:
hsst_detach_listener $cid
hsst_log
Use the hsst_log debugging command to log the data to a
directory.
The syntax for the hsst_log command follows:
hsst_l[og] [ directory_name ]
Table 6.33 shows examples of the hsst_log command:
StarCore DSP Targeting Manual
ECM–113
D e b u gg i ng
Command-Line Debugging Commands
Table 6.21
Debugging Command Examples: hsst_log
Example
Description
hsst_log c:\logdata
The debugger logs the data to the
specified directory.
hsst_log
The debugger turns off the log.
hsst_noblock_mode
Use the hsst_noblock_mode command to configure a
communication channel in non-blocking mode. Dong so causes all
calls to hsst_read to return immediately with any available data
(limited by the requested size).
The syntax for hsst_noblock_mode follows:
hsst_n[oblock_mode] channel_id
The following example configures a channel in non-blocking mode:
set cid [ hsst_open channel1 ]
hsst_noblock_mode $cid
hsst_open
Use the hsst_open debugging command to open a communication
channel with the host machine.
The syntax for the hsst_open command follows:
hsst_o[pen] channel_name
The following example opens a channel and sets the returned ID to
the variable $cid:
set cid [hsst_open ochannel1]
hsst_read
Use the hsst_read debugging command to read data from an
opened communication channel.
The syntax for the hsst_read command follows:
hsst_r[ead] size nmemb cid
ECM–114
StarCore DSP Targeting Manual
D ebug ging
Command-Line Debugging Commands
The following example uses the hsst_read command to read 15
data items (each 1 byte in length) from the channel identified by the
variable $cid:
puts [hsst_read 1 15 $cid]
The debugger returns and displays the data.
hsst_write
Use the hsst_write debugging command to write data to an
opened communication channel.
The syntax for the hsst_write command follows:
hsst_w[rite] size data cid
The following example uses the hsst_write command to write
0x1234 as 2 bytes of data to the channel identified by the variable
$cid:
hsst_write 2 0x1234 $cid
input
Use the input debugging command to map a target memory block
to a host file. When a target application reads the memory block, the
application reads the contents of the specified host file instead.
The syntax for the input command follows:
i[nput]
[ id_num | address filename
[ -rd | -rf | -rh | -ru ]] |
[ off ]
Specify address when using the simulator to debug. Specify
id_num when using target hardware to debug.
Choose from the following options to indicate the format of the
input file:
• Use -rd to indicate that the input file is a decimal file.
• Use -rf to indicate that the input file is a fractional file.
• Use -rh to indicate that the input file is a hexadecimal file.
• Use -ru to indicate that the input file is an unsigned decimal
file.
StarCore DSP Targeting Manual
ECM–115
D e b u gg i ng
Command-Line Debugging Commands
Table 6.22 shows examples of the input command.
Table 6.22
Debugging Command Examples: input
Example
Description
input p:$100 in.dat -RD
This example sets up the input feature so that the simulator
gets values from the in.dat file in decimal format (specified
by -RD) and places them in a memory block p:$100 when the
target application reads p$100.
(This example is valid only for the
simulator.)
input #1 in.dat -RF
(This example is valid only for
debugging hardware.)
This example maps file ID 1 (0 through 255 are valid values) to
the file in.dat in fractional format (specified by -RF). In
addition, you must add some special assembly code in your
target application where you want to read values from in.dat
to target memory.
The following example reads 32 words from a file to memory
located at #INPUT:
; Set special value in D0 to
; indicate this is for INPUT/OUTPUT.
; The D0 will be reset after the
; debug instruction.
move.w #$4d43,d0.l
move.w #$5343,d0.h
; fileID : #1 (assigned by
; output command)
; block : 32 words
move.w #$0120,b0
; Mem address to write contents debug
move.l
#INPUT,r0
; use debug as the trigger to have
; the input command copy data from
; the host file to target memory
debug
input off
This example closes all input files and stops the input feature.
(The command is the same both when debugging with the
simulator or with target hardware.)
input
This example lists all the input/output files that are open. (The
command is the same both when debugging with the simulator
or with target hardware.)
ECM–116
StarCore DSP Targeting Manual
D ebug ging
Command-Line Debugging Commands
kill
Use the kill debugging command to close one or all current
debugging sessions.
The syntax for the kill command follows:
k[ill] [all]
Table 6.24 shows examples of the kill command.
Table 6.23
Debugging Command Examples: kill
Example
Description
kill
Kills the current debugging session.
kill all
Kills all the debug sessions when
debugging multiple cores.
load
Use the load debugging command to open a project or load records
into memory.
The syntax for the load command follows:
l[oad] project_file_name | eld_file_name
or
l[oad] -h | -b file_name [ memory_location ]
The following list defines the first parameter of the second version
of the load command:
• -h = hexadecimal file
• -b = binary file
Table 6.24 shows examples of the load command.
Table 6.24
Debugging Command Examples: load
Example
Description
load des.mcp
Loads a project named des.mcp.
load des.eld
Creates a default project from the
des.eld object file and loads the
project.
StarCore DSP Targeting Manual
ECM–117
D e b u gg i ng
Command-Line Debugging Commands
Table 6.24
Debugging Command Examples: load (continued)
Example
Description
load -h dat.lod
Loads the contents of the
hexadecimal file dat.lod into
memory.
load -b dat.lod p:$20
Loads the contents of the binary file
dat.lod into memory begin at $20.
log
Use the log debugging command to log either the commands that
you enter during a debugging session or the entire session (all
display entries) during a debugging session.
The syntax for the log command follows:
lo[g] [off] [c | s file_name]
Table 6.25 shows examples of the log command.
Table 6.25
Debugging Command Examples: log
Example
Description
log
This example displays a list of
currently opened log files.
log s session.log
This example logs all display entries
to a file named session.log.
log c command.log
This example logs the commands
that you enter during the debugging
session to a file named
command.log
log off c
This example ends command
logging.
log off
This example ends all logging in the
command-line debugging window.
next
Use the next debugging command to step over subroutine calls.
If you execute the next command interactively, the command
returns immediately. The target program starts to run.
ECM–118
StarCore DSP Targeting Manual
D ebug ging
Command-Line Debugging Commands
Then you can either wait for the target program to stop executing
(for example, on a breakpoint) or type the stop debugging
command to stop the execution of the target program.
If you execute the next command in a script, the command-line
debugger polls until the debugger stops (for example, on a
breakpoint) and then executes the next command in the script. (If
the command-line debugger continues polling indefinitely because
the debugging process does not stop, you can stop the script by
pressing the Escape key.)
The syntax for the next command follows:
n[ext]
output
Use the output debugging command to map a target memory block
to a host file. When the target application writes to the memory
block, the application writes the contents to the specified file
instead.
The syntax for the output command follows:
o[utput]
[ id_num | address filename
[ -rd | -rf | -rh | -ru ] [-a/-o] ] |
[ off ]
Specify address when using the simulator to debug. Specify
id_num when using target hardware to debug.
Choose from the following options to indicate the format of the
output file:
• Use -rd to indicate that the output file is a decimal file.
• Use -rf to indicate that the output file is a fractional file.
• Use -rh to indicate that the output file is a hexadecimal file.
• Use -ru to indicate that the output file is an unsigned decimal
file.
Choose from the following options to indicate how to write to the
output file:
• Use -a to cause the debugger to append to the output file if it
already exists.
StarCore DSP Targeting Manual
ECM–119
D e b u gg i ng
Command-Line Debugging Commands
• Use -o to cause the debugger to overwrite the output file if it
already exists.
Table 6.26 shows examples of the output command.
Table 6.26
Debugging Command Examples: output
Example
Description
output #2 out.dat -RF -O
This example maps file ID 2 (the values 0 through 255 are
valid) to the file out.dat in fractional format (indicated by
-RF). The -O option causes the debugger to overwrite the
out.dat file if the file already exists.
(This example is valid only for debugging
hardware.)
In addition, you must add some special assembly code to
your target application where you want to write the target
memory block to the file out.dat.
The following example writes 32 words located at
#OUTPUT to the file out.dat:
move.w #$4d43,d0.l
; Set special value in D0
; to indicate this is
; for INPUT/OUTPUT, the D0
; will be reset after debug
; instruction
move.w #$5343,d0.h
; fileID : #2 (assigned by
; output command)
; block : 32 words
move.w #$0220,b0
; Mem address to read
; contents debug
move.l
#OUTPUT,r0
; use debug as the trigger to have
; the input command copy data from
; target memory to the host file
debug
output p:$0 out.dat -RD -A
(This example is valid only for the
simulator.)
ECM–120
This example stores values (which are written to the
memory location p:0 by the target application) to the file
out.dat in decimal format (indicated by -RD). The -A option
appends the values to file out.dat if the file already
exists.
StarCore DSP Targeting Manual
D ebug ging
Command-Line Debugging Commands
Table 6.26
Debugging Command Examples: output (continued)
Example
Description
output off
This example closes all output files and stops the output
feature.
output
This example lists all the input/output files that are open.
pwd
Use the pwd debugging command to display the working directory.
The syntax for the pwd command follows:
pwd
radix
Use the radix debugging command to:
• Display the current default input radix (number base)
• Change the default number base for command entry or for
display of registers and memory locations.
Changing the default input radix allows you to enter constants in
the chosen radix without typing a radix specifier before each
constant.
By default, the command-line debugger uses hexadecimal as the
input radix and display radix unless you change them.
NOTE
You can override the default input radix when entering an individual
value. To specify a hexadecimal constant, precede the constant with
a dollar sign ($). To specify a decimal constant, precede the
constant with a grave accent. To specify a binary value, precede the
constant with a percent sign (%). To specify a fraction value,
precede the constant with a caret (^).
The syntax for the radix command follows:
r[adix] [b | d | f | h | u]
[ register | reg_block | addr_group ]...
The following list defines the first parameter,
[ b | d | f | h | u ], as follows:
• b = binary
StarCore DSP Targeting Manual
ECM–121
D e b u gg i ng
Command-Line Debugging Commands
• d = decimal
• f = fraction
• h = hex
• u = unsigned
The preceding parameter, when not followed by register names or
memory locations, specifies the radix to use as the default input
radix. When followed by register names or memory locations, the
radix is the default display radix when displaying the values
contained in the specified register or memory location.
reg_block ::= register_first..register_last
addr_group ::= address | addr_block
addr_block ::= address_first..address_last |
address#count
count ::= a value indicating the number of memory locations
If you enter the radix command without any parameters, the
debugging window displays the current default input radix.
Table 6.27 shows examples of the radix command.
Table 6.27
Debugging Command Examples: radix
Example
Description
radix
Displays the currently enabled radix.
radix D
Changes the input radix to decimal.
radix H
Changes the input radix to
hexadecimal.
radix f r0..r7
Changes the display radix for the
specified registers to fraction.
radix d x:0#10 r1
Changes the display radix for the
specified register and memory
blocks to decimal.
restart
Use the restart debugging command to restart the debugging
session.
The syntax for the restart command follows:
[re]start
ECM–122
StarCore DSP Targeting Manual
D ebug ging
Command-Line Debugging Commands
run
Use the run debugging command to execute a Tcl script.
This command executes a script file block by block.
NOTE
You can use the run command to run a script that includes these
commands: load, close, debug, kill, and run. However, the
preceding commands cannot reside in a block (such as a loop).
For example, this script is invalid:
set x 0
while {$x < 5}
{
load a.mcp
debug
kill
}
The syntax for the run command follows:
ru[n] file_name
The following example executes a file named test.tcl:
run test.tcl
save
Use the save debugging command to save the contents of specified
memory locations to a binary file or a text file in hexadecimal
format.
The syntax for the save command follows:
sa[ve] -h | -b addr_block ... filename [-a | -c | -o]
addr_block ::= address_first..address_last |
address#count
count ::= a value indicating the number of memory locations
The following list defines the first parameter to the save command:
• -h = write a text file in hexadecimal format
When you save to a file in hexadecimal text format, the
debugger saves the memory location information in the file.
StarCore DSP Targeting Manual
ECM–123
D e b u gg i ng
Command-Line Debugging Commands
Consequently, when you load a file saved in this format, you
do not have to specify the memory address.
• -b = write a binary file
When you save to a binary file, the debugger does not save
the memory location information in the file. Consequently,
when you load a file saved in this format, you must specify
the memory address.
The following list defines the last parameter to the save command:
• -a = append to an existing file
• -c = write if the file does not yet exist
If the file to which you are trying to save already exists, the
save command does not overwrite the file. Instead, the
save command cancels and returns without changing the
file.
• -o = overwrite an existing file
You can use the Tcl set command to assign a name to a particular
block of memory. You can then substitute that name instead of
typing the specification for the memory block repeatedly.
Table 6.28 shows examples of the save command.
Table 6.28
Debugging Command Examples: save
Example
Description
set addressBlock1 "p:10..`31"
set addressBlock2 "p:10000#20"
save -h $addressBlock1 $addressBlock2 hexfile -a
Dumps the contents of
two memory blocks to
a text file called
hexfile.lod in
append mode.
set addressBlock1 "p:10..`31"
set addressBlock2 "p:10000#20"
save -b $addressBlock1 $addressBlock2 binfile -o
Dumps the contents of
two memory blocks to
a binary text file called
binfile.lod in
overwrite mode.
step
Use the step debugging command to step through a program.
The debugger automatically executes the display debugging
command each time that you invoke the step command.
The syntax for the step command follows:
ECM–124
StarCore DSP Targeting Manual
D ebug ging
Command-Line Debugging Commands
st[ep] [li | in | into | out]
Table 6.29 shows examples of the step command.
Table 6.29
Debugging Command Examples: step
Example
Description
step li
This example steps one line.
step in
This example steps one instruction.
step into
This example steps into a function.
step out
This example steps out of a
function.
stop
Use the stop debugging command to stop a running program after
invoking a go, step, or next debugging command.
The syntax for the stop command follows:
s[top] [all]
Table 6.24 shows examples of the stop command.
Table 6.30
Debugging Command Examples: kill
Example
Description
stop
Stops the currently running target
program.
stop all
Stops all currently running target
programs when debugging multiple
cores.
switchtarget
When you are performing multi-core or multi-chip debugging, use
the switchtarget debugging command to list the available
debugging sessions and to specify to which session you want to
send subsequent debugging commands.
The syntax for the switchtarget command follows:
sw[itchtarget] [index]
Table 6.31 shows examples of the switchtarget command.
StarCore DSP Targeting Manual
ECM–125
D e b u gg i ng
Command-Line Debugging Commands
Table 6.31
Debugging Command Examples: switchtarget
Example
Description
switchtarget
This example lists the currently
available debugging sessions.
switchtarget 0
Choose the debugging session
whose session ID is 0 to send
subsequent debugging commands
to.
system
Use the system debugging command to execute a system
command.
NOTE
The command-line debugger supports executing system commands
that require keyboard input. However, the command-line debugger
does not support commands that use the full screen display (such
as the DOS edit command).
The syntax for the system command follows:
sy[stem] system_command
The following example runs a system command that deletes all files
in the current directory with the .tmp file extension:
system del *.tmp
view
Use the view debugging command to change the view mode. You
can toggle the view mode between assembly mode and register
mode.
The syntax for the view command follows:
v[iew] [a | r]
Table 6.32 shows examples of the view command.
ECM–126
StarCore DSP Targeting Manual
D ebug ging
Command-Line Debugging Commands
Table 6.32
Debugging Command Examples: view
Example
Description
view
Toggle the view mode.
view a
Set the view mode to assembly
mode.
view r
Set the view mode to register mode.
view a $100
Display the assembly that begins at
hexadecimal address 100.
wait
Use the wait debugging command to cause the debugger to wait
for the specified amount of time.
The syntax for the wait command follows:
w[ait] [milliseconds]
Table 6.33 shows examples of the wait command:
Table 6.33
Debugging Command Examples: wait
Example
Description
wait
The debugger waits until you press
the space bar on the keyboard.
wait 2
The debugger waits for two
milliseconds.
watchpoint
Use the watchpoint debugging command to add, remove, or
display a watchpoint.
NOTE
Due to hardware resource limitations, you can set only one
watchpoint at a time.
The syntax for the watchpoint command follows:
wat[chpoint] [variable_name | watchpoint_id off]
Table 6.33 shows examples of the watchpoint command:
StarCore DSP Targeting Manual
ECM–127
D e b u gg i ng
Load Save Fill Memory
Table 6.34
Debugging Command Examples: watchpoint
Example
Description
watchpoint
The debugger displays the
watchpoint list.
watchpoint i
The debugger add the variable i to
the watchpoint list.
Load Save Fill Memory
There are two options under the Debug menu that let you edit the
contents of target memory while you are debugging.
• Load/Save Memory
• Fill Memory
Load/Save Memory
To load or save the contents of your target memory, select Debug >
Load/Save Memory. The Load/Save Memory dialog box appears
(Figure 6.3).
Figure 6.3
ECM–128
Load/Save Memory Dialog Box
StarCore DSP Targeting Manual
D ebug ging
Load/Save Memory
History
The History list box lists all previous load and save memory
operations. Select a previous load or save operation to repeat the
action.
Operation
The Operation radio buttons let you select between load operations
and save operations.
Memory Type
The Memory Type list box lets you select the size of the memory
units. You can select from:
• 8-bit access
• 16-bit access
• 32-bit access
Address
The Address text field lets you specify the memory address where
you want to start loading or saving memory.
Size
The Size text field lets you specify the size in bytes of the memory
region you want to load or save.
Filename
The Filename text field lets you specify the file you wish to use for
the desired memory operation.
Overwrite Existing
The Overwrite Existing checkbox lets you specify that you wish to
overwrite any existing files. This option is only available when you
are performing Save operations.
File Formats
The File Formats list box lets you specify the format of the data
within the file. You can select from:
• Binary Raw
StarCore DSP Targeting Manual
ECM–129
D e b u gg i ng
Fill Memory
a binary file containing an uninterrupted stream of data
• Text Decimal
a text file in which each memory unit is represented by a
signed decimal value.
• Text Fixed
a text file in which each memory unit is represented by a 32bit fixed point value.
• Text Fractional
a text file in which each memory unit is represented by a
floating point number.
• Text Hex
a text file in which each memory unit is represented by a
hexadecimal value.
• Text Unsigned Decimal
a text file in which each memory unit is represented by an
unsigned decimal value
Fill Memory
To fill a memory region of your target with a given value, select
Debug > Fill Memory. The Fill Memory dialog box appears
(Figure)
Figure 6.4
ECM–130
Fill Memory Dialog Box
StarCore DSP Targeting Manual
D ebug ging
Fill Memory
History
The History list box lists all the previous fill operations. Select a
previous fill operation to repeat the action.
Memory Type
The Memory Type list box lets you select the size of the memory
units. You can select from:
• 8-bit access
• 16-bit access
• 32-bit access
Address
The Address text field lets you specify the memory address where
you want to start filling target memory.
Size
The Size text field lets you specify the size in bytes of the memory
region you want to fill.
Fill Expr
The Fill Expr text field lets you specify the hexadecimal value with
which you want to fill the memory region.
StarCore DSP Targeting Manual
ECM–131
D e b u gg i ng
Save Restore Registers
Save Restore Registers
The Debug > SaveRestoreRegs option (Figure 6.5) lets you save or
restore the values of register banks while you are debugging.
Figure 6.5
Save/Restore Registers Dialog Box
History
The History list box lists all previous save and restore operations.
Select a previous save or restore operation to repeat the action.
Operation
The Operation radio buttons let you select between load operations
and save operations.
Register List
The register list lets you select the register banks that you want to
save. You may select more than one register bank. The register list is
only available for save operations.
ECM–132
StarCore DSP Targeting Manual
D ebug ging
Save Restore Registers
Filename
The Filename text field lets you specify the file you wish to use for
the desired save or restore operation.
Overwrite Existing
The Overwrite Existing checkbox lets you specify that you wish to
overwrite any existing files. This option is only available for save
operations.
StarCore DSP Targeting Manual
ECM–133
D e b u gg i ng
Save Restore Registers
ECM–134
StarCore DSP Targeting Manual
7
Multi-Core Debugging
Multi-core debugging lets you debug multiple cores connected on a
JTAG chain. You create a separate project to run on each core, and
debugging each core in its own debugger window.
You may debug multiple cores with either the MSC8102 simulator
or real hardware.
This chapter contains the following topics:
• Setting Up to Debug Multiple Targets
• JTAG Initialization File
• LDebugging with Multiple Cores
• Using Multi-Core Debugging Commands
• Synchronized Stop
Setting Up to Debug Multiple Targets
This section lists the general steps you follow to begin multi-chip
debugging.
To set up for multi-chip debugging:
1
Set up and connect your JTAG chain of target boards.
2
Create a JTAG initialization file that describes the items on the JTAG
chain.
3
Open a project to debug. (If you are debugging more than one core,
each core must have its own project.)
StarCore DSP Targeting Manual
ECM–135
M u lt i- C o re D e b u g gi n g
Setting Up to Debug Multiple Targets
ECM–136
4
In the Remote Debugging target settings panel, enable the MultiCore Debugging option and specify the core index.
5
Click the Edit Connection button to open the Remote Connection
window.
6
Enable the Multi-Core Debugging option and specify the name of
the JTAG initialization file.
StarCore DSP Targeting Manual
M u lt i - C or e D e b u gg i ng
JTAG Initialization File
NOTE
7
Depending on the project you are debugging and the stationery you
are using, you may need to change other target settings. This
section discusses only target settings that are related to multi-chip
debugging.
Select Project > Run.
The IDE downloads the program to the specified core. You can
begin debugging.
JTAG Initialization File
To debug multiple cores in a JTAG chain, you must create a JTAG
initialization file that specifies the type and the order of the cores
that you intend to debug.
To specify StarCore chips that contain one core, you must specify
SC140 as the name of the chip you are debugging. For example,
Listing 7.1 shows a JTAG initialization file for three StarCore chips
in a JTAG chain.
Listing 7.1
Example JTAG Initialization File for StarCore Boards (Single-Core Chip)
# JTAG Initialization File
# Has an index value of 0 in the JTAG chain
SC140
# Has an index value of 1 in the JTAG chain
SC140
# Has an index value of 2 in the JTAG chain
SC140
You also can specify to debug multiple cores on one chip (for
example, an MSC8102 chip). Listing 7.2 shows a JTAG initialization
file that specifies multi-core debugging on an MSC8102 chip:
Listing 7.2
Example JTAG Initialization File for MSC8102 Chip
# JTAG Initialization File
# Indicates that multi-core debugging on a single chip
# (MSC8102) will be performed
StarCore DSP Targeting Manual
ECM–137
M u lt i- C o re D e b u g gi n g
JTAG Initialization File
MSC8102Sync
# Has an index
MSC8102
# Has an index
MSC8102
# Has an index
MSC8102
# Has an index
MSC8102
value of 0 in the JTAG chain
value of 1 in the JTAG chain
value of 2 in the JTAG chain
value of 3 in the JTAG chain
In addition, you can specify other chips to debug on the JTAG chain.
To do so, you use the following syntax to specify the chip as a
generic device:
Generic instruct_reg_length data_reg_bypass_length JTAG_bypass_instruction
Table 7.1 shows the definitions of the variables that you must
specify for a generic device.
Table 7.1
Syntax Variables to Specify a Generic Device on a JTAG Chain
Variable
Description
instruct_reg_length
Length in bits of the JTAG instruction register.
data_reg_bypass_length
Length in bits of the JTAG bypass register.
JTAG_bypass_instruct
Hexadecimal value that specifies the JTAG
bypass instruction.
Listing 7.3 shows a JTAG initialization file that includes a StarCore
chip and a generic device in a JTAG chain.
Listing 7.3
Example JTAG Initialization File with a Generic Device
# JTAG Initialization File
# Has an index value of 0 in the JTAG chain
SC140
# Has an index value of 1 in the JTAG chain
Generic 4 1 Oxf
ECM–138
StarCore DSP Targeting Manual
M u lt i - C or e D e b u gg i ng
LDebugging with Multiple Cores
Debugging with Multiple Cores
L
When you start to debug a multi-core project, the IDE downloads
the related targets to the appropriate cores, with correct settings for
multi-core debugging.
Figure 7.1 shows an initial download of a multi-core project created
from a multi-core stationery (before any changes have been made to
the projects by a developer). As the figure shows, the IDE creates a
separate debugging window for each project in the multi-core
project.
Figure 7.1
8
Initial Download of Multi-Core Project Created from Stationery
Use the simulator projects to create your own applications to debug,
adding and deleting files and code to the various projects as needed
StarCore DSP Targeting Manual
ECM–139
M u lt i- C o re D e b u g gi n g
Using Multi-Core Debugging Commands
(just as you would do with any other project created from
stationery).
NOTE
9
NOTE
You can kill all the debugging windows to remove them while you
work with the project windows, if you choose. To do so, choose
Multi-Core Debug > Kill All.
If needed, adjust any target settings related to your multi-core
projects.
The target settings related to multi-core debugging should work
correctly without adjustment.
10
When you are ready to debug, choose Project > Debug to download
your multi-core projects to the simulator.
11
Debug using standard single-core debugging commands and multicore debugging commands as needed.
Using Multi-Core Debugging Commands
When debugging a multi-core project, you can use multi-core
debugging commands. (You also can use the standard single-core
debugging commands to debug parts of each core project.)
You access the multi-core debugging commands using the MultiCore Debug menu.
Table 7.2 describes the multi-core debugging commands.
ECM–140
StarCore DSP Targeting Manual
M u lt i - C or e D e b u gg i ng
Synchronized Stop
Table 7.2
Multi-Core Debugging Commands
Select this command...
To perform this action...
Multi-Core Debug > Run All
A multi-core run. This command
starts all cores executing as close to
the same time as possible. (This
action also is known as a
synchronous run.)
Multi-Core Debug > Stop All
A multi-core stop. This command
stops all cores executing as close to
the same time as possible. (This
action also is known as a
synchronous stop.)
Multi-Core Debug > Kill All
Kill all multi-core debugging
sessions as close to the same time
as possible.
Synchronized Stop
When you perform multi-core debugging using the MSC8102
simulator, you can use an additional feature called synchronized
stop.
Synchronized stop means that when any of the executing cores stops
(for example, because the core encounters a software breakpoint or
you issue an explicit stop command), all the other currently
executing cores stop, too.
Before you can use the synchronized stop feature, you must enable
it. (Enabling this feature sets bit 10 and bit 15 of the ESEL_DM
register. Disabling this feature clears those bits.)
To enable synchronized stop, perform these steps after starting to
debug a multi-core project:
1
Choose SC100 > MSC8102 Sim/ADS > MSC8102 Sync Stop.
The MSC8102 Synchronized Stop dialog box appears (Figure 7.2).
StarCore DSP Targeting Manual
ECM–141
M u lt i- C o re D e b u g gi n g
Synchronized Stop
Figure 7.2
ECM–142
MSC8102 Synchronized Stop Dialog Box
2
Select the Check to enable checkbox.
3
Click OK.
StarCore DSP Targeting Manual
8
iCache Performance
Analysis
This chapter describes CodeWarrior features as they relate to code
profiling and performance analysis.
This chapter contains the following topics:
• iCacheViewer Window
• iCache Performance Tool
iCacheViewer Window
After you begin debugging a project for an SC140e processor, you
can view the contents of the instruction cache while debugging.
NOTE
The iCache Viewer window applies only when debugging using the
MSC8102 simulator.
To view the contents of the iCache, choose View > iCache Viewer.
The IDE displays an iCache Viewer window (Figure 8.1).
StarCore DSP Targeting Manual
ECM–143
iC ac he Pe rf o rm a n c e A n aly s is
iCacheViewer Window
Figure 8.1
iCache Viewer Window
In the iCache Viewer window, valid information that changed
displays as red text. Invalid information displays as gray text and
the rest as black text.
You can perform several actions in the iCache Viewer window.
Table 8.1 lists and describes these actions.
ECM–144
StarCore DSP Targeting Manual
i Ca c h e P e rf o rm a n c e A n a ly s is
iCache Performance Tool
Table 8.1
iCache Viewer Window Actions
Action
Description
Find an address
Type a hexadecimal address in the
Address field and click find.
The view jumps to the line
containing the address if it resides in
the ICache.
Set the LRU boundaries
Type the lower and upper boundary
values (0-15) and click Set.
Flush the entire ICache
Click the Flush button. (The Flush
button causes the valid bits array to
be filled with zeroes.)
All data appears as gray text.
Flush one line of the iCache
Press the x button in the line column
when viewing the specific line you
want to flush.
iCache Performance Tool
You can use the iCache Performance tool to examine information
related to the instruction cache.
NOTE
The iCache Performance tool applies only when you debug using
the MSC8102 simulator.
Input Files for the iCache Performance Tool
The iCache Performance tool uses these types of files to display data
about the instruction cache for a particular core:
• An executable file
• An instruction cache trace buffer file (dump file)
You can load data from an instruction cache trace buffer file that
contains data for one core or from an instruction cache trace buffer
file that contains data for four cores.
StarCore DSP Targeting Manual
ECM–145
iC ac he Pe rf o rm a n c e A n aly s is
Starting the iCache Performance Tool
To generate an appropriate executable file to use with the iCache
Performance tool, change your linker command file so that the
linker places instructions into cacheable memory.
In the MSC8102 simulator, generate an instruction cache trace buffer
file (dump file) by entering commands similar to those in Listing
8.1:
Listing 8.1
Simulator Commands to Generate an Instruction Cache Trace Buffer File
device dv0 msc8102
load starcore.eld
log eqbs starcore.dmp
trace 30 cy
After you enter the appropriate simulator commands for your
program, the simulator generates an instruction cache trace buffer
file. You then can quit the simulator.
Starting the iCache Performance Tool
To start the iCache Performance tool, choose View > iCache
Performance.
The IDE displays the Open Files window (Figure 8.2).
ECM–146
StarCore DSP Targeting Manual
i Ca c h e P e rf o rm a n c e A n a ly s is
Starting the iCache Performance Tool
Figure 8.2
Open Files Window
You can load data from an instruction cache trace buffer file that
contains data for one core or from an instruction cache trace buffer
files that contains data for four cores.
Loading Data for Cores from Separate Files
To load data from separate instruction cache trace buffer files for
each core you examine, perform these steps in the Open Files
window:
1
Specify a separate trace buffer file and executable file on each tab of
the Open Files window.
NOTE
The Open File icon opens a standard dialog box that you can use to
navigate to a file. The X icon clears the field.
2
Click O.K.
The Open Information window appears.
StarCore DSP Targeting Manual
ECM–147
iC ac he Pe rf o rm a n c e A n aly s is
Starting the iCache Performance Tool
3
Click O.K.
A window appears that contains the All Cores view.
Loading Data for Cores from One File
To load data from an instruction cache trace buffer file that contains
data for four cores, perform these steps in the Open Files window:
1
Select the One for all checkbox.
The four core tabs consolidate into an All Cores tab.
2
Specify the name of the four-core instruction cache trace buffer file.
NOTE
The Open File icon opens a standard dialog box that you can use to
navigate to a file. The X icon clears the field.
3
Specify the name of the executable file.
Figure 8.3 shows how the Open Files window might look after you
perform the preceding steps.
ECM–148
StarCore DSP Targeting Manual
i Ca c h e P e rf o rm a n c e A n a ly s is
Starting the iCache Performance Tool
Figure 8.3
4
Open Files Window with One for all Checkbox Selected
Click O.K.
The Open Information window appears (Figure 8.4).
Figure 8.4
Open Information Window
StarCore DSP Targeting Manual
ECM–149
iC ac he Pe rf o rm a n c e A n aly s is
iCache Performance Menu and iCache Toolbar
5
Click O.K.
A window appears that contains the All Cores view (Figure 8.5).
Figure 8.5
All Cores View
At this point, you can begin examining the instruction cache data,
which you can examine using several views.
iCache Performance Menu and iCache Toolbar
After you start the iCache Performance Tool and load core data into
the tool, the iCache Performance menu appears in the IDE and the
All Cores view appears. The window in which the various icache
views appear has several buttons on its toolbar; almost all of them
correspond to a menu item in the iCache Performance menu.
Table 8.2 lists and describes the commands in the iCache
Performance menu and the buttons in the iCache toolbar.
ECM–150
StarCore DSP Targeting Manual
i Ca c h e P e rf o rm a n c e A n a ly s is
iCache Performance Menu and iCache Toolbar
Table 8.2
Command
iCache Performance Menu Commands and iCache Toolbar Buttons
Button
Description
Open
Displays the Open Files window, where you can specify a new set of
files to work with.
Go Back
The IDE maintains the views you examine after opening the All Cores
view in a list. Go Back displays the previous view that you examined
before the currently displayed view.
Go Forward
The IDE maintains the views you examine after opening the All Cores
view in a list. Go Forward displays the next view forward from the
currently displayed view.
Clone Window
Displays another copy of the currently selected iCache view window
(regardless of which view is currently displayed in the window).
Magnitude (button only). Changes the magnitude (height of bars) of
the view.
Close Graph
Closes the currently selected iCache view window (regardless of
which view is currently displayed in the window).
StarCore DSP Targeting Manual
ECM–151
iC ac he Pe rf o rm a n c e A n aly s is
All Cores View
All Cores View
The All Cores view (Figure 8.6) presents information about all four
cores (one column for each core).
Figure 8.6
All Cores View
The bottom panel of the All Cores view displays useful information
when a mouse passes over different parts of the view.
Double-clicking on a bar displays the next view (Core).
ECM–152
StarCore DSP Targeting Manual
i Ca c h e P e rf o rm a n c e A n a ly s is
Core View
Core View
The Core view (Figure 8.7) presents information about executable
code on the specified core (one bar per function). The function can
be a regular function or just executable code that is not declared as a
function.
Figure 8.7
Core View
The left side of the Core view lists all functions and these
corresponding values for each function:
• PC (program counter)
• Size
• Hits
• Misses
• Miss rate (shown as a percentage)
The bottom panel of the Cores view displays useful information
when a mouse passes over different parts of the view.
Double-clicking on a bar displays the next view (Function).
StarCore DSP Targeting Manual
ECM–153
iC ac he Pe rf o rm a n c e A n aly s is
Function View
Function View
The Function view (Figure 8.8) presents information for a single
function. The view displays one bar for each interval, where an
interval represents contiguous code between calls to other
functions.
Figure 8.8
Function View
The triangles represent function calls. Double-clicking on a triangle
(or above a triangle) displays the Function view of the called
function.
The left side of the Function view lists all functions and these
corresponding values for each function:
• PC (program counter)
• Size
• Hits
• Misses
• Miss rate (shown as a percentage)
ECM–154
StarCore DSP Targeting Manual
i Ca c h e P e rf o rm a n c e A n a ly s is
PC View
The bottom panel of the Function view displays useful information
when a mouse passes over different parts of the view.
Double-clicking on a bar displays the next view (PC).
PC View
The PC view (Figure 8.9) displays all executable code with the
specified resolution.
Figure 8.9
PC View
You can specify a different resolution in the Resolution text field
and a different PC in the Goto PC text field. (You can easily return to
the starting position by clicking Return.)
You can select some interval on the graph by pressing the left mouse
button, dragging over the chosen area, and releasing the left mouse
button. After you release the left mouse button, the IDE displays a
new graph created with the selected area expanded (Figure 8.10).
StarCore DSP Targeting Manual
ECM–155
iC ac he Pe rf o rm a n c e A n aly s is
PC View
Figure 8.10
New PC View After Selecting an Interval
Double-clicking on a bar in a PC View displays the Function view of
the function whose PC you clicked.
ECM–156
StarCore DSP Targeting Manual
9
Enhanced On-Chip
Emulation (EOnCE)
This chapter describes the EOnCE module, a separate on-chip block
that allows non-intrusive interaction with the core. You can use the
EOnCE module to examine the contents of registers, memory, or onchip peripherals in a special debugging environment.
This chapter contains these topics:
• EOnCE Features
• EOnCE Configurator Panels Description
• EOnCE Example: Counting Factorial Function Calls
• EOnCE Example: Using the Trace Buffer
EOnCE Features
With the EOnCE module, you can keep a running trace of tasks,
interrupts, and when each occurred.
EOnCE Features Overview
EOnCE provides the following advantages:
• Reduces system intrusion when debugging
• Reduces the use of general-purpose peripherals for debugging
input and output
• Standardizes system-level debugging across multiple platforms
• Includes a rich set of breakpoint features
One of the main differences between setting regular software
breakpoints and setting breakpoints using EOnCE is that,
when you set a regular software breakpoint, the program
stops executing immediately before the instruction on which
you set the breakpoint. When you set a breakpoint using
StarCore DSP Targeting Manual
ECM–157
En h a n c e d O n - C hi p Em u la ti o n ( EO nC E )
EOnCE Configurator Panels Description
EOnCE, the program stops executing immediately after the
instruction.
• Provides the ability to non-intrusively read from and write to
peripheral registers while debugging
• Provides a trace buffer for program flow and data tracing
• Uses a programming model that is accessible either directly by
your software or by the CodeWarrior debugger
• Does not require that peripherals be halted during debug mode
EOnCE Trace Buffer Overview
The following information is pertinent when using the EOnCE trace
buffer:
• The trace buffer is a circular buffer. When the buffer is full, if you
continue to step through code, the buffer is overwritten from the
beginning.
• You can determine whether the trace buffer is full by examining
the TBFULL bit of the ESR (EOnCE Status Register) register.
When the trace buffer is full, the TBFULL bit is set.
• You can trace up to 2048 bytes worth of addresses in the trace
buffer.
• You must enable the trace buffer each time before getting new
trace information.
EOnCE Configurator Panels Description
This section provides a description of the EOnCE Configurator
panels that you use to set up debugging with EOnCE.
NOTE
When selecting settings in the EOnCE Configurator, configure the
tabbed panels in the left-to-right order of the tabs. For example,
configure the Address Event Detection Channel 0 panel before
configuring the Event Counter panel. In addition, configure your
selected settings from the left-top position to the right-bottom
position within a panel.
You can save settings that you specify in the EOnCE Configurator
for your current debugging session only by clicking OK in the
EOnCE Configurator window.
ECM–158
StarCore DSP Targeting Manual
En h a n c e d On - C h ip Em u la t i on ( E On C E )
EE Pins Controller panel
You can save an EOnCE configuration in a file for later reuse by
choosing Debug > EOnCE > Save EOnCE Configuration and
specifying the file name to save to.
You can open a previously saved EOnCE configuration file to use
with a project by choosing Debug > EOnCE > Open EOnCE
Configuration and navigating to the location of the EOnCE
configuration file.
• EE Pins Controller panel
• Address event detection channel panels
• Data Event Detection Channel panel
• Event Counter panel
• Event Selector panel
• Trace Unit panel
EE Pins Controller panel
Figure 9.1 displays the EE Pins Controller panel, which you can use
to configure the EOnCE controller, specifically the EE pins. EE pins
are general-purpose pins that can serve as input or output pins to
the EOnCE.
StarCore DSP Targeting Manual
ECM–159
En h a n c e d O n - C hi p Em u la ti o n ( EO nC E )
EE Pins Controller panel
Figure 9.1
EE Pins Controller Panel
Table 9.1 describes the items that you can specify on the EE Pins
Controller panel in the EOnCE Configurator.
Table 9.1
EE Pins Controller Panel Description
Panel Item
Description
EE Pin 0
Three possible settings exist:
ECM–160
Setting
Description
output: detection by EDCA0
After an event is detected on EDCA0
(event detection channel 0), the signal on
EE pin 0 is toggled.
input: enable EDCA0 event
An input signal from EE pin 0 enables an
event on EDCA0 (event detection channel
0).
input: Debug Request
A signal asserted to EE pin 0 during and
after reset causes the core to enter debug
mode. A signal asserted to EE pin 0 also
causes an exit from stop or wait processing
states of the core.
StarCore DSP Targeting Manual
En h a n c e d On - C h ip Em u la t i on ( E On C E )
EE Pins Controller panel
Table 9.1
EE Pins Controller Panel Description (continued)
Panel Item
Description
EE Pin 1
Three possible settings exist:
EE Pin 2
EE Pin 3
Setting
Description
output: detection by EDCA1
After an event is detected on EDCA1
(event detection channel 1), the signal on
EE pin 1 is toggled.
output: Debug Ack.
A signal is asserted to EE pin 1 after the
core enters debug mode. A signal is
negated to EE pin 1 after the core exits
from debug mode.
input: enable EDCA1 event
An input signal from EE pin 1 enables an
event on EDCA1 (event detection channel
1).
Two possible settings exist:
Setting
Description
output: detection by EDCA2
After an event is detected on EDCA2
(event detection channel 2), the signal on
EE pin 2 is toggled.
input: enable EDCA2 event
An input signal from EE pin 2 enables an
event on EDCA2 (event detection channel
2) and ECNT.
Three possible settings exist:
Setting
Description
output: detection by EDCA3
After an event is detected on EDCA3
(event detection channel 3), the signal on
EE pin 3 is toggled.
output: ERCV Receive register is full
A signal is asserted to EE pin 3 after the
host finishes writing to the ERCV register.
A signal is negated to EE pin 3 after the
host finishes reading the ETRSMT register.
input: enable EDCA3 event
An input signal from EE pin 3 enables an
event on EDCA3 (event detection channel
3).
EE Pin 5
Not applicable.
EE Pin 5
Not applicable.
StarCore DSP Targeting Manual
ECM–161
En h a n c e d O n - C hi p Em u la ti o n ( EO nC E )
Address event detection channel panels
Table 9.1
EE Pins Controller Panel Description (continued)
Panel Item
Description
EED Pin
Two possible settings exist:
Setting
Description
output: detection by EDCD
After an event is detected on the EDCD
(Data Event Detection channel), the signal
on the EED pin is toggled.
input: enable EDCD event
An input signal from the EED pin enables
an event on EDCD (the Data Event
Detection channel).
Address event detection channel panels
The EOnCE module includes several address event detection
channels that can detect address values from an address bus
according to the selections you choose. Each address event detection
channel has a corresponding EOnCE Configurator panel:
• Address Event Detection Channel 0 (EDCA0)
• Address Event Detection Channel 1 (EDCA1)
• Address Event Detection Channel 2 (EDCA2)
• Address Event Detection Channel 3 (EDCA3)
• Address Event Detection Channel 4 (EDCA4)
• Address Event Detection Channel 5 (EDCA5)
NOTE
ECM–162
The CodeWarrior IDE uses EDCA5 in conjunction with hardware
watchpoints. Consequently, the Address Event Detection Channel 5
panel is disabled in the EOnCE Configurator.
StarCore DSP Targeting Manual
En h a n c e d On - C h ip Em u la t i on ( E On C E )
Address event detection channel panels
Figure 9.2 shows an example of a EOnCE Configurator panel for an
address event detection channel.
Figure 9.2
Address Event Detection Channel 0 Panel
StarCore DSP Targeting Manual
ECM–163
En h a n c e d O n - C hi p Em u la ti o n ( EO nC E )
Address event detection channel panels
Table 9.2 describes the items that you can specify on address
channel panels in the EOnCE Configurator.
Table 9.2
Address Channel Panel Description
Panel Item
Description
Bus Selection
The bus on which to detect an address value. You can specify:
• XABA
• XABB
• XABA and XABB
• PC
For example, to set a breakpoint on an instruction, specify
PC, which indicates the value of the program counter.
Access Type
The type of access performed on the specified address. You can specify:
• Read
• Write
• Read or write
Comparator A
Specify a hexadecimal value (with a maximum length of 32 bits) with
which to compare the detected address value. You can specify the
following types of comparisons:
• = (equal)
• != (not equal)
• > (greater than)
• < (less than)
Comparator B
Specify a hexadecimal value (with a maximum length of 32 bits) with
which to compare the detected address value. You can specify the
following types of comparisons:
• = (equal)
• != (not equal)
• > (greater than)
• < (less than)
Comparators Selection
Choose a value or values with which to compare the detected address
value. You can specify one of the following:
• A only
• B only
• A and B
• A or B
ECM–164
StarCore DSP Targeting Manual
En h a n c e d On - C h ip Em u la t i on ( E On C E )
Data Event Detection Channel panel
Table 9.2
Address Channel Panel Description (continued)
Panel Item
Description
Enable after Event On
Enable the comparison specified by this panel after an event on the
specified item. You can specify one of the following:
• Disabled
• EDCA0, EDCA1, EDCA2, EDCA3
• EDCD
• Counter
• EE pins
• Enabled
If you select disabled, the IDE does not perform a comparison on the
address. If you select enabled, the IDE performs the specified
comparison if an event occurs on any of the items in the list.
Mask (Hex 32 bits)
Use this field to set the value of the EDCA mask register.
The EDCA mask register allows masking of any of the bits in the detected
address before the address is compared with a value that you specified in
the Comparator A or Comparator B fields. (All the bits of this register are
set to 1 during core reset.)
The CodeWarrior IDE performs an AND operation on the bits of the
detected address and the mask value, which has the following results:
• An address bit that corresponds to a mask bit with a value of 1 keeps
its original value (0 or 1) before being compared.
• An address bit with a value of 0 that corresponds to a mask bit with a
value of 0 keeps its original value before being compared.
• An address bit with a value of 1 that corresponds to a mask bit with a
value of 0 changes to a value of 0 before being compared.
After applying the mask to the address, the CodeWarrior IDE performs
any comparisons that you previously defined.
Data Event Detection Channel panel
You can use the Data Event Detection Channel panel to detect a
particular data value.
Figure 9.3 shows the Data Event Detection Channel panel.
StarCore DSP Targeting Manual
ECM–165
En h a n c e d O n - C hi p Em u la ti o n ( EO nC E )
Data Event Detection Channel panel
Figure 9.3
ECM–166
Data Event Detection Channel Panel
StarCore DSP Targeting Manual
En h a n c e d On - C h ip Em u la t i on ( E On C E )
Data Event Detection Channel panel
Table 9.3 describes the items that you can specify on the Data Event
Detection Channel panel.
Table 9.3
Data Event Detection Channel Panel Description
Panel Item
Description
Access Type
Indicates whether the data value to detect is being read or written.
Reference Value
Specify a hexadecimal value (with a maximum length of 32 bits)
with which to compare the detected address value. If you are
specifying a byte or a word, use least-significant-bit (LSB)
alignment.
You can specify the following types of comparisons:
• = (equal)
• != (not equal)
• > (greater than)
• < (less than)
Mask
A 32-bit value that you can use to mask any bits in the sampled
data value before the CodeWarrior IDE compares it to the
specified reference value.
Bits with a value of 0 in the mask cause the corresponding bit in
the sampled data value to be set to 0. (A bitwise AND operation is
performed on the mask value and sampled data value.)
All the mask bits are set to 1 during reset.
Enable After Event On
Enable the comparison specified by this panel after an event on
the specified item. You can specify one of the following:
• Disabled
• EDCA0, EDCA1, EDCA2, EDCA3
• Counter
• EED pins
• Enabled
If you select disabled, the IDE does not perform a comparison on
the sampled data value. If you select enabled, the IDE performs
the specified comparison if an event occurs on any of the items in
the list.
StarCore DSP Targeting Manual
ECM–167
En h a n c e d O n - C hi p Em u la ti o n ( EO nC E )
Event Counter panel
Table 9.3
Data Event Detection Channel Panel Description (continued)
Panel Item
Description
Access Width Selection
Indicates the width of the data access to watch.
The CodeWarrior IDE compares the masked data and the
reference value as follows, based on whether you specify byte,
word, or long:
• If you specify byte, the CodeWarrior IDE compares only the 8
least-significant bits of each value.
• If you specify word, the CodeWarrior IDE compares only the
16 least-significant bits of each value.
• If you specify long, the CodeWarrior IDE compares all 32 bits
of each value.
Event Counter panel
EOnCE has a 64-bit event counter that can count events related to
the following items:
• The address event detection channels
• The data event detection channel
• DEBUGEV instructions
• Trace buffer tracing
• Instruction execution
• The core clock
Figure 9.4 shows the Event Counter panel.
ECM–168
StarCore DSP Targeting Manual
En h a n c e d On - C h ip Em u la t i on ( E On C E )
Event Counter panel
Figure 9.4
Event Counter Panel
StarCore DSP Targeting Manual
ECM–169
En h a n c e d O n - C hi p Em u la ti o n ( EO nC E )
Event Selector panel
Table 9.4 describes the items that you can specify on the Event
Counter panel in the EOnCE Configurator.
Table 9.4
Event Counter Panel Description
Panel Item
Description
What to count
Tell the CodeWarrior IDE to count events on the following items:
• EDCA0, EDCA1, EDCA2, EDCA3
• EDCD
• Execution Set in DEBUGEV
• Trace Event
• Execution Sets
• Core Clock
Enable after Event On
Enable a count on an event for the item specified in the What to
count group after an event on the specified item. You can specify
one of the following:
• Disabled
• EDCA0, EDCA1, EDCA2, EDCA3
• EDCD
• EE2 pin
• Enabled
If you select Disabled, the IDE does not perform a count. If you
select Enabled, the IDE performs the count after an event occurs on
any of the items in the list.
Event Counter Value
Specify the first 32 bits of the counter value (the maximum value to
which to count).
Extension Counter Value
Specify the second 32 bits of the counter value (the maximum value
to which to count). To use a 64-bit counter value, you must enable
the checkbox next to this field.
Event Selector panel
The Event Selector panel specifies which events cause a particular
debugging action to occur. The debugging actions follow:
• Place the EOnCE module in debug mode
• Generate a debugging exception
• Enable the trace buffer
• Disable the trace buffer
ECM–170
StarCore DSP Targeting Manual
En h a n c e d On - C h ip Em u la t i on ( E On C E )
Event Selector panel
On the Event Selector panel, you can specify that after an event
occurs on one of the following items, the corresponding debugging
action occurs:
• Address event detection channels
• Data event detection channels
• Event counter
• EE pins
• DEBUGEV instructions
You also can specify that multiple events must occur to trigger a
particular debugging event.
Figure 9.5 shows the Event Selector panel.
Figure 9.5
Event Selector Panel
StarCore DSP Targeting Manual
ECM–171
En h a n c e d O n - C hi p Em u la ti o n ( EO nC E )
Event Selector panel
Table 9.5 describes the items that you can specify on the Event
Selector panel in the EOnCE Configurator.
Table 9.5
Event Selector Panel
Panel Item
Description
Event(s) to Enter DEBUG Mode
Select OR to indicate that any of the events chosen in DEBUG
Mode Mask place the EOnCE module in debug mode. Select
AND to indicate that all the events chosen in DEBUG Mode
Mask must occur to place the EOnCE module in debug mode.
DEBUG Mode Mask
Place the EOnCE module in debug mode after an event on one
or more specified items.
You can specify the following items:
• EDCA0, EDCA1, EDCA2, EDCA3
• DEBUGEV
• EE4, EE3, EE2, EE1, EE0
• Counter
• EDCD
Click Any to specify one item or All to specify multiple items.
Event(s) to Enter DEBUG Exception
Select OR to indicate that any of the events chosen in DEBUG
Exception Mask generate a debugging exception. Select AND
to indicate that all the events chosen in DEBUG Exception
Mask must occur to generate a debugging exception.
DEBUG Exception Mask
Generate a debug exception after an event on one or more
specified items.
You can specify the following items:
• EDCA0, EDCA1, EDCA2, EDCA3
• DEBUGEV
• EE4, EE3, EE2, EE1, EE0
• Counter
• EDCD
Click Any to specify one item or All to specify multiple items.
Event(s) to Enable Trace
ECM–172
Select OR to indicate that any of the events chosen in DEBUG
Enable Trace Mask enable the trace buffer. Select AND to
indicate that all the events chosen in DEBUG Enable Trace
Mask must occur to enable the trace buffer.
StarCore DSP Targeting Manual
En h a n c e d On - C h ip Em u la t i on ( E On C E )
Trace Unit panel
Table 9.5
Event Selector Panel (continued)
Panel Item
Description
DEBUG Enable Trace Mask
Enable tracing after an event on one or more specified items.
You can specify the following items:
• EDCA0, EDCA1, EDCA2, EDCA3
• DEBUGEV
• EE4, EE3, EE2, EE1, EE0
• Counter
• EDCD
Click Any to specify one item or All to specify multiple items.
Events to Disable Trace
Select OR to indicate that any of the events chosen in DEBUG
Disable Trace Mask disable the trace buffer. Select AND to
indicate that all the events chosen in DEBUG Disable Trace
Mask must occur to disable the trace buffer.
DEBUG Disable Trace Mask
Disable tracing after an event on one or more specified items.
You can specify the following items:
• EDCA0, EDCA1, EDCA2, EDCA3
• DEBUGEV
• EE4, EE3, EE2, EE1, EE0
• Counter
• EDCD
Click Any to specify one item or All to specify multiple items.
Trace Unit panel
With EOnCE, you can collect data in a trace buffer as you debug a
program. You can use the Trace Unit panel to choose the trace
buffer settings.
StarCore DSP Targeting Manual
ECM–173
En h a n c e d O n - C hi p Em u la ti o n ( EO nC E )
Trace Unit panel
Figure 9.6 shows the Trace Unit panel.
Figure 9.6
ECM–174
EOnCE Configurator Trace Unit Panel
StarCore DSP Targeting Manual
En h a n c e d On - C h ip Em u la t i on ( E On C E )
Trace Unit panel
Table 9.6 describes the items that you can specify on the Trace Unit
panel in the EOnCE Configurator.
Table 9.6
Trace Unit Panel Description
Panel Item
Description
Change of Flow Instructions
Enables a tracing mode that traces the addresses of execution
sets containing change of flow instructions (for example, a jump,
branch, or return to subroutine instruction). The CodeWarrior IDE
places the address of the first instruction of such an execution set
in the trace buffer.
Interrupt Vectors
Enables a tracing mode that traces the address of interrupt
vectors. When enabled, each service of an interrupt places the
following items in the trace buffer:
• The address of the last executed execution set (before the
interrupt)
• The address of the interrupt vector
Issue of Execution Set
Enables a tracing mode that traces the addresses of every issued
execution set. The only entry written to the trace buffer while
tracing in this mode is the first address of each execution set.
MARK Instruction
Enables the EOnCE MARK instruction, which writes the PC
(program counter) to the trace buffer if the trace buffer is enabled.
Trace Buffer Mode
Enables the trace buffer so that it collects data.
Hardware Loop
Enables a tracing mode that traces the addresses of hardware
loops. Every change of flow resulting from a loop puts the address
of the last address into the trace buffer.
Record Event Counter
Enables a tracing mode that causes each destination address
placed in the trace buffer to be followed immediately by the value
of the event counter register.
If you enable Buffer Counter and Buffer Extension Counter at the
same time, the value of the event counter register precedes the
value of the extension counter register in the trace buffer.
Record Ext. Event Counter
Enables a tracing mode that causes each destination address
placed in the trace buffer to be followed immediately by the value
of the extension counter register.
Enable Trace Reporter Window
Causes a Trace Reporter window to display when you debug a
program with EOnCE trace buffer settings selected.
StarCore DSP Targeting Manual
ECM–175
En h a n c e d O n - C hi p Em u la ti o n ( EO nC E )
EOnCE Example: Counting Factorial Function Calls
EOnCE Example: Counting Factorial Function
Calls
This example shows how to count calls to a factorial function in a
recursive factorial program.
To run the factorial program with an input of 7 and count the calls
to the factorial function five times using a regular software
breakpoint, you would set a breakpoint on the first line of the
factorial function. Each time the IDE reaches the breakpoint, it stops
and you must click the debug button to continue execution. This is a
time-consuming process.
Figure 9.7 shows the Thread window after counting the call to
factorial five times using a regular software breakpoint.
ECM–176
StarCore DSP Targeting Manual
En h a n c e d On - C h ip Em u la t i on ( E On C E )
EOnCE Example: Counting Factorial Function Calls
Figure 9.7
Thread Window: Counting with a Regular Software Breakpoint
However, when you use EOnCE, you can pre-set the condition
(count the call to the function five times) and location where you
want the IDE to count the call to the function. The count occurs
automatically each time execution reaches that location.
After the fifth call, the program stops executing and the IDE enters
debug mode. The example in this section discusses how to set up
this condition using EOnCE. After you set up the condition, you can
execute much faster than by starting the program running again
each time it stops on the breakpoint.
StarCore DSP Targeting Manual
ECM–177
En h a n c e d O n - C hi p Em u la ti o n ( EO nC E )
EOnCE Example: Counting Factorial Function Calls
This example includes the following topics, which you must
perform in the listed order:
1. Open the EOnCEDemo project
2. Download the EOnCEDemo project
3. Get the address of the instruction
4. Open the EOnCE Configurator
5. Configure the Address Event Detection Channel 0 panel
6. Configure the Event Counter panel
7. Configure the Event Selector panel
8. Save EOnCE Configurator settings
9. Run the EOnCE factorial count debugging example
Open the EOnCEDemo Project
To open the EOnCEDemo project:
1
If needed, open CodeWarriorTM for the StarCoreTM DSP.
2
Choose File > Open.
3
Navigate to the following directory:
Windows
Solaris
CodeWarrior_dir\Examples\StarCore\EOnCEDemo
install_dir/CodeWarrior_ver_dir/CodeWarrior_Examples/
EOnCEDemo
4
Select the project file (EOnCEDemo.mcp).
5
Click Open.
When you open the project, the IDE displays a Project window as
shown in Figure 9.8.
ECM–178
StarCore DSP Targeting Manual
En h a n c e d On - C h ip Em u la t i on ( E On C E )
EOnCE Example: Counting Factorial Function Calls
Figure 9.8
EOnCEDemo.mcp Project Window
Download the EOnCEDemo Project
To download the EOnCEDemo project, choose Project > Debug.
The IDE downloads the project to the target board, and the Thread
window appears as shown in Figure 9.9.
StarCore DSP Targeting Manual
ECM–179
En h a n c e d O n - C hi p Em u la ti o n ( EO nC E )
EOnCE Example: Counting Factorial Function Calls
NOTE
Figure 9.9
You must download your program to the target board before
configuring EOnCE debugging conditions.
Thread Window for the EOnCEDemo Project
Get the Address of the Instruction
To get the address of the instruction to specify as the location where
EOnCE counts the call to the factorial function:
ECM–180
StarCore DSP Targeting Manual
En h a n c e d On - C h ip Em u la t i on ( E On C E )
EOnCE Example: Counting Factorial Function Calls
1
In the Thread window, move the Current Statement arrow to the
first line of the factorial function (the instruction where you want to
set the breakpoint).
Figure 9.10 shows the Thread window after you move the arrow.
Figure 9.10
Current Statement Arrow: First Line of the Factorial Function
StarCore DSP Targeting Manual
ECM–181
En h a n c e d O n - C hi p Em u la ti o n ( EO nC E )
EOnCE Example: Counting Factorial Function Calls
2
At the bottom of the Thread window, click the Source pop-up menu
and choose Mixed.
The IDE displays a mixed view of C source and assembly code as
shown in Figure 9.11. The Current Statement arrow points to the
address of the instruction on which you want to set the breakpoint.
Figure 9.11
ECM–182
Thread Window Displaying a Mixed Code View
StarCore DSP Targeting Manual
En h a n c e d On - C h ip Em u la t i on ( E On C E )
EOnCE Example: Counting Factorial Function Calls
3
Write down the address value for the instruction immediately
preceding the location to which the Current Statement arrow points.
4
Switch back to the source view.
5
Move the Current Statement arrow to the first statement in the main
function.
Figure 9.12 shows the appearance of the Thread window after you
make the change.
Figure 9.12
Current Statement Arrow on the First Statement in main()
StarCore DSP Targeting Manual
ECM–183
En h a n c e d O n - C hi p Em u la ti o n ( EO nC E )
EOnCE Example: Counting Factorial Function Calls
6
At the bottom of the Thread window, click the Source pop-up menu
and choose Mixed.
Figure 9.13 shows the appearance of the Thread window after you
make the change.
Figure 9.13
ECM–184
Thread Window Displaying a Mixed Code View
StarCore DSP Targeting Manual
En h a n c e d On - C h ip Em u la t i on ( E On C E )
EOnCE Example: Counting Factorial Function Calls
Open the EOnCE Configurator
You can use the EOnCE Configurator to set various conditions to
perform EOnCE debugging.
To open the EOnCE Configurator, choose Debug > EOnCE >
EOnCE Configurator.
The IDE displays the EOnCE Configurator window as shown in
Figure 9.14.
Figure 9.14
EE Pins Controller Panel
The window initially displays the EE Pins Controller panel, which
you can use to configure the EOnCE controller, specifically the EE
pins. EE pins are general-purpose pins that can serve as input or
output pins to the EOnCE.
StarCore DSP Targeting Manual
ECM–185
En h a n c e d O n - C hi p Em u la ti o n ( EO nC E )
EOnCE Example: Counting Factorial Function Calls
NOTE
For this example, the settings on the EE Pins Controller panel are
not relevant; do not change them.
Configure the Address Event Detection Channel 0 Panel
To choose settings for the address event detection channel 0 by
configuring the Address Event Detection Channel 0 panel:
1
Click the EDCA0 tab.
The IDE displays the chosen panel as shown in Figure 9.15.
Figure 9.15
2
NOTE
ECM–186
Address Event Detection Channel 0 Panel
To set a breakpoint on an instruction, click PC as the Bus Selection.
When selecting settings in the EOnCE Configurator, configure the
tabbed panels in the left-to-right order of the tabs. For example,
StarCore DSP Targeting Manual
En h a n c e d On - C h ip Em u la t i on ( E On C E )
EOnCE Example: Counting Factorial Function Calls
configure the Address Event Detection Channel 0 panel before
configuring the Event Counter panel. In addition, within a panel,
configure your selected settings from the left-top to right-bottom
position.
3
Type the address value of the instruction you previously noted in
the Comparator A field in hexadecimal format.
4
For Enable after Event On, click Enabled.
For the other settings, use the defaults. The panel now appears as
shown in Figure 9.16.
Figure 9.16
Address Event Detection Channel 0 after Changing Settings
StarCore DSP Targeting Manual
ECM–187
En h a n c e d O n - C hi p Em u la ti o n ( EO nC E )
EOnCE Example: Counting Factorial Function Calls
Configure the Event Counter Panel
To configure the Event Counter panel to count a particular event on
address channel 0:
1
Click the Counter tab to display the Event Counter panel.
The IDE displays the Event Counter panel as shown in Figure 9.17.
Figure 9.17
Event Counter Panel
By default, the Event Counter panel specifies to count EDC0
(address channel 0, which corresponds with the Address Event
Detection Channel 0 panel that you just configured and is correct for
this example).
2
ECM–188
For Enable after Event On, click Enabled.
StarCore DSP Targeting Manual
En h a n c e d On - C h ip Em u la t i on ( E On C E )
EOnCE Example: Counting Factorial Function Calls
3
Type the hexadecimal value for how many times you want to count
in the Event Counter Value (Hex 32 bits) field. For this example,
type:
0x5
Figure 9.18 shows the appearance of the Event Counter panel after
your changes.
Figure 9.18
Event Counter Panel after Changing Settings
Configure the Event Selector Panel
To configure the Event Selector panel:
1
Click the Selector tab to display the Event Selector panel.
The IDE displays the Event Selector panel as shown in Figure 9.19.
StarCore DSP Targeting Manual
ECM–189
En h a n c e d O n - C hi p Em u la ti o n ( EO nC E )
EOnCE Example: Counting Factorial Function Calls
Figure 9.19
Event Selector Panel
The default setting for Event(s) to Enter DEBUG Mode is OR, which
is correct for this example.
2
In DEBUG Mode Mask, click the COUNT checkbox (to enable it).
The Event(s) to Enter DEBUG Mode setting and the DEBUG Mode
Mask setting halt the CPU and cause the EOnCE module to enter
debug mode when the condition or conditions that you set are met.
Figure 9.20 shows the appearance of the Event Selector panel after
this change.
ECM–190
StarCore DSP Targeting Manual
En h a n c e d On - C h ip Em u la t i on ( E On C E )
EOnCE Example: Counting Factorial Function Calls
Figure 9.20
Event Selector Panel after Changing Settings
Save the EOnCE Configurator Settings
To save your changes, click OK in the EOnCE Configurator
window.
Run the EOnCE Factorial Count Debugging Example
To run the EOnCE debugging example, select Project > Run.
The debugger executes the program, and five calls to the factorial
function appear in the Stack Crawl pane before the program stops
running and enters debug mode.
Figure 9.21 shows the appearance of the Thread window after you
run the debugging example.
StarCore DSP Targeting Manual
ECM–191
En h a n c e d O n - C hi p Em u la ti o n ( EO nC E )
EOnCE Example: Using the Trace Buffer
Figure 9.21
Thread Window after Running the Debugging Example
In this example, the program halted in debug mode; therefore, you
can continue debugging from that point.
EOnCE Example: Using the Trace Buffer
This example shows how to capture data in the EOnCE trace buffer
and examine it.
ECM–192
StarCore DSP Targeting Manual
En h a n c e d On - C h ip Em u la t i on ( E On C E )
EOnCE Example: Using the Trace Buffer
This section includes the following topics, which you must perform
in the listed order:
1. Open the EOnCEDemo project
2. Download the EOnCEDemo project
3. Set a breakpoint
4. Run to the breakpoint
5. Open the EOnCE Configurator
6. Configure a trace
7. Save EOnCE Configurator settings
8. Run the EOnCE trace buffer debugging example
Open the EOnCEDemo Project
To open the EOnCEDemo project:
1
If needed, open CodeWarriorTM for the StarCoreTM DSP.
2
Choose File > Open.
3
Navigate to the following directory:
Windows
Solaris
CodeWarrior_dir\Examples\StarCore\EOnCEDemo
install_dir/CodeWarrior_ver_dir/CodeWarrior_Examples/
EOnCEDemo
4
Select the project file (EOnCEDemo.mcp).
5
Click Open.
The IDE displays a Project window as shown in Figure 9.22.
StarCore DSP Targeting Manual
ECM–193
En h a n c e d O n - C hi p Em u la ti o n ( EO nC E )
EOnCE Example: Using the Trace Buffer
Figure 9.22
EOnCEDemo.mcp Project Window
Download the EOnCEDemo Project
To download the EOnCEDemo project, choose Project > Debug.
The IDE downloads the project to the target board, and the Thread
window appears as shown in Figure 9.23.
ECM–194
StarCore DSP Targeting Manual
En h a n c e d On - C h ip Em u la t i on ( E On C E )
EOnCE Example: Using the Trace Buffer
NOTE
Figure 9.23
You must download your program to the target board before
configuring EOnCE debugging conditions.
Thread Window for the EOnCEDemo Project
Set a Breakpoint
Click on the gray dash next to the following line of code in the
Thread window to set a breakpoint:
StarCore DSP Targeting Manual
ECM–195
En h a n c e d O n - C hi p Em u la ti o n ( EO nC E )
EOnCE Example: Using the Trace Buffer
int result = factorial (7);
Figure 9.24 shows the Thread window after you set the breakpoint.
Figure 9.24
Thread Window after Setting the Breakpoint
Run to the Breakpoint
Choose Project > Run to run to the breakpoint you previously set.
Figure 9.25 shows the Thread window after running to the
breakpoint.
ECM–196
StarCore DSP Targeting Manual
En h a n c e d On - C h ip Em u la t i on ( E On C E )
EOnCE Example: Using the Trace Buffer
Figure 9.25
Thread Window after Running to the Breakpoint
Open the EOnCE Configurator
You can use the EOnCE Configurator to set the various conditions
to perform EOnCE debugging.
To open the EOnCE Configurator, choose Debug > EOnCE >
EOnCE Configurator.
The IDE displays the EOnCE Configurator window as shown in
Figure 9.26.
StarCore DSP Targeting Manual
ECM–197
En h a n c e d O n - C hi p Em u la ti o n ( EO nC E )
EOnCE Example: Using the Trace Buffer
Figure 9.26
EE Pins Controller Panel
The window initially displays the EE Pins Controller panel, which
you can use to configure the EOnCE controller, specifically the EE
pins. EE pins are general-purpose pins that can serve as input or
output pins to the EOnCE.
NOTE
For this example, the default settings for the EE Pins Controller
panel as shown in Figure 9.26 are correct; do not change them.
Configure a Trace
To configure the trace for this example:
1
Click the Trace tab to display the Trace Unit panel.
Figure 9.27 shows the initial Trace Unit panel.
ECM–198
StarCore DSP Targeting Manual
En h a n c e d On - C h ip Em u la t i on ( E On C E )
EOnCE Example: Using the Trace Buffer
Figure 9.27
2
EOnCE Configurator Trace Unit Panel
Click the Change of Flow Instructions checkbox to enable it.
This enables a trace on anything that changes the instruction flow
(for example, a jump, branch, or return to subroutine instruction).
3
Click the Trace Buffer Mode checkbox to enable it.
4
Click the Enable Trace Reporter Window checkbox to enable it.
Figure 9.28 shows the Trace Unit panel after configuration.
StarCore DSP Targeting Manual
ECM–199
En h a n c e d O n - C hi p Em u la ti o n ( EO nC E )
EOnCE Example: Using the Trace Buffer
Figure 9.28
EOnCE Configurator Trace Unit Panel after Configuration
Save the EOnCE Configurator Settings
To save your changes, click OK in the EOnCE Configurator
window.
Run the EOnCE Trace Buffer Debugging Example
To run the EOnCE trace buffer debugging example, choose Debug
> Step Over.
The IDE steps over one instruction.
The debugger displays an EOnCE Trace Reporter window. Figure
9.29 shows the appearance of the EOnCE Trace Reporter window.
ECM–200
StarCore DSP Targeting Manual
En h a n c e d On - C h ip Em u la t i on ( E On C E )
EOnCE Example: Using the Trace Buffer
Figure 9.29
EOnCE Trace Reporter Window
StarCore DSP Targeting Manual
ECM–201
En h a n c e d O n - C hi p Em u la ti o n ( EO nC E )
EOnCE Example: Using the Trace Buffer
ECM–202
StarCore DSP Targeting Manual
10
Code Profiler
This chapter describes how to use the CodeWarrior code profiler to
collect statistics and information about your code
The topics in this chapter are:
• Profiler Examples
• Launching the Profiler
• Opening a Profiler Sessions Window
• Removing a Profiler Session
• Removing All Profiler Sessions
• View a List of Functions
• View an Instruction-Level Report
• View Function Details
• View a Function Call Tree
• View Source Files Information
• View Profile Information Line by Line
• Save a Profile
• Load a Profile
• Generate a Tab-Delimited Profiling Report
• Generate an HTML Profiling Report
• Generate an XML Profiling Report
• Set Up to Profile Assembly Language Programs
Profiler Examples
The following directory contains example programs that you can
compile and examine with the profiler:
CodeWarrior_dir\Examples\StarCore\Profiler
StarCore DSP Targeting Manual
ECM–203
C o de Pr o f iler
Launching the Profiler
Launching the Profiler
Before using the profiler, you must compile your executable file
with symbolics in the output file.
The IDE automatically does this when you indicate in the Debug
column of the Project window that the IDE should generate
debugging information for a given file before compiling your code.
(Use the -g command line switch if you are compiling on the
command line).
NOTE
If your program makes printf calls to stdout, the output appears
in a standard IDE I/O window. (This can be useful for marking the
progress of your profiling execution.)
After you compile your program correctly, you can launch the
profiler.
To launch the profiler:
1
Open a project.
2
Select the Launch Profiler checkbox on the SC100 Debugger Target
panel.
3
Choose Project > Debug.
The IDE displays the Profiler Sessions window (Figure 10.1), which
contains a list of open profiler sessions.
ECM–204
StarCore DSP Targeting Manual
C od e Pr o f ile r
Launching the Profiler
Figure 10.1
Profiler Sessions Window
The check mark in the Profiler Sessions window indicates the
currently active session.
The IDE begins executing your program and displays a standard
Thread window similar to the one shown in Figure 10.2.
NOTE
You can use all the standard IDE debugging commands after the
Thread window appears.
StarCore DSP Targeting Manual
ECM–205
C o de Pr o f iler
Launching the Profiler
Figure 10.2
NOTE
Thread Window Displayed after Starting the Profiler
When you debug a multi-core project, the project that specifies the
location of the other projects that are part of the multi-core project
on its Other Executables target settings panel is the master
project.
If you are debugging a multi-core project, downloading the master
project may cause the other projects in the multi-core project to be
downloaded as well. In this case, if you are using the profiler to
ECM–206
StarCore DSP Targeting Manual
C od e Pr o f ile r
Opening a Profiler Sessions Window
download the master project, the profiler profiles all the projects in
the multi-core project. Each of those projects has a separate listing
in the Profiler Sessions window.
Opening a Profiler Sessions Window
To open the Profiler Sessions window, choose Profiler > Sessions.
Removing a Profiler Session
To remove a profile from the Profiler Sessions window (Figure 10.1),
perform these steps:
1
Figure 10.3
2
Click the name of any profiler session to highlight it. Figure 10.1
shows a Profiler Sessions window after highlighting the session.
Profiler Sessions Window with Session Name Highlighted
Click Remove.
The IDE removes the session from the Profiler Sessions window and
closes all other profiler windows related to that session. Figure 10.4
shows the Profiler Sessions window after you delete the chosen
session.
StarCore DSP Targeting Manual
ECM–207
C o de Pr o f iler
Removing All Profiler Sessions
Figure 10.4
Profiler Sessions Window After Removing a Session
Removing All Profiler Sessions
To remove all profiler sessions from a Profiler Sessions window
(Figure 10.1), click Remove All.
Figure 10.5
Profiler Sessions Window
The IDE removes all sessions from the Profiler Sessions window
and closes all other profiler windows related to those sessions.
ECM–208
StarCore DSP Targeting Manual
C od e Pr o f ile r
View a List of Functions
View a List of Functions
To view a list of functions, perform any of these actions:
• Choose Profiler > Functions.
NOTE
The IDE applies the Functions command to the currently selected
profile in the Profiler Sessions window (indicated by a check mark
next to the name of the session).
• In the Profiler Sessions window, highlight the name of a profiler
session and click Open.
• In the Profiler Sessions window, double-click the name of a
profiler session.
The CodeWarrior IDE displays a list of functions window similar to
the one shown in Figure 10.14.
StarCore DSP Targeting Manual
ECM–209
C o de Pr o f iler
View an Instruction-Level Report
Figure 10.6
The List of Functions Window
View an Instruction-Level Report
To view an instruction-level report, choose Profiler > Instructions.
NOTE
The IDE applies the Instructions command to the currently selected
profile in the Profiler Sessions window (indicated by a check mark
next to the name of the session).
An Instruction-Level Report window similar to the one in Figure
10.9 appears.
ECM–210
StarCore DSP Targeting Manual
C od e Pr o f ile r
View Function Details
Figure 10.7
Instruction-Level Report Window
The Instruction-Level Report window contains the following types
of information:
• The number of instructions executed
• The number of instructions executed without change of flow
instructions
• The number of instruction sets executed
• A list of executed instructions grouped by type
• A parallel ratio that is calculated by dividing the total number of
instructions without change-of-flow instructions by the total
number of instruction sets without change-of-flow instructions.
View Function Details
To view detailed information about a function, double-click a
function in a List of Functions window or a Function Call Tree
window.
The Function Details window appears as shown in Figure 10.8.
StarCore DSP Targeting Manual
ECM–211
C o de Pr o f iler
View Function Details
Figure 10.8
The Function Details Window
The Function Details window displays information (in graphical
and tabular formats) about:
• A particular function
• The immediate callers of that function
• Descendants of that function
For the selected function, the Function Details window displays
detailed performance information. The pie chart represents the
percentage of total execution time used by the function and its
descendants.
ECM–212
StarCore DSP Targeting Manual
C od e Pr o f ile r
View a Function Call Tree
For caller functions, the Function Details window displays the
following information:
• A list of immediate callers
• The number of times each caller performed a call to the selected
function
• Propagated time for callers: the amount of time each caller
contributed to the function + descendants (F+D) time of the
selected function
• The percentage of time spent in the selected function and its
descendants on behalf of the caller
• A pie chart that displays the percentage of time used by each
caller
For descendant functions, the Function Details window displays the
following information:
• A list of immediate descendants
• The number of times the selected function called each
descendant function
• Propagated time for descendants: the amount of time each
descendant contributed to the function + descendants (F+D)
time of the selected function
• The percentage of time each descendant contributed to the total
F+D time
• A pie chart that displays the percentage of time used by each
descendant
NOTE
To open a new Function Details window for a descendant or caller,
double-click any line in the Caller or Descendant tables.
View a Function Call Tree
To view a function call tree, choose Profiler > Function Call Tree.
NOTE
The IDE applies the Function Call Tree command to the currently
selected profile in the Profiler Sessions window (indicated by a
check mark next to the name of the session).
StarCore DSP Targeting Manual
ECM–213
C o de Pr o f iler
View Source Files Information
A Function Call Tree window similar to the one in Figure 10.9
appears.
Figure 10.9
The Function Call Tree Window
The Function Call Tree window shows the dynamic call structure of
a program. This window also highlights the path from the most
expensive function. (Red entries indicate the more expensive paths.)
NOTE
You can open a Function Details window for a function by doubleclicking the function name in the Function Call Tree window.
View Source Files Information
To display source files information for the current profile session,
choose Profiler > Source Files.
ECM–214
StarCore DSP Targeting Manual
C od e Pr o f ile r
View Profile Information Line by Line
NOTE
The IDE applies the Source Files command to the currently selected
profile in the Profiler Sessions window (indicated by a check mark
next to the name of the session).
A Source Files window similar to the one in Figure 10.10 appears.
Figure 10.10
The Source Files Window
The Source Files window displays directory and file information for
all files included in the current profile session.
NOTE
You can view profile information line by line by double-clicking on a
source file in the Source Files window.
View Profile Information Line by Line
To view profile information line by line, double-click on a source file
in the Source Files window. (Figure 10.11 shows an example of a
Source Files window.)
StarCore DSP Targeting Manual
ECM–215
C o de Pr o f iler
View Profile Information Line by Line
Figure 10.11
The Source Files Window
A Profile Line-by-Line window appears as shown in Figure 10.12.
ECM–216
StarCore DSP Targeting Manual
C od e Pr o f ile r
Save a Profile
Figure 10.12
Profile Line-by-Line Window
For each line of source code, this window displays the number of
calls made (in the Count column) and the time in instruction cycles
(in the Time column).
This window also uses colored marks to indicate the most heavily
used lines in the Time column. The marks range in color from white
to red; the most time-consuming lines use red marks.
NOTE
Examining profile information line by line is not available for
assembly sources for this release.
Save a Profile
To save a profile:
1
Choose Profiler > Save.
A Save As dialog box appears as shown in Figure 10.13.
StarCore DSP Targeting Manual
ECM–217
C o de Pr o f iler
Load a Profile
Figure 10.13
2
Save As Dialog Box
Use the dialog box to save your file in the directory of your choice.
Load a Profile
To load a previously saved profile:
1
Choose Profiler > Load.
A standard dialog box appears.
2
If needed, use the dialog box to navigate to the directory that
contains the profile. Otherwise, go to step 3.
3
Select the profile and click Open.
The Profiler Sessions window appears. The window contains the
name of the profiler session that you specified.
4
ECM–218
Click on the session in the Profiler Sessions window.
StarCore DSP Targeting Manual
C od e Pr o f ile r
Generate a Tab-Delimited Profiling Report
5
Click Open.
The CodeWarrior IDE displays a list of functions window similar to
the one shown in Figure 10.14 that contains the information for your
previously saved profile.
Figure 10.14
The List of Functions Window
Generate a Tab-Delimited Profiling Report
To generate a tab-delimited profiling report:
1
Choose Profiler > Export.
The Print Report window appears.
2
Select Tab delimited in the Print Report window as shown in Figure
10.15.
StarCore DSP Targeting Manual
ECM–219
C o de Pr o f iler
Generate an HTML Profiling Report
Figure 10.15
Print Report Window with Tab delimited Selected
3
Click OK.
4
Choose a location to save the file.
This tells the profiler where to place the tab-delimited output file
(named prog_report.td). The profiler overwrites the file if it
already exists.
You can open a tab-delimited report in a standard text editor or
spreadsheet application. The report contains profiling information
for functions as well as source code profiling by line.
Generate an HTML Profiling Report
To generate a profiling report in HTML:
1
Choose Profiler > Export.
The Print Report window appears.
2
ECM–220
Select HTML in the Print Report window as shown in Figure 10.16.
StarCore DSP Targeting Manual
C od e Pr o f ile r
Generate an HTML Profiling Report
Figure 10.16
Print Report Window with HTML Selected
3
Click OK.
4
Choose a location to save the file.
This tells the profiler where to place the HTML output files and the
java class file needed to draw charts. The profiler overwrites the
HTML output files and java class file if they already exist.
5
To view the report, open index.html in the directory where you
saved the report.
Figure 10.17 shows an example of an HTML report.
StarCore DSP Targeting Manual
ECM–221
C o de Pr o f iler
Generate an XML Profiling Report
Figure 10.17
Viewing an HTML Profiling Report in a Web Browser
Generate an XML Profiling Report
To generate a profiling report in XML:
1
Choose Profiler > Export.
The Print Report window appears.
ECM–222
StarCore DSP Targeting Manual
C od e Pr o f ile r
Generate an XML Profiling Report
2
Figure 10.18
Select XML in the Print Report window as shown in Figure 10.18.
Print Report Window with XML Selected
3
Click OK.
4
Choose a location to save the file.
This tells the profiler where to place the report (named
report.xml). The report contains the XML output for the function
call tree with number of calls made, function time, and time for
child functions.
NOTE
To view report.xml, you must use Internet Explorer version 5.0 or
greater.
Figure 10.19 shows an example of an XML report.
StarCore DSP Targeting Manual
ECM–223
C o de Pr o f iler
Set Up to Profile Assembly Language Programs
Figure 10.19
Viewing an XML Profiling Report in a Web Browser
Set Up to Profile Assembly Language Programs
To get profiling results from an assembly language program:
1
Use the following syntax for assembly language functions:
global func_name
func_name type func
function_source_code
Ffunc_name_end
2
ECM–224
Adhere to the following items:
StarCore DSP Targeting Manual
C od e Pr o f ile r
Set Up to Profile Assembly Language Programs
• Call or jump to the subroutine by only one change-of-flow
instruction.
• Provide only one entry point for the function you want to profile
(the first subroutine instruction).
• Return from the subroutine by only one change-of-flow
instruction.
StarCore DSP Targeting Manual
ECM–225
C o de Pr o f iler
Set Up to Profile Assembly Language Programs
ECM–226
StarCore DSP Targeting Manual
11
Debugging Optimized
Code
The CodeWarrior debugger can match the optimized final code to
its original source, thereby providing source-level debugging for
optimized code.
This chapter describes these features for debugging optimized code.
• Code Mapping View Window
• Run Control for Optimized Code
Code Mapping View Window
The code mapping view (CMV) window is a debugging tool that
displays a side-by-side view of the disassembly of generated
assembly instructions and the original source statements. It is only
available if you are debugging. To access it, select View > Code
Mapping View while debugging.
The CMV window and the debugger window are synchronized.
However, the debugger window lacks certain run control and
breakpoint options that the CMV provides, such as optimized code
step evaluators, multiple program counter arrows, and various
optimized code breakpoints.
Because of these additional features, we recommend that you debug
your optimized code using the CMV window instead of the
debugger window.
• Viewing the Code Mapping Window
• User Interface of the Code Mapping Window
• Analyzing Optimized Code
StarCore DSP Targeting Manual
TSC–227
Viewing the Code Mapping Window
To begin using the Code Mapping window, follow these steps:
1
Choose Project > Debug to start a debugging session.
2
Choose View > Code Mapping View.
The Code Mapping window appears.
Figure 11.1
Code Mapping Window
User Interface of the Code Mapping Window
The Code Mapping window contains the following user interface
elements:
Expanded Step Controls
Run Control options include the standard debugger run
control commands, plus expanded step controls.
Table 11.1
Expanded Step Controls
Step Naive
Step Next
TSC–228
StarCore DSP Targeting Manual
Table 11.1
Expanded Step Controls
Step Forward
Step After End of Statement
Step After All Previous
Address Bar
The address bar contains these interface elements:
• Swap Panes
The Swap Panes button
toggles between displaying
source code in the right pane and displaying source code in
the left pane.
• Find address/function
Type a function name or address location to locate the
corresponding side-by-side view. If you type in an address, it
must be in C hexadecimal notation (for example, 0xffff).
• Other locations
If an address is currently selected, this list box displays the
complete list of source code line numbers that correspond to
the current address, if any.
If a source code line is currently selected, this list box
displays the complete list of addresses that correspond to the
current source code line, if any.
Pane Controls
The source and instruction view panes (Figure 11.2) contain
these interface elements:
StarCore DSP Targeting Manual
TSC–229
Figure 11.2
Line
View Pane Elements
Text
Program Counter
Address
Opcode
Disassembly
Program Counter
Breakpoint
Breakpoint
• Breakpoint
Displays the breakpoints associated with a line of source or
assembly.
• Program Counter
Displays the program counters associated with a line of
source or assembly.
• Line
The line number of the original source.
• Text
The source code from the original project.
• Address
The hexadecimal address of the generated opcode.
• Opcode
The opcode generated from the source file. Several opcodes
often correspond to each line of source code.
• Disassembly
The disassembled instruction of the corresponding opcode.
Analyzing Optimized Code
The Code Mapping View lets you analyze optimized code in several
ways:
View Corresponding Statements
Click a statement line in the source pane to highlight the
corresponding disassembly in green.
TSC–230
StarCore DSP Targeting Manual
Click an instruction address in the assembly pane to highlight the
corresponding source instructions in blue.
The Other Locations list box lets you browse the complete list of
corresponding statement lines or disassembly addresses.
Evaluate Run Control
Right-click a statement line to open the Evaluate Run Control dropdown menu. The options in the run control menu let you preview
the results of step commands. Unlike the regular program counter
, the preview program counters appear as a hollow arrow .
Run Control for Optimized Code
Optimized code does not follow the same flow as your source code.
To help us navigate optimized code, we use special breakpoints and
step functions.
• Breakpoints
• Step Functions
Breakpoints
There are four different breakpoint that help you debug optimized
code in the code mapping view.
• Break Naive
• Break Begin of Statement
• Break End of Statement
• Break After All Previous
There are also two new representations for breakpoints.
• Shadow Breakpoints
• Half-Shaded Breakpoints
Break Naive
A break naive breakpoint sets breaks on all the assembly
instructions or source statements that correspond to the current line.
StarCore DSP Targeting Manual
TSC–231
Break Begin of Statement
A break-begin-of-statement breakpoint sets a break on the first
instruction that the compiler generated for the current statement.
Break End of Statement
A break-end-of-statement breakpoint sets a break on the first
instruction that is the beginning of a source statement.
Break After All Previous
A break-after-all-previous breakpoint sets a break at a location that
is free from any side effects of statements that are still executing.
The OCD engine places the break at the nearest location where the
current statement and all its predecessors will have completed
execution.
Shadow Breakpoints
When you set a breakpoint, the debugger sometimes creates
shadow breakpoints elsewhere in the source. The debugger creates
shadow breakpoints in two situations:
• If you set a break on an instruction, the shadow breakpoints
appear on the corresponding source statements.
• If you set a breakpoint on a statement that generates instructions
that also correspond to other source statements, the shadow
breakpoints appear on the corresponding source statements.
The debugger represents shadow breakpoints with the
dot with small black dots in the corners.
icon, a red
You can remove a shadow breakpoint by clicking it, but doing so
also removes the original breakpoint and any other related shadow
breakpoints. The debugger prompts you for confirmation before
removing a shadow breakpoint.
Half-Shaded Breakpoints
The code mapping view lets you set breakpoints on lines that do not
have an equivalent in the source pane of the debugger window.
Such breakpoints are represented by the icon, a half-shaded red
dot. As there are no source pane equivalents, these breakpoints will
not appear in the debugger window. Half-shaded breakpoints can
only be cleared from the assembly pane of the CMV window.
TSC–232
StarCore DSP Targeting Manual
Step Functions
All stepping modes, especially Step After All Previous, have the
potential to reach the end of the current function. If this function is
main(), it may end the program. Using the step evaluation
functions of the code mapping view can help you identify such
instances.
• Step Naive
• Step Next
• Step Forward
• Step After End of Statement
• Step After All Previous
Step Naive
The Step Naive command steps to the first instruction of the next
statement in the source code.
Step Next
The Step Next command steps to the next source statement whose
instructions come after the current instruction.
Figure 11.3
Examples of Step Next
Source
Code
Line
1
2
3
4
5
6
7
8
9
Instruction Address
1
2
3
4
5
6
7
8
In the example shown in Figure 11.3, these are the reasons why the
step next function stops at certain instruction addresses.
1. Execution starts at address1, line1
2.a. It passes address2, line3 because line2 has not been executed
2.b. It stops on address3, line2 because line2 is the closest line to
line1 that has not been executed.
StarCore DSP Targeting Manual
TSC–233
3.a. It passes address4; line8 because lines 4-7 have not been
executed
3.b. It passes address5; line2, because it already stopped at line2.
3.c. It stops on address6; line4 because it is the closest line to line2
that has not been executed
4. It stops on address7; line5 and line7 because line5 is the closest
line to line4 that has not been executed.
5. It stops on address8; line9 because it is the closest line to line5
that has not been executed. It does not matter in this case if you
stepped from line5 or line7 to reach this point, because line6 was
optimized out. However, it can be important in other cases. The
OCD algorithm selects the lowest line number unless you specify
otherwise. To specify a different line, click its number in the CMV
source pane.
Step Forward
The Step Forward command steps to the next instruction address
where the corresponding statement comes after the current
statement.
Figure 11.4
Examples of Step Forward
Source
Code
Line
1
2
3
4
5
6
7
8
9
Instruction Address
1
2
3
4
5
6
7
8
In the example shown in Figure 11.4, these are the reasons why the
step forward function stops at certain instruction addresses.
1. Execution starts at address1; line1
2. It stops on address2; line3 because it is the first address of a line
that follows line1.
3. It passes address3; line2 because this line precede line3.
3.b. It stops on address4; line8 because it is the first address of a line
that follows line3.
TSC–234
StarCore DSP Targeting Manual
4. It passes address5-address7 because their corresponding lines
precede line8.
5. It stops on address8; line9 because it is the first address of a line
that follows line8.
Step After End of Statement
The Step After End of Statement command steps to the first
instruction of the next source statement whose instruction has not
yet been executed.
Figure 11.5
Examples of Step After End of Statement
Source
Code
Line
1
2
3
4
5
6
7
8
9
Instruction Address
1
2
3
4
5
6
7
8
In the example shown in Figure 11.5, these are the reasons why the
step after end of statement function stops at certain instruction
addresses.
1. Execution starts at address1; line1.
2. It stops on address2; line3 because it is the first instruction that
appears after all of line1’s instructions have been executed, and
because line3 succeeds line1.
3.a. It passes address3-address5 because line2 precedes line3, and
its execution does not end until address5.
3.b. It stops on address6; line4 because it is the first instruction that
appears after all of line3’s instructions have been executed, and
because line4 succeeds line3.
4. It stops on address7; line5 and line7 because it is the first
instruction that appears after all of line4’s instructions are executed,
and because line5 and line7 succeed line4.
5. It stops on address8; line9, because it is the first instruction that
appears after all of line5’s instructions are executed, and because
line9 succeeds line5.
StarCore DSP Targeting Manual
TSC–235
Step After All Previous
The Step After All Previous command steps to the next statement
that is free from the side effects of instructions that are still
executing.
Figure 11.6
Examples of Step After All Previous
Source
Code
Line
1
2
3
4
5
6
7
8
9
Instruction Address
1
2
3
4
5
6
7
8
In the example shown in Figure 11.6, these are the reasons why the
step after all previous function stops at certain instruction
addresses.
1. Execution starts at address1;line1.
2. It stops on address2; line3 because it is the first instruction that
appears after line1 is executed, and because there are no lines that
precede line1.
3.1 It passes address3 and address4 because line2 precedes line3,
and line2 still has instructions that are executing.
3.2 It stops on address5; line5 and line7 because it is the first
instruction that appears after the last instruction of line3 is
executed, and because the execution of all lines previous to line3 is
over at this point
4a. It passes address6; line4 because line4 precedes line5, and line4
still has instructions that are executing.
4.b. It stops on address7; line8 because it is the first instruction that
appears after the last instruction of line5 is executed, and because
the execution of all lines previous to line5 is over at this point.
5. It stops on address8; line9 because it is the first instruction that
appears after the last instruction of line8 is executed, and because
the execution of all lines previous to line8 is over at this point.
TSC–236
StarCore DSP Targeting Manual
12
High-Speed Simultaneous
Transfer and Data
Visualization
This chapter describes the methods used for High-Speed
Simultaneous Transfer (HSST) and for Data Visualization.
• HSST
• Data Visualization
HSST
High-Speed Simultaneous Transfer (HSST) facilitates data transfer
between low-level targets (hardware or simulator) and host-side
client applications. The data transfer occurs without stopping the
core. The host-side client application must be an IDE plug-in or a
script run through the command-line debugger.
To use HSST, launch the target side application from the debugger.
The debugger automatically enables HSST communications as
required.
• Host-Side Client Interface
• Target Library Interface
Host-Side Client Interface
This section describes the API calls for using High-Speed
Simultaneous Transfer (HSST) from your host-side client
application.
StarCore DSP Targeting Manual
ECM–237
H ig h - Sp eed S im u ltan eo u s T r an sfer an d D a ta Vi su ali za t io n
hsst_open
hsst_open
A host-side client application uses this function to open a
communication channel with the low-level target. Opening a
channel that has already been opened will result in the same
channel ID being returned.
HRESULT hsst_open (
const char* channel_name,
size_t *cid );
channel_name
This parameter specifies the communication channel name.
cid
This parameter specifies the channel ID associated with the
communication channel.
Returns
This function returns S_OK if the call succeeds or S_FALSE if the
call fails.
hsst_close
A host-side client application uses this function to close a
communication channel with the low-level target.
HRESULT hsst_close ( size_t channel_id ) ;
channel_id
This parameter specifies the channel ID of the communication
channel to close.
Returns
ECM–238
This function returns S_OK if the call succeeds or S_FALSE if the
call fails.
StarCore DSP Targeting Manual
H ig h - Sp e e d S im u l ta n e o u s T r a n s fe r a n d D a ta Vi s u a l i za ti o n
hsst_read
hsst_read
A host-side client application uses this function to read data sent by
the target application without stopping the core.
HRESULT hsst_read (
void *data,
size_t size,
size_t nmemb,
size_t channel_id,
size_t *read );
data
This parameter specifies the data buffer into which data is read.
size
This parameter specifies the size of the individual data elements
to read.
nmemb
This parameter specifies the number of data elements to read.
channel_id
This parameter specifies the channel ID of the communication
channel from which to read.
read
This parameter contains the number of data elements read.
Returns
This function returns S_OK if the call succeeds or S_FALSE if the
call fails.
StarCore DSP Targeting Manual
ECM–239
H ig h - Sp eed S im u ltan eo u s T r an sfer an d D a ta Vi su ali za t io n
hsst_write
hsst_write
A host-side client application uses this function to write data that
the target application can read without stopping the core.
HRESULT hsst_write (
void *data,
size_t size,
size_t nmemb,
size_t channel_id,
size_t *written );
data
This parameter specifies the data buffer that holds the data to
write.
size
This parameter specifies the size of the individual data elements
to write.
nmemb
This parameter specifies the number of data elements to write.
channel_id
This parameter specifies the channel ID of the communication
channel to write to.
written
This parameter contains the number of data elements written.
Returns
ECM–240
This function returns S_OK if the call succeeds or S_FALSE if the
call fails.
StarCore DSP Targeting Manual
H ig h - Sp e e d S im u l ta n e o u s T r a n s fe r a n d D a ta Vi s u a l i za ti o n
hsst_size
hsst_size
A host-side client application uses this function to determine the
size of unread data (in bytes) in the communication channel.
HRESULT hsst_size (
size_t channel_id,
size_t *unread );
channel_id
This parameter specifies the channel ID of the applicable communication channel.
unread
This parameter contains the size of unread data in the communication channel.
Returns
This function returns S_OK if the call succeeds or S_FALSE if the
call fails.
hsst_block_mode
A host-side client application uses this function to set a
communication channel in blocking mode. All calls to read from the
specified channel block indefinitely until the requested amount of
data is available. By default, a channel starts in the blocking mode.
HRESULT hsst_block_mode ( size_t channel_id );
channel_id
This parameter specifies the channel ID of the communication
channel to set in blocking mode.
Returns
This function returns S_OK if the call succeeds or S_FALSE if the
call fails.
StarCore DSP Targeting Manual
ECM–241
H ig h - Sp eed S im u ltan eo u s T r an sfer an d D a ta Vi su ali za t io n
hsst_noblock_mode
hsst_noblock_mode
A host-side client application uses this function to set a
communication channel in non-blocking mode. Calls to read from
the specified channel do not block for data availability.
HRESULT hsst_noblock_mode ( size_t channel_id );
channel_id
This parameter specifies the channel ID of the communication
channel to set in non-blocking mode.
Returns
This function returns S_OK if the call succeeds or S_FALSE if the
call fails.
hsst_attach_listener
Use this function to attach a host-side client application as a listener
to a specified communication channel. The client application
receives a notification whenever data is available to read from the
specified channel.
HSST notifies the client application that data is available to read
from the specified channel. The client must implement this function:
void NotifiableHSSTClient:: Update (size_t descriptor, size_t size, size_t nmemb);
HSST calls the Notifiable HSST Client:: Update function
when data is available to read.
HRESULT hsst_attach_listener (
size_t cid,
NotifiableHSSTClient *subscriber );
cid
This parameter specifies the channel ID of the communication
channel to listen to.
ECM–242
StarCore DSP Targeting Manual
H ig h - Sp e e d S im u l ta n e o u s T r a n s fe r a n d D a ta Vi s u a l i za ti o n
hsst_detach_listener
subscriber
This parameter specifies the address of the variable of class
Notifiable HSST Client.
Returns
This function returns S_OK if the call succeeds or S_FALSE if the
call fails.
hsst_detach_listener
Use this function to detach a host-side client application that you
previously attached as a listener to the specified communication
channel.
HRESULT hsst_detach_listener ( size_t cid );
cid
This parameter specifies the channel ID of the communication
channel from which to detach a previously specified listener.
Returns
This function returns S_OK if the call succeeds or S_FALSE if the
call fails.
hsst_set_log_dir
A host-side client application uses this function to set a log directory
for the specified communication channel.
This function allows the host-side client application to use data
logged from a previous High-Speed Simultaneous Transfer (HSST)
session rather than reading directly from the board.
After the initial call to hsst_set_log_dir, the IDE examines the
specified directory for logged data associated with the relevant
channel instead of communicating with the board to get the data.
After all the data has been read from the file, all future reads are
read from the board.
StarCore DSP Targeting Manual
ECM–243
H ig h - Sp eed S im u ltan eo u s T r an sfer an d D a ta Vi su ali za t io n
Target Library Interface
To stop reading logged data, the host-side client application calls
hsst_set_log_dir with NULL as its argument. This call only
affects host-side reading.
HRESULT hsst_set_log_dir (
size_t cid,
const char* log_directory );
cid
This parameter specifies the channel ID of the communication
channel from which to log data.
log_directory
This parameter specifies the path to the directory in which to
store temporary log files.
Returns
This function returns S_OK if the call succeeds or S_FALSE if the
call fails.
Target Library Interface
This section describes the API calls for using High-Speed
Simultaneous Transfer (HSST) from your target application.
HSST_open
A target application uses this function to open a bidirectional
communication channel with the host. The default setting is for the
function to open an output channel in buffered mode. Opening a
channel that has already been opened will result in the same
channel ID being returned.
HSST_STREAM*
HSST_open
( const char *stream );
stream
This parameter passes the communication channel name.
Returns
ECM–244
This function returns the stream associated with the opened
channel.
StarCore DSP Targeting Manual
H ig h - Sp e e d S im u l ta n e o u s T r a n s fe r a n d D a ta Vi s u a l i za ti o n
HSST_close
HSST_close
A target application uses this function to close a communication
channel with the host.
int
HSST_close ( HSST_STREAM *stream );
stream
This parameter passes a pointer to the communication channel.
Returns
This function returns 0 if the call was successful or -1 if the call was
unsuccessful.
HSST_setvbuf
A target application can use this function to perform the following
actions:
• Set an open channel opened in write mode to use buffered mode
NOTE
This can greatly improve performance.
• Resize the buffer in an existing buffered channel opened in write
mode
• Provide an external buffer for an existing channel opened in
write mode
• Reset buffering to unbuffered mode
You can use this function only after you successfully open the
channel.
The contents of a buffer (either internal or external) at any time are
indeterminate.
int
HSST_setvbuf (
HSST_STREAM *rs,
unsigned char *buf,
StarCore DSP Targeting Manual
ECM–245
H ig h - Sp eed S im u ltan eo u s T r an sfer an d D a ta Vi su ali za t io n
HSST_write
int mode,
size_t size );
rs
This parameter specifies a pointer to the communication channel.
buf
This parameter passes a pointer to an external buffer.
mode
This parameter passes the buffering mode as either buffered
(specified as HSSTFBUF) or unbuffered (specified as HSSTNBUF).
size
This parameter passes the size of the buffer.
Returns
This function returns 0 if the call was successful or -1 if the call was
unsuccessful.
HSST_write
A target application uses this function to write data for the host-side
client application to read.
size_t
HSST_write (
void *data,
size_t size,
size_t nmemb,
HSST_STREAM *stream );
data
This parameter passes a pointer to the data buffer holding the
data to write.
size
This parameter passes the size of the individual data elements
ECM–246
StarCore DSP Targeting Manual
H ig h - Sp e e d S im u l ta n e o u s T r a n s fe r a n d D a ta Vi s u a l i za ti o n
HSST_read
to write.
nmemb
This parameter passes the number of data elements to write.
stream
This parameter passes a pointer to the communication channel.
Returns
This function returns the number of data elements written.
HSST_read
A target application uses this function to read data sent by the host.
size_t
HSST_read (
void *data,
size_t size,
size_t nmemb,
HSST_STREAM *stream );
data
This parameter passes a pointer to the data buffer into which to
read the data.
size
This parameter passes the size of the individual data elements
to read.
nmemb
This parameter passes the number of data elements to read.
stream
This parameter passes a pointer to the communication channel.
Returns
This function returns the number of data elements read.
StarCore DSP Targeting Manual
ECM–247
H ig h - Sp eed S im u ltan eo u s T r an sfer an d D a ta Vi su ali za t io n
HSST_flush
HSST_flush
A target application uses this function to flush out data buffered in a
buffered output channel.
int HSST_flush ( HSST_STREAM *stream );
stream
This parameter passes a pointer to the communication channel.
The High-Speed Simultaneous Transfer (HSST) feature flushes
all open buffered communication channels if this parameter is
null.
Returns
This function returns 0 if the call was successful or -1 if the call was
unsuccessful.
HSST_size
A target application uses this function to determine the size of
unread data (in bytes) for the specified communication channel.
size_t HSST_size ( HSST_STREAM *stream );
stream
This parameter passes a pointer to the communication channel.
Returns
This function returns the number of bytes of unread data.
HSST_raw_read
A target application uses this function to write raw data to a
communication channel (without any automatic conversion for
endianness while communicating).
size_t
ECM–248
HSST_raw_read
StarCore DSP Targeting Manual
(
H ig h - Sp e e d S im u l ta n e o u s T r a n s fe r a n d D a ta Vi s u a l i za ti o n
HSST_raw_write
void *ptr,
size_t length,
HSST_STREAM *rs );
ptr
This parameter specifies the pointer that points to the buffer into
which data is read.
length
This parameter specifies the size of the buffer in bytes.
rs
This parameter specifies a pointer to the communication
channel.
Returns
This function returns the number of bytes of raw data read.
HSST_raw_write
A target application uses this function to read raw data from a
communication channel (without any automatic conversion for
endianness while communicating).
size_t
HSST_raw_write (
void *ptr,
size_t length,
HSST_STREAM *rs );
ptr
This parameter specifies the pointer that points to the buffer that
holds the data to write.
length
This parameter specifies the size of the buffer in bytes.
rs
This parameter specifies a pointer to the communication channel.
StarCore DSP Targeting Manual
ECM–249
H ig h - Sp eed S im u ltan eo u s T r an sfer an d D a ta Vi su ali za t io n
HSST_set_log_dir
Returns
This function returns the number of data elements written.
HSST_set_log_dir
A target application uses this function to set the host-side directory
for storing temporary log files. Old logs that existed prior to the call
to HSST_set_log_dir() are over-written. Logging stops when
the channel is closed or when HSST_set_log_dir() is called
with a null argument. These logs can be used by the host-side
function HSST_set_log_dir.
int
HSST_set_log_dir (
HSST_STREAM *stream,
char *dir_name );
stream
This parameter passes a pointer to the communication channel.
dir_name
This parameter passes a pointer to the path to the directory in
which to store temporary log files.
Returns
This function returns S_OK if the call succeeds or S_FALSE if the
call fails.
Data Visualization
Data visualization lets you graph variables, registers, regions of
memory, and HSST data streams as they change over time. By
changing the visualization filter, you can plot this data in a variety
of ways, including line charts, logarithmic charts, polar coordinates,
and scatter graphs.
The Data Visualization tools can plot memory data, register data,
global variable data, and HSST data.
• Starting Data Visualization
• Data Target Dialog Boxes
• Graph Window Properties
ECM–250
StarCore DSP Targeting Manual
H ig h - Sp e e d S im u l ta n e o u s T r a n s fe r a n d D a ta Vi s u a l i za ti o n
Starting Data Visualization
Starting Data Visualization
To start the Data Visualization tool:
1
Start a debug session
2
Select Data Visualization > Configurator.
The Data Types window (Figure 12.1) appears. Select a data target
type and click the Next button.
Figure 12.1
Data Types window
3
Configure the data target dialog box and filter dialog box.
4
Run your program to display the data (Figure 12.2).
StarCore DSP Targeting Manual
ECM–251
H ig h - Sp eed S im u ltan eo u s T r an sfer an d D a ta Vi su ali za t io n
Data Target Dialog Boxes
Figure 12.2
Graph Window
Data Target Dialog Boxes
There are four possible data targets. Each target has its own
configuration dialog.
• Memory
• Registers
• Variables
• HSST
Memory
The Target Memory dialog box lets you graph memory contents in
real-time.
ECM–252
StarCore DSP Targeting Manual
H ig h - Sp e e d S im u l ta n e o u s T r a n s fe r a n d D a ta Vi s u a l i za ti o n
Registers
Figure 12.3
Target Memory Dialog Box
Data Type
The Data Type list box lets you select the type of data to be plotted.
Data Unit
The Data Units text field lets you enter a value for number of data
units to be plotted. This option is only available when you select
Memory Region Changing Over Time.
Single Location Changing Over Time
The Single Location Changing Over Time option lets you graph the
value of a single memory address. Enter this memory address in the
Address text field.
Memory Region Changing Over Time
The Memory Region Changing Over Time options lets you graph
the values of a memory region. Enter the memory addresses for the
region in the X-Axis and Y-Axis text fields.
Registers
The Target Registers dialog box lets you graph the value of registers
in real-time.
StarCore DSP Targeting Manual
ECM–253
H ig h - Sp eed S im u ltan eo u s T r an sfer an d D a ta Vi su ali za t io n
Variables
Figure 12.4
Target Registers Dialog Box
Select registers from the left column, and click the -> button to add
them to the list of registers to be plotted.
Variables
The Target Variables dialog box lets you graph the value of global
variables in real-time.
Figure 12.5
ECM–254
Target Variables Dialog Box
StarCore DSP Targeting Manual
H ig h - Sp e e d S im u l ta n e o u s T r a n s fe r a n d D a ta Vi s u a l i za ti o n
HSST
Select global registers from the left column, and click the -> button
to add them to the list of variables to be plotted.
HSST
The Target HSST dialog box lets you graph the value of an HSST
stream in real-time.
Figure 12.6
Target HSST Dialog Box
Channel Name
The Channel Name text field lets you specify the name of the HSST
stream to be plotted.
Data Type
The Data Type list box lets you select the type of data to be plotted.
Graph Window Properties
To change the look of the graph window, click the
properties button to open the Format Axis dialog bo.
StarCore DSP Targeting Manual
graph
ECM–255
H ig h - Sp eed S im u ltan eo u s T r an sfer an d D a ta Vi su ali za t io n
Graph Window Properties
Figure 12.7
Format Axis Dialog Box
Scaling
The default scaling settings of the data visualization tools
automatically scale the graph window to fit the existing data points.
To override the automatic scaling, uncheck a scaling checkbox to
enable the text field and enter your own value.
To scale either axis logarithmically, enable the Logarithmic Scale
option of the corresponding axis.
Display
The Display settings let you change the maximum number of data
points that are plotted on the graph.
ECM–256
StarCore DSP Targeting Manual
13
Debugger
Communications Protocols
The CodeWarrior debugger lets you communicate with the
different targets in several ways. Table 13.1 lists the targets and the
communications protocols that the IDE supports for each.
Table 13.1
Communication Protocols by Target
Target
CCS
SC140
x
MetroTRK
SC140 Simulator
Simulator
x
MSC8101
x
MSC8102
x
x
MSC8102 Simulator
x
This chapter describes the following communications protocols.
• Command Converter Server
• Metrowerks Target Resident Kernel
• Simulator
Command Converter Server
The command converter server (CCS) provides a TCP/IP
connection point for debugger communications. Running a CCS on
your host computer lets you share access to your target board with
remote users of the CodeWarrior debugger. Conversely, you have
access to the target board of any remote computer running a CCS,
provided that you know its IP address and CCS port number.
• Creating an IDE Remote Connection for CCS
StarCore DSP Targeting Manual
ECM–257
D e b u gg e r C o m mu n ic a t io n s P ro t o c o ls
Creating an IDE Remote Connection for CCS
• Running CCS
• The CCS Console
• Configuring a CCS Connection
Creating an IDE Remote Connection for CCS
Before you can debug programs using CCS, you must have a remote
connection for CCS in the CodeWarrior IDE. The CodeWarrior
installer creates several CCS remote connections that you may edit
as necessary. Or, if you do not wish to change the default
connections, you may add a new remote connection.
To add a new remote connection:
1
Figure 13.1
ECM–258
Select Edit > Preferences from the IDE main menu. The IDE
Preferences window (Figure 13.1) appears.
IDE Preferences window
2
Select Remote Connections from the left-side list. The Remote
Connections preference panel appears.
3
Click Add. The new connection dialog appears.
StarCore DSP Targeting Manual
D e b u g g e r C o m m un i c a t io n s P ro t o c o ls
Creating an IDE Remote Connection for CCS
Figure 13.2
New Connection dialog
4
Name the new connection in the Name text box.
5
Change the Debugger selection to SC100 CCS.
6
Change the Connection Type selection to CCS Remote
Connection.
7
Change the Port setting to the CCS listen port. If you are not sure of
the port, try the CCS default listen port, 41475.
8
If you are connecting to a CCS running on a different machine,
enable the Use Remote CCS option and specify its IP address.
9
If the CCS is connected to a multi-core target such as the MSC8102,
enable the Multi-Core Debugging option and specify its JTAG
configuration file.
StarCore DSP Targeting Manual
ECM–259
D e b u gg e r C o m mu n ic a t io n s P ro t o c o ls
Running CCS
Running CCS
The CodeWarrior IDE automatically runs the CCS if the IDE
determines that CCS is not loaded when you try to debug using a
local CCS connection. If you wish to run the executable yourself, it is
located in:
CodeWarrior\ccs\bin\ccs.exe
The CCS icon
appears in the Windows taskbar when the
executable is running. You can right-click the icon to access the CCS
pop-up menu:
• Configure - opens the CCS configuration options dialog box
• Show Console - displays the CCS console
• Hide console - hides the CCS console from view
• About CCS - displays version information
• Quit CCS - terminates CCS.
The CCS Console
The CCS console (Figure 13.3) lets you view and change the server
connection options. You may issue commands by typing commands
into the command line window, or by selecting options from the
CCS menu.
Figure 13.3
The Command Converter Server Console
CCS Menu
Command Line
Window
ECM–260
StarCore DSP Targeting Manual
D e b u g g e r C o m m un i c a t io n s P ro t o c o ls
Configuring a CCS Connection
Configuring a CCS Connection
CCS is initially configured according to the options you specified
during the installation procedure. You can change the properties of
the connection between the host computer and the target from
either the menu or the command line.
To configure the connection from the menu, open the Configure
dialog (Figure 13.4), File > Configure.
Figure 13.4
CCS Configure dialog box
To configure the connection from the command line, use the config
command to set the listen port and command converter. Before
doing this, you may have to delete the existing configuration with
the delete all command.
• Server listen port
config port 41475
• Parallel port LPT1 JTAG command converter
config cc lpt:1
• HTI command converter
config cc hti:10.1.0.1
Metrowerks Target Resident Kernel
The Metrowerks Target Resident Kernel is a debug protocol for the
MSC8101 board that allows run control through a serial connection
from the host computer to the target board. MetroTRK is provided
as an S-record file to be flashed to the MSC8101 board.
StarCore DSP Targeting Manual
ECM–261
D e b u gg e r C o m mu n ic a t io n s P ro t o c o ls
MetroTRK Limitations and Restrictions
• MetroTRK Limitations and Restrictions
• Downloading MetroTRK to the MSC8101 Board
• Remote Debugger Settings for MetroTRK
MetroTRK Limitations and Restrictions
The MetroTRK protocol has some limitations compared to the CCS
protocol.
• The MetroTRK protocol does not support HSST.
• The MetroTRK protocol cannot be used to program the flash.
• The MetroTRK protocol always loads the Memory Window in
increments of 64 bytes regardless of the word size you select.
However, you can still view and modify the Memory Window in
any of the selectable word sizes.
• Using the profiler with the MetroTRK protocol significantly
slows down debugging.
• The MetroTRK protocol does not support multi-core debugging.
There are several restrictions regarding the type of programs that
MetroTRK can debug.
• The user program should not modify the memory used by
MetroTRK.
• The interrupt vectors used by MetroTRK should not be accessed
by the user program.
• The user program should not execute the instructions that
change the status of the core such as: halt,stop,wait,debug.
However, a TRAP instruction can be used to stop the core.
• The user program must not execute an initialization file.
MetroTRK for the MSC8101 requires its own initialization.
• The user program should not change the clock configuration,
including the pctl0 and pctl1 registers of core.
If the user program needs to use other SIC interrupts such as SCC
interrupts, the user program must save the original interrupt vector
and insure that the SMC interrupt is routed to the original interrupt
handler.
ECM–262
StarCore DSP Targeting Manual
D e b u g g e r C o m m un i c a t io n s P ro t o c o ls
Downloading MetroTRK to the MSC8101 Board
Downloading MetroTRK to the MSC8101 Board
You may select from two MetroTRK S-record files. They are located
in StarCore_Tools\MetroTRK\S_Records
• ROM1_Version\metroTRK1.s - smaller RAM footprint, slower
speed
• ROM2_Version\metroTRK2.s - larger RAM footprint, faster
speed
ROM1_Version\metroTRK1.s
The .text segment of this S-record file resides in flash memory. It
uses less RAM than metroTRK2.s, but supports a lower maximum
communications speed. To load this S-record file:
1
Program the flash with "metroTRK1.s" at offset 0x0.
2
Disconnect power from the board.
3
Disconnect from the JTAG and connect to the upper serial port
RS232 (-2).
4
Set Switch 10-1 to OFF and Switch 9-7 to ON
5
Connect power to the board. LD11 and LD17 should be lit.
ROM2_Version\metroTRK2.s
The .text segment of this S-record file resides in SRAM. It uses more
RAM than metroTRK1.s, but supports a faster communications
speed. To load this S-record file:
StarCore DSP Targeting Manual
ECM–263
D e b u gg e r C o m mu n ic a t io n s P ro t o c o ls
Remote Debugger Settings for MetroTRK
1
Program the flash with "metroTRK2.s" at offset 0x0.
2
Program the flash with "coderom.s" at offset 0xFF808000.
3
Disconnect power from the board.
4
Disconnect from the JTAG and connect to the upper serial port
RS232 (-2).
5
Set Switch 10-1 to OFF and Switch 9-7 to ON
6
Connect power to the board. LD11 and LD17 should be lit.
Remote Debugger Settings for MetroTRK
To use MetroTRK as the debugger protocol, you must create a
remote debugger setting for it.
ECM–264
StarCore DSP Targeting Manual
D e b u g g e r C o m m un i c a t io n s P ro t o c o ls
Remote Debugger Settings for MetroTRK
1
In the Target Settings Panel, Navigate to Debugger->Remote
Debugging. Check "Enable Remote Debugging", and select the
"StarCore MetroTRK" Connection.
2
On the Remote Debugging Panel, press the "Edit Connection"
button. The "StarCore MetroTRK" Panel appears.
3
On the "StarCore MetroTRK" Panel:
• set Rate to 57600 if you are running metroTRK1.s
• set Rate to 115200 if you are running metroTRK2.s.
StarCore DSP Targeting Manual
ECM–265
D e b u gg e r C o m mu n ic a t io n s P ro t o c o ls
Simulator
4
You can now Debug or Run the project using the MetroTRK
Protocol Connection.
Simulator
In the absence of a hardware target, you can debug to either the
SC100 or the MSC8102 simulator. The CodeWarrior IDE ships with
two preconfigured remote connections for these simulators.
• MSC8102 Simulator
• SC100 Simulator
MSC8102 Simulator
The MSC8102 simulator simulates the multicore environment of the
MSC8102 ADS board. If using the MSC8102 simulator as the target
(Figure 13.5), the CCS options as defined in the remote connection
(Figure 13.6) are ignored in favor of hardcoded values. The
hardcoded values run CCS Sim (the simulator version of CCS) at
port 41476.
Figure 13.5
ECM–266
SC100 Debugger Target for MSC8102 Simulator
StarCore DSP Targeting Manual
D e b u g g e r C o m m un i c a t io n s P ro t o c o ls
SC100 Simulator
Figure 13.6
Remote Connection for MSC8102 Simulator
SC100 Simulator
The SC100 simulator simulates a single core SC100. The remote
connection setting (Figure 13.7) lets you change the CPU priority of
the simulator.
StarCore DSP Targeting Manual
ECM–267
D e b u gg e r C o m mu n ic a t io n s P ro t o c o ls
SC100 Simulator
Figure 13.7
ECM–268
Remote Connection for SC100 Simulator
StarCore DSP Targeting Manual
14
StarCore DSP Utilities
This chapter describes the following StarCore DSP-specific utilities:
• Flash Programmer
• ELF/DWARF File Dump Utility
• ELF to S-Record File Conversion Utility
• SC100-stat Utility
Flash Programmer
The integrated CodeWarrior flash programmer runs as a
CodeWarrior plug-in. The application provides common flash
programmer features such as:
• Program
• Erase
• BlankCheck
• Verify
• Checksum
The CodeWarrior flash programmer uses the CodeWarrior
Debugger Protocol API to communicate with the target boards. The
CodeWarrior flash programmer can program the flash memory of
the target board with code from any CodeWarrior IDE project or
from any individual executable files.
The CodeWarrior flash programmer lets you use the same IDE to
program the flash of any of the embedded target boards described
in “Board Support” on page 274.
This section describes the flash programmer utility:
• CodeWarrior Flash Programmer Settings Panel
• Main Operations of the Flash Programmer
• Board Support
StarCore DSP Targeting Manual
ECM–269
St ar C o re D SP U t ili t ies
CodeWarrior Flash Programmer Settings Panel
• Modifying the Flash Programmer to Support Custom Flash
Modules
• Personality File
CodeWarrior Flash Programmer Settings Panel
The Flash Programmer Settings IDE preferences panel (Figure 14.1)
lets you configure the Flash Programmer. To access this panel, select
Edit > Preferences from the main menu bar.
Figure 14.1
Flash Programmer Settings IDE Preferences Panel
This panel contains the settings as shown in Table 14.1:
ECM–270
StarCore DSP Targeting Manual
S ta rC o re D SP U t ili ti e s
Main Operations of the Flash Programmer
Table 14.1
Flash Programmer settings
Setting
Description
Guidance
Personality File
Sets personality file for flash
memory.
Personality files for the
8012ADS and 8101ADS
reference boards are located
in:
CodeWarrior\Bin\Plugins
\Flash_Programmer\PFE
Comm I/O
Sets Remote Connection to be
used for communicating with
the target board
The IDE defines the Remote
Connections in the IDE
Preference Panels.
Target File
Sets the s-record file to be
flashed.
The file must be an s-record
file.
Offset
Sets the offset in bytes that the
s-record is shifted in ROM
relative to the memory
addresses as defined in the srecord.
The offset must be a
hexadecimal value.
Configuration File
Sets the configuration file used
to initialize the target board.
Configuration files for StarCore
reference boards are located
in:
CodeWarrior\StarCore_Su
pport\Initialization_Fi
les
Address
Sets the start address of the
ROM address that the flash
programmer can write to.
Use this setting to selectively
replace portions of flash
memory. A value of zero
disables this setting.
Size
Sets the size of the memory
area that the flash programmer
can write to.
Use this setting to selectively
replace portions of flash
memory. A value of zero
disables this setting.
Main Operations of the Flash Programmer
The Flash Programmer menu has the following commands:
• Connect
• Program
• Erase
• Blank Check
• Verify
StarCore DSP Targeting Manual
ECM–271
St ar C o re D SP U t ili t ies
Main Operations of the Flash Programmer
• Checksum
• Disconnect
NOTE
To enable all of the flash programmer’s operations except Connect,
you must first connect to the target by selecting Flash
Programmer>Connect.
Connect
If you select Flash Programmer>Connect, the flash programmer
connects to the target board.
Program
If you select Flash Programmer>Program:
• The flash programmer gets the filename of the file to be
programmed. This file could be an executable S-Record format
file that the CodeWarrior linker generates from the current
project or it could be any S-Record file on your computer disk.
• The flash programmer opens a status window to display the
status of this operation.
• The flash programmer gets the preference data from the Flash
Engine panel.
• The flash programmer is programmed with the selected SRecord, depending on which setting you have selected in the
personality file (for more details, see the section: “Personality
File” on page 288). If in the personality file, you specify to erase
sectors during the program operation, then the flash
programmer erases those sectors that need to be erased so that
you can flash the S-Record.
• The flash programmer reports any errors.
• The flash programmer closes the status window.
Erase
If you select Flash Programmer>Erase:
• The flash programmer opens a status window to display the
status of the erase operation.
• The flash programmer creates a dialog box and asks you which
blocks/sectors of the flash to erase as you have a choice to erase
one or more blocks at a time.
ECM–272
StarCore DSP Targeting Manual
S ta rC o re D SP U t ili ti e s
Main Operations of the Flash Programmer
• The flash programmer gets the preference data from the Flash
Programmer Settings panel.
• The flash programmer erases selected blocks and reports any
errors from the Flash Engine Module (FEM).
• The flash programmer closes the status window.
Blank Check
If you select Flash Programmer>Blank Check:
• The flash programmer opens a status window to display the
status of the blank check operation.
• The flash programmer creates a dialog box to ask you which
blocks/sectors of the flash that you want to blank check.
• The flash programmer gets the Preference Data from the Flash
Engine panel.
• The flash programmer checks if the contents of selected blocks
equal the blank value 0xFFFFFFFF and if there are any errors
reports them.
• The flash programmer closes the status window.
Verify
If you select Flash Programmer>Verify:
• The flash programmer gets the filename of the file to be verified.
This file could be the executable file that the CodeWarrior linker
generates from the current project, or it could be any file in your
computer disk as selected in the flash programmer main dialog
box.
• The flash programmer opens the status window to display the
status while performing the comparison.
• The flash programmer uploads the data from the target board
and compares the data from the target board with the data from
the S-Record.
• If the data from the target board does not match the data from
the buffers, the flash programmer reports the discrepancy.
• The flash programmer closes the status window.
Checksum
If you select Flash Programmer>Checksum:
StarCore DSP Targeting Manual
ECM–273
St ar C o re D SP U t ili t ies
Board Support
• The flash programmer opens a status window to display status
of the checksum operation.
• The flash programmer creates a dialog box to ask you which
area of the flash that you want to use to calculate the checksum.
In this dialog box, select:
– File on Host to calculate the checksum on the host file.
– File On Target to calculate the checksum on the target
using the addresses specified in the host file.
– Memory On Target to calculate the checksum on the
specified range of the memory on the target.
• The flash programmer gets the preference data from the Flash
Engine panel.
• The flash programmer performs the checksum operation and
reports any errors.
• The flash programmer closes the status window.
Disconnect
If you select Flash Programmer>Disconnnect, the flash
programmer disconnects the target. This option can be useful if you
want to debug your project, since protocol plug-ins can not be
shared.
Board Support
The flash programmer supports the HC8101 and HC8102 target
boards.
Modifying the Flash Programmer to Support
Custom Flash Modules
This section explains how to modify the flash programmer to
support custom flash modules. Figure 14.2 illustrates the flash
programmer architecture.
ECM–274
StarCore DSP Targeting Manual
S ta rC o re D SP U t ili ti e s
Modifying the Flash Programmer to Support Custom Flash Modules
Figure 14.2
CodeWarrior Flash Programmer Architecture
Host PC
CFP Plugin
Panel
Flash Engine
Module
Personality
File (PFE)
−−−−−−− −−−−−−−−−−−−−−−−−−−−−−−−−−−−−−−− −− −−−−−−−− −−
TRD
Embedded
target
The major software components in this architecture are:
• Flash Engine Module (FEM)
• Target Resident Driver (TRD)
The minor components in this architecture are:
• CodeWarrior Flash Programmer Settings Panel
• Personality File
The Flash Engine Module drives the user interface and interacts
with the CodeWarrior IDE. It downloads the Target Resident Driver
(TRD) and the data to be programmed to the embedded target
board. It is also responsible for communicating with the TRD and
controlling it.
The TRD is the flash programming algorithm code that runs on the
target board. There can be many TRDs. Every flash family requires
one, as different flashes use different algorithms for the operations,
such as program or erase.
TRDs can be found in the path:
CodeWarrior\bin\plugins\Flash_Programmer\TRD directory
Flash Engine Module (FEM)
The FEM runs on the host computer and communicates with the
TRD of the embedded target through one of the protocol devices,
such as the AMC WireTap, the MSI Wiggler, or the AbatronBDI.
When you execute a flash operation, the FEM performs these tasks:
• Gets your preferences from the preference panel and your
personality file.
StarCore DSP Targeting Manual
ECM–275
St ar C o re D SP U t ili t ies
Modifying the Flash Programmer to Support Custom Flash Modules
• Downloads your TRD to your target.
• Downloads the S-record to your target.
• Depending on the required operation, initializes the input buffer
on the target and the stack pointer. Listing 14.1 contains the
definition of the input buffer. Parameters sParameter1 through
sParameter4 vary depending on the function (For more
information, see “TRD Architecture” on page 277).
Listing 14.1
Target Input Buffer Definition
typedef struct
{
INT32 sInCommandID;
/* Command identifier
*/
UINT32 sParameter1;
/* First Parameter
*/
UINT32 sParameter2;
/* Second Parameter
*/
UINT32 sParameter3;
/* Third Parameter
*/
UINT32 sParameter4;
/* Fourth Parameter
*/
} INPUT_BUFFER_t, *pINPUT_BUFFER_t;
• Starts the TRD, which executes a function corresponding to the
Command Identifier defined in Listing 14.2.
• When TRD stops, the FEM reads the result of the performed
operation from the output buffer and displays the result.
Listing 14.2
Command Identifier Definition
/*-- Defines - Command IDs -----------------------------------*/
#define CLEAR_PARAMETER
command field */
#define RESET_CMD
the Flash
*/
#define PROTECTION_STATUS_CMD
status
*/
#define PROGRAM_CODE_CMD
RAM to Flash */
#define ERASE_SECTOR_CMD
wi a group
*/
ECM–276
StarCore DSP Targeting Manual
0x0/*Initalize the
0x1/*Init and reset
0x2/*get protection
0x3/*copy code from
0x4/*Erase sectors
S ta rC o re D SP U t ili ti e s
Modifying the Flash Programmer to Support Custom Flash Modules
#define BLANK_CHECK_CMD
range of Flash */
#define CHECK_SUM_CMD
of Flash
*/
#define READ_ID_CMD
Manufacture’s ID
*/
0x5/*Blank Check
0x6/*Check Sum range
0x7/*Read the
Target Resident Driver (TRD)
A Target Resident Driver (TRD) is the software algorithm code that
runs on the target board to program the FEM. The FEM works
directly with the TRD. If you have a custom board you will need to
implement a TRD for it. At the very least, the CFP plug-in requires
the TRD to implement the following functions: Program(), Erase()
and BlankCheck().
TRD Architecture
The TRD executable object is in a binary format. The TRD should be
linked with Position Independent Code (PIC) and Position
Independent Data(PID) enabled, and the start address of the TRD
should be at 0x0. This allows the FEM to put the TRD at any
available memory location of the target board. The TRD software
architecture has the following elements and ends with an invalid
instruction to stop the processor from running:
• Message Buffer
• Input and Output Buffer
• TRD Code
The relationship among the message, input, and output buffers is
shown in Figure 14.3.
StarCore DSP Targeting Manual
ECM–277
St ar C o re D SP U t ili t ies
Modifying the Flash Programmer to Support Custom Flash Modules
Figure 14.3
Relationship Among the Message, Input, and Output Buffers
Message Buffer
Input Buffer
0x00 32-bit Unique Identifier (filled by TRD)
0x00 Command ID
0x04 main() Function Pointer (door of TRD)
0x04 Parameter 1
0x08 Pointer of Input Buffer (filled by TRD)
0x08 Parameter 2
0x… Parameter n
0x0C Pointer of Output Buffer (filled by TRD)
0x10 Stack Pointer (filled by Flash Engine Module)
Output Buffer
0x00 Command ID
0x14 TRD Offset (filled by Flash Engine Module)
0x04 Return Value 1
0x18 Reserved for Flash Engine Module
0x08 Return Value 2
0x… Return Value n
Message Buffer
The message buffer is a data structure that is physically located at
the first address in the TRD’s driver executable file. It provides the
FEM the information regarding the TRD, such as the unique 32-bit
identifier and pointers to the input buffer, the output buffer, and the
call-in gate in main().
The TRD has a unique 32-bit identifier for the FEM to use, to
ascertain whether it is talking to the right TRD. This is necessary
because many embedded target boards have more than one type of
flash memory.
The TRD has a single entry point (call-in gate) to execute the
driver code. All API functions are passed through this entry point.
Each API function has a unique data structure describing the
function’s arguments. The FEM constructs the input parameter for
each API function in the input buffer and sets the stack pointer
before calling the call-in gate or main() pointer. This pointer is
the address of the main() function within the TRD that calls the API
function described by the contents of the input buffer. When the
API function has been executed, the FEM retrieves the result of the
API function call from the output buffer.
ECM–278
StarCore DSP Targeting Manual
S ta rC o re D SP U t ili ti e s
Modifying the Flash Programmer to Support Custom Flash Modules
Input and Output Buffer
The message buffer contains pointers that points to the input buffer
and output buffer of the TRD. These buffer structures contain the
CommandID and a list of parameters necessary to execute an API
function call, retrieved by the FEM. The FEM constructs the input
parameter for an API function in the input buffer and sets the stack
pointer before calling the call-in gate. Each API function
defines the format of the data to be placed into the input buffer and
the output buffer.
NOTE
The TRD is designed to manage the input or output buffer’s memory
resource as an internal data structure because the TRD’s code uses
PIC and PID. Both read and write operations are performed on the
input buffer. For this reason, the TRD must be placed within RAM
address space while executing.
The TRD call-in gate uses the stack pointer value in the
message buffer to set the stack pointer on a target board. The
FEM constructs the input parameter for each API function in the
input buffer and sets the stack pointer before calling the call-in
gate.
NOTE
The TRD is designed to manage the pointer memory resource as an
internal data structure because the TRD code uses PIC and PID.
The FEM writes the address of the stack pointer to this address.
For this reason, the TRD must be placed within RAM address space
while executing.
TRD Memory Layout
The memory layout for the TRD is shown in Figure 14.4.
StarCore DSP Targeting Manual
ECM–279
St ar C o re D SP U t ili t ies
Modifying the Flash Programmer to Support Custom Flash Modules
Figure 14.4
Memory Layout for the TRD
0x0
message buffer
input buffer
output buffer
TRD code
invalid instruction
The start address of the TRD is 0x0. This is important, as it allows
you to move the TRD to any available memory location on the
target. If the linker links the TRD code starting at 0x0, then all of the
pointers become an offset.
For example, if the FEM places the TRD at the memory location
0x10000 on the embedded target board, then for the FEM to get the
real address of the input buffer on this target, the FEM gets the
input buffer pointer from the message buffer and then adds
0x10000 to it.
The last instruction of every function has to be an invalid
instruction, so it will stop the CPU and report an event back to the
FEM.
TRD API Specification
This section lists the API specifications for the functions required by
the CFP plug-in. These functions are:
• call-in gate( )
• Init Function
• Program( )
• Erase( )
• BlankCheck( )
call-in gate( )
The TRD call-in-gate(main()) function is the entry point for all
TRD API function calls. This function:
• Sets the stack pointer with the value in the stack pointer element
in the message buffer.
ECM–280
StarCore DSP Targeting Manual
S ta rC o re D SP U t ili ti e s
Modifying the Flash Programmer to Support Custom Flash Modules
• Sets a hardware/software breakpoint on an exit function, if
necessary. If the FEM can not detect an execution of an invalid
instruction, then a breakpoint is set on an exit function and the
call-in gate calls the exit function.
NOTE
You need to add a TRD Offset in the Message Buffer to the address
of an exit function.
• Clears the output buffer, that is, initializes it to 0.
• Constructs a call to the API function by using the information
from the input buffer, and calls the function. If the command ID
does not match anything that the TRD supported, the function
sets up the output buffer to report the error.
• Clears the input buffer, that is, initializes it to 0.
• Sets the command ID of the output buffer. This ensures that the
API function returns successfully.
• Executes an invalid assembly instruction or calls the exit
function to signal that the API function execution has finished.
The FEM should detect an execution of an invalid instruction or
a breakpoint.
Listing 14.3 shows the prototype of the call-in-gate(main())
function.
Listing 14.3
call-in gate((main)) Function Prototype
void main(void);
//Input Param: None
//Output Param: None
//Return Param: None
Init Function
The TRD Init() function performs the following tasks:
• Performs flash-specific or target-board-specific intializations
that could only be performed from the code running on the
target board. In general, the CFP plug-in initializes the target by
using an initialization file. This file is specified in the
Configuration File text box in the Flash Programmer Settings
panel.
• Sets the return parameter before returning to the call-in
gate.
StarCore DSP Targeting Manual
ECM–281
St ar C o re D SP U t ili t ies
Modifying the Flash Programmer to Support Custom Flash Modules
Listing 14.4 shows the prototype of the Init() function.
Listing 14.4
Init() Function Prototype
void Init(unsigned long flashBaseAddress);
//Input Parameter: unsigned long flashBaseAddress
//Output Parameter: None
//Return Parameter: Offset 0x4 of the output buffer:
//Error Code (0 indicates no error)
The contents of the input buffer and output buffer for the
Init( ) function are shown in Table 14.2 and Table 14.3.
Table 14.2
Table 14.3
TRD Input Buffer Definition for Init()
Offset
Size (in Bytes)
Variable
0x0
4
command = COMMAND_INIT_ID
0x4
4
parameter1 = flashBaseAddress
TRD Output Buffer Definition for Init()
Offset
Size (in Bytes)
Variable
0x0
4
command = COMMAND_INIT_ID
0x4
4
Return Value
Program( )
The TRD Program() function programs the memory content from
RAM to flash. The FEM downloads the data to be programmed into
a known memory location before calling this function. The FEM
passes that memory location to the TRD in the first parameter of the
input buffer. The Program() function programs the data starting
from RAM memory location src to (src+size) into the flash
starting at memory location dest. If this programming action fails,
the function sets the output buffer with the first address of the flash
where the programming action failed.
Listing 14.5 shows the prototype of the Program() function
Listing 14.5
Program() Function Prototype
void Program(unsigned long src,
unsigned long dest,
unsigned long size
ECM–282
StarCore DSP Targeting Manual
S ta rC o re D SP U t ili ti e s
Modifying the Flash Programmer to Support Custom Flash Modules
unsigned long flashBaseAddress);
//Input Parameter:
// src - Starting address of the data in RAM space to
be programmed.
// dest - Starting address of the flash memory to be
programmed.
// size - Number of bytes of data to be programmed
from src to dest.
// flashBaseAddress - The flashBase address.
//Output Parameter:
// Offset 0x8 of output buffer - The first address
where the function // fails to program, if any. The
Offset 0x0 should be set by the
// call-in gate.
//Return Parameter:
// Offset 0x4 of output buffer — Error Code (0
indicates no error).
The contents of the input buffer and output buffer for the
Program() function are shown in Table 14.4 and Table 14.5.
StarCore DSP Targeting Manual
ECM–283
St ar C o re D SP U t ili t ies
Modifying the Flash Programmer to Support Custom Flash Modules
Table 14.4
TRD Input Buffer Definition for Program()
Offset
Size (in Bytes)
Variable
0x0
4
command =
COMMAND_PROGAM_ID
Table 14.5
0x4
4
src
0x8
4
dest
0xC
4
size
0x10
4
flashBaseAddress
TRD Output Buffer Definition for Program()
Offset
Size (in Bytes)
Variable
0x0
4
command =
COMMAND_PROGAM_ID
0x4
4
Return Value
0x8
4
Address where it fails (if any)
Erase( )
The TRD Erase() function interface erases the flash memory. This
function interface erases the blocks/sectors specified in the
blockMask and blockMaskGroupNo parameter. It sets the output
parameter for the failed erase block and returns this parameter
before returning to the call-in gate.
Listing 14.6 shows the prototype of the Erase() function.
Listing 14.6
Erase() Function Interface Prototype
void Erase(unsigned long blockMask,
unsigned long flashBaseAddress,
unsigned long blockMaskGroupNo);
//Input Parameter:
// blockMask - Block/Sector numbers to be erased. The
left most bit is // the block/sector 0 and the right
most bit is block/sector 31. For
// example, to
erase block 0-3, and 6-8, the blockMask value is
// 0xF3800000.
// flashBaseAddress - The flashBase address.
ECM–284
StarCore DSP Targeting Manual
S ta rC o re D SP U t ili ti e s
Modifying the Flash Programmer to Support Custom Flash Modules
// blockMaskGroupNo - This variable is only used if
the flash has more // than 32 blocks/sectors. For
blockMaskGroupNo 0, the blockMask
// represents block number 0 to block number 31. For
blockMaskGroupNo // 1, the blockMask represents block
number 32 to block number 63.
//Output Parameter:
// Offset 0x8 of output buffer - The block mask of the
blocks that have
// failed the erase operation.
// Offset 0xC of output buffer - The block mask group
number of the
// failed block mask. Offset 0x0 should be set by
call-in gate.
//Return Parameter:
// Offset 0x4 of output buffer - Error Code (0
indicates no error)
The contents of the input buffer and output buffer for Erase( ) are
shown in Table 14.6 and Table 14.7.
StarCore DSP Targeting Manual
ECM–285
St ar C o re D SP U t ili t ies
Modifying the Flash Programmer to Support Custom Flash Modules
Table 14.6
TRD Input Buffer Definition for Erase()
Offset
Size (in Bytes)
Variable
0x0
4
command =
COMMAND_ERASE_ID
Table 14.7
0x4
4
blockMask
0x8
4
flashBaseAddress
0xC
4
BlockMaskGroupNo
TRD Output Buffer Definition for Erase ()
Offset
Size (in Bytes)
Variable
0x0
4
command =
COMMAND_ERASE_ID
0x4
4
Return Value
0x8
4
blockMask
0xC
4
blockMaskGroupNo
BlankCheck( )
The BlankCheck() function interface performs a blank check on a
specified memory range. If the specified memory range of the flash
is not blank, this function interface sets the output buffer with the
first address of the non-blank memory along with its data before
returning to the call-in gate.
Listing 14.7
BlankCheck() Function Interface Prototype
void BlankCheck( unsigned long startAddress,
unsigned long size
unsigned long flashBaseAddress);
//Input Parameter:
// startAddress - The start address of the flash to be
BlankChecked.
// size - The number of bytes to check.
// flashBaseAddress - The flashBase address.
//Output Parameter:
// Offset 0x8 of output buffer - The first address
corresponding to
// non-blank memory.
ECM–286
StarCore DSP Targeting Manual
S ta rC o re D SP U t ili ti e s
Modifying the Flash Programmer to Support Custom Flash Modules
// Offset 0xC of output buffer - The data at the nonblank memory
// address. The Offset 0x0 should be set by the call-in gate.
//Return Parameter:
// Offset 0x4 of output buffer - Error Code (0
indicates no error).
The contents of the input buffer and output buffer for
BlankCheck() are shown in Table 14.8 and Table 14.9.
Table 14.8
Table 14.9
TRD Input Buffer Definition for BlankCheck()
Offset
Size (in Bytes)
Variable
0x0
4
command =
COMMAND_BLANKCHECK_I
D
0x4
4
startAddress
0x8
4
size
0xC
4
flashBaseAddress
TRD Output Buffer Definition for BlankCheck()
Offset
Size (in Bytes)
Variable
0x0
4
command =
COMMAND_BLANKCHECK_I
D
0x4
4
Return Value
0x8
4
Address of the first non-blank
memory
0xC
4
Data at the first non-blank
memory address
You will need to implement these functions when you are porting
the flash programmer to your FEM. For an example, see
Sharp_LHF_TRD.mcp. which is in the path:
CodeWarrior\StarCore_Tools\Flash_Programmer_Support\TR
D_Projects\Sharp_LHF
StarCore DSP Targeting Manual
ECM–287
St ar C o re D SP U t ili t ies
Personality File
When you have built your TRD you will have to convert it to binary
format. Use the mot2bin.exe utility located at the following web
address to do this:
http://www.keil.com/download/docs/mot2bin.zip.asp
You will also have to specify the same TRD name in your
personality file. The TRD needs to have the extension .trd.
Personality File
A personality file contains information specific to each embedded
target board. The personality filename extension is .PFE.
Information is divided into these groups:
• TARGET_MEMORY
• PROCESSOR_TYPE
• FLASH
TARGET_MEMORY
Target_Memory contains these items:
• RAM Start Address
• RAM Size: This should not exceed actual size of RAM.
• NUMBER_OF_BLOCK_GROUPS: Number of different block groups
in the flash programmer. This number has to be greater then 0. If
your flash has less then 32 blocks, it is recommended that you set
this variable to 1.
PROCESSOR_TYPE
PROCESSOR_TYPE should correspond to your target processor,
either MSC8101 or MSC8102.
FLASH
FLASH contains these items:
• FLASH_ENGINE_FILENAME: The flash engine filename. We
provide the generic file name Flash_Engine.cfp.
• FLASH_PANEL_NAME: Leave this blank if you do not have a
preference panel.
• FLASH_NAME: The name of your flash.
• FLASH_TYPE: The type of your flash.
ECM–288
StarCore DSP Targeting Manual
S ta rC o re D SP U t ili ti e s
ELF/DWARF File Dump Utility
• BLOCK_SIZE - size of flash blocks: It is very important to have
this value correct, otherwise you will not be able to perform
flash operations.
• NUMBER_OF_BLOCKS: It is very important to have this value
correct, otherwise you will not be able to perform flash
operations.
• BASE_ADDRESS: The flash base address. It is very important to
have this value correct, otherwise you will not be able to
perform flash operations.
• TRD_FILENAME: The name of your TRD.
• FORCE_ERASE: Sets this to 1,if you want the flash programmer to
erase a flash value that is not in the erased state during the
performance of the Program operation. Most flashes can not be
programmed, if they are not in the erased state. If you have this
variable set to 0, the flash programmer will skip the Erase
operation, but it may not be able to program the flash if it is not
in the erased state.
• FLASH_ID: Some flashes allow you to read a flash ID. If you
have implemented a TRD function to read a flash ID, set this
value to the value specified in your flash manual. If your flash
does not support this feature, set it to 0 and make your TRD
return 0 in the Return Value1 field of the output buffer.
For an example of a personality file, see 8260_ADS.pfe in the path:
CodeWarrior\bin\plugins\Flash_Programmer\TRD directory
ELF/DWARF File Dump Utility
The ELF (executable and linking format) file dump utility is a
standalone utility that processes absolute or linkable object files and
produces an ASCII output that represents the binary information
contained in those files.
Use the following command to invoke the ELF file dump utility:
sc100-elfdmp [option] file...
Table 14.10 describes the syntax elements shown on the preceding
command line.
StarCore DSP Targeting Manual
ECM–289
St ar C o re D SP U t ili t ies
ELF/DWARF File Dump Utility
Table 14.10
ELF File Dump Utility Syntax Elements
Syntax Element
Description
[option]
Case-sensitive command-line options. Without options, the utility returns the
contents of the ELF Ehdr, Phdr, and Shdr structures and the symbol table.
When you specify command-line options, the utility returns only the information
that you specify on the command line.
file...
One or more filenames, including optional pathnames. The input file must be an
ELF object file, either absolute or relocatable.
For example, for an object file named foo.eld in the same path as
the ELF file dump utility, the following command-line options are
valid:
sc100-elfdmp -d out.txt foo.eld
sc100-elfdmp -d out.txt -c -e error.txt -h -i -v foo.eld
The ELF file dump utility resides in the following path for Windows
hosts:
Windows
install_dir\CodeWarrior\StarCore Support\Compiler\bin\
The ELF file dump utility resides in the following path for Solaris
hosts:
Solaris
install_dir/sc140/starcore_support/bin
Table 14.11 lists and describes the command-line options for the
ELF file dump utility.
Table 14.11
ELF File Dump Utility Command-Line Options
Option
Description
-b
Dump disassembled section contents.
-c
Dump string table.
-d
Dump to an output file.
-e
Dump error messages to specified file.
-f
Dump file header.
-g
Dump DWARF debug info.
-h
Dump section headers.
-i
Dump section header string table.
-o
Dump program header.
ECM–290
StarCore DSP Targeting Manual
S ta rC o re D SP U t ili ti e s
ELF to S-Record File Conversion Utility
Table 14.11
ELF File Dump Utility Command-Line Options (continued)
Option
Description
-q
Do not display sign on banner.
-r
Dump relocation information.
-s
Dump section contents.
-t
Dump symbol table.
-v
Dump symbolically.
-x
Dump in test mode.
NOTE
The default option is -fhost.
ELF to S-Record File Conversion Utility
Use the elfsrec utility to convert ELF format files to Motorola Srecord format files.
The S-record format, which is a standard Motorola file format,
encodes programs or data files in a printable form for exchange
among computer systems.
Installing elfsrec
When you install CodeWarriorTM for the StarCoreTM DSP, the
installation utility installs elfsrec in the following directory by
default:
CodeWarrior_dir\StarCore_Support\compiler\bin
Using elfsrec
The command syntax of the elfsrec utility follows:
elfsrec [options] file_name
The file_name is the name of the input file to the utility.
Table 14.12 shows the options for the elfsrec utility. The options
that you can use depend on the product you purchased.
StarCore DSP Targeting Manual
ECM–291
St ar C o re D SP U t ili t ies
Using StarCore-Specific elfsrec Options
Table 14.12
elfsrec Utility Options
Option
Description
-b
Causes elfsrec to create byte-addressable Srecords. By default, elfsrec uses this option. This
generates S1 records.
-w
Causes elfsrec to create word-addressable Srecords. This generates S2 records.
-l
Causes elfsrec to create long-word-addressable
S-records. This generates S3 records.
-d [file_name]
Causes elfsrec to write the S-records to the
specified file. If you do not specify a file name, the
output file has the same name as the input file
with a .s extension.
-o value
Specifies a memory offset in hexadecimal or
decimal format. (Hexadecimal numbers must be
preceded by 0x.) The elfsrec utility adds the
specified value to the memory address of each
line in the file.
Using StarCore-Specific elfsrec Options
For CodeWarriorTM for the StarCoreTM DSP, you can use the
following elfsrec options:
• -l
• -d
• -o
NOTE
For StarCore, elfsrec uses the -b option by default.
SC100-stat Utility
The sc100-stat utility is a standalone statistics tool for .eld files.
The sc100-stat utility reads a .eld file and returns statistics about:
• The number of instructions
• The type of instructions
• The number of instruction sets
ECM–292
StarCore DSP Targeting Manual
S ta rC o re D SP U t ili ti e s
SC100-stat Utility
• The ratio between the number of instructions and instruction
sets.
The syntax for sc100-stat follows:
sc100-stat .eld_filename [section_name...] [-d]
Table 14.13 describes the options for sc100-stat.
Table 14.13
sc100-stat Utility Syntax Options
Option
Description
.eld_filename
The name of the .eld file on which to run sc100stat.
section_name...
An optional list of section names for sc100-stat to
check. If no section names are listed, sc100-stat
checks the .text section by default.
-d
Causes sc100-stat to print the disassembled code
before the statistics.
StarCore DSP Targeting Manual
ECM–293
St ar C o re D SP U t ili t ies
SC100-stat Utility
ECM–294
StarCore DSP Targeting Manual
15
Link Commander
This chapter describes Link Commander, a graphical user interface
for editing linker command files.
The Linker Commander window consists of a menu bar, the LCF
pane, and the unassigned sections and symbols panes.
• User Interface
• Creating a Linker Command File
User Interface
This section describes the Link Commander user interface. To start,
select Project > Link Commander from the main menu.
Figure 15.1
Link Commander Window
menu bar
unassigned sections
LCF pane
unassigned symbols
StarCore DSP Targeting Manual
ECM–295
L in k C o m ma n de r
Menu Bar
Menu Bar
The menu bar contains:
File Menu
The file menu contains:
• New (blank file)
Creates a new, empty linker command file.
• New (template file)
• Creates a new linker command file using a linker command file
that you select as a template.
• Open
Opens an existing linker command file
• Save
Saves the current linker command file.
NOTE
Saving a file removes any comments that may have existed in the
original linker command file. To preserve comments, use Save As to
save the new linker file under a different name or path.
• Save As
Saves the current linker command file under the name and
path that you select.
• Save As and Update Project
Saves the current linker command file under the name and
path that you select, and adds the new file to the current
CodeWarrior project.
Undo
The undo menu lets you undo up to five previous actions.
Redo
The redo menu lets you redo up to five previous undo actions.
Palette
The palette menu lets you change the color scheme of the Link
Commander window.
ECM–296
StarCore DSP Targeting Manual
Li nk C o m ma n de r
Unassigned Sections
Architecture
The architecture menu lets you select an architecture from the list to
add memory range guides to the LCF pane based upon the selected
architecture and core.
Unassigned Sections
The Unassigned Sections pane contains the sections in your project
that are not yet mapped to locations within the linker command file.
To generate the list of sections within your project, you must first
compile your project.
Right-click a section to access the section placement pop-up menu.
Make a selection from this menu to place the section into the LCF.
Unassigned Symbols
The Unassigned Symbols pane contains common symbols in your
project that have not been assigned any value.
Right-click a symbol to assign a value to it.
LCF Pane
The LCF pane contains a graphical representation of the linker
command file.
Right-click on any existing LCF object to edit its properties.
Right-click on a blank portion of the pane to show the Add pop-up
menu actions to add LCF objects.
Figure 15.2
Add menu
StarCore DSP Targeting Manual
ECM–297
L in k C o m ma n de r
Creating a Linker Command File
Creating a Linker Command File
To create an LCF using Link Commander, you:
1. Assign Memory Addresses to Symbols
2. Create Memory Ranges
3. Create Segments
4. Assign Sections
5. Create an Entry Point
Assign Memory Addresses to Symbols
1
Right-click in the LCF Pane.
2
Select Add Symbol from the pop-up menu.
Create Memory Ranges
1
Right-click in the LCF pane.
2
Select Add Memory Range from the pop-up menu.
Create Segments
1
Right-click in a memory range inside the LCF pane.
2
Select Add Segment from the pop-up menu.
Assign Sections
1
Right-click a section in the Unassigned Sections pane.
2
Select a segment to assign the section to that segment.
Create an Entry Point
ECM–298
1
Right-click in the LCF pane.
2
Select Add Entry Point from the pop-up menu.
StarCore DSP Targeting Manual
16
Assembly and C
Benchmarks
CodeWarriorTM for the StarCoreTM DSP® includes common DSP
sample benchmark source code. You can use these benchmarks for:
• Evaluating the performance of the Metrowerks Enterprise C
Compiler
• Evaluating the performance of the StarCore DSP architecture
• Models of how to program for the StarCore DSP
The benchmark package contains the following items:
• C Benchmarks
• Assembly Benchmarks
C Benchmarks
The C benchmark source files reside in the following path:
Windows
Solaris
CodeWarrior_dir\Examples\StarCore\Benchmark\c\
install_dir/CodeWarrior_ver_dir/CodeWarrior_Examples/
Benchmark/c
Table 16.1 describes the benchmarks located in that directory.
StarCore DSP Targeting Manual
ECM–299
A s s e m b ly a n d C B e nc h ma r k s
Running the C Benchmarks
Table 16.1
C Benchmarks
Benchmark
Description
efr/src/autocorr
efr/src/chebps
efr/src/cor_h
efr/src/lag_max
efr/src/norm_corr
efr/src/search_10i40
efr/src/syn_filt
efr/src/vq_subvec
Enhanced Full Rate GSM vocoder standard C reference code
benchmarks. These functions represent the most MIPS-consuming
functions in the complete vocoder application.
msample/src/bqa1
Bi-Quad Simulation (1 sample)
msample/src/bqa2
Bi-Quad Simulation (multi-sample, 2 samples)
msample/src/bqa4
Bi-Quad Simulation (multi-sample, 4 samples)
msample/src/cora1
Correlation Simulation (1 sample)
msample/src/cora2
Correlation Simulation (multi-sample, 2 samples)
msample/src/cora4
Correlation Simulation (multi-sample, 4 samples)
msample/src/fira1
FIR Simulation (1 sample)
msample/src/fira2
FIR Simulation (multi-sample, 2 samples)
msample/src/fira4
FIR Simulation (multi-sample, 4 samples)
msample/src/iira1
IIR Simulation (1 sample)
msample/src/iira2
IIR Simulation (multi-sample, 2 samples)
msample/src/iira4
IIR Simulation (multi-sample, 4 samples)
The results of these benchmarks are a good indication of the
compiler performance on real DSP applications like the EFR.
Running the C Benchmarks
Two sample projects exist that include all the sources needed to
build the efr and msample benchmarks.
To run the C benchmarks:
1
Windows
• CodeWarrior_dir\Examples\StarCore\Benchmark\c\efr\e
fr.mcp
Windows
• \CodeWarrior_dir\Examples\StarCore\Benchmark\c\msam
ple\msample.mcp
Solaris
ECM–300
Open the CodeWarrior project file for either the efr or msample
benchmarks, which reside at the following locations:
• install_dir/CodeWarrior_ver_dir/CodeWarrior_Examples/
Benchmark/c/efr/efr.mcp
StarCore DSP Targeting Manual
A s s e m bl y a n d C B e nc hm a r k s
Additional Examples
Solaris
• install_dir/CodeWarrior_ver_dir/CodeWarrior_Examples/
Benchmark/c/msample/msample.mcp
Each of these projects contains a build target for each of the source
code samples.
2
To build a particular benchmark, select the target name from the
Current Build Target pop-up menu in the Files tab.
3
Choose Project > Make.
Additional Examples
The following directories contain more example programs that you
can run:
Windows
• CodeWarrior_dir\Examples\StarCore\c_asm_mix
Windows
• CodeWarrior_dir\Examples\StarCore\Command_Line_Scri
pt_Debug
Windows
• CodeWarrior_dir\Examples\StarCore\EOnCEDemo
Windows
• CodeWarrior_dir\Examples\StarCore\FileIO
Windows
• CodeWarrior_dir\Examples\StarCore\Profiler
Windows
• CodeWarrior_dir\Examples\StarCore\Sc140
Windows
• CodeWarrior_dir\Examples\StarCore\Simulator
Solaris
• install_dir/CodeWarrior_ver_dir/CodeWarrior_Examples/
c_asm_mix
Solaris
• install_dir/CodeWarrior_ver_dir/CodeWarrior_Examples/
FileIO
Solaris
• install_dir/CodeWarrior_ver_dir/CodeWarrior_Examples/
Sc140
Solaris
• install_dir/CodeWarrior_ver_dir/CodeWarrior_Examples/
Command_Line_Script_Debug
StarCore DSP Targeting Manual
ECM–301
A s s e m b ly a n d C B e nc h ma r k s
Assembly Benchmarks
Assembly Benchmarks
The assembly benchmark source files reside in the following path:
Windows
Solaris
CodeWarrior_dir\Examples\StarCore\Benchmark\asm
install_dir/CodeWarrior_ver_dir/CodeWarrior_Examples/
Benchmark/asm
There is an absolute and a relocatable version of each benchmark.
The directories that contain each benchmark reside in one of the
following directories, which are located in the overall benchmark
directory mentioned in the preceding paragraph:
Windows
• Absolute ASM
Windows
• Relocatable ASM
Solaris
• Absolute_ASM
Solaris
• Relocatable_ASM
Before using the relocatable version of a benchmark, you must
specify the linker command file for the benchmark in the settings
panel for the Enterprise Linker or DSP Linker. (The linker command
file is the file in each relocatable benchmark directory that has the
extension .mem.)
Table 16.2 lists the assembly benchmarks.
Table 16.2
ECM–302
Assembly Benchmarks
Benchmark
Description
blkmov
Block move
bq4
4 multiply biquad filter
bq5
5 multiply biquad filter
cfir
Complex FIR filter
cmax
Complex maximum
corr
Correlation or convolution
dotsq
Dot product and square product
eng
Vector energy
fft
256 point FFT transform, radix 4
iir
IIR filter
L1_norm
Mean absolute error
StarCore DSP Targeting Manual
A s s e m bl y a n d C B e nc hm a r k s
Assembly Benchmarks
Table 16.2
Assembly Benchmarks (continued)
Benchmark
Description
L2_norm
Mean square error
lfir
Lattice FIR filter
liir
Lattice IIR filter
lmsdly
Delayed LMS filter
minposr
Minimum positive ratio
minr
Minimum ratio
rmin
Real minimum
viterbi
Veterbi decoder
wht
Walsh-Hadamard transform
StarCore DSP Targeting Manual
ECM–303
A s s e m b ly a n d C B e nc h ma r k s
Assembly Benchmarks
ECM–304
StarCore DSP Targeting Manual
Index
A
address channel detection panels 162
after all previous
breakpoints 232
step 236
after end of statement
step 235
Assembler Compiler target settings panel 55
Assembler Preprocessors target settings panel
Check All Possible Errors in Execution
option 43
Create List File option 43
Display Banner option 42
Enable Message option 43
introduction 40
Overwrite Existing File option 41
Path for Include Files option 41
Preprocessor Definitions option 42
Processor option 42
Read Options from File option 41
Reassign Error Files option 41
Revision option 42
Use Access Paths Panel for Include Paths
option 42
B
begin of statement
breakpoints 232
benchmarks
assembly language 302
C 299
overview 299
breakpoints
after all previous 232
begin of statement 232
end of statement 232
naive 231
shadow 232
transparent 232
building code 27
C
C Language target settings panel
introduction 48
K & R/pcc Mode option 48
Strict ANSI Mode option 48
Type char signed option 49
Type char unsigned option 49
call tree, viewing 213
callers (of a function) 211
CCSSim 266
changing the program counter value 78
Code & Language Options target settings panel 52
Code Mapping utility 227
code, compiling 27
CodeWarrior
getting started 11
introduction 9
StarCore-specific development tools 15–17
target settings 33
tools, installing 12
command converter server
configuration 261
console 260
overview 257
remote connection 258
running 260
command-line debugging
clashing Tcl commands, resolving 92
commands
alias 98
break 99
bringtofront 100
cd 100
change 101
close 103
cls 103
config 103
copy 105
debug 106
dir 106
disassemble 107
display 108
evaluate 110
exit 110
go 111
help 111
history 112
hsst_attach_listener 112
StarCore DSP Targeting Manual
ECM–305
In d e x
hsst_block_mode 112
hsst_close 113
hsst_detach_listener 113
hsst_log 113
hsst_noblock_mode 114
hsst_open 114
hsst_read 114
hsst_write 115
input 115
kill 117
load 117
log 118
ls 106
next 118
output 119
pwd 121
radix 121
restart 122
run 123
save 123
step 124
stop 125
switchtarget 125
system 126
view 126
wait 127
watchpoint 127
introduction 92
tasks
clear a command from the command
line 96
copy text from the command-line
debugging window 98
enter a single command 95
enter multiple commands 95
open a command-line debugging
window 94
paste text into the command-line
debugging window 98
repeat a command 96
review previously entered commands 96
scroll text in the command-line debugging
window 97
switch between insert and overwrite
mode 97
view debugging command hints 95
Tcl script files, executing 93
Tcl start-up script, using 94
Tcl support 92
ECM–306
commands, profiler
Export 219, 220, 222
Function Call Tree 213
Functions 209
Instructions 210
Load 218
Save 217
Sessions 207
Source Files 214
Start 204
compiling
code 27
projects 27
cycle counter in the simulator 79
D
Data Event Detection Channel panel 165
data visualization 250
debugging
Connect command 81
EOnCE breakpoint example 176
EOnCE Configurator panels description 158
EOnCE features 157
EOnCE trace buffer example 192
multi-core debugging
commands 140
multiple targets, setting up to 135
program counter value, changing the 78
Register Details Window 76–78
SC100 menu 79
system-level connect 81
descendants (of a function) 211
development tools
StarCore-specific 15–17
DSP Librarian target settings panel
Additional Command Line Arguments
option 47
introduction 47
Output file name option 47
DSP Linker target settings panel 46
E
EE Pins Controller panel 159
.eld file, loading without a project 80
ELF file dump utility 289
elfsrec utility 291
end of statement
StarCore DSP Targeting Manual
Index
breakpoints 232
Enterprise Linker target settings panel
Additional Options 46
Display All Errors and Warnings option 46
introduction 45
Map File option 46
Output file name option 45
Start-Up File option 46
EOnCE
breakpoint example 176
EOnCE Configurator panels
address channel detection panels 162
Data Event Detection Channel panel 165
EE Pins Controller panel 159
Event Counter panel 168
Event Selector panel 170
Trace Unit panel 173
EOnCE Configurator panels description 158
features 157
trace buffer example 192
Event Counter panel 168
Event Selector panel 170
example programs
additional 301
assembly language 302
C benchmarks 299
F
Factory Settings button 35
fill memory 130
forward, step 234
function call tree, viewing a 213
Function Call Tree window 213
function details, viewing 211
Function Details window 211
G
generating
profiling reports
HTML 220
tab-delimited 219
XML 222
Get Simulator Statistics command 79
H
hardware target interface 261
High Speed Simultaneous Transfer (see HSST) 237
host-side client interface, HSST 237
HSST 237
client interface 237
target library interface 244
visualization 250
hsst_attach_listener 242
hsst_block_mod 241
HSST_close 245
hsst_close 238
hsst_detach_listener 243
HSST_flush 248
hsst_noblock_mode 242
HSST_open 244
hsst_open 238
HSST_raw_read 248
HSST_raw_write 249
HSST_read 247
hsst_read 239
HSST_set_log_dir 250
hsst_set_log_dir 243
HSST_setvbuf 245
HSST_size 248
hsst_size 241
HSST_write 246
hsst_write 240
hsst_attach_listener debugging command 112
hsst_block_mode debugging command 112
hsst_close debugging command 113
hsst_detach_listener debugging command 113
hsst_log debugging command 113
hsst_noblock_mode debugging command 114
hsst_open debugging command 114
hsst_read debugging command 114
hsst_write debugging command 115
HTI 261
HTML profiling report, generating an 220
I
I/O & Preprocessors target settings panel 60
iCache Performance tool
All Cores view 152
Core view 153
Function view 154
iCache Performance menu 150
iCache toolbar 150
input files 145
StarCore DSP Targeting Manual
ECM–307
In d e x
loading data for cores from one file 148
loading data for cores from separate files 147
One for all checkbox 148
Open Files window 146
PC view 155
starting 146
iCacheViewer window 143
IMMR value, setting in an initialization file 83
initialization file
commands
introduction 84
writeAllMask 84
writeAllmem8 85
writeAllmem16 85
writeAllmem32 86
writeAllmem64 86
writeAllmmr8 86
writeAllmmr16 86
writeAllmmr32 87
writeAllmmr40 87
writeAllmmr64 87
writeDevicemem8 87
writeDevicemem16 88
writeDevicemem32 88
writeDevicemem64 88
writemem8 88
writemem16 88
writemem32 89
writemem64 89
writemmr8 89
writemmr16 89
writemmr32 89
writemmr64 90
writereg8 90
writereg16 90
writereg32 90
writereg40 90
definition 82
example 82
IMMR value 83
initialization file, JTAG 135, 137
installing
CodeWarrior tools 12
instruction-level report, viewing 210
instruction-level report, viewing a 210
Instruction-Level Report window 210
introduction
to CodeWarrior 9
ECM–308
J
JTAG 261
JTAG initialization file 135, 137
K
kernel awareness 91
Kill All 140
L
line-by-line profiling (Profile Line-by-Line
window) 215
link commander 295
linker
settings 26
Linker pop-up menu 39
list of functions, viewing 209
List of Functions window 204
list of functions window 209
Listing File Options target settings panel
Additional Options text box 52
Display Warning Messages option 52
Expand DEFINE Directive Strings option 51
Flag Unresolved References option 52
Fold Trailing Comment option 51
Form Feed for Page Ejects option 51
Format Messages option 51
Generate Listing Headers option 51
introduction 50
Pretty Print Listing option 51
Print Conditional Assembly Directive
option 51
Print Conditional Assembly option 52
Print DC Expansion option 51
Print Macro Calls option 51
Print Macro Definitions option 52
Print Macro Expansions option 52
Print Memory Utilization Report option 52
Print Skipped Conditional Assembly Lines
option 52
Relative Comment Spacing option 51
load memory 128
load registers 132
loading profiles 218
LPT port 261
StarCore DSP Targeting Manual
Index
M
memory
fill 130
load 128
save 128
MMapQ001.h 83
Motorola documentation 10
MSC8102 simulator 266
msc8101.h 83
multi-core debugging
commands
Kill All 140
Run All 140
Stop All 140
N
naive
breakpoints 231
step 233
next,step 233
None option
in Pre-Linker pop-up menu 39
O
One for all checkbox (in the Open Files window of
the iCache Performance tool) 148
Optimizations target settings panel 62
Output Directory field 39
Output File Name field 38
P
parallel port 261
Passthrough, Hardware target settings panel 64
port, server listen 261
Post-Linker option 39
Pre-Linker pop-up menu 39
profile information line by line, viewing 215
Profile Line-by-Line window 215
profile, loading a a 218
profile, saving a 217
profiler
callers (of a function) 211
commands
Export 219, 220, 222
Function Call Tree 213
Instructions 210
Sessions 207
Source Files 214
Start 204
descendants (of a function) 211
Profiler Sessions window
opening 207
Remove All button 208
Remove button 207
removing a profiler session from the
window 207
removing all profiler sessions from the
window 208
tasks
generating a tab-delimited profiling
report 219
generating an HTML profiling report 220
generating an XML profiling report 222
launching the profiler 204
loading a profile 218
open a Profiler Sessions window 207
removing a profiler session 207
removing all profiler sessions 208
saving a profile 217
setting up to profile assembly language
programs 224
viewing a function call tree 213
viewing a list of functions 209
viewing an instruction-level report 210
viewing function details 211
viewing profile information line by
line 215
viewing source files information 214
windows
Function Call Tree window 213
Function Details window 211
Instruction-Level Report window 210
List of Functions window 204
list of functions window 209
Profile Line-by-Line window 215
Profiler Sessions window 207, 208
Source Files window 214
Terminal Window 204
Profiler > Export command 219, 220, 222
Profiler > Function Call Tree command 213
Profiler > Functions command 209
Profiler > Instructions command 210
Profiler > Load command 218
Profiler > Save command 217
Profiler > Sessions command 207
StarCore DSP Targeting Manual
ECM–309
In d e x
Profiler > Source Files command 214
Profiler > Start command 204
program counter value, changing the 78
project
building a project 27
compiling 27
project stationery
customizing a startup file 83
R
references
Motorola documentation 10
register description files, locating 77
Register Details Window 76–78
register groups, listed 75
register windows 75
viewing 75
registers
restore 132
save 132
release notes 9
remote connection
command converter server 258
requirements, system 11
Reset Machine Cycle Count command 79
Reset Machine Instruction Count command 79
restore registers 132
Revert button 35
RTOS, indicating the use of 91
Run All 140
S
save memory 128
Save Project Entries Using Relative Paths
checkbox 40
save registers 132
saving
profiles 217
SC100 Assembly Language Tools, described 16
SC100 Debugger Target 67
SC100 ELF Dump target settings panel 70
SC100 ELF to LOD target settings panel 72
SC100 ELF to S-Record target settings panel 72
SC100 menu 79
Get Simulator Statistics command 79
Reset Machine Cycle Count command 79
ECM–310
Reset Machine Instruction Count command 79
SC100 simulator 267
sc100-stat utility 292
server listen port 261
setting
a build target 39
setting up to profile assembly language
programs 224
settings panels 33–73
Settings window 25
shadow breakpoints 232
simulator
choosing to run the CodeWarrior debugger
with a simulator 68
MSC8102 266
SC100 267
source files information, viewing 214
Source Files window 214
stand-alone assembler See SC100 Assembly
Language Manual
StarCore Environment target settings panel
Big Memory Mode option 44
Big-Endian option 44
Display generated command lines in message
window option 44
introduction 43
stationery, project
customizing a startup file 83
step
after all previous 236
after end of statement 235
forward 234
naive 233
next 233
Stop All 140
system requirements
Windows 11
system-level connect, performing a 81
T
tab-delimited profiling report, generating a 219
target library interface, HSST 244
Target Name field 38
Target Settings panel 38–40
Linker 39
Output Directory field 39
Post-Linker 39
StarCore DSP Targeting Manual
Index
Pre-Linker 39
Save Project Entries Using Relative Paths
checkbox 40
Target Name 38
target settings panels 33–73
Assembler Compiler panel 55
Assembler Preprocessors panel 40
C Language panel 48
Code & Language Options panel 52
DSP Librarian panel 47
DSP Linker panel 46
Enterprise Linker panel 45
I/O & Preprocessors panel 60
Listing File Options panel 50
Optimizations panel 62
Passthrough, Hardware panel 64
SC100 Debugger Target 67
SC100 ELF Dump panel 70
SC100 ELF to LOD panel 72
SC100 ELF to S-Record panel 72
StarCore Environment panel 43
StarCore-specific panels list 36
Target Settings panel 38
target settings panels overview 33
Target Settings window 25
Trace Unit panel 173
transparent breakpoints 232
tutorial 19
building a project 27
compiling 27
modifying target settings panels 24
viewing target settings panels 24
U
utilities
Code Mapping 227
ELF file dump utility 289
elfsrec 291
sc100-stat 292
Utilities for StarCore
code mapping utility 17
Elfdump 17
elfsrec 17
V
viewing memory, in the Register Details
Window 76–78
viewing register windows 75
visualization
data 250
W
website 10
windows, profiler
Function Call Tree window 213
Function Details window 211
Instruction-Level Report window 210
List of Functions window 204
list of functions window 209
Profile Line-by-Line window 215
Source Files window 214
Terminal Window 204
Windows system requirements 11
writeAllMask 84
writeAllmem8 85
writeAllmem16 85
writeAllmem32 86
writeAllmem64 86
writeAllmmr8 86
writeAllmmr16 86
writeAllmmr32 87
writeAllmmr40 87
writeAllmmr64 87
writeDevicemem8 87
writeDevicemem16 88
writeDevicemem32 88
writeDevicemem64 88
writemem8 88
writemem16 88
writemem32 89
writemem64 89
writemmr8 89
writemmr16 89
writemmr32 89
writemmr64 90
writereg8 90
writereg16 90
writereg32 90
writereg40 90
X
XML profiling report, generating an 222
StarCore DSP Targeting Manual
ECM–311
In d e x
ECM–312
StarCore DSP Targeting Manual