1
RADOSYS User Manual
File Reference:
0
HOW TO READ THIS MANUAL................................................................................................................. 0-1
0.1
0.2
0.3
0.4
0.5
1
RSFS TYPE DETECTORS ................................................................................................................................ 2-1
RSFV TYPE DETECTORS ............................................................................................................................... 2-3
RADUET TYPE DETECTORS ......................................................................................................................... 2-4
RSNS TYPE DOSIMETER................................................................................................................................ 2-5
RSKS TYPE DOSIMETER................................................................................................................................ 2-6
OVERVIEW OF THE RADON MEASUREMENT PROCESS ................................................................. 3-1
3.1
3.2
3.3
3.4
3.5
3.6
4
THE ADVANTAGE OF THE CR-39 .................................................................................................................... 1-4
OVERVIEW OF THE RADOSYS CONCEPT ......................................................................................................... 1-4
OVERVIEW OF THE RADOSYS DETECTORS ....................................................................................... 2-1
2.1
2.2
2.3
2.4
2.5
3
NEW USER WHO IS LOOKING FOR APPLICATION ORIENTED STEP-BY-STEP RECIPE. .......................................... 0-1
NEW USER FOR APPLICATION RECIPE AND FOR SCIENTIFIC INFORMATION ...................................................... 0-2
ADVANCED USER TO OPTIMIZE THE EXISTING RADOSYS LAB PRACTICE ........................................................ 0-2
ADVANCED USER TO FIND SYSTEM SERVICE/MAINTENANCE INFORMATION .................................................. 0-2
N-DOSYS USERS FOR INFORMATION ABOUT NEUTRON DOSIMETRY APPLICATION ...................................... 0-2
INTRODUCTION TO THE RADOSYS SYSTEM ...................................................................................... 1-3
1.1
1.2
2
RS_Man82
Table of contents
Revised at 7/8/2013
THE WHOLE PROCESS IN GENERAL VIEW...................................................................................................... 3-1
EXPOSURE ..................................................................................................................................................... 3-1
PREPARATION OF DETECTORS FOR EVALUATION............................................................................................ 3-1
ETCHING PROCESS ......................................................................................................................................... 3-1
ANALYSIS ...................................................................................................................................................... 3-2
SYSTEM CALIBRATION CHECK ...................................................................................................................... 3-2
ROUTINE OPERATION ............................................................................................................................... 4-1
4.1 BEFORE EXPOSURE. HOW TO USE RADOSYS RADON DETECTORS................................................................. 4-1
4.2 AFTER EXPOSURE. HOW TO USE RADOSYS RADON DETECTORS................................................................... 4-2
4.3 DETECTOR ETCHING / TRACK DEVELOPMENT CHEMISTRY PROCESS ............................................................ 4-3
4.3.1
Overview of Radosys Etching Units .................................................................................................... 4-3
4.3.2
RadoBath 99 Standard Operation ....................................................................................................... 4-4
4.3.3
RB4 Etching Unit Standard Operation .............................................................................................. 4-17
4.4 DETECTOR EVALUATION / TRACK ANALYSIS PROCESS. GENERAL OVERVIEW ............................................ 4-29
4.5 MICROSCOPE MODEL SPECIFIC OVERVIEW. MODEL RSV6 VERSUS RSV60................................................ 4-29
4.6 VERSION OVERVIEW. MODEL RSV6 VERSUS RSV8 AND MODEL RSV60 VERSUS RSV80 ........................... 4-30
4.7 VERSION OVERVIEW. MODEL RSV8 VERSUS RSV10 AND MODEL RSV80 VERSUS RSV100 ....................... 4-30
4.8 ROUTINE OPERATION WITH THE RADOSYS RS-RM VERSION TRACK ANALYSIS SW ................................... 4-31
4.8.1
Starting up the Radosys Track Analysis System ................................................................................ 4-32
4.8.2
Routine Analysis ................................................................................................................................ 4-32
4.8.3
Help Features .................................................................................................................................... 4-38
4.9 RSV60 MODEL SPECIFIC SOFTWARE OPERATION ....................................................................................... 4-39
4.9.1
The Main Radometer Window and Extra Buttons at RSV60 Model .................................................. 4-39
4.9.2
The Automatic Measurement Window at Model RSV60 .................................................................... 4-40
4.9.3
How to remove slides from auto-feeder unit at case of slide stack failure ........................................ 4-41
4.10
RSV10X MODELS SPECIFIC OPERATION ................................................................................................. 4-45
4.11
VISUALIZATION OF RESULTS. THE DMU SOFTWARE.............................................................................. 4-48
4.11.1
Routine Operation With DMU-99 Version Software .................................................................... 4-48
4.11.2
General Information About the DMU-V6X Series Software ......................................................... 4-53
4.11.3
Routine Operation With DMU-V6R Version Software ................................................................. 4-54
4.11.4
Routine Operation With DMU-V6N Version Software ................................................................. 4-58
4.12
CALIBRATION DATA TABLE UPDATE (CF-CHART).................................................................................. 4-59
4.13
N-DOSYS, NEUTRON DOSIMETRY APPLICATION SPECIFIC PROCEDURE ................................................ 4-60
i
© 2011 by Radosys Kft. All rights reserved
RADOSYS User Manual
File Reference:
4.13.1
4.13.2
5
RS_Man82
Table of contents
Revised at 7/8/2013
General Information ..................................................................................................................... 4-60
The Pre-Treatment procedure ...................................................................................................... 4-60
ADVANCED OPERATION ........................................................................................................................... 5-1
5.1 DESKTOP ISSUES ............................................................................................................................................ 5-1
5.2 ROOT USER OPERATION ................................................................................................................................ 5-2
5.3 SYSTEM SETTINGS ISSUES .............................................................................................................................. 5-2
5.4 RADOSYS RSV6-RM SOFTWARE ADVANCED OPERATION ............................................................................. 5-3
5.4.1
Introduction ......................................................................................................................................... 5-3
5.4.2
Description of Main Control Buttons and Feature Controls ............................................................... 5-3
5.4.3
Evaluation Parameters (RS-RM version software) ........................................................................... 5-10
5.4.4
Evaluation process visualization, The Progress Window,( RM-V3 version) ..................................... 5-11
5.4.5
Slide edit option ................................................................................................................................. 5-14
5.4.6
Global Radosys Software Operation settings .................................................................................... 5-15
5.4.7
ManualControl operation.................................................................................................................. 5-16
5.4.8
Calibration Parameter Settings ......................................................................................................... 5-20
5.4.9
Debug window ................................................................................................................................... 5-21
5.5 RADOSYS DMU SOFTWARE ADVANCED OPERATION .................................................................................. 5-22
5.5.1
Warning And Error Codes ................................................................................................................ 5-22
5.5.2
Description of Columns in DMU Result Chart.................................................................................. 5-22
5.5.3
Data Listing With The DMU Software .............................................................................................. 5-22
5.5.4
Data Exportation to Other Applications ........................................................................................... 5-27
5.5.5
Calibration using the DMU-V6R software before October, 2012. .................................................... 5-30
5.5.6
Calibration using the DMU-V6R software after October, 2012........................................................ 5-34
5.6 TIPS AND TRICKS ......................................................................................................................................... 5-34
5.6.1
How to improve the imprecision at track counting? ......................................................................... 5-34
5.6.2
Chemistry related info ....................................................................................................................... 5-34
5.6.3
Track Size Optimization .................................................................................................................... 5-35
5.6.4
System Calibration ............................................................................................................................ 5-35
5.6.5
Setting Up Network Connection (RSV6X version)............................................................................. 5-35
5.6.6
When ID Code Reading Fails ............................................................................................................ 5-36
5.7 RADOSYS SPECIAL TYPE DETECTORS .......................................................................................................... 5-37
5.7.1
The RADUET Detector ...................................................................................................................... 5-37
5.7.2
Raduet Imprecision............................................................................................................................ 5-40
6
SYSTEM METROLOGY PERFORMANCE INFORMATION .............................................................. 6-42
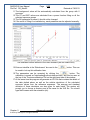
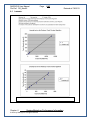
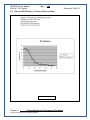
6.1 LINEARITY ................................................................................................................................................... 6-43
6.2 RADOSYS CR-39 QUALITY CONTROL STATISTICS DATA ............................................................................. 6-44
6.3 ACCURACY AND IMPRECISION ..................................................................................................................... 6-45
6.4 THE QUALITY CONTROL SYSTEM OF THE RADOSYS MADE RADON DETECTOR PRODUCTS ......................... 6-46
6.4.1
Introduction ....................................................................................................................................... 6-46
6.4.2
Quality Control of the manufactured CR-39 detector chips .............................................................. 6-46
7
RADOSYS SYSTEM ENGINEERING DETAILS ..................................................................................... 7-50
7.1 RADOSYS CR-39 CHIP STRUCTURE ............................................................................................................. 7-50
7.2 RADOSYS RADON DETECTORS..................................................................................................................... 7-51
7.2.1
General Overview on Radosys Radon Detector’s Principle of Operation ........................................ 7-51
7.2.2
About the Air-Gap of the Diffusion Chamber. Principle of Operation.............................................. 7-52
7.2.3
About the material of the diffusion chamber. .................................................................................... 7-54
7.2.4
Additional Information ...................................................................................................................... 7-55
7.3 RADOSYS MICROSCOPE OPTICS OVERVIEW................................................................................................. 7-55
7.4 RADOSYS MICROSCOPE MECHANICS OVERVIEW......................................................................................... 7-56
7.4.1
Mechanical Architecture ................................................................................................................... 7-56
7.4.2
Movements ......................................................................................................................................... 7-58
7.5 RADOSYS MICROSCOPE CONTROL OVERVIEW (RADOSYS 200X VERSIONS) ................................................ 7-59
7.5.1
Control Boards .................................................................................................................................. 7-59
ii
© 2011 by Radosys Kft. All rights reserved
RADOSYS User Manual
File Reference:
RS_Man82
Table of contents
Revised at 7/8/2013
7.5.2
Operation Status Indicators (Radosys 200X versions) ...................................................................... 7-60
7.6 THE SLIDE INSERT OPERATION .................................................................................................................... 7-62
7.7 RB4 ETCHING UNIT ..................................................................................................................................... 7-65
7.8 RADOSYS SOFTWARE RELATED ENGINEERING DETAILS ............................................................................. 7-66
7.8.1
Menu Chart Of the RM Version Software (RSV6 Model) .................................................................. 7-66
7.8.2
Information about the Radosys Track counting concept ................................................................... 7-66
7.9 CALIBRATION CONCEPTS ............................................................................................................................. 7-70
7.9.1
General Information .......................................................................................................................... 7-70
7.9.2
Interpretation of Terms (DMU-V99 Version) .................................................................................... 7-70
7.9.3
Calibration Data Exchange at DMU-V6R Version ........................................................................... 7-71
7.10
SCIENTIFIC BACKGROUND OF THE N-DOSYS NEUTRON DOSIMETER APPLICATION .............................. 7-72
7.11
ESTIMATION OF UNCERTAINTY OF RADON MEASUREMENTS WITH ALPHA TRACK DETECTORS –
THEORETICAL APPROACH ..................................................................................................................................... 7-73
8
INSTALLATION............................................................................................................................................. 8-1
8.1 UNPACKING ................................................................................................................................................... 8-1
8.2 PRE-INSTALLATION PROCEDURES .................................................................................................................. 8-1
8.3 INSTALLATION PROCEDURE OF THE MICROSCOPE AND THE COMPUTER UNITS (RSV6X) .............................. 8-2
8.3.1
Introduction ......................................................................................................................................... 8-2
8.3.2
Microscope and Control Computer ..................................................................................................... 8-2
8.3.3
General Computer Related Information .............................................................................................. 8-2
8.3.4
Computer Configuration Specific Information .................................................................................... 8-3
8.3.5
Warnings ............................................................................................................................................. 8-3
8.4 SOFTWARE UPGRADES................................................................................................................................... 8-4
8.5 INSTALLATION PROCEDURE OF THE RB4 ETCHING UNIT ............................................................................... 8-6
8.6 INSTALLATION PROCEDURE OF THE RADOBATH 99 ETCHING UNIT ............................................................... 8-6
9
MAINTENANCE AND TROUBLESHOOTING ......................................................................................... 9-1
9.1 KNOWN SOFTWARE BUGS OR OTHER MALFUNCTION, SEEMINGLY SOFTWARE BUG ..................................... 9-1
9.1.1
Image Capture Related Malfunctions .................................................................................................. 9-1
9.2 TROUBLESHOOTING ....................................................................................................................................... 9-2
9.2.1
When Closing the X-Windows Fails .................................................................................................... 9-2
9.2.2
Debug information for the system service (Radosys Version 2000/2003 only) ................................... 9-2
9.2.3
Debug information for the system service (Radosys Versions RSV6X) ............................................... 9-3
9.3 CODE READING CALIBRATION ....................................................................................................................... 9-3
9.4 TRAY INNER SECTION LUBRICATION .............................................................................................................. 9-5
9.5 REPLACEMENT OF THE BACKUP BATTERY (RADOSYS 2000 VERSION ONLY) .................................................. 9-6
9.6 PACKING RSV60 UNIT FOR TRANSPORTATION ............................................................................................... 9-8
9.6.1
Packing Elements ................................................................................................................................ 9-8
10
GLOSSARY ................................................................................................................................................... 10-1
11
PICTURE GALLERY................................................................................................................................... 11-1
12
SYSTEM SPECIFICATION ........................................................................................................................ 12-2
13
PRODUCT HISTORY AND VERSION INFORMATION ....................................................................... 13-5
13.1
RB4 ETCHING UNIT ................................................................................................................................ 13-5
13.1.1
Operation with RB4-FW1 Firmware Version ............................................................................... 13-5
13.1.2
Upgrading the Firmware of the RB4 Type Etching Unit .............................................................. 13-6
14
PRODUCT SALES CODES VERSUS TECHNICAL CODES. COMPARISON CHART. ................... 14-6
15
USER’S MANUAL VERSION HISTORY .................................................................................................. 15-7
15.1
15.2
15.3
15.4
iii
MAN_2K_71........................................................................................................................................... 15-7
RS-MAN61 ............................................................................................................................................. 15-7
RS-MAN62 ............................................................................................................................................. 15-7
RS-MAN63 ............................................................................................................................................. 15-8
© 2011 by Radosys Kft. All rights reserved
RADOSYS User Manual
File Reference:
15.5
15.6
16
iv
RS_Man82
Table of contents
Revised at 7/8/2013
RS-MAN81 ............................................................................................................................................. 15-8
RS-MAN82 ............................................................................................................................................. 15-8
LITERATURE ............................................................................................................................................. 16-10
© 2011 by Radosys Kft. All rights reserved
RADOSYS User Manual
File Ref. RS_Man82
Page
0-1
Revised at 7/8/2013
0 How to Read This Manual
The Radosys track analysis system is dedicated to all laboratories, which intends
- to start-up a radon test service or research by PADC/CR-39 technology or
- to start up neutron dosimetry service or research by PADC/CR-39 technology
or
- to update its existing CR-39 lab practice to a leading-edge technology or
- to extend its lab practice by the features of the PADC/CR-39 technology or
- to replace its current radioprotection technology to a PADC/CR-39 based one
Since the first launch of the first Radosys version in 1998, the users of the system
started their application from various platforms of knowledge about radioprotection,
radon and general dosimetry related issues. A part of them just wanted an application
oriented tool with a recipe about how to process a dosimeter service by step-by-step
instructions. Other users were interested in also the operational details for research
applications as well.
This Manual has been constructed with the concept to meet the demands and interests
by all kind of potential or existing users of the Radosys system. During composing this
Manual we paid a great attention on that to find a suitable structure of documentation,
which might make it efficient for all the Radosys users regardless their level of interest
about routine operation or engineering details.
This Manual contains a huge amount of information and guidance about the usage of
the system. But please do not worry about the size of this Manual. The routine
application of the system is far not as complicated as the size of the Manual may
suggest it at the first sight. The reason of those many pages in the Manual is that we
intended to equip this also with step-by-step instructions. Moreover many chapters are
included just for advanced operation. Nevertheless, because of trying to be detailed as
much as possible, the information may be redundant at certain chapters and crossreferences.
In order to find the most relevant information according to your interest, we suggest a
sequence of reading of Chapters to learn the usage of the system efficiently.
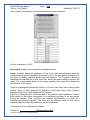
0.1 NEW USER WHO IS LOOKING FOR APPLICATION ORIENTED STEP-BY-STEP RECIPE.
Read the following Chapters
Chapter 3. <Overview of the radon measurement process>
Chapter 4.2.3. <RB4 Etching Unit Standard Operation>
Chapter 4.5. <Routine operation with the Radosys RS-RM Version Track Analysis
Software>
Chapter 4.7.1. <Routine Operation With DMU-99 Version Software>
Chapter 0.
How to Read This Manual
© 2013 by Radosys Kft. All rights reserved
RADOSYS User Manual
File Ref. RS_Man82
Page
0-2
Revised at 7/8/2013
0.2 NEW USER FOR APPLICATION RECIPE AND FOR SCIENTIFIC INFORMATION
Read the following Chapters
Chapters listed in section 0.1.
Chapter 2. <Overview of the Radosys Detectors>
Chapter 6. < System Metrology Performance Information >
Chapter 7.6.2.3. < The principle of the Statistically Stable Track Reading Approach >
0.3 ADVANCED USER TO OPTIMIZE THE EXISTING RADOSYS LAB PRACTICE
Read the following Chapters
Chapters listed in section 0.2.
Chapter 5. <Advanced Operation>
0.4 ADVANCED USER TO FIND SYSTEM SERVICE/MAINTENANCE INFORMATION
Read the following Chapters
Chapters listed in section 0.3.
Chapter 7. <Radosys System Engineering Details>
Chapter 9. <Maintenance and Troubleshooting>
0.5 N-DOSYS USERS FOR INFORMATION ABOUT NEUTRON DOSIMETRY APPLICATION
Read the following Chapters
Chapters listed in section 0.3.
Chapter 7.9. <Scientific Background of the N-DOSYS Neutron Dosimeter Application>
Chapter 2.4. <RSNS Type Dosimeter>
Chapter 4.8. < N-DOSYS, Neutron Dosimetry Application Specific Proceduer>
Chapter 0.
How to Read This Manual
© 2013 by Radosys Kft. All rights reserved
RADOSYS User Manual
File Ref. RS_Man82
Page
1-3
Revised at 7/8/2013
1 Introduction to the Radosys system
Thousands of radon tests are conducted all over the world in a single week. The radon
is the most significant naturally occurring radioactive source in the living environment. Its
existence is quite independent from the industrial activity as well as from the application
of the nuclear power. The potential health risk of the radon existed even at the ancient
time of the history, just this had been unknown until its discovery at the middle of the
'80s.
Nowadays hundreds of health care organizations and home inspection companies
conducts radon tests in dwellings, workplaces and schools regularly in order to locate
the living sites with high radon risk. In many countries every new house is required to
incorporate some degree of radon preventive measures at the time of construction in
accordance with the governmental regulation.
Our product concept is that we offer the user a system which includes all of the
components that is needed for conducting a radon survey. All of the components, from
the detector through the etching unit even to the automated track reader
instrumentation. Moreover, exact calibration data is supplied together with our radon
detectors.
The usage of the system does not need any additional research. As the system is
installed it is applicable for radon test instantly. The routine usage of the system does
not need a skilled person, it is easy to use and step by step instruction manual helps the
training. The consumed components, that are the CR-39 detector, exposure pot and
detector holder, are supplied by the manufacturer at an in-stock basis.
Thanks to the CR-39 technology, the RadoSys offers the customer the capability of
conducting big volume tests. This makes the RadoSys distinguished from any in-situ
device, the latter requires the placement of the equipment to the test site for a prolonged
time. Contrary, at the case of the RadoSys, the customer uses a central laboratory
evaluation unit and the on-field data collection is carried out by means of a big quantity
of low-cost detector devices. The number of the on-field detectors may exceed the
number of 10,000 pieces at the same time. Therefore, a radon survey may provide
individual data for each test site, and not just a sampling value extrapolated for a big
field area.
The customer owns the full range of tools for a radon survey. It does not need any
external service provider for the evaluation of the test detectors.
Concerning the level of the initial investment, that is needed to own the full forth of a
Radosys, the most expensive component is the RadoMeter automatic track-evaluating
microscope. However we are in the position that we can offer our product solution at a
price that is much far below the current market average. The secret of this that we are
developing an other product line with a similar image analyzer belonging to the area of
Chapter 1.
Introduction to the Radosys system
© 2013 by Radosys Kft. All rights reserved
RADOSYS User Manual
File Ref. RS_Man82
Page
1-4
Revised at 7/8/2013
medical electronics, and the joint manufacture condition permits us to keep the
manufacture cost of the RadoMeter microscope at low level.
1.1 THE ADVANTAGE OF THE CR-39
The CR-39 technology provides the opportunity of conducting Radon Activity
Concentration (RAC) test at many thousands of sites at the same time.
This also provides time integral RAC value, therefore any short-term variation of the
local RAC value can not provide misleading result. At the radon test of a site, the study
of the integral RAC value is relevant, since this provides information about the irradiation
load of the personals living at the site to be tested.
The detector itself, that is placed to the site to be tested for two-three months, is
inexpensive, therefore the management of the detectors does not need any particular
security consideration. Contrary the usage of any expensive test device would need this
consideration at the test site.
1.2 OVERVIEW OF THE RADOSYS CONCEPT
It is a fundamental concept of the RadoSys, that the product comprises all of the
components and tools, that is necessary to conduct series of radon activity
concentration measurement regularly. Nevertheless the system offers the feature of the
large-scale radon survey. The user can run many thousands of measurement at the
same time, and after taking the test detectors back to the user’s laboratory, the
evaluation and the RAC data is provided quickly, thanks to the large capacity etching
unit and to the full automated track evaluation image analyzer microscope. The user can
carry out the whole process without any assistance either of other laboratories or of the
manufacturer. As a result of the measure process, the user get a calibrated RAC data.
During the development of the RadoSys, the engineers paid a big attention to the safety
of the user. Concerning the safety, the only critical step is the etching of the detectors.
Since at this step the user have to treat dense sodium-hydroxide, this step of the
process needs some particular consideration. The process of the etching step and the
structure of the RadoBath etching unit was designed to prevent the user from any direct
contact with this dangerous material. Following the instruction of the user manual makes
this etching step extremely safe.
The only component, that are needed for the test process and are not provided by the
manufacturer of the RadoSys, these are a few sort of fine chemicals for the detector
etching step. However these chemicals are widely available at fine chemical material
suppliers, no any particularity with this materials.
Chapter 1.
Introduction to the Radosys system
© 2013 by Radosys Kft. All rights reserved
RADOSYS User Manual
File Ref. RS_Man82
Page
2-1
Revised at 7/8/2013
2 Overview of the Radosys detectors
Various types of detectors for indoor radon tests and for special applications are
available.
2.1
RSFS TYPE DETECTORS
This type of radon detector was the standard type in the Radosys’s detector production
program until 2005. In the Radosys production program the RSF type was replaced by
the RSKS type detector, which latter provides a good replacement with even better
application performance. The RSF type is no longer available to buy, but it has become
component of the Raduet type detector.
Detector Specification
Application Area: Indoor Radon Test
Also Workplace Application with Notice:
There is No any Built-In Working Hours Control Feature
Scope of Lab Practice:
Routine Analysis
Meets the requirements for Lab Accreditation
Typical Time of Exposure:
3 months. Can be extended to 6 months
Applicable also for short term test of 20 days, with precaution about the excess
imprecision occurring at short term tests.
Overall System Imprecision Utilizing RSFS Radon Detector:
15% for test region from 150 to 2000 kBq.h.m-3
Alpha Particle Detecting Substance:
PADC/CR-39 Plastics
Diffusion Chamber Concept:
Air-Gap Filter
Tamper Proof
Robust structure with extra Crash protection
Electro-Static Protection:
Diffusion Chamber Made of Conductive Plastics
Detecting Substance Pre-Treated by Dipping
CR-39 Chip Size;
100 mm2
Typical Equilibrium Time:
3 hours
Typical Sensitivity:
2.4 tracks.cm2.kBq-1.h-1.m3
Typical Initial Background
0.3 tracks.mm-2
Saturation Limit
greater than 12000 kBqh/m3
Note: Subtype RSFV with saturation limit of 100000 kBqh/m3
Standard Packaging Features:
– Custom Designed Label Service is Included
– Fully assembled detectors in airtight pouch with Al-vapor finish.
– Each detector is sealed into airtight/radon proof pouch in N2 atmosphere individually.
– Pouch is equipped with external detector ID label, with customized, two-color label.
– Pouch is equipped with V-like edge cutting section to open easily.
– Bar code on the external label is also available feature.
Chapter 2.
Overview of the Radosys detectors
© 2013 by Radosys Kft. All rights reserved
RADOSYS User Manual
File Ref. RS_Man82
Page
2-2
Revised at 7/8/2013
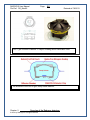
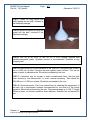
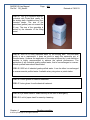
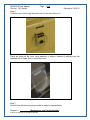
RSF Type Diffusion Chamber. A Layout Drawing and a Panoramic View.
The structure of the RSFS type, ready-made detector.
Chapter 2.
Overview of the Radosys detectors
© 2013 by Radosys Kft. All rights reserved
RADOSYS User Manual
File Ref. RS_Man82
Page
2-3
Revised at 7/8/2013
2.2
RSFV TYPE DETECTORS
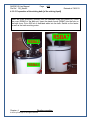
This is a subtype of the standard RSFS detector.
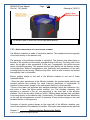
The structure of the RSFV Type detector.
The highlighted feature of this type is that the saturation limit is extended to 100000
kBq.h.m-3. Its principle of operation is based on the Radosys’s double chamber
technology.
It consists of two detector chips and two diffusion chambers; one detector chip for each
chamber.
The main detector chip works with the main RSF type diffusion chamber. The secondary
chip works with a secondary diffusion chamber, which decay volume is much smaller
than that of the main chamber. The main chamber performs higher sensitivity, which is
similar to that of the standard RSFS type. But the secondary chamber together the
secondary chip performs much lower sensitivity, providing significantly extended limit of
saturation.
Whenever the main chip goes to saturation, the secondary chip provides the radon
activity concentration result.
This detector type is suitable for applications, where the radon activity is unpredictable
before the test. Utilizing the RSFV detector may spare a repeated test, actually the time
of 3..6 months.
This is dedicated for application, where extreme activity levels used to happen, for
instance at tests in soil.
Chapter 2.
Overview of the Radosys detectors
© 2013 by Radosys Kft. All rights reserved
RADOSYS User Manual
File Ref. RS_Man82
Page
2-4
Revised at 7/8/2013
2.3
RADUET TYPE DETECTORS
This is a subtype of the standard RSFS detector.
RADUET Type detector. A Layout Drawing and a Panoramic View.
This detector type is dedicated to combination detection of radon and thoron activity at
the same time.
It consists of two detectors – a standard RSF type detector and a modified version, the
latter with reduced response time. The main chamber is selective for the radon activity
primarily. But the secondary chamber is sensitive for both radon and thoron. A simple
linear calculation separates the radon and thoron activity data results.
The RADUET type detector is a result of collaborative work of NIRS, Japan and of
Radosys Ltd.
The core reference in this respect is as follows.
“Radon-Thoron Discriminative Monitor” means: A newly designed alpha-track detector for discriminatively determining radon and
thoron concentrations. A prototype of the device is based on that in the article entitled A simple passive monitor for integrating
measurements of indoor thoron concentrations, published by Weihai Zhuo, Shinji Tokonami, Hidenori Yonehara and Yuji Yamada
NIRS in Review of Scientific Instruments, Vol. 73(8):2877-2881; 2002. Other, more comprehensive article from the same authors:
“Up-to-date radon-thoron discriminative detector for a large scale survey” by Shinji Tokonami, Hiroyuki Takahashi, Yosuke
Kobayashi, Weihai Zhuo and Erik Hulber in Review of Scientific Instruments, Vol. 76: 3505-3509, 2005.
Chapter 2.
Overview of the Radosys detectors
© 2013 by Radosys Kft. All rights reserved
RADOSYS User Manual
File Ref. RS_Man82
Page
2-5
Revised at 7/8/2013
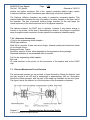
2.4 RSNS TYPE DOSIMETER
The RSNS type dosimeter is dedicated to individual fast neutron dosimetry, monitoring
radiation workers in environment and workplaces, where elevated level of doses from
fast neutrons is expected.
Abbreviations:
HDPE - High Density Polyethylene
PA – Polyamide
PP – Polypropylene
Structure of the RSNS type dosimeter
The PA converters in the badge are
marked by blue spots.
The RSNS dosimeter consists of two separate dose measurement sections.
One of them works with polyethylene converters, which is dedicated to the fast neutron
energy region. This is conventional way of counting fast neutron flux by CR-39 material.
Therefore this section is the main channel in the application of the RSNS dosimeter.
The second section works with polyamide (Nylon-6) converter. This type of converter
material is more sensitive for the epithermal energy region of neutrons, than the channel
of the PE converter. This approach can be considered less conventional, but this is
applied also by a few dosimeter service laboratories. At the RSNS dosimeters, this
channel is less characterized at the date of issuing this Manual. Therefore this channel
can be considered as added for the purpose of research applications.
The badge is just a holder of the PADC chips and converters. This is made of
polypropylene plastics, which is neutral concerning to this application. No any relevant
reaction with fast neutrons is occurred in it, so its contribution to the measured dose
result is negligible. The badge is equipped with handles providing fixing it easy.
Chapter 2.
Overview of the Radosys detectors
© 2013 by Radosys Kft. All rights reserved
RADOSYS User Manual
File Ref. RS_Man82
Page
2-6
Revised at 7/8/2013
2.5 RSKS TYPE DOSIMETER
This type of radon detector is the standard type in the Radosys’s detector production
program.
This type is a replacement for the former RSFS type detector.
Its advantage as compared to the RSFS type:
- Reduced size with max dimension of 1 inch, providing advantage at cost of service
delivery by standard mail in many countries.
- Improved background value because of its improved geometry and of eliminating extra
packaging components. Now the background value of the RSKS detector is in the range
of the performance of the bare Radosys PADC/CR-39 detector chips, which latter
provides one of the best quality for radon detectors on the global market today.
- The opening mechanism of the RSKS detector is very friendly. No any special tool is
needed. This can be dismantled by rather standard pliers.
- Its geometry provides larger area for customized labels with more textual information
and images.
Detector Specification
Application Area: Indoor Radon Test
Also Workplace Application with Notice:
There is No any Built-In Working Hours Control Feature
Scope of Lab Practice:
Routine Analysis
Meets the requirements for Lab Accreditation/Approval
Typical Time of Exposure:
3 months. Can be extended to 6 months
Applicable also for short term test of 20 days, with precaution about the excess
imprecision occurring at short term tests.
Overall System Imprecision Utilizing RSFS Radon Detector:
15% for test region from 150 to 2000 kBq.h.m-3
Alpha Particle Detecting Substance:
PADC/CR-39 Plastics
Diffusion Chamber Concept:
Air-Gap Filter
Tamper Proof
Robust structure with extra crash protection
Electro-Static Protection:
Diffusion Chamber Made of Conductive Plastics
Detecting Substance Pre-Treated by Dipping
CR-39 Chip Size;
100 mm2
Typical Equilibrium Time:
3 hours
Typical Sensitivity:
2.0 tracks.cm2.kBq-1.h-1.m3
Typical Initial Background
0.3 tracks.mm-2
Saturation Limit
greater than 12000 kBqh/m3
Note: Subtype RSFV with saturation limit of 100000 kBqh/m3 is also available
Standard Packaging Features:
– Custom Designed Label Service is Included
– Fully assembled detectors in airtight pouch with Al-vapor finish.
Chapter 2.
Overview of the Radosys detectors
© 2013 by Radosys Kft. All rights reserved
RADOSYS User Manual
File Ref. RS_Man82
Page
2-7
Revised at 7/8/2013
– Each detector is sealed into airtight/radon proof pouch in N2 atmosphere individually.
– Pouch is equipped with external detector ID label, with customized, two-color label.
– Pouch is equipped with V-like edge cutting section to open easily.
– Bar code on the external label is also available feature.
RSK Type Diffusion Chamber. Dimensions and Panoramic Views.
Illustration for customized labels is also shown.
Chapter 2.
Overview of the Radosys detectors
© 2013 by Radosys Kft. All rights reserved
RADOSYS User Manual
File Ref. RS_Man82
Page
3-1
Revised at 7/8/2013
3 Overview of the radon measurement process
3.1
THE WHOLE PROCESS IN GENERAL VIEW
The main sequence of indoor radon test process by the Radosys system.
3.2
EXPOSURE
The assembled test detector can be placed to the site to be tested. It should be stay
there 2..3 months. The RadoSys default calibration requires 80 days exposure time.
After this time the test detector should be taken back to the laboratory for evaluation.
3.3
PREPARATION OF DETECTORS FOR EVALUATION
In order to prepare the detector plastic pieces for etching, these should be dismounted
out of the RadoPot and should be mounted to the Radoslide accessory tool. The
RadoSlide is a plastic holder, with 12 nests for 12 detector pieces providing perfect
matching and fixing. The RadoSlide accessory is delivered with the RadoSet package.
To finish the preparation for the etching, the slides with detectors should be placed onto
the etching carousel. 36 slides can be placed on the etching carousel maximum. The
etching carousel is a part of the RadoBath unit. The RadoSlide accessory is useful also
as a long-term storage tool after the evaluation helping any repeated evaluation later.
3.4
ETCHING PROCESS
As a first step of the etching, the user should prepare the etching bath. After the
insertion of the stirrer accessory and closing the door of the RadoBath the user fills the
components of the etching bath into the RadoBath through a filler hole on the top of the
Chapter 3.
Overview of the radon measurement process
© 2013 by Radosys Kft. All rights reserved
RADOSYS User Manual
File Ref. RS_Man82
Page
3-2
Revised at 7/8/2013
enclosure unit. The components of the bath are distillated water and solid sodiumhydroxide. The process of solution is exothermal generating harmful vapors, however
the compact structure of the RadoBath prevents the user against this vaporization. As
soon as the solution process finished, the user can exchange the stirrer accessory to the
etching drum by a caliper accessory. The etching carousel fed by slides and detectors
should be inserted into the etching chamber of the RadoBath unit. The etching process
takes 4 hours. Than the etching solution can be drained, and a neutralizing solution
should be filled into the etching chamber. Draining the neutralizing solution and taking
the etching drum off, it should be stay to rinse and dry.
3.5
ANALYSIS
Removing the slides with detectors from the etching carousel, these should be inserted
to the RadoMeter automated microscope. The RadoMeter evaluates the detectors and
provides the RAC data either by printing or in data file format.
3.6 SYSTEM CALIBRATION CHECK
For the safety of the accuracy of the long-term operation, the calibration check of the
measure system should be done from time to time. It can be carried out by means of the
RadoCal calibration package. Processing the detectors with known RAC value of the
RadoCal, the calibration check can be done efficiently.
Chapter 3.
Overview of the radon measurement process
© 2013 by Radosys Kft. All rights reserved
RADOSYS User Manual
File Ref. RS_Man82
Page
4-1
Revised at 7/8/2013
4 Routine operation
4.1 BEFORE EXPOSURE. HOW TO USE RADOSYS RADON DETECTORS.
All types of Radosys radon test detectors are ready-made types. These are delivered in
fully assembled form and are sealed into radon-proof foil pouch.
The detector is activated by removing the foil pouch. At the moment when the pouch is
removed the exposure period starts.
Recommendation for the usage of the detectors:
Before the detector is sent to the site to be tested, record the ID code number on the
pouch and assign it to a site identification data. On the external label of the pouch the
alphanumeric ID code is accompanied with standard bar code, which latter provides
option of scanning it by means of a bar code reader device.
Instruct the person deploying the detector on the site, as follows:
- Remove the foil pouch, when the detector is placed to the site to be tested.
- No any additional action or switching on step is needed. The detector is activated by
removing the foil pouch. There is a pre-cut on the open edge of the pouch helping at
tearing the pouch up easy.
- After the recommended time of exposure, 3 months, record the date and send the
detector back to the service provider company for evaluation. The best practice is when
the detector is posted immediately.
- Request sending information about the start and end date of exposure.
How and where to place the detectors in the room to be tested.
There is no any particular or specific suggestion about how and where to place the
radon detector. The actual way depends on the preference and practice of the test
service company. However a few examples can be mentioned.
- The most popular way is when the detector is simply placed onto book shelf or flower
shelf.
- It can be attached under a table using double face tape. Top-down position does not
influence on the result. Any orientation of the container works equally. But when the
container is fixed by a tape, use the rear of the container. Do not cover the cap side of
the chamber, actually where the air-gap takes place.
- It can be placed hanging from the ceiling by a string. If this mode is preferred an
inexpensive accessory item is also available for this purpose.
Chapter 4.
Routine operation
© 2013 by Radosys Kft. All rights reserved
RADOSYS User Manual
File Ref. RS_Man82
Page
4-2
Revised at 7/8/2013
General notes about the application of any AT radon detectors.
Avoid placing the detector close to a heat source, to direct sunlight or anything, which
might keep the detector at elevated temperature through a prolonged time. The AT
detectors provide the best performance and accuracy at room temperature. Extremely
humid environment is also recommended to avoid. For radon tests in humid
environments, for instance in spa, caves or workplaces with elevated humidity level,
special dedicated type of AT radon detectors are suggested and are available.
More information about the structure and performance of the Radosys radon detectors
can be found in Chapter 7, Radosys System Engineering Details.
4.2
AFTER EXPOSURE. HOW TO USE RADOSYS RADON DETECTORS.
When the exposed detector is returned to the laboratory, this should be dismounted and
its sensor component, the PADC/CR-39 chip should be removed and mounted onto the
plastic slide accessory.
When it’s happened that the returned and exposed detector is needed to store for a
while, keep it in radon free environment. Storing on the second floor or outdoor may be a
perfect solution, since the radon level on ground floor is always higher. If storing the
returned and once activated detectors on ground floor is unavoidable, test the room for
radon level and be ensured that the level of radon activity is not elevated there.
The key rule to achieve the best performance of an AT radon test, is the purity of the
detector chip treatment. Any dust or impurity or scratches on the CR-39 detector chips
may reduce the accuracy and reliability of the result. This requirement does not need
any special workplace for the detector handling, just some careful detector handling.
Try to choose a room for dismounting the detector upstairs, since the radon activity is
always higher at the ground floor.
Instructions step by step. How to remove the detector chip?
- Dismount the detector canister by separating its lid and pot sections.
At the RSK type diffusion chamber this can be done by rather standard pliers. A very
useful type of pliers is delivered by Radosys together with the measurement system.
At the RSF type diffusion chamber a special tool is needed.
- Remove the PADC chip out of the canister by tweezers. Grab the chip on its
alphanumeric code area only, in order to avoid making any scratch on the active surface
area. The best practice is when plastics tweezers and laboratory textile or latex gloves
are used.
- Remove any remainder of the blue adhesive from the chip.
- Mount the detector chip onto the plastic slide holder accessory. This is described in
Chapter 4.3.2.4, Preparation of Detectors for the Etching Process.
Chapter 4.
Routine operation
© 2013 by Radosys Kft. All rights reserved
RADOSYS User Manual
File Ref. RS_Man82
4.3
Page
4-3
Revised at 7/8/2013
DETECTOR ETCHING / TRACK DEVELOPMENT CHEMISTRY PROCESS
4.3.1 OVERVIEW OF RADOSYS ETCHING UNITS
Two different types of etching unit are supplied with the Radosys etched-track analysis
system. The RadoBath 99 version was available between October, 1998 and May,
2005. After May, 2005 the version RB4 etching unit is available.
The RB4 version is fully compatible with the traditional Radosys application. All the
accessory items are interchangeable with the former RadoBath 99 unit. Also the
chemistry operation is the same. The RB4 version can be considered as a significantly
upgraded version of the former RadoBath 99 unit. The structure of its body is different; it
is made of metal and not of plastics, so the RB4 is much more durable. The temperature
is regulated by advanced microprocessor technology, contrary to the electro-mechanical
type regulator of the RadoBath 99. Thanks to the µP-driven electronics, software
features have been also implemented. The whole chemistry process is controllable by
means of the front panel keyboard and display. Nevertheless now also the etching time
is selectable.
Because of the major similarity between the former version and the RB4 units, in the
Chapter ‘RB4 Etching Unit Operation’, only the version specific issues are documented
here. In all other respects read and use the information in the Chapter ‘Radobath 99
Standard Operation’.
RB4 Product Version History Information:
Since the time of its first introduction, the RB4 equipment has been delivered with
different firmware versions. Before September, 2005 the firmware version FW-1 was
implemented in the delivered units, and later on from September, 2005 the firmware
version FW-2 was implemented in the delivered equipments. From June 2006 the
delivered units were equipped with the firmware version FW-3 and most of the earlier
units had been upgraded at the firmware.
Chapter 4.
Routine operation
© 2013 by Radosys Kft. All rights reserved
RADOSYS User Manual
File Ref. RS_Man82
Page
4-4
Revised at 7/8/2013
4.3.2 RADOBATH 99 STANDARD OPERATION
4.3.2.1 Warnings
The dense sodium-hydroxide, particularly at its hot temperature form is an extremely
dangerous material. Any direct contact may cause painful and hazardous health
damage. Be careful at handling. However the Radobath process is designed to be safe if
you keep the rules. If you are not familiar with handling of chemicals, please consult with
a laboratory chemist.
Do not switch on the power of the bath unit at its empty state without any liquid. This
may cause damage of the heater and/or the stainless steel bath container.
Chapter 4.
Routine operation
© 2013 by Radosys Kft. All rights reserved
RADOSYS User Manual
File Ref. RS_Man82
Page
4-5
Revised at 7/8/2013
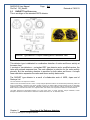
4.3.2.2 Key accessories at Radobath 99 version Etching Unit
The needed accessories listed here are items to be used through a prolonged time or
being consumable items. Some of the constant items are included in the Radobath
package, others should be purchased by the user at a local dealer. No any specialty
concerning the non-standard items, those are available at any chemistry accessory
shop or even at a general household shopping mall. Some of the consumable items
can be purchased at fine-chemicals dealer, some of them at rather public shops, at
household shops or at petrol station. The only consumable items, that the user
should be care of, that are the components of the etching bath, namely the sodiumhydroxide crystal and the high-quality distillated water solvent. The quantity of the
consumable items listed here is determined for a single etching process, that is for
maximum 432 detectors, which detector quantity is the full load of the Radobath
etching unit.
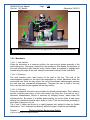
RSBA1,2/ Radobath main unit. This is
an electrically powered etching unit
included in the Radobath package.
This unit requires the availability of an
electric power network. The unit is
delivered according to the local electric
power network standards. Local
standard power cord is included.
RSBA3/ Bath mixing motor power
adapter. Included in the Radobath
package. (Radobath 99 version only)
Chapter 4.
Routine operation
© 2013 by Radosys Kft. All rights reserved
RADOSYS User Manual
File Ref. RS_Man82
Page
4-6
Revised at 7/8/2013
RSBA4/ Bath preparation mixer
accessory. Included in the Radobath
package.
RSBA5/ Etching carousel for fixing the
detector holder Slides. Included in the
Radobath package.
RSBA6/ Lifter / Removal accessory to
remove the etching carousel or stirrer
out of the bath. Included in the
Radobath package.
Chapter 4.
Routine operation
© 2013 by Radosys Kft. All rights reserved
RADOSYS User Manual
File Ref. RS_Man82
Page
4-7
Revised at 7/8/2013
RSBA7/ Funnel for filling liquids and
NaOH pellets into the bath. Included in
the Radobath package.
RSBA8/ Spatula or spoon for filling the
crystal into the bath. Included in the
Radobath package.
RSBA9/ 300 ml of 20 v/v% or 400 ml of 15 v/v% vinegar solution with
industrial/household grade. Synthetic product is recommended. Available at any
shopping mall.
RSBA10/ Laboratory tray for the basement of the main unit. Size should be 400x400
mm or ∅350 mm at least. Prevents the desk against basin pollution. This can be
made of plastic or stainless steel. Should be purchased by the user.
RSBA11/ Laboratory tray for storage of basin contaminated items, that are bath
mixer accessory, rod thermometer, or mixer removal accessory. Size should be
400x400 mm or ∅350 mm at least. Should be purchased by the user.
RSBA12/ Rod thermometer. This is an optional item for checking the temperature of
the bath. Not a requirement, however recommended for the control of the proper
operation. Should be purchased by the user. Temperature range up to 100 °C, length
300mm at least, no relevant restriction about diameter. Diameter can not exceed 20
mm.
Chapter 4.
Routine operation
© 2013 by Radosys Kft. All rights reserved
RADOSYS User Manual
File Ref. RS_Man82
Page
4-8
Revised at 7/8/2013
RSBA13/ 1000 g of crystalline sodiumhydroxide with Puriss-Anal quality for
the etching bath. Available at any finechemical dealer. The size of the
granulates (pellets) can not exceed the
10 mm. The size of the granulate is
limited by the diameter of the filling
funnel.
RSBA14/ 4000 ml of finely distillated water for the etching bath. The puris-anal
quality is not a requirement, it does not worth to apply this expensive sort of
chemical water. However the application of the water produced by a real distillation
machine is highly recommended to achieve the optimal performance. The
application of any industrial quality purified water, that is ion-exchanged or reverseosmotic purified water should be avoided.
RSBA15/ 8000 ml of industrial grade purified water. It can be either ion-exchanged
or reverse-osmotic purified water. Available at any drug store or petrol station.
RSBA16/ Cotton gloves for detector treatment.
RSBA17/ Latex gloves for safe chemical treatment.
RSBA18/ Eye-wash stand for health security at the case of emergency.
RSBA19/ A roll of paper-towel for security cleansing.
Chapter 4.
Routine operation
© 2013 by Radosys Kft. All rights reserved
RADOSYS User Manual
File Ref. RS_Man82
Page
4-9
Revised at 7/8/2013
RSBA20/ 20 l plastic bag for basin contaminated item waste disposal at the case of
emergency.
RSBA21/ 4000 ml of 20 v/v% vinegar solution or 20,000 ml of tap water for waste
basin disposal. Please check the secure basin dilution rate at your local environment
protection standard. Synthetic product is recommended for the vinegar solution.
RSBA22/ 4000 ml of plastic container for the temporal storage of the neutralized
basin waste solution.
RSBA23/ 4000 ml or two 2000 ml of
high-temperature laboratory bottle for
the drainage and storage of the hot
etching bath. Nominal temperature of
150 °C is recommended for the bottle.
Adding a pouring ring is also
recommended.
Chapter 4.
Routine operation
© 2013 by Radosys Kft. All rights reserved
RADOSYS User Manual
File Ref. RS_Man82
Page
4-10
Revised at 7/8/2013
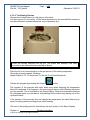
4.3.2.3 Preparation of the etching unit for the etching process
Please find the details in the chapter “ Installation procedure of the RadoBath Etching
Unit”
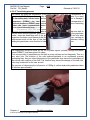
4.3.2.4 Preparation of the detectors for the etching process
Chapter 4.
Routine operation
© 2013 by Radosys Kft. All rights reserved
RADOSYS User Manual
File Ref. RS_Man82
Page
4-11
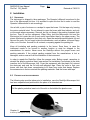
Revised at 7/8/2013
By the time of the etching process the on-field detectors, that are the radon
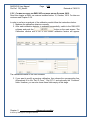
Mount
theplastic
RadoSlide
holders
filledexposure
by the detector
thetaken
etching
sensitive
piecesdetector
inside the
Radopot
canister,pieces
have to
been
to
drum.
There arefrom
series
of site
mounting
the bottom
the disc
of the
the laboratory
the
to begrooves
tested. atRemove
thesection
plastic ofchips
from
etching drum.
The detector
holder
alsotocomprises
a matching
groove.
Theunit.
detector
exposure
chamber
and place
them
the Radoslide
detector
holder
Use
holder
be for
inserted
into the
of the chips,
disc byina order
firm sliding
motion.
cotton can
gloves
the handle
of groove
the detector
to avoid
any unwanted
contamination of the etching solution.
Please care of the proper orientation of the detector holder. There is a conic open
at
oneeach
end of
the detector
holder
insertion.
thisaccessory,
conic end the
for
Place
detector
chip into
eachgroove
nest offor
theeasy
black
detectorUse
holder
proper
orientation
of
the
detector
holder.
The
proper
orientation
ensures
that
the
RadoSlide, which is applicable for twelve detector chips at the same time. The firm
mechanical
force of the bath
motion
during so
theindicating
etching will
pushmechanical
the plastic
insertion is accompanied
with fluid
a soft
click noise,
its right
piece
into
the
direction
of
its
nest
and
not
towards
its
removal.
The
improper
fixing.
orientation of the detector holder may cause the plastic piece falling down during
the
etching.
Please
care of the proper orientation of the chips.
The engraved codes should be faced upward, therefore the active surface of the
chip should be on the top after the insertion. On the other hand, the proper
orientation of the codes relative to the holder arrangement is also a requirement
considering to the time of the analysis. The analysis software, that is the automatic
code reading routine expects the ID code be placed at the right position.
The alphanumeric code should be at the left and the dot-code at the bottom.
Chapter 4.
Routine operation
© 2013 by Radosys Kft. All rights reserved
RADOSYS User Manual
File Ref. RS_Man82
Chapter 4.
Page
4-12
Revised at 7/8/2013
Routine operation
© 2013 by Radosys Kft. All rights reserved
RADOSYS User Manual
File Ref. RS_Man82
Page
4-13
Revised at 7/8/2013
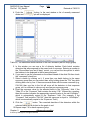
4.3.2.5 Preparation of the etching bath [of the etching liquid]
Insert the mixer accessory (RSBA4) into the Radobath main unit (RSBA1,2). Close
the cover (RSBA2) of the bath unit. Insert the plastic funnel (RSBA7) into the hole on
the bath cover. Pour 4000 ml of distillated water into the bath. Switch on the heater
as well as the bath revolving motor.
Chapter 4.
Routine operation
© 2013 by Radosys Kft. All rights reserved
RADOSYS User Manual
File Ref. RS_Man82
Page
4-14
Revised at 7/8/2013
4.3.2.6 The etching process
The heater will arise the temperature of the water gradually. Wait until the temperature of
the
Use
water
latexisgloves.
60 °C. Open
This can
thebe
cover
controlled by the insertion of a rod thermometer if you want
toofcreate
your own
practice.
the insertion of the thermometer be careful not to damage it
the etching
bath.
Lift theAt
mixer
byaccessory
the revolving
(RSBA4)
mixer, please
by find
thethe safe position of the thermometer. The temperature of
60
°C can accessory
be also controlled
byand
an empirical heater time control. From the time of switching
removal
(RSBA6)
on
place
the heater,
the basin
the temperature
contaminated
of the water will be 60 °C at the time of
mixer10
onto
minutes
a laboratory
at 220Vtray.
mains power
30 minutes at 100V/130V mains power
As soon as the temperature of the water reaches 60 °C, switch off the heater and start to
add the solid sodium-hydroxide granulates to the water. Do not start to add the granulates
earlier, since the dissolution rate of the granulates is poor at cold water. If this rule were
neglected, the basin could freeze at the bottom, especially within the drain tap, causing an
inconvenient stuck at the time of the drainage. Electric heating is not necessary during
adding the granulates, since this kind of chemical process is an exothermic one.
The dispensing should be done by the 25 ml plastic spoon (RSBA8) through the plastic
funnel (RSBA7). Use latex gloves for safety.
Pour one spoonful of granulates into the bath at every minutes and not frequently. This is a
very strict rule. The solution of the solid sodium-hydroxide is an exothermic process
generating heat. Any too violent dispensing of the granulates may cause the overheating of
the solution with overflow of the fluid. The overflow may cause the damage of the bath unit,
even may be harmful for the user as well.
The process of dispensing the full amount of 1000g of sodium-hydroxide granulates takes
40 minutes approximately.
Chapter 4.
Routine operation
© 2013 by Radosys Kft. All rights reserved
RADOSYS User Manual
File Ref. RS_Man82
Page
4-15
Revised at 7/8/2013
Close the cover of the etching bath. The etching process takes 4.5 hours. The
length of this time should be controlled thoroughly. Any shorter or prolonged time
of the etching process may cause improper size of the alpha tracks, therefore it
should be avoided. After four hours switch off the heater and drain the basin into
heat-proof laboratory glass. But do not stop the mixer motor. Mixing the liquid will
increase the efficiency also during the neutralization. The basin neutralization step
should be started immediately.
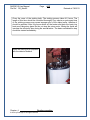
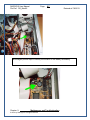
Insert the etching drum prepared
with the detector holders.
Chapter 4.
Routine operation
© 2013 by Radosys Kft. All rights reserved
RADOSYS User Manual
File Ref. RS_Man82
Page
4-16
Revised at 7/8/2013
4.3.2.7 Neutralization bath
Prepare a diluted synthetic vinegar solution by adding 200ml of 15% or 20% vinegar into
4000 ml of distillated water. Pour the solution into the bath tank. After a few minutes
drain the neutralized fluid into a laboratory plastic container.
4.3.2.8 Final washing bath
Pour 4000ml of washing distillated water into the bath tank. Drain the washing water into
a laboratory plastic container.
4.3.2.9 Rinsing and drying
Open the cover door of the etching unit and remove the etching drum. Place it to a
laboratory tray for rinsing and drying. After an hour of drying the detector holders with
the radon test plastic pieces can be taken for evaluation at the Radometer track
evaluation unit.
4.3.2.10
Storage of the chemicals
The hot sodium-hydroxide solution should be stored in heat-proof laboratory glass. The
neutralization and final washing water bath can be stored in any plastic container.
4.3.2.11
Waste chemical treatment
Concerning the disposal of the used chemicals, the sodium-hydroxide solution should be
treated with extreme attention. It can not be disposed directly because of environmental
safety reasons. Two alternative methods can recommended for the disposal. This can
be disposed either by neutralization or by proper dilution. One liter of sodium-hydroxide
solution can be neutralized by adding four liter 15% vinegar solution. The proper dilution
rate in tap water is an other method. Concerning the permitted dilution rate, please
consider the local environmental standard or consult a environmental safety engineer.
Chapter 4.
Routine operation
© 2013 by Radosys Kft. All rights reserved
RADOSYS User Manual
File Ref. RS_Man82
Page
4-17
Revised at 7/8/2013
4.3.3 RB4 ETCHING UNIT STANDARD OPERATION
Read also the Chapter 4.2.1, OVERVIEW OF RADOSYS ETCHING UNITS
Information about firmware versions.
Units with S/N. RB4-104 or higher were supplied with firmware version RB4-FW2 or
FW3. The operation for these, 2nd generation, units is documented in the chapter 4.3.2.
The firmware version FW2 was designed to providing full functionality of the Radosys
brand RB4 Etching Equipment. The next features are implemented in the FW2 firmware
version.
Application oriented series of programs are available, which provides assistance and
automatism through the entire process of the detector development. That is through the
steps of Etching Liquid Preparation, Main Etching Step, Neutralization Step, and Final
Washing Step.
The programs and settings are controlled by means of the front panel keys. The front
panel LCD display provides in situ information about the progress of the program.
Timer functions and sound alarms are implemented in order to provide assistance for
the exact fulfillment of a Track-Etch detector development recipe.
The firmware versions FW2 and FW3 are almost the same. The only difference that a
new feature was added to the FW3.
At units with firmware version FW3, the etching time can be set by the user freely.
However this is recommended for research purpose only. The default settings of 4.5
hours is recommended for routine application.
4.3.3.1 Warnings
4.3.3.1.1 Precautionary Measures at Handling Chemicals
The dense sodium-hydroxide, particularly at its hot temperature form is an extremely
dangerous material. Any direct contact may cause painful injure. Be careful at handling.
However the Radobath process is designed to be safe if you keep the rules. If you are
not familiar with handling of chemicals, please consult with a laboratory chemist.
Always use latex gloves to handle chemicals.
4.3.3.1.2 Precautionary Measures at Using the Etching Unit Empty
Do not switch on the heater of the bath unit at its empty state without any liquid. This
may cause damage of the heater and/or the stainless steel bath container.
4.3.3.1.3 Pot and Lid Are Matching Parts
The lid and pot sections of each RB4 Etching unit were manufactured as matching parts.
The lids are not interchangeable between different RB4 units. The serial numbers are
printed on the ID labels located at the rear wall of the lid and pot sections. The matching
pairs of Pot and Lid are labeled by matching part numbers, for instance RB4-123-POT
and RB4-123-LID.
Chapter 4.
Routine operation
© 2013 by Radosys Kft. All rights reserved
RADOSYS User Manual
File Ref. RS_Man82
Page
4-18
Revised at 7/8/2013
4.3.3.1.4 Precautionary Measures at Power Network Connection
Always use the RB4 Etching Unit with a power network socket, which has a ground
contact. The body of the RB4 unit is made of metal and its operation with grounded
power network socket is a requirement. It is strictly prohibited to use it with two-pole
electric power sockets. The RB4 unit is delivered with a power plug having ground
contact. Only a completely matching socket is permitted to use. The supplier of the
system, Radosys Ltd does not admit any responsibility if this strict rule is failed or
neglected in any respect.
Chapter 4.
Routine operation
© 2013 by Radosys Kft. All rights reserved
RADOSYS User Manual
File Ref. RS_Man82
Page
4-19
Revised at 7/8/2013
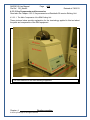
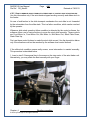
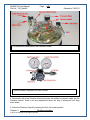
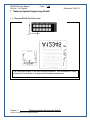
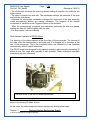
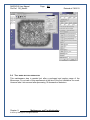
4.3.3.2 Key Components and Accessories
Read also the Chapter 4.2.2.2, Key accessories at Radobath 99 version Etching Unit
4.3.3.2.1 The Main Components of the RB4 Etching Unit
These pictures below provide explanation for the terminology applied in this text about
the parts and components of the RB4 equipment.
The main sections of the RB4 Etching Equipment
Chapter 4.
Routine operation
© 2013 by Radosys Kft. All rights reserved
RADOSYS User Manual
File Ref. RS_Man82
Page
4-20
Revised at 7/8/2013
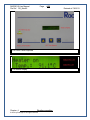
The Front Panel Keyboard
The Status Display
Chapter 4.
Routine operation
© 2013 by Radosys Kft. All rights reserved
RADOSYS User Manual
File Ref. RS_Man82
Page
4-21
Revised at 7/8/2013
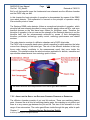
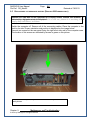
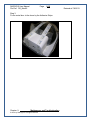
4.3.3.2.2 The Lid Section of the RB4 Etching Bath
This picture demonstrates the proper handling of the Lid. The lid of the RB4
unit can be removed up from the Pot section by lifting it by its handles. Place it
to the Pot section in reverse order.
Chapter 4.
Routine operation
© 2013 by Radosys Kft. All rights reserved
RADOSYS User Manual
File Ref. RS_Man82
Page
4-22
Revised at 7/8/2013
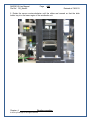
4.3.3.2.3 The Functional Components of the Lid Section
Bottom view of the Lid Section. There are two metal rods at the bottom of the Lid.
Their role is two-fold. They assist at the proper positioning of the lid to the pot
section. But they also act as an electric wire to power the stirrer motor.
The stirrer clutch has a definite direction of rotation ensuring the proper operation.
Chapter 4.
Routine operation
© 2013 by Radosys Kft. All rights reserved
RADOSYS User Manual
File Ref. RS_Man82
Page
4-23
Revised at 7/8/2013
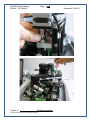
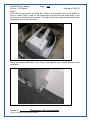
4.3.3.2.4 Proper Placement of the Lid to a Desk
The Lid can be placed to a tray or desk as a three-leg item, by means of its
two position rods and the stirrer clutch.
4.3.3.3 Preparation of the etching unit for the etching process
Please find the details in the chapter “ Installation of the RB4 Etching Unit”
4.3.3.4 Preparation of detector chips for the etching process
Read the corresponding Chapter 4.2.2.4 in the Section “Routine operation with the
RadoBath 99 etching unit”.
Warning.
The etching carousel has 24 slots for slides, which makes maximum 36 slides possible
to mount on the carousel. The same slides act as stirring the liquid itself. Whenever it is
happened that a few or more slots remained empty, please place empty slides also to
those positions. This protects the carousel against unbalanced mechanical forces during
stirring the liquid. Failing this rule may cause crashing the carousel. Precautionary
measures by keeping this rule in mind will lengthen the life of the carousel.
Chapter 4.
Routine operation
© 2013 by Radosys Kft. All rights reserved
RADOSYS User Manual
File Ref. RS_Man82
Page
4-24
Revised at 7/8/2013
4.3.3.5 Preparation of the etching bath [of the etching liquid]
Remove the Lid of the RB4 unit and place it to a lab tray or to the desk.
Insert the stirrer accessory into the pot of the RB4 unit, than the lid to the pot
again. Insert the funnel into the dispenser tube on the top of the lid. Pour 4000 ml
of distillated water into the RB4 unit. Replace the funnel with the stopper.
Chose the process program <Solution Preparation>.
(Read Chapter 4.2.3.12. about How To Use the Front Panel Keyboard)
Activate the program by pressing the Heater
button.
Now the water is warmed up to 90 centigrade automatically.
When the water reaches 90 centigrade a sound alarms.
Replace the stopper with the funnel.
Start to dispense the NaOH pellets through the funnel.
Dispense one spoonful pellets at each third minutes. Sound alarms for the next amount
of pellets.
After each dispense action acknowledge it by pressing an up/down button
.
When all the 1000g NaOH pellets dispensed to the bath, go to the next step, “The
Etching Process”.
Warning
The proper periodicity of dispensing the pellets is important rule in order to avoid overboiling the solution. The solution process of NaOH pellets in water is exothermic, which
generates excess heat. If the proper periodicity fails, this may cause over-boiling the
solution out of the pot.
Chapter 4.
Routine operation
© 2013 by Radosys Kft. All rights reserved
RADOSYS User Manual
File Ref. RS_Man82
Page
4-25
Revised at 7/8/2013
4.3.3.6 The Etching Process
Remove the Lid and place it to a lab tray or to the desk.
Use latex gloves for your safety. Lift the stirrer accessory by the removal/lifter accessory
and place the basin contaminated mixer onto a laboratory tray.
Insert the etching carousel into the pot. The slides with detectors has been
mounted to the carousel before inserting to the pot.
Place the Lid to its normal position on the pot section of the etching equipment.
Chose the process program <Etching>.
(Read Chapter 4.2.3.12. about How To Use the Front Panel Keyboard)
Activate the program by pressing the Heater
button.
The insertion of the carousel with many slides may cause dropping the temperature
below 90 centigrade. If this happens, the control logics starts a short Warming Up period
of a few minutes. This is indicated on the Status Display. When the temperature reaches
90 centigrade again, a sound alarms. Acknowledge this condition by pressing one of the
up/down buttons.
If the insertion of the carousel does not change the temperature, the short Warming Up
period is missing and the etching period starts instantly.
The start of the etching period is informed by the next content of the Status Display.
Chapter 4.
Routine operation
© 2013 by Radosys Kft. All rights reserved
RADOSYS User Manual
File Ref. RS_Man82
Page
4-26
Revised at 7/8/2013
The countdown timer and the information <Temp. Holding> are displayed
alternatively.
The etching time takes 4.5 hours [default value]. The displayed countdown timer informs
about the remaining time.
Now you may leave the RB4 unit alone safely.
After 4.5 hours a sound alarms. The etching has been completed. The heater is
switched off automatically by the control logics.
Drain the etching solution into a heat-proof laboratory glass, or more glasses. Do not
forget to close the drain tap after draining.
Acknowledge this condition by pressing one of the up/down buttons and go to the next
step “Neutralization”. The Neutralization step should follow the etching immediately.
Note
The default etching time of the Radosys etching recipe is 4.5 hours. However the
etching time is a selectable option in the Settings program menu of the RB4 unit.
But to keep compatibility with the whole application, do not change this default timing
value. Use this option only for research purpose.
4.3.3.7 The Neutralization Bath
Prepare a diluted synthetic vinegar solution by adding 200ml of 15% or 20% vinegar into
4000 ml of distillated water. Or alternatively, use an equivalent light acidic solution.
Replace the stopper with the funnel.
Pour the solution into the bath tank.
Chose the process program <Neutralization>.
(Read Chapter 4.2.3.12. about How To Use the Front Panel Keyboard)
Activate the program by pressing the Heater
button.
The neutralization process takes 10 minutes. During neutralization the control logics
keeps the heater off.
Sound alarms about the completion of the neutralization.
Chapter 4.
Routine operation
© 2013 by Radosys Kft. All rights reserved
RADOSYS User Manual
File Ref. RS_Man82
Page
4-27
Revised at 7/8/2013
Drain the neutralizing solution into plastic lab container.
Acknowledge this condition by pressing one of the up/down buttons and go to the next
step.
4.3.3.8 The Final Washing Bath
In order to remove any excess chemicals use a final washing bath with distillated water.
This step is not programmed in the RB4-FW2/FW3 firmware versions, but this is
recommended. In the lack of final washing step, it may happen that unwanted stains
remain on the detector chips, which may reduce the accuracy of track counting.
Pour 4000ml of distillated water into the bath tank. Drain the washing water into a
laboratory plastic container.
4.3.3.9 Rinsing and Drying
Remove the Lid of the etching unit and remove the etching carousel. Place it to a
laboratory tray for rinsing and drying. The best practice is to keep it drying for a few
hours or overnight. After drying the detector holders with the radon test plastic chips can
be taken for evaluation at the Radometer track evaluation unit.
4.3.3.10
Storage of the chemicals
The hot sodium-hydroxide solution should be stored in heat-proof laboratory glass. The
neutralization and final washing water bath can be stored in any plastic container.
Read more in the Chapter 5.6.2 “Chemistry Related Info” in the section “Tips and
Tricks”.
4.3.3.11
Waste chemical treatment
Concerning the disposal of the used chemicals, the sodium-hydroxide solution should be
treated with extreme care. It can not be disposed directly because of environmental
safety reasons. Two alternative methods are suggested for the disposal. This can be
disposed either by neutralization or by proper dilution. One liter of sodium-hydroxide
solution can be neutralized by adding four liter 15% synthetic vinegar solution. The
proper dilution rate in tap water is another method. Concerning the permitted dilution
rate, please check the local environmental standards or consult with an environment
safety engineer. At either case it is firmly recommended to consult with a chemist in
order to meet the local safety standards. In many countries professional companies
specialized on waste chemical disposal offer matching service. The manufacturer,
Radosys Ltd does not keep any responsibility for any misuse of waste chemicals.
Chapter 4.
Routine operation
© 2013 by Radosys Kft. All rights reserved
RADOSYS User Manual
File Ref. RS_Man82
Page
4-28
Revised at 7/8/2013
4.3.3.12
How to use the Front Panel Keyboard
The RB4 type etching unit is equipped with pre-programmed sequence of the whole
etching procedure. The process steps are displayed on the front panel LCD-display and
the steps of the procedure can be selected by means of the front panel buttons step by
step.
4.3.3.12.1 Available programs for the sequence of the detector development:
Preparation of the etching liquid starts at 90°C
1 min repeated stopper mode
Etching 90°C,
4.5 hours, single-shot countdown
Homogenizing heater OFF
20 min single-shot countdown
User’s Settings
Etching time is selectable between 1 min and 24 hours in steps of 1 min
Single-shot countdown or repeated stopper modes are selectable alternatively
4.3.3.12.2 Front Panel Buttons:
POWER/
HEATER
button
UP/DOWN
buttons
SELECTION
button
Chapter 4.
Starts or stops the current program. Activates or stops the
selected program.
At completion of the current program, push one of these buttons
to continue the process sequence with the next step.
Acknowledges the completion of the current program.
In the Settings program menu, these buttons are used for
stepping up/down the target value.
Select the next program by this button. This button is available
only after completion of a program. Repeated pushing this button
will paginate through the available programs.
Routine operation
© 2013 by Radosys Kft. All rights reserved
RADOSYS User Manual
File Ref. RS_Man82
4.4
Page
4-29
Revised at 7/8/2013
DETECTOR EVALUATION / TRACK ANALYSIS PROCESS. GENERAL OVERVIEW
The Radosys track counter software was designed mainly for routine application. This
means that the measurement process can be started and completed by easy to follow
recipe. In the chapters <Routine operation with…> this recipe is described in the form of
step-by-step instructions.
However the software is full of software options. If you use the system the first time, or
you do not want to familiarize yourself with other options, just simply use the routine
operation recipe. If the recipe followed precisely, the system will provide accurate
measurement data. You may need to read the chapters <Advanced operation…> only
for research purpose or for troubleshooting.
The Operation of the Radosys evaluation software is based upon the utilization of the
LINUX Operational System. General and well known information about the application
and the particulars of the LINUX is not presented here. However, the Graphics Interface
of LINUX, the X-Windows, today is well similar to that of the Windows, therefore tutorial
about the X-Windows is not included in the Manual. Concerning to the advanced topics
about LINUX please visit the well-designed help system of the Linux Man Pages and of
the KDE Help Center, both are available at your Radosys Computer after start-up.
4.5
MICROSCOPE MODEL SPECIFIC OVERVIEW. MODEL RSV6 VERSUS RSV60
The only difference between the RSV6 and RSV60 microscope models, that the slide
management operation is different. The RSV6 model was designed for handling one
slide only; that is 12 detectors per each analysis session. This model ensures 20
minutes of continuous operation without any user interaction.
The RSV60 model was designed for handling 24 slides; that is 288 detectors per each
analysis session. This model ensures 7 hours of continuous operation without any user
interaction.
The RSV60 specific software operation is described in Chapter 4.6.
Engineering details about the slide management is described in Chapter 7.6.
Chapter 4.
Routine operation
© 2013 by Radosys Kft. All rights reserved
RADOSYS User Manual
File Ref. RS_Man82
Page
4-30
Revised at 7/8/2013
4.6 VERSION OVERVIEW. MODEL RSV6 VERSUS RSV8 AND MODEL RSV60 VERSUS RSV80
The V6 series and V8 series models differ from each others in the optics and the related
electronics only.
Auto-Feeder
Image Resolution
Number of View-Fields
Optical Enlargement
Chip Scan Time
RSV6
RSV60
RSV8
RSV80
No
VGA
144
100x
1 Min
Yes
VGA
144
100x
1 Min
No
3 Mpixel
9
60x
20 Sec
Yes
3 Mpixel
9
60x
20 Sec
4.7
VERSION OVERVIEW. MODEL RSV8 VERSUS RSV10 AND MODEL RSV80 VERSUS
RSV100
The RSV8x and RSV10x series readers are manufactured with the same optics and
mechanics structure. The difference is in the electronics and the computer structure. The
RSV10x series reader is built with embedded computer, so external computer is not
necessary for the routine operation. But of course, for his/her convenience the user can
interconnect external device through WiFi service, as the RSV10x reader is equipped
with a complete web server. The RSV10x reader is equipped with a front panel touch
screen, which is utilized as an input device for the routine operation control.
Typical configurations are described here.
Configuration Example #1.
The RSV10x reader is applied with external monitor, keyboard and mouse. This is
redundant structure as all the routine controls are available at the touch screen, too. But
this structure may be convenient in particular at using that commands, which are
necessary much less often, for example at troubleshooting or maintenance.
Configuration Example #2.
The RSV10x reader is applied together with an external (remote) computer, where the
latter is interconnected via VNC (Virtual Network Computing). At this case the external
computer’s display, keyboard and mouse or touchpad are utilized like they were the
reader’s own periphery devices. In other words, the computer’s periphery devices work
as the mirrors of the reader’s periphery devices. All the controls and DMU software are
available through the remote computer.
The reader own built-in computer cannot access any local services of the remote
computer. So the reader can not send data file to the remote computer data storage
devices. Therefore at the case of data exportation of measurement results, the pen drive
should be interconnected to the reader and not to the remote computer.
Of course, not just desktop or laptop computer can be interconnected via VNC, but if it
is wished, tablet computer or even smart phone, too.
Configuration Example #3.
Chapter 4.
Routine operation
© 2013 by Radosys Kft. All rights reserved
RADOSYS User Manual
File Ref. RS_Man82
Page
4-31
Revised at 7/8/2013
The RSV10x reader is applied as a standalone unit. At this case there is no any external
periphery or computer interconnected. The reader works as an entirely autonomic
measurement equipment. The control commands, like starting measurement or
exporting data file, are invoked using the front panel touch display.
4.8
ROUTINE OPERATION WITH THE RADOSYS RS-RM VERSION TRACK ANALYSIS SW
The routine analysis procedure is described here. The Radosys RM version software is
full of software features, but the majority of these options are dedicated mainly for
research and for advanced operation. The description of the extra, non-routine options is
available in the Advanced Operation chapter.
The flow chart of the RM version software is displayed in Chapter 7.6.1.
The actual appearance of the screenshots from the computer screen may differ from
those, which are shown in this document, as various Linux versions and software
implementations may be different. Use these images as illustrations.
At the RSV10x series readers in standalone mode the desktop of the embedded
computer is not accessible directly. All the controls and operation information are
available on the front panel touch screen.
Chapter 4.
Routine operation
© 2013 by Radosys Kft. All rights reserved
RADOSYS User Manual
File Ref. RS_Man82
Page
4-32
Revised at 7/8/2013
4.8.1 STARTING UP THE RADOSYS TRACK ANALYSIS SYSTEM
Power on the Radosys Computer and the Microscope according to the instruction
described in the Installation Guidance.
As soon as the login window is displayed login to the system. Apply the login data as
follows:
Login: rm
Password: rm (This is the default value, can be personalized later)
The default desktop image will be displayed on the screen:
4.8.2 ROUTINE ANALYSIS
1. Click on Radometer icon
on the desktop in order to invoke the analysis
software. If the hardware installation is correct, the image of the initialization is displayed
on the screen, and the hardware self-test of the microscope starts at the same time.
Latter produces an unambiguously unique sequence of motor noise produced by the
microscope. The initialization takes about 90 sec.
Chapter 4.
Routine operation
© 2013 by Radosys Kft. All rights reserved
RADOSYS User Manual
File Ref. RS_Man82
Page
4-33
Revised at 7/8/2013
Note:
Two different application software are used for neutron and radon track analysis. At a
few installations both of them may be available on the desktop. Please distinguish them,
as follows.
Radometer-TA
is to be applied for neutron analysis.
Radometer-RM
is to be applied for radon analysis.
Chapter 4.
Routine operation
© 2013 by Radosys Kft. All rights reserved
RADOSYS User Manual
File Ref. RS_Man82
Page
4-34
Revised at 7/8/2013
2. After the successful initialization the Radosys Track Analysis software start-up image
is
displayed.
At the upper left corner of the main Radometer window, there are five control buttons,
which are provided for speed access of the most important operation functions, as
follows.
Speed access buttons:
Exit
Quits the Radometer software
Feed Starts the insertion of a detector holder into the Microscope
Drop Starts removal of the detector holder being inside the Microscope
Start Starts automatic processing a detector holder
Stop Stops the process of track counting
Chapter 4.
Routine operation
© 2013 by Radosys Kft. All rights reserved
RADOSYS User Manual
File Ref. RS_Man82
Page
4-35
Revised at 7/8/2013
3. Start the Automatic Analysis by clicking on the on the Start button.
Chapter 4.
Routine operation
© 2013 by Radosys Kft. All rights reserved
RADOSYS User Manual
File Ref. RS_Man82
Page
4-36
Revised at 7/8/2013
4. In the Automatic Measurement window select the proper EPS, as follows.
At the “Parameter Set” pull-down menu select the proper evaluation set among the
available
sets.
Select
“Neutron
1”
for
neutron
analysis.
Select
“2K
Small
Tracks”
for
radon
analysis.
Than click on the OK button of the Automatic Measurement window.
5. Now the Microscope unit advances its slide tray ahead in order to make it prepared
for the insertion of the detector holder. In other words the slide door is opened now.
6. Insert the detector holder to the slot, like a credit card to a teller machine. The holder
is equipped with structural code; therefore this can be inserted with a definite orientation
only.
7. After the insertion of the detector holder the track counting starts automatically. All the
12 detectors of the holder are processed automatically.
8. When the analysis of the whole holder completed, the Microscope drops the holder by
means of advancing it ahead on the slide tray. Now remove the detector out of the
microscope’s slide tray.
9. Now the track counting has been completed.
For visualization of the track data and statistics use the DMU database management
utility software, which is described in the section “Listing the Results”.
Chapter 4.
Routine operation
© 2013 by Radosys Kft. All rights reserved
RADOSYS User Manual
File Ref. RS_Man82
Chapter 4.
Page
4-37
Revised at 7/8/2013
Routine operation
© 2013 by Radosys Kft. All rights reserved
RADOSYS User Manual
File Ref. RS_Man82
Page
4-38
Revised at 7/8/2013
4.8.3 HELP FEATURES
Help information about the whole software operation, especially about the available
control buttons are accessible via two ways.
The feature of drag-on pop-up message boxes
Most of the control buttons is equipped with this feature.
Just drag the mouse pointer to a control button and a pop-up text box in yellow is
displayed with a short description about its function.
The feature of Help off-line User Manual
At the RSV6 version of the Radosys system, the User’s Manual is an integrated part of
the Radometer software. This is accessible in the Help menu of the Radometer software.
This feature is available in the menu line of the main Radometer window. Click on the
Help menu option to enter the off-line documentation of the Radosys system. An
internet-like browser window is displayed, where the Radosys User Manual can be
leafed and read locally like an internet web-site.
Note: The most comprehensive version of the Radosys User Manual is distributed in
printed or in PDF format. The off-line documentation is updated by means of regular
software upgrades. Please ask the local vendor or Radosys Ltd for the latest version of
the off-line documentation.
Chapter 4.
Routine operation
© 2013 by Radosys Kft. All rights reserved
RADOSYS User Manual
File Ref. RS_Man82
Page
4-39
Revised at 7/8/2013
4.9
RSV60 MODEL SPECIFIC SOFTWARE OPERATION
The only difference between the RSV6 and RSV60 microscope models, that the slide
management operation is different. The RSV6 model was designed for handling one
slide only; that is 12 detectors per each analysis session. This model ensures 20
minutes of continuous operation without any user interaction.
The RSV60 model was designed for handling 24 slides; that is 288 detectors per each
analysis session. This model ensures 7 hours of continuous operation without any user
interaction.
Note: The typical maximum analysis time per detector is 1.5 minutes at the default EPS
settings, which is recommended for routine analysis. The process timing referred above
was calculated according to this standard process rate.
The RSV60 Model specific software operation is described in this chapter.
4.9.1 THE MAIN RADOMETER WINDOW AND EXTRA BUTTONS AT RSV60 MODEL
Two model specific, extra buttons [Fill] and [Pause] are available.
Click on this button to start filling up the slide stack.
After activation of this feature a message window requests to insert the next slide.
Insert the next slide into the front slide slot.
The inserted slide is moved to the slide stack automatically.
Two LED lamps, a green and a red one informs about the status of the slide movement.
When the green lamp is on, this indicates that the equipment is ready for the next slide.
When the red lamp is on, this indicates that the current slide is under movement process
and the equipment is busy.
When the red lamp is blinking, this indicates a feed error condition.
Maximum 24 slides can be stored in the slide stack.
Chapter 4.
Routine operation
© 2013 by Radosys Kft. All rights reserved
RADOSYS User Manual
File Ref. RS_Man82
Page
4-40
Revised at 7/8/2013
Click on this button to pause the track counting process. The button text
alters to <Continue>. Click on this button to continue the process.
4.9.2 THE AUTOMATIC MEASUREMENT WINDOW AT MODEL RSV60
The Automatic Measurement Window at RSV60 Model version.
There are two extra, model specific buttons available at RSV60 version.
<Start/Stack> Clicking on this button, the measurement process of the slides stored in
the slide stack is starting. All the slides in the stack are processed subsequently and
automatically.
<Start/Slot> Clicking on this button, the measurement is carried out with a slide, which is
inserted to the front slide slot, regardless to the status of the slide stack. Therefore a
slide insertion will be requested by the control software.
Chapter 4.
Routine operation
© 2013 by Radosys Kft. All rights reserved
RADOSYS User Manual
File Ref. RS_Man82
Page
4-41
Revised at 7/8/2013
4.9.3 HOW TO REMOVE SLIDES FROM AUTO-FEEDER UNIT AT CASE OF SLIDE STACK FAILURE
Use this information only if the auto-feeder stopped working correctly and slides stuck in
the feeder.
At case of malfunction in the slide transport mechanism the next slide is not forwarded
by the automatism from the slide stack. This is a failure condition, which can be resolved
by the operator.
Whenever slide stack operation failure condition is detected by the control software, the
software offers a set of control buttons to move the stuck slide remotely. Those controls
are Front Motor In, Front Motor Out, Mid Motor In, Mid Motor Out, Stack Plate Down,
Stack Plate Up.
First use these control buttons to make the stuck slide moved. Use the description below
only if the situation could not be resolved by the software level control buttons.
If the slide stuck condition seems really severe, more intervention is needed manually.
This procedure is described below.
1. Insert a size 2.5 hexagonal key in the screw on the step motor of the auto-feeder unit.
Alternatively, you may rotate the lead manually with your finger.
Chapter 4.
Routine operation
© 2013 by Radosys Kft. All rights reserved
RADOSYS User Manual
File Ref. RS_Man82
Chapter 4.
Page
4-42
Revised at 7/8/2013
Routine operation
© 2013 by Radosys Kft. All rights reserved
RADOSYS User Manual
File Ref. RS_Man82
Page
4-43
Revised at 7/8/2013
2. Rotate the screw counter-clockwise until the slides are lowered so that the slide
holder tray is in the lower region of the autofeeder unit.
Chapter 4.
Routine operation
© 2013 by Radosys Kft. All rights reserved
RADOSYS User Manual
File Ref. RS_Man82
Page
4-44
Revised at 7/8/2013
3. Tilt the slides.
4. Remove the slides by pulling them.
Chapter 4.
Routine operation
© 2013 by Radosys Kft. All rights reserved
RADOSYS User Manual
File Ref. RS_Man82
Page
4-45
Revised at 7/8/2013
4.10 RSV10X MODELS SPECIFIC OPERATION
The RSV10 and RSV100 models is equipped with embedded computer and front panel
touch screen. All the controls and operation information are available on the touch
screen. When the unit is used as a standalone measurement equipment, this is the only
way to access those.
In this chapter the touch screen related routine operation is described.
The RSV100 specific auto-feeder operation is described in the 4.10.1 subchapter.
When the RSV10x series reader is in idle status, the touch screen is off, but it is
sensitive to touching. Simply touch the blind touch screen to make it active. The
following is displayed.
Keep the Power On button touched for 2 seconds to power up the reader.
Then the following starting up cycle is seen for a few minutes.
After powering up the system automatic self-check is done, while the following is
displayed.
Once the self-check is completed, the Main Menu is seen.
Chapter 4.
Routine operation
© 2013 by Radosys Kft. All rights reserved
RADOSYS User Manual
File Ref. RS_Man82
Page
4-46
Revised at 7/8/2013
Select Measure then choose Evaluation Parameter Set. The default parameter set is the
so called Wide-Size-Range, which alternatively may be listed as WSRx, where x is the
EPS version number. If other parameter set is wished to utilize, scroll through the
available EPS’s (Parameter Sets) using the horizontal arrow keys.
To start the actual measurement select Slot, which means the slide is requested to insert
in the slide-slot.
Insert the slide of detectors in the slide slot. Once the measurement is accomplished on
all the twelve detectors, the Main Menu is seen again.
To export the measurement results into data file, select Data on the Main Menu screen.
Choose Current day if it is wished to export that data only, which was produced today.
Alternatively choose Export All to export all the data have been already stored, including
historical series.
Chapter 4.
Routine operation
© 2013 by Radosys Kft. All rights reserved
RADOSYS User Manual
File Ref. RS_Man82
Page
4-47
Revised at 7/8/2013
System Maintenance
After powering on the instrument, push the "sys" part of the logo. The text in the upper
part of the screen will change to "loading system maintenance, please wait...". After a
few seconds a menu will appear.
Network setup
Two modes are possible: network client (either wired or WiFi) or WiFi access point.
•
•
In network client mode, the instrument will attempt to register in the local network.
If password is needed for the WiFi connection, then a screen and keyboard is
needed to set it up. This procedure has to be done only once. On subsequent
start-ups, the instrument will register to the WiFi network automatically.
In WiFi access point mode no local network is needed, the instrument will create
a hotspot. After selecting this mode, a channel has to be chosen. If there are
other hotspots in the building, try to find an unused channel. After accepting the
setup, a hotspot with name radosysNNNN (NNNN is the serial number of the
system) will be seen on nearby WiFi-capable devices. The connection is
password-protected, the password is 'Radosys123'.
Using an external computer to connect to the instrument
If the instrument is successfully networked, its operation can be observed and the
results can be accessed from another networked computer or mobile device. The IP
address of the system can be retrieved by touching the "Data" menu on the touchscreen
and then selecting "Show IP". Writing the IP address of the system to a browser window
will show the RadoMeter control panel.
Observing the operation of the microscope
Chapter 4.
Routine operation
© 2013 by Radosys Kft. All rights reserved
RADOSYS User Manual
File Ref. RS_Man82
•
•
Page
4-48
Revised at 7/8/2013
Click the RadoMeter Desktop link. The browser will open a new window and a
Java applet will prompt for a password. Type "Radosys" and the desktop of
microscope will appear in a new window.
Any other VNC viewer software (RealVNC, TightVNC, etc.) can also be used to
see the screen of the RadoMeter microscope.
Retrieving the results from the microscope
•
•
•
•
•
Click the DMU link. Log in as "dmu" user with password "Radosys". The results of
the current day can be seen on the next screen.
Change the from-to dates and then click select to view earlier results.
Type in some text in the Search box to look up a specific result.
Results can be sorted by clicking the arrows in the column heads.
The currently shown dataset can be exported to CSV file by clicking the CSV
button.
4.11 VISUALIZATION OF RESULTS. THE DMU SOFTWARE.
The Radosys track counter software was designed mainly for routine application. This
means that the measurement process can be started and completed by easy to follow
recipe. In the chapters <Routine operation with…> this recipe is described in the form of
step-by-step instructions.
However the software is full of software options. If you use the system the first time, or
you do not want to familiarize yourself with other options, just simply use the routine
operation recipe. If the recipe followed precisely, the system will provide accurate
measurement data. You may need to read the chapters <Advanced operation…> only
for research purpose or for troubleshooting.
4.11.1 ROUTINE OPERATION WITH DMU-99 VERSION SOFTWARE
The result of the evaluation is stored in a database managed by the LINUX POSTGRES
system. In the Radosys environment this database accessible through the DMU,
Database Management Utility. The DMU is HTML-based system, which can be
visualized by a standard Internet browser, like the Netscape. Since the Netscape is a
normal accessory of the SUSE LINUX, this is applied here being the default application
for this purpose.
4.11.1.1
Chapter 4.
Starting the DMU:
Routine operation
© 2013 by Radosys Kft. All rights reserved
RADOSYS User Manual
File Ref. RS_Man82
Page
4-49
Revised at 7/8/2013
The RadoMeter software automatically launches the DMU, the Database Management Unit. If
you want to run it without switching the microscope on, click the "DMU" icon
desktop. You will see the following startup screen:
Chapter 4.
Routine operation
© 2013 by Radosys Kft. All rights reserved
on the
RADOSYS User Manual
File Ref. RS_Man82
4.11.1.2
Page
4-50
Revised at 7/8/2013
Dump the results
To list the results, click the "SEARCH" tab. The Search Window appears:
In the "Select field type" box, select the field you want to base your search on. It can be the Date,
the Slide ID or the Detector ID. If you choose "Date", the "Search For" field will be filled with
the current date. Note: date format is yyyy-mm-dd (4-digit year, 2-digit month, 2-digit day).
You can perform a wildcard search with not filling the whole field. For example, if you write
"2006-02-", the resulting table will contain all data from the whole month.
You can change the listing order and the displayed fields by selecting the appropriate controls. It
is possible to display additional fields by clicking the "Advcanced Mode" button.
After clicking the "Search" button, the result list is displayed:
Chapter 4.
Routine operation
© 2013 by Radosys Kft. All rights reserved
RADOSYS User Manual
File Ref. RS_Man82
Page
4-51
Revised at 7/8/2013
If the results do not fit on one screen, you can proceed to the next one by pressing the "Next >>"
button.
You can export the results table to a text file by pressing the "Export To File" button. The
exported file can be imported into a spreadsheet software. Clicking the number in the density
window opens a new window with detailed results.
Chapter 4.
Routine operation
© 2013 by Radosys Kft. All rights reserved
RADOSYS User Manual
File Ref. RS_Man82
4.11.1.3
Page
4-52
Revised at 7/8/2013
Refine the results
In order to convert the counted track density to physical value of R.A.C.:
Fill on the Start_Date and End_Date fields to indicate the exposure time
Scroll the window to access the paginate operation buttons.
Click on the Update button
The Radon Activity Concentration value is calculated and displayed in the RAC column,
expressed in Bq/m3.
Chapter 4.
Routine operation
© 2013 by Radosys Kft. All rights reserved
RADOSYS User Manual
File Ref. RS_Man82
Page
4-53
Revised at 7/8/2013
4.11.2 GENERAL INFORMATION ABOUT THE DMU-V6X SERIES SOFTWARE
This software version is a straightforward update of the former DMU-99 version. The
main difference at the DMU-V6X series software that the user interface is different.
While the DMU-99 version has utilized an internet-like browser, the new version
operates with its own graphics window, which had been developed for this application
exclusively. In respect of the available data and result reporting, the DMU-V6X is
equivalent to the former DMU-99. This works with the same data/result service concept.
Nevertheless of course, the DMU-V6X was designed to be more users friendly and is
more convenient to use.
Two sub-versions of the DMU-V6X software are available today.
- The version DMU-V6R is dedicated to radon test application.
- The version DMU-V6N is dedicated to neutron dosimeter application.
There is just minor difference between these two sub-versions. A few data fields are
different, according to the different nature of these two applications. Moreover, at the
V6N version the track classes concept has been implemented, which option is missing in
the V6R version at all. It is also worth to mention that the calibration data service feature
works differently at the V6R version, also because of the different nature of the radon
test application.
Chapter 4.
Routine operation
© 2013 by Radosys Kft. All rights reserved
RADOSYS User Manual
File Ref. RS_Man82
Page
4-54
Revised at 7/8/2013
4.11.3 ROUTINE OPERATION WITH DMU-V6R VERSION SOFTWARE
Only the most often used, routine steps are described in this chapter.
For information about the advanced features read the Chapter 5.5, “Radosys DMU
Software Advanced Operation.
4.11.3.1
Information for users, who are familiar with the previous version
DMU-99
The most important difference between the DMU-99 and the DMU-V6R is listed here.
- The software works with its own graphics interface, while the DMU-99 worked in
internet-like browser window. This also means that accessibility through network is not
available, while the DMU-99 supported this feature.
- Now the result chart is displayed in the main window. Updating the result chart is not
necessary. Any edited data or change at the configuration will update the result chart
instantly.
- At the data export function, the data is exported in csv formatted text file, while the
export file format was tabulated text file. Therefore who has already utilized data
importation into other application software, for instance to Excel, those one should revise
their data importation practice.
- Now the result chart is configurable much easier. Individual configurations can be
designed and the stored configurations are selectable from a list.
- Database archiving feature is available now.
- The EPS of the measurement is a list option in the result chart. The details of the
applied EPS is also available to list. This feature enhances the integration between the
Radometer track reader software and the DMU software.
- The whole chart of the CF [Calibration Factor], which is provided by Radosys Ltd, can
be imported into the DMU software. When internet connection is available from the
control computer, the CF chart can be updated just by a single button operation.
- Feature of Detectors’ Group Edit has been introduced. Editing detector properties, like
Start/End Date or Comment, is no longer limited to a single detector individually. Now
this can be done for a whole detector ID range at the same time.
- The Detector Thumbnail feature has been introduced. Switching on this feature, the
map of recognized tracks is displayed in a separate window.
Chapter 4.
Routine operation
© 2013 by Radosys Kft. All rights reserved
RADOSYS User Manual
File Ref. RS_Man82
Page
4-55
Revised at 7/8/2013
4.11.3.2
Starting the DMU-V6R software
Locate it and click on the program icon DMU-V6R on the Desktop to start the software.
Note: Whenever the main program, the Radometer software is started, the DMU
software, in a separate window, is also started. If more versions of the DMU software is
available at your computer, just one version will be invoked automatically. The DMU
version, which was started automatically, depends on the default system configuration.
When other version of the DMU software is also available at your computer, this should
be started individually, by clicking on its icon at the Desktop. More versions of the DMU
are allowed to be active at the same time.
Application example: Let’s assume that the DMU-99 software has been started
automatically together with the main Radometer software, but you rather want to use the
DMU-V6R version. Just locate it and click on the program icon DMU-V6R on the
Desktop to start the software. Simultaneous availability of different DMU versions does
not make any trouble. Just use one of them by your preference.
As a general rule in Linux and in Windows you may alter the active program window by
the key combination ALT+TAB.
After starting the DMU-V6R software the following, typical window content is displayed.
Chapter 4.
Routine operation
© 2013 by Radosys Kft. All rights reserved
RADOSYS User Manual
File Ref. RS_Man82
Page
4-56
Revised at 7/8/2013
General description of the main sections of the DMU window:
Result Chart:
This is a table, where the measurement data is tabulated. Each row consist of a series
of data about one detector, which detector is identified by <Det ID>.
Chart Header:
Each element of the header serves as column header to indicate which type of data is
listed in its column.
The displayed columns can be configured by the user.
The default chart configuration is the <Routine Test 1>. A newly installed DMU software
displays the chart according to this default chart configuration:
<Det ID>, <RAC>, <Density>, <Start Date>, <End Date>, <Slide ID>, <Date&Time>
Window Controls.
- The <Next> and <Prev> buttons are to turn a page forth or back, when the size of the
chart is bigger then the window itself.
- For information about the other buttons, read the Chapter ….
Edit & Settings Controls
These group of buttons consists of various tools, including editing specific detector’s
data, chart configuration and also access to the calibration service.
- The button <Edit detector properties> opens a window, where the <Start Date> and
<End Date> data of exposure time can be set.
- The button <Configuration> opens a window, where the result chart can be configured,
or where the active chart configuration can be selected.
- For information about the other buttons, read the Chapter ….
List Filter Controls
The filters determine which detectors are listed. In other words, this is a search tool. The
detector database can be searched according to various keys, and only those detectors
are listed in the result chart, which detectors meet the criteria of the filter settings.
-The default settings of the Filters is:
--- Listing by <Date>
--- <Latest Date> option is applied
At this case of default Filter settings, the most recently measured detectors are listed.
- For information about the Filters more in details, read the Chapter ….
4.11.3.3
Listing the results
1. At this description about the routine operation, it is assumed that the default Chart
Configuration is used. If it has happened that the Chart Configuration had been
altered, click on the button Configuration and select the Chart Configuration
<Dates>.
2. Check the Filters settings and ensure that <Date> and <Latest Date> default
options are displayed. If it has happened that the Filters settings had been
altered, set them to the default.
3. Update the desired detector’s row in the chart by editing the <Start Date> and
<End Date> data. The RAC, Radon Activity Concentration, in Bq/m3, value is
displayed only if the time of exposure, defined by Start Date and End Date, was
introduced to the database. To do so, click on the button <Edit detector
Chapter 4.
Routine operation
© 2013 by Radosys Kft. All rights reserved
RADOSYS User Manual
File Ref. RS_Man82
Page
4-57
Revised at 7/8/2013
properties> and edit the data fields <Start Date> and <End Date>. For
convenience, use the <D> button to display a calendar and to select the dates
interactively. After editing the date fields, click on button <Save> to store these
data to the database.
4. The RAC value is displayed in the Result Chart instantly.
Chapter 4.
Routine operation
© 2013 by Radosys Kft. All rights reserved
RADOSYS User Manual
File Ref. RS_Man82
Page
4-58
Revised at 7/8/2013
4.11.4 ROUTINE OPERATION WITH DMU-V6N VERSION SOFTWARE
The main window of the V6N version of the DMU software.
Chapter 4.
Routine operation
© 2013 by Radosys Kft. All rights reserved
RADOSYS User Manual
File Ref. RS_Man82
Page
4-59
Revised at 7/8/2013
4.12 CALIBRATION DATA TABLE UPDATE (CF-CHART)
Chapter 4.
Routine operation
© 2013 by Radosys Kft. All rights reserved
RADOSYS User Manual
File Ref. RS_Man82
Page
4-60
Revised at 7/8/2013
4.13 N-DOSYS, NEUTRON DOSIMETRY APPLICATION SPECIFIC PROCEDURE
4.13.1 GENERAL INFORMATION
The whole process is very similar to the radon application. The application specific
difference is described in this chapter.
Application specific software version has been developed and made available for
neutron dosimetry.
- The track counting software is of the RS-TA-series version. See Chapter 4.5.2.
- The corresponding DMU software version is the DMU-V6N. See Chapter 4.7.4.
The track development requires an extra step, the Pre-Treatment. See Chapter 4.8.2.
Therefore the main sequence of operation at the neutron dosimeter application:
- Exposure of the dosimeter
- Insertion of the detector chips to slides
- Pre-treatment procedure, latent track enhancement
- Etching procedure, track development
- Track counting
- Listing the results
4.13.2 THE PRE-TREATMENT PROCEDURE
4.13.2.1
Preface
A Radosys’s propriety technology is used for fast neutron detection.
The essence of this technology is that the latent tracks are made more visible and/or
enlarged by pre-treatment in carbon-dioxide. The pre-treatment is a requirement before
the main etching step by sodium-hydroxide.
4.13.2.2
The sequence of the Pre-treatment in Carbon-Dioxide
1. Place the exposed detector chips into the holders, as it is described in the Section
“Insertion of the detector chips to slides”.
2. Install the Pressure Vessel, as it is described in the document “Installation Guidance”.
Close the Inlet Valve and the Outlet Valve of the Pressure Vessel before connecting to
the gas cylinder. Connect the Pressure Vessel to the outlet of the pressure regulator of
the CO2 gas cylinder. Keep the outlet valve of the pressure regulator closed.
3. The components and parts of the Pressure Vessel, also a typical pressure regulator
for gas cylinder are shown on the pictures below.
Chapter 4.
Routine operation
© 2013 by Radosys Kft. All rights reserved
RADOSYS User Manual
File Ref. RS_Man82
Page
4-61
Revised at 7/8/2013
The components and parts of the Pressure Vessel
Typical Pressure Regulator for Gas Cylinder
4. Remove the lid of the Pressure Vessel and place the holders of detector chips into the
Pressure Vessel. There is no any requirement about the way of placement, just drop
them inside.
5. Close the Pressure Vessel by placing the lid to its normal position.
Chapter 4.
Routine operation
© 2013 by Radosys Kft. All rights reserved
RADOSYS User Manual
File Ref. RS_Man82
Page
4-62
Revised at 7/8/2013
6. Open the Inlet Valve of the Pressure Vessel.
7. Open the outlet valve of the pressure regulator carefully and adjust the pressure to
6.9 bars. The pressure can be checked by the Pressure Meter of the Pressure Vessel.
8. Once the pressure in the Pressure Vessel reached 6.9 bars, close the Inlet Valve of
the Pressure Vessel. Now also the valve of the pressure regulator can be closed.
9. After that preparation, the period of pre-treatment of the neutron exposed detector
chips has been started. The time of pre-treatment is 7 days. The exposed detectors
should be kept under 6.9 bars CO2 atmosphere through 7days.
10. After the period of pre-treatment, evacuate the Pressure Vessel by opening the
Outlet Valve of the Pressure Vessel. The CO2 gas content of the Pressure Vessel is
released through the Outlet Retard Device, which ensures the safety of the gas
evacuation.
11. Open the lid of the Pressure Vessel and remove the pre-treated holders of detector
chips.
12. Start the chemical etching of the detectors as soon as possible. Preferably, do not
store the pre-treated detector chips before the main etching step of sodium-hydroxide,
but start the etching immediately.
4.13.2.3
General Information for the Installation of the Pre-Treatment Pressure
Vessel
- The operation of the Pre-treatment unit needs using a gas container filled with Carbon
Dioxide, which container should be equipped with a pressure regulator device.
- Concerning to the type and purity of the Carbon Dioxide, there is no any particular
requirement, therefore any industrial type can be used. The proper size of the gas
cylinder may depend on the frequency of usage. In the practice, the size of 7..10kg, with
purity of 99.995% used to be a good choice. For example, the European system users
utilize 7.5kg steel cylinder supplied by Linde AG (www.linde.com) with a product
designation of Carbon Dioxide type 4.5. This product is supplied by Linde AG together
with Certificate of Analysis. Linde products are available worldwide in 50 countries. If this
product by Linde AG was not available in your country, please contact a local, major
supplier of industrial gases and inquiry about equivalent product.
- The CO2 gas tank and the pressure regulator device are not delivered together with
the measurement system. These devices vary from country to country, according to the
local standards. Therefore these devices should be purchased from a local supplier.
Chapter 4.
Routine operation
© 2013 by Radosys Kft. All rights reserved
RADOSYS User Manual
File Ref. RS_Man82
Page
4-63
Revised at 7/8/2013
4.13.2.4
Technical Warnings
Warning.
Never connect a gas container to the presser vessel directly. Always use a
pressure regulator device between the gas container and the pressure vessel. Failing
this rule may cause serious injure. This type of pressure vessel, which supplied with the
system, was designed and tested for max 6.9 bars pressure operation!
Warning.
Assembling a high pressure gas system by a non-skilled person is strictly
prohibited! Only a professional, expertise technician is able to fix a high pressure set-up
with safety, who is also familiar with the local standards! The supplier of the system,
Radosys Ltd does not admit any responsibility if this strict rule is failed or neglected in
any respect.
Chapter 4.
Routine operation
© 2013 by Radosys Kft. All rights reserved
RADOSYS User Manual
File Ref. RS_Man82
Page
5-1
Revised at 7/8/2013
5 Advanced operation
Beyond the routine, the LINUX environment as well as the extended features of the
Radosys software offers a tremendous way of flexible features to create your own
everyday practice.
5.1
DESKTOP ISSUES
The most important LINUX options are accessible through the Panel window. This
window is displayed when the mouse pointer is dragged to the bottom of the screen.
Each of the active processes can be visualized and get its window to the top at the
Taskbar. This window is displayed when the mouse pointer is dragged to the top of the
screen.
The file system can be explored easily by means of the graphics Home Terminal. Click
on the Home Icon at the Panel window to access it.
Chapter 5.
Advanced operation
© 2013 by Radosys Kft. All rights reserved
RADOSYS User Manual
File Ref. RS_Man82
Page
5-2
Revised at 7/8/2013
5.2 ROOT USER OPERATION
Any time when a system administration work is needed, the only way is to login as a
Root user. However this opportunity should be applied for system administration
purpose only. Avoid entering this mode for any other purpose.
The Root user operation is accessible through login with the following terms.
Login: root
Password: RMet2000
Please notice that any textual information in Linux is case sensitive, also the login name
and password. Therefore type them exactly as they are written above.
A new login session can be started by the key combination of Alt-Ctrl-F1 to Alt-Ctrl-F6 or
by restarting the X-Windows by the Alt-Ctrl-Backspace key combination.
5.3
SYSTEM SETTINGS ISSUES
Any time when a new system sw or hw option should be introduced, this requires the
Root user operation mode. This might happened e.g. if a printer or modem device is
added to the system.
The easiest way to do this by the YAST system utility.
Drag to the Panel window and click on the YAST icon to invoke this utility.
Chapter 5.
Advanced operation
© 2013 by Radosys Kft. All rights reserved
RADOSYS User Manual
File Ref. RS_Man82
5.4
Page
5-3
Revised at 7/8/2013
RADOSYS RSV6-RM SOFTWARE ADVANCED OPERATION
5.4.1 INTRODUCTION
The flow chart of the RM version software is displayed in Chapter 7.6.1.
5.4.2 DESCRIPTION OF MAIN CONTROL BUTTONS AND FEATURE CONTROLS
5.4.2.1 Automatic Measurement
Soft key combination: Ctrl+A
Description: Automatic Analysis of Detectors. The 12 detectors in the inserted holder
card are scanned and analyzed automatically, by means of a sophisticated algorithm
analyzing the microscopic images and recognizing the alpha tracks. The output of the
analysis is the number of the counted tracks. Each result is stored in the DMU,
integrated database of the Radosys system, for subsequent calculation and
visualization.
Usage: Select this menu item to invoke this option, or alternatively, click on the right
arrow button at the toolbar of the main radosys window. Set the desired analysis
parameters in the displayed dialogue window:
5.4.2.1.1 Slide ID
Each analyzed holder card needs an individual identification code. The software
generates the default code automatically, however this recommended code can be
modified promptly at the start time of the analysis. The default code is generated by
means of the current date plus a serial number, which is the next subsequent one with
the same date. The format of the default code is yyyy-mm-dd/sss, where "yyyy" denotes
the current year, "mm" the month, "dd" the day and "sss" the serial number at the same
date. Whatever were decided, either the default code for the holder card or a customized
form were selected, it is recommended to place a label with this information onto the
holder card.
Notes: If the default card holder ID were modified, but the intention will be changed, one
may return to the automatic ID form by clicking on the "AutoID" button.
5.4.2.1.2 Passes
By default each detector chip is analyzed only once. However, the software can be
instructed to carry out repeated analyses on each detector chip. The scanned area is set
according to the Evaluation Parameter Settings. Any repeated analysis may be useful
whenever an increased accuracy is preferred to speed. Repeated analysis may provide
a better accuracy, simply because of the general behavior of statistics. (The standard
deviation of the mean of n measurements is equal to the standard deviation of the
measured quantity divided by the square root of n.)
You can instruct the software to perform repeated analyses by simply writing the number
of desired repetitions (cycles) into the text box in the upper right corner of the window
that appears after you click “Start” in the main window. According to the setting on the
figure, each reading will be performed three times (the detector ID is read only once).
Chapter 5.
Advanced operation
© 2013 by Radosys Kft. All rights reserved
RADOSYS User Manual
File Ref. RS_Man82
Page
5-4
Revised at 7/8/2013
Setting the number of repetitions (cycles) of the readings
The track densities are determined from each reading and the mean, the standard
deviation and the maximum of the read track densities are calculated. In the DMU
software the mean values are displayed in the “Track density” column, the standard
deviations in the “Standard deviation” column, the maximum values in the “Maximum
track density” column and the number of cycles in the “Count of measurements” column.
For a detailed description on how to display these parameters with the DMU software
see section 5.5.3.
5.4.2.1.3 Measure all / Specify IDs and positions
It can be defined what detector chips of the current holder card should be analyzed. The
default setting is to carry out the analysis on each of them, however individual dedication
for analysis is also available. Actually, a set of detectors for analysis can be constructed,
additionally individual Evaluation Parameter Set can be assigned to each detector. Even
the default value of ID for each detector chip, that is the value read automatically, can be
overridden by entering a new value manually. This option may be useful when the
automatic detector ID reading fails. Please find more information about settings option at
the subtitle of "Edit Loadlist".
5.4.2.1.4 Parameter set
The Evaluation Parameter Set (EPS) can be selected here. These parameters
determine the details of the track image analysis and may influence on the results
decisively. Click on the button and select the desired parameter set from the displayed
list. If the list is too long to display all the items, select the “More…” item at the end of the
list, and the next page of the list will be displayed.
There are a few EPS, which are provided together with new Radosys equipment.
These can be sorted into two groups, according to the type of the detector holder cards,
so called Normal or 2K/2L. (This sequence of the different holder cards is in correlation
Chapter 5.
Advanced operation
© 2013 by Radosys Kft. All rights reserved
RADOSYS User Manual
File Ref. RS_Man82
Page
5-5
Revised at 7/8/2013
with the release date of the holder card types, which releases related to their evolution
during the production history of the Radosys. After November, 2001, the 2L type is
manufactured and distributed only, however the software have to care of the earlier
types as well.) According to this classification the name of any initially provided EPS
starts with or without a denotation of 2K. If a 2K or 2L type of holder is applied select an
EPS with this denotation. If an older (“Normal”) card is applied, select an EPS without
this denotation. This rule of denotation for the applied names of an EPS, concerning to
the applied type of holder card, is not a requirement. This is intended to be just a guide
for easy recognition of an EPS.
There are a few EPS, which are provided together with new Radosys equipment,
according to both types of detector holder cards.
Each of these initially provided EPS are optimized for different average track sizes. For
the best interpretation of this options, please review the relevant Chapter of the Manual
about the Detector Etching process. However for Routine Operation, please follow the
next fundamental directive. If the etching process is done according to the standard
condition, as it is described in the Chapter “Etching”, the most optimal selection is an
EPS with a Small Track setting option.
Therefore for radon application the default Parameter Set [EPS] is the “2K Small
Tracks”. Use other EPS only for research or troubleshooting purpose.
For neutron application the default EPS is “Neutron1”.
The Radosys software provides also the feature of a custom-made EPS with individual
parameter settings. To construct a custom-made EPS, select any of the existing EPS,
being a sample style, and click on the “Edit” button. The individual parameters can be
edited and stored with a different EPS name. Please go to “Edit Parameter Set” subtitle
to get more information about the details.
Click on the “OK” button to start the measurement with the simplest way. However more
options are available, as follows.
5.4.2.1.5 OK button
Click on this button to start the analysis of a single detector holder card. The analysis will
be conducted on the inserted card according to the current EPS.
5.4.2.1.6 Batch button. (This button is not available at the RSV60 version)
Click on this button to start the analysis with repeated card insertion. This option can be
applied when more cards are desired to be evaluated with the same EPS. This is the
most convenient way when a significant number of detectors are desired to be analyzed.
Once the analysis on the previous card finished, the next card can be inserted without
any repeated parameter settings, and the next card is analyzed with the same EPS. Of
course, each card will be furnished with new card ID automatically. Probably this mode
will be applied the most frequently in a lab, where the detectors are processed regularly
and with big quantity.
Chapter 5.
Advanced operation
© 2013 by Radosys Kft. All rights reserved
RADOSYS User Manual
File Ref. RS_Man82
Page
5-6
Revised at 7/8/2013
5.4.2.1.7 Loop button.
Click on this button, when a repeated analysis of the same card is desired. The analysis
of the current card is repeated as long as until the action is stopped. This mode is
recommended for demonstration operation only. This is not recommended for real
measurement, since any accurate measurement requires a brightness calibration at
each start of the inserted card. This brightness calibration is done at each insertion of a
new card, however it can not be invoked whenever the card stays in the card tray
without removal.
5.4.2.2 Edit Loadlist
This window is displayed when the option "Specify IDs and positions" was selected in
the window “Automatic Measurement” and one of the measurement starting buttons was
pressed.
Using this option it is possible to enter and define the detector’s ID individually. If an ID
field remained empty, the ID will be defined by automatic code reading.
It is also possible to assign EPS to each detector individually.
When the detector selection checker is off, this detector position will not be measured at
all.
Individual comments can be also added to each detector position.
- To do so, drag the mouse pointer above the checker or the EPS field of the given
detector position; or click on its ID edit field.
- Afterward click on the comment field; ("Comment for det. nn", where nn denotes the
desired position number.) During this operation do not drag the mouse pointer above the
checker or EPS field of any other detector position to avoid altering the position
selection.
- You may check the validity of the position selection by the information displayed left to
the comment field.
After editing the loadlist the measurement can be started by the button OK. Or to void all
the edit operation, click on the button Cancel.
5.4.2.3 Track Marks
Soft key combination: Ctrl+T
Description: Recognised alpha tracks are marked with circles in red
Usage: Select this option to set the display status of the main window in order to display
the marking of the recognised tracks. These marks are in correspondence with the
objects, which were qualified by the software being a recognized alpha track. The track
marks are red circles around the object. Select the marker again to deselect this option.
The corresponding shape of the marker beside of this menu title indicates the actual
Chapter 5.
Advanced operation
© 2013 by Radosys Kft. All rights reserved
RADOSYS User Manual
File Ref. RS_Man82
Page
5-7
Revised at 7/8/2013
status of this option. The software preserves the last setting of this option even after
restarting the system.
The "Live picture" and the "Track marks" options are their each alternative. These two
alternative options can not be applied the same time.
5.4.2.4 Live Picture
Soft key combination: Ctrl+L
Description: Live microscopic image is displayed in the main window continuously.
Usage: Select this option to set the display status of the main window in order to display
a live camera picture, like a real–time microscope image display. Select the marker
again to deselect this option. The corresponding shape of the marker beside of this
menu title indicates the actual status of this option. The software preserves the last
setting of this option even after restarting the system.
Notes: Occasionally, it may happen that the displayed image seems not well contrasted
in live mode. This does not mean that the image analysis itself is conducted by means of
the displayed live picture. The analysis is always done with an image with high contrast,
according to the automatic focus operation in the background. The point is that these
two processes, the image captures for the analysis and the image displaying, are not
connected to each other tightly. The image analysis is a faster process than that of the
image display. Therefore sometimes the image displaying process may delay, while the
image analysis itself is done correctly at the background. The point is that the image
analysis has the highest priority among the processes running in the computer
simultaneously.
The "Live picture" and the "Track marks" options are their each alternative. These two
alternative options can not be applied the same time.
5.4.2.5 Drop Slide
Soft key combination: Ctrl+D
Description: Removal of detector holder card from the microscope
Usage: Use this menu item to remove a detector holder card from the microscope.
Warning!
This command is not available during Automatic Measurement.
Note: If the "Auto Drop Slide" option in the Maintenance/Settings menu was switched on,
this command will be executed after completion of any started Automatic Measurement
session automatically.
5.4.2.6 Feed Slide
Soft key combination: Ctrl+F
Chapter 5.
Advanced operation
© 2013 by Radosys Kft. All rights reserved
RADOSYS User Manual
File Ref. RS_Man82
Page
5-8
Revised at 7/8/2013
Description: Insertion of detector holder card into the microscope
Usage: Use this menu item to insert a detector holder card into the microscope. After
invoking this command, the software conducts an illumination process, which may take a
few seconds. Afterward, the microscope places its card feeder to its feeding position. A
message window with the text of " Please insert next slide" is displayed. Should this
operation were no longer needed, just click on the Cancel button and the microscope will
return to its default state.
Note: Whenever a measurement is started, either at Automatic or Manual Mode, the
software checks the existence of the holder card in the microscope. If no any inserted
card is detected, the "Feed Slide" command will be invoked automatically.
Tips: Sometimes it might happen that the main window is clicked before the insertion.
This accidental action will cause the message window to get to background position.
This occurrence is normal, and this is the behavior of any windows-like systems. This
occurrence can be corrected by the next ways.
Insert the card to the microscope.
Or drag the mouse pointer to the top of the screen and select the "Radometer message"
item.
5.4.2.7 Save Picture
Soft key combination: Ctrl+S
Description: Saves the image of the main Radosys window to a local file in JPEG
format.
Usage: Select the image is desired to save by means of the Manual Mode. Select this
menu of "Save picture". Select the folder, where the image file should be stored, among
the options displayed in the dialogue window. Enter the filename together with the file
extension into the input field at the bottom of the window.
Warning
The work folder of the Radometer software (/radosys/RadoMeter/bin) is not accessible
for file storage. Please select another folder, for example the folder of the "rm" user
((/home/rm) or any subfolder of this.
Options:
With header: Some specific information related to the nature of the image can be stored
together by displaying on the saved image. The desired information to be displayed is
selectable. The next information is available to be included.
Chapter 5.
Advanced operation
© 2013 by Radosys Kft. All rights reserved
RADOSYS User Manual
File Ref. RS_Man82
Page
5-9
Revised at 7/8/2013
- Detector ID code
- Date and time of the image record.
- The relative XYZ position of the optics head corresponding to the image capture.
With track marks: The track marks can be also stored together with the image. These
marks are in correspondence with the objects, which were qualified by the software
being a recognised alpha track. The track marks are red circles around the object.
JPEG quality: This is a setting option for the desired quality and compression mode of
the stored image. Bigger numbers provide higher quality, but bigger file size
consequently.
5.4.2.8 Exit
Soft key combination: Alt+X
Description: Stops the measurement and quit the software.
Usage: Use this menu option after the completion of the measurement and before the
powering off the equipment. The same function is available by clicking on the "nighttime" icon on the Taskbar. Whenever a detector holder card is still inside the
microscope, the software recognizes this status and displays a message requesting
confirmation. According to the nature of the decision, one of the next will be happened.
The holder card can be removed by a direct command (Drop Slide selection). A
repeated execution of the Exit command is needed at this case.
Exit was selected. This case the holder card will stay in the Microscope and this will be
removed at the next start automatically.
The query for the exit operation can be cancelled by Cancel selection.
Warning
After exit from the software, the computer must not powered off immediately. To switch
off the computer please follow the next instruction.
Close the X-Windows graphics environment by selecting Logout in the "K" menu at the
taskbar.
Invoke the "Shutdown" operation in the displayed window.
Wait until the massage "Level 0 reached" is displayed.
Push the main power button of the computer.
Chapter 5.
Advanced operation
© 2013 by Radosys Kft. All rights reserved
RADOSYS User Manual
File Ref. RS_Man82
Page
5-10
Revised at 7/8/2013
5.4.3 EVALUATION PARAMETERS (RS-RM VERSION SOFTWARE)
A huge amount of optional parameters can be set in the Parameters window.
This window is available in the window “Automatic Measurement”, when the button “Edit”
is selected in the line “Parameter Set”
This description is valid for the RS-RM version software version only, which is dedicated
to radon application. At the RS-TA version software, which is dedicated to neutron
application and to general track research, the meaning of a few options is different. The
RS-TA software specific options are described in a separate chapter.
A few Parameter Settings options were developed during the evolution of the Radometer
application and it may happen that those have lost their importance in the meantime. But
we have not yet cleared them, since we wanted to keep them for further research. Most
of those research options are also described here. But as a general guidance, it is noted
that the most comprehensive options, which has “survived” the evolution of the
Radometer software, comprise the basis of the standard EPS sets, which are installed
together with the recent versions of the system.
It is especially noted that the Track Type Options at the RS-RM software is not
documented in details, and just a rough description is provided to get impression about
their functions. This lowest level operation of the track recognition algorithm is
considered being intellectual property by the Radosys Ltd. Therefore just a rough
description can be provided here.
Chapter 5.
Advanced operation
© 2013 by Radosys Kft. All rights reserved
RADOSYS User Manual
File Ref. RS_Man82
Page
5-11
Revised at 7/8/2013
The Parameters Window
Track Type Options
Description of the deepest level Track Recognition control parameters
Shift, Limit, Cut parameters control the recognition of border-points of an object.
These parameters determine the criteria of acceptance for a border point of an object.
If one of two points at a distance SHIFT performs light intensity less than CUT, and the
difference of intensity exceeds LIMIT, that point is a recognized point belonging to the
border of the object.
No-of-points, R-max, R-min parameters control the recognition of a track.
These parameters determine the criteria of acceptance for a track on the basis of the
formerly recognized set of border-points.
If the object has No-of-points number of border-points at least, when a matching ring
including those border-points exists, and the smaller/bigger radius of the ring is R-min/Rmax, this object will be a recognized track.
Overlap parameter controls the recognition of overlapping tracks.
The centers of two tracks can not be closer to each other than a distance of Overlap,
which is a measure in pixels.
5.4.4 EVALUATION PROCESS VISUALIZATION, THE PROGRESS WINDOW,( RM-V3 VERSION)
Chapter 5.
Advanced operation
© 2013 by Radosys Kft. All rights reserved
RADOSYS User Manual
File Ref. RS_Man82
Page
5-12
Revised at 7/8/2013
The process of the evaluation can be tracked by the Progress window.
Soft key combination: Ctrl+P
Description: Displays the measurement progress window.
Usage: Normally, without the application of this option, the basic information about the
measurement progress is displayed at the bottom line of the main Radosys window. Use
this option to display additional details about the progress. The "Progress " window is
displayed after the selection of this menu item. Select the marker again to deselect this
option. The corresponding shape of the marker beside of this menu title indicates the
actual status of this option.
There is a rectangular field equally divided to 12 lines at the lower part of the progress
window. These 12 lines represent the detectors in the holder frame. One of them is
highlighted that one is under analysis at the moment.
There is a rectangular field at the top area of the window, which resembles a matrix.
Each section of this matrix corresponds to an individual view-field of the microscope.
During the analysis, these view-fields are scanned systematically, by means of a
sophisticated scanning algorithm. The same time the analysis status of each field is
indicated within the matrix by means of a specific codification.
The basic rule of this codification is the next.
Chapter 5.
Advanced operation
© 2013 by Radosys Kft. All rights reserved
RADOSYS User Manual
File Ref. RS_Man82
Page
5-13
Revised at 7/8/2013
The view-filed is marked by
.. the character "-" where scanning operation is due later
.. the character "o-" where the optimal focus plane has been already determined, but the
track analysis is due
.. the character "oo" where the analysis has been already completed
Information about the recognized detector ID codes, together the counted number of
tracks, also about the analysis status per each detector are displayed in the 12 lines.
Chapter 5.
Advanced operation
© 2013 by Radosys Kft. All rights reserved
RADOSYS User Manual
File Ref. RS_Man82
Page
5-14
Revised at 7/8/2013
5.4.5 SLIDE EDIT OPTION
The Radometer Analyzer manages the
identification of the detector holders
and of the detector chips automatically.
However this can be overridden by the
user for any particular purpose.
Please remember what sequence the
detector chip positions within the
holder are registered by the analyzer.
Chapter 5.
Advanced operation
© 2013 by Radosys Kft. All rights reserved
RADOSYS User Manual
File Ref. RS_Man82
Page
5-15
Revised at 7/8/2013
5.4.6 GLOBAL RADOSYS SOFTWARE OPERATION SETTINGS
The Settings Window.
Chapter 5.
Advanced operation
© 2013 by Radosys Kft. All rights reserved
RADOSYS User Manual
File Ref. RS_Man82
Page
5-16
Revised at 7/8/2013
5.4.7 MANUALCONTROL OPERATION
A special mode of operation is also available, where the Radosys microscope can be
used also like a normal lab microscope. But this time the controls are available from the
Radometer software environment. Additionally, all the Radometer specific, track reading
application features are also available to control by means of control buttons.
The Manual Control Window. This is available in the Measurement menu.
Chapter 5.
Advanced operation
© 2013 by Radosys Kft. All rights reserved
RADOSYS User Manual
File Ref. RS_Man82
Page
5-17
Revised at 7/8/2013
5.4.7.1 General and Common Note about This Feature
The optics head of the microscope can be controlled manually. This means that the
microscopic objective can be moved along the X-Y plane of the detector chip by means
of movement keys or buttons. These movement control buttons are displayed at the top
area of the "Manual Controls" window. Each selected stepping mode instructs the
software to conduct different way of movements at the microscopic head, concerning to
the unit of the movement, as well as the displayed X-Y position value. There are also
X:Y position indicator fields in order to display the actual position value of the optics
head. The unit of the displayed value equals to the stepping number of the
corresponding directional movement stepper motor. However the meaning of the value
displayed in the position indicator fields may depend on the selected "step mode".
The default setting of the step-mode is "absolute".
5.4.7.2 Manual Measurement
Soft key combination: Ctrl+M
Description: Operational mode to control the microscope manually, like a conventional
microscope, but the interaction is made by means of set of software tools provided by a
graphics window. This mode is also applicable for visual evaluation of the microscopic
view-fields.
Usage: Select this menu option and insert the detector holder card into the microscope.
A window with the title of "Manual Controls" is displayed. Wait a few seconds until the
automatism of the microscope moves the card into its steady position.
A set of manual control features is available, as follows.
Selection one of the detectors in the card: 12 detectors are included in one holder card.
Each detector can be selected by clicking on the desired detector position illustrated at
the right edge of the window, by a matrix of numbered buttons.
Choice an X-Y stepping mode, referred as "step mode": Three different modes are
available, namely either of "absolute", "relative" or "frame".
5.4.7.3 "Frame" Step Mode
At this mode, not the cumulated number of the directional movement motor steps are
displayed in the X:Y position indicator field, but the sequence number of the view-field
displayed in the main microscopic image window. The target feature of this mode is to
provide the opportunities of stepping from view-field to view-field by manual control,
comprising those view-fields exactly, that are the subjects of the evaluation in
"Automatic Measurement Mode". The numbers displayed in the X:Y position indicator
field correspond to the sequential number of the column and row of the view-field within
the detector chip.
Warning! The operation of this mode depends on the applied evaluation parameter set.
The actual set of view-fields are influenced on the settings options. Please find the
related information below.
Chapter 5.
Advanced operation
© 2013 by Radosys Kft. All rights reserved
RADOSYS User Manual
File Ref. RS_Man82
Page
5-18
Revised at 7/8/2013
Notes: It may happen that some difference occurs between the microscopic images at
automatic and manual mode, or at repeated measurements. However any significant
difference can be expected only if the applied evaluation parameter set had changed.
Notes: At alteration to mode of relative or of frame style, the ID code of the detector chip
is recognized automatically. Consequently, the exact position of the detector chip within
the holder card is recognized at the same time accurately.
5.4.7.4 "Relative" Step Mode
This mode is similar to the "Absolute" step mode, but there is a difference. The origin of
the coordinate system is located to a specific position of the selected detector chip. This
origin is located at the most upper left position of the evaluation area of the detector
chip.
5.4.7.5 "Absolute" Step Mode
Data displayed in the position indicator fields corresponds to the absolute, hardware
related coordinate system of the microscope itself. The indicated unit corresponds to 4
microns in the X-Y plane. The indicated unit corresponds to 0.05 microns in Z-direction.
Explanation for the direction denotation:
X-Y Plane: Plane, which is parallel with the surface of the detector chip. The origin of the
absolute coordinate system is located at the most upper left position of the holder card,
which is marked by a 45 degrees slope on it. X-axis is the longer and Y-axis is the
shorter one.
Z-direction: Z-position value corresponds to a perpendicular distance from the surface of
the detector chip. Zero position denotes the biggest distance from the chip.
5.4.7.6 Other Buttons and Editable Fields
Setting the movement step unit: This field is editable or a few predefined values are
selectable by the scroll bar. In "absolute" or "relative" mode this value determines the
size of one step, which is expressed as a number of the elementary steps made by the
directional movement stepper motors in X or Y direction. This field is not meaningful in
"frame" mode, since at this mode the unit step is 1, and this value can not be modified.
The value of this field also determines the unit steps towards the Z-direction. The Zdirectional stepper motor makes as many elementary steps, as the double of the number
in this field exactly.
Direct movement of the directional stepper motors: This tool is controlled by the set of
buttons, like the cursor movement keys of the keyboard. This buttons indicated by
arrows at the top of the window. The movement towards the Z-direction, that is the
tuning of the contrast, is made by clicking on the buttons indicated by "Z^" and "Zv". The
alternative mode for the control is the usage of the cursor movement keys of the
Chapter 5.
Advanced operation
© 2013 by Radosys Kft. All rights reserved
RADOSYS User Manual
File Ref. RS_Man82
Page
5-19
Revised at 7/8/2013
keyboard, if the keyboard was set to NumLock state previously. If this control mode were
applied, this would be effective only if the cursor was not active in a data enter field.
Direct movement to the desired location: Select the desired stepping mode and enter the
target location into the X/Y/Z fields. Click on the "Move!" button.
Warning! It may happen that the objective of the microscope bumps to the detector chip
or to the holder card during its control towards the Z-direction. This state can be
recognized easily by watching the microscopic image main window. If the image does
not perform any change, in spite of the repeated instruction for Z-directional movement,
this will be a good indicator of this bumping state. The mechanical structure of the
microscope ensures protection against this event, because of its flexible suspension.
However please avoid invoking any X/Y movement instruction at this bumping state in
order to protect the front lens of the objective against damaging scratches.
Reading the ID code of the detector chip "Read ID": Click on the button. The reading
operation starts and after a few seconds the result of the reading will be displayed in a
message window. The message informs about the recognized ID code.
Automatic image contrast query ("Autofocus"): Click on the button in order to instruct the
software to carry out the automatic microscopic image focusing.
Notes: The Z-directional position decided being optimal by the auto-focus operation is
influenced on the actual settings of the evaluation parameter set.
Alteration of the microscopic enlargement: Beside the standard 100x enlargement, the
opportunity of 400x is also available at a few Radosys Microscope units. This feature is
provided by the microscope hardware, but this option is meaningless at the current
Radosys evaluation software. Click on the button to achieve a bigger enlargement and
click on again to return to the standard mode of 100x.
Note: The feature of 400x enlargement is not available at all Radosys microscopes, but
only at a few delivered units.
Replacement of the holder card: Click on this button in order to change the holder card
with the detectors to be analyzed. A message window will instruct about what to do.
Close the window ("Close"): After the manual analysis, the window can be closed by the
selection of this menu option. The analysis software gets into it standby state and gets
ready to carry out the next instructions, for example, invoking automatic analysis or
manual operation with the next holder card.
Chapter 5.
Advanced operation
© 2013 by Radosys Kft. All rights reserved
RADOSYS User Manual
File Ref. RS_Man82
Page
5-20
Revised at 7/8/2013
5.4.8 CALIBRATION PARAMETER SETTINGS
Chapter 5.
Advanced operation
© 2013 by Radosys Kft. All rights reserved
RADOSYS User Manual
File Ref. RS_Man82
Page
5-21
Revised at 7/8/2013
5.4.9 DEBUG WINDOW
Chapter 5.
Advanced operation
© 2013 by Radosys Kft. All rights reserved
RADOSYS User Manual
File Ref. RS_Man82
5.5
Page
5-22
Revised at 7/8/2013
RADOSYS DMU SOFTWARE ADVANCED OPERATION
5.5.1 WARNING AND ERROR CODES
Error code
Description
-1
ID not found
-2
Empty position
-3
Error in code
-4
Corrected code
-5
ID not in allowed range
-999
ID not in allowed range
-998
Lentgh of ID is too short
-997
Key of the detector is not valid
-996
PGP keyring error
-995
Temporary file creation error
-994
Pipe error
-993
Error in communicating with database
server
-992
Database server returned SQL error
ID Code Reading Related Error Codes
5.5.2 DESCRIPTION OF COLUMNS IN DMU RESULT CHART
Description about the available columns listed in the result chart is available in the
Chapter 5.5.3. The same set of columns and concept has been implemented in all the
versions of the Radosys DMU software.
This equivalence among the versions is specific to the result columns only. In other
respects those versions are different and the later DMU-V6 version provides a few extra
features, which is not available at the former version DMU-V3. But these extra features
are not related to the result columns. Therefore the available result columns can be
considered universal along the various DMU software versions.
5.5.3 DATA LISTING WITH THE DMU SOFTWARE
The Radometer software stores a lot of various data in the database during the analysis
of a detector chip. A part of them provides the most relevant results but the majority are
used occasionally, mainly for diagnostic purposes.
By default only a set of the most relevant results is accessible. However, by clicking the
“Configuration” button on the bottom part of the window, another window will appear with
the full set of stored data types (see figure of “Parameter Chart”). By means of this list
the result chart can be freely designed by the user. Each item in the list consists of the
abbreviation of the requested data column and a check box, which can be altered by
Chapter 5.
Advanced operation
© 2013 by Radosys Kft. All rights reserved
RADOSYS User Manual
File Ref. RS_Man82
Page
5-23
Revised at 7/8/2013
clicking on it. If the check box is checked, the corresponding column will be included in
the result chart, otherwise it will be excluded.
Four preset configurations are available:
Default: items considered most common in practice are checked
All: (almost) all listed items are checked
Exposure: in addition to the parameters in the Default configuration it contains the
exposure time and the radon concentration but does not include the Paramset
Dates: in addition to the parameters in the Exposure configuration it contains the first
and last day of exposure but does not include the dose.
Each of these configurations can be altered by checking the check box next to the
appropriate items and then clicking on the “Save” button. Moreover, new configurations
can be added by clicking the “New” button. Then in the pop-up window enter a name for
the new configuration and press Enter. Any configuration can be deleted by choosing
the configuration and pressing the Delete button.
You can also change the order of the listed items by clicking the “Configure List Order”
button. In the pop-up window the selected parameters are written in black, the
deselected parameters are written in red. You can move each item up and down by
clicking the “Up” and “Down” buttons. Click OK.
You can close the Configuration window by clicking the “Close” button (see below).
The available stored parameters in the DMU software - “Parameter Chart”
The list of the available columns together with a brief description is as follows.
Parameter
Description
Result_ID
Serial number of the result
Date & Time
Date and time of the analysis in format YYYY-MM-DD hh:mm:ss
Date
Date of the analysis in format YYY-MM-DD
Chapter 5.
Advanced operation
© 2013 by Radosys Kft. All rights reserved
RADOSYS User Manual
File Ref. RS_Man82
Page
5-24
Revised at 7/8/2013
Parameter
Description
Detector ID
Identification number of the detector
Detector ID mode
Status of the detector’s ID code reading. Value “A” means
Automatically Recognized, value “B” means Manually Entered and
value “C” means Automatically Recognized with the possibility to
manually correct the falsely identified ID codes.
Slide ID
ID code of the corresponding slide
Position in slide
Position number of the detector chip in the slide. Its value falls
between 1 and 12.
Automatic grid
Status of the scan grid. “+” means Automatic Grid, “-” means User
Defined Grid.
Grid start X,
Grid start Y
Starting location in the X and Y directions counted from the upper left
corner of the detector chip in units of the stepper motors*
Grid delta X,
Grid delta Y
Step size between neighboring view-fields in the X and Y directions
in units of the stepper motors*
Grid number X,
Grid number Y
Number of view-fields to X and Y directions*
Position file
When User Defined Grid is used, the name of the definition file is
listed here.
Focus mode
Various modes of auto-focus operation are available. This value
provides information on the utilized mode. Values A, B, C, D mean
Dynamic Mode, Focus All Mode, Fixed Mode, Engraved Mode,
respectively.
If no plane found mode
Auto-focus strategy applied when the standard auto-focus operation
failed at a given view-field. Value “A” means Extrapolate Mode, value
“B” means Focus All Mode.
Track mode
Applied track type. Values A, B, C, D mean Small Circular, Medium
Circular, Large Circular and Custom Circular, respectively.
Processing mode
reserved for future use
Number of fields
Total number of view-fields scanned, which contribute to the track
density result. Failed view-fields are not counted.
Remark: In Repeated Mode the total number of scanned and
contributing view-fields is displayed.
Size of area (mm2)
Total scanned area that contributes to the result expressed in
tracks/mm2.
Remark: In Repeated Mode the total sum of scanned area is
displayed that contributes to the result.
Number of tracks
Total number of counted tracks.
Remark: In Repeated Mode the total sum of counted tracks is
displayed that contribute to the result.
Chapter 5.
Advanced operation
© 2013 by Radosys Kft. All rights reserved
RADOSYS User Manual
File Ref. RS_Man82
Page
5-25
Revised at 7/8/2013
Parameter
Description
Track density
Track density in tracks/mm2. If the detector was analysed in
Repeated Mode then the mean of the read track densities is listed
here.
Mechanics ID
ID code of the microscope unit, by which the measurement was
carried out.
Software version
Version number of the RM software, by which the measurement was
carried out.
Flags
Auxiliary descriptive information about the analysis.
Operator's username
ID of the LINUX user, who invoked the RM software.
for A comment entered at the time of the analysis.
Comment
measurement
Standard deviation
Standard deviation of the repeated scans in Repeated Mode. This
has no sense when the detector is scanned only once (Passes = 1),
in which case 0 is displayed.
Count of measurements This is the number of measurement cycles in Repeated Mode.
Slide type
Type of the applied slide. Value “A” means Normal Slide and value
“B” means 2K Slide.
Saturated
Indicates whether or not the detector chip was saturated with tracks.
For a detailed description please refer to the related section of this
Manual.
Ratio of dark points
Percentage of the dark pixels relative to the total number of pixels.
The saturation condition is detected by means of this value.
Z offset
The actual, optimal focus plane where the track recognition is carried
out, which may differ from the focus plane determined by the autofocus operation itself. This value provides information about the
distance between the focus plane of the track recognition and that of
determined by the auto-focus operation.
Focus plane DZ2 value
A score value of the accuracy of the auto-focus operation. Smaller
values indicate more accurate fitting of the focus plane.
Detector
data
has
detailed Indicates whether the number of tracks in all view-fields has been
stored separately.
Maximum track density If the detector was analyzed in Repeated Mode (passes > 1) then the
maximum track density is listed here.
Inhomogenity value,
Inhomogenity P value
Chapter 5.
These values are provided by the statistics analysis carried out to
detect inhomogeneous distribution of tracks along the scanned area.
For more details of this analysis please find information in the
corresponding chapter of this Manual.
Advanced operation
© 2013 by Radosys Kft. All rights reserved
RADOSYS User Manual
File Ref. RS_Man82
Parameter
Inhomogenity
failed
Page
5-26
Revised at 7/8/2013
Description
check Indicates whether the distribution of the tracks on the chip is
inhomogeneous.
ID reading error code
See 5.5.1.1.
Detector has class data
Indicates whether the track size distribution has been determined for
the detector.
Paramset
Name of the parameter set used for the measurement.
Paramset ID
Numeric ID of the parameter set used for the measurement.
Correction factor
microscope
of If the results of the microscope systematically differ from those of the
reference microscope then a correction factor is used to correct the
track densities when calculating the exposure and radon
concentration values. The listed track density is the originally read
track density.
Detector ID
Identification number of the detector.
First day of exposure
First day of the exposure.
Last day of exposure
Last day of the exposure.
Calibration set ID
Calibration set assigned to the detector. It is 0 in case of automatic
assignment.
Comment for detector
Additional comment assigned to detector.
Detector type (numeric) Numeric code of the diffusion chamber.
Linked detector ID
In case of a double chip diffusion chamber, the identification number
of the other detector chip is displayed here.
Key
reserved for future use
Exposure time (days)
Duration of the exposure of the detectors in days.
RAC in Bq/m3 units
Radon activity concentration in Bq/m3
RAC in pCi/l units
Radon activity concentration in pCi/l
Exposure (kBq.m-3.h)
Radon exposure that the detectors have been exposed to
Detector type
Type of the diffusion chamber.
* These parameters have a meaning only in Automatic Grid mode and provide
information about the scan grid.
Chapter 5.
Advanced operation
© 2013 by Radosys Kft. All rights reserved
RADOSYS User Manual
File Ref. RS_Man82
Page
5-27
Revised at 7/8/2013
5.5.4 DATA EXPORTATION TO OTHER APPLICATIONS
The result chart of the DMU software can be transferred for use by another application in
two steps. In the first step the chart is exported into a text file. In the second step the text
file is imported to the other application, which is usually Microsoft Excel.
In the following two subsections the data exportation and the text file importation for MS
Excel is described.
5.5.4.1 Data Exportation From DMU-V6R or DMU-V6N Software Versions
To create the export text file follow the steps below:
1. Compose your result chart as described in section 5.5.3.
2. In the bottom right corner of the window you will find a group box called “Filter”,
where you can filter the items to be listed on the screen.
The DMU results screen filtered by the Slide ID
3. Select a parameter in the drop down list, according to which you want to filter the
listed items.
4. Enter the initial and final values for the selected parameter. If you omit the final
value then it is assumed to be equal to the initial one.
5. Now only the results corresponding to the above settings will be listed. 25 rows
can fit in one window. You can move in the list by pressing the “Prev” and “Next”
buttons.
Chapter 5.
Advanced operation
© 2013 by Radosys Kft. All rights reserved
RADOSYS User Manual
File Ref. RS_Man82
Page
5-28
Revised at 7/8/2013
6. Press the “Export” button. A pop-up window will appear.
The export window of the DMU software
7. If you have plugged in a pendrive then it will appear in the “Save in folder:” field
by default.
8. Enter a name for the exported file. The default file name is export.txt. It is
recommended to use a txt extension.
9. Select the folder you want the exported file to be saved into.
10. If you check the “Export Filtered” check box then only the filtered results listed on
the screen will be exported. If you check the “Export All” check box then all the
results will be exported.
11. Click on the OK button.
12. The exported file will have a semicolon (;) delimited format.
5.5.4.2 Data Exportation From DMU-V99 Software Version
In order to import the exported text file to MS Excel, follow the steps below:
1. In MS Excel select the command Open.
2. In the Open window, at the line <File of Type> select Text Files.
3. Select the exported text file and click on Open. A three step dialogue <Text
Import Wizard> will start.
4. In the window Step 1 of 3 of the Wizard mark the Delimiter option and click on the
Next button.
5. In the window Step 2 of 3 of the Wizard mark the Semicolon option and click on
the Next button.
6. In the window Step 3 of 3 of the Wizard there is nothing important to do, just click
on the Finish button.
Chapter 5.
Advanced operation
© 2013 by Radosys Kft. All rights reserved
RADOSYS User Manual
File Ref. RS_Man82
Page
5-29
Revised at 7/8/2013
5.5.4.3 MS Excel Specific Notes
When regional language version of the MS Windows is used, it may happen that the
imported chart behaves unusually.
For instance it may happen that a cell with seemingly decimal number in it does not
behave as decimal number.
Whenever this or similar happens, it is recommended to check a few tips as follows.
- Check the format of the cell and correct the format to the appropriate one.
- Check the regional settings of your Windows. In many regional versions the
decimal point is not a period but a comma.
Chapter 5.
Advanced operation
© 2013 by Radosys Kft. All rights reserved
RADOSYS User Manual
File Ref. RS_Man82
Page
5-30
Revised at 7/8/2013
5.5.5 CALIBRATION USING THE DMU-V6R SOFTWARE BEFORE OCTOBER, 2012.
Read this chapter at DMU sw versions installed before 15, October, 2012. For later sw
versions read Chapter 5.5.6.
In order to perform an analysis of the calibration results follow the instructions below:
1. Measure the calibration detectors normally.
2. After each calibration detector is evaluated successfully, switch to the DMU-V6R
software and push the
button on the main screen. The
Calibration window with a list of the current calibration factors will appear.
The calibration window of the DMU software
3. If you want to modify a previous calibration, then choose the corresponding line.
Alternatively fill in the “Det ID From”, “Det ID To” and optionally the “Comment”
fields. However, you can also leave these fields empty at this stage.
Chapter 5.
Advanced operation
© 2013 by Radosys Kft. All rights reserved
RADOSYS User Manual
File Ref. RS_Man82
Page
5-31
Revised at 7/8/2013
4. Push the
button. In the next window a list of recently measured
slides and an empty graph will be displayed.
Table ZX, The calibration results window of the DMU software (with an empty graph)
5. In this window you can see a list of detector batches. Each batch contains
detectors that were exposed to the same level of exposure. Entering a number in
the “Show slides from last N days” control, you can set the time period in which
the batches to be displayed in the list were analysed.
6. If you want to see the comments on the slides instead of the slide IDs then check
the “comments” check box.
7. Select a batch by clicking on it. If more than one batch belong to the same
exposure group then you can select them all by holding down the “Ctrl” key while
clicking them one by one. If there are several slides with the same comment (e.g.
CAL144) then one line in the list will cover all the detectors in that exposure
group, so it is sufficient to choose only one line per exposure group.
8. Enter the exposure value for the selected batch in the “Exposure:“ field. If the
“Slide ID” or the “Comment” field contains the string “CAL” followed by a number,
then this number indicates the appropriate exposure value in the unit of kBqh/m3,
which is automatically copied to the “Exposure:“ field. (For example, if the
“Comment” field contains “CAL144” then the exposure is equal to 144 kBqh/m3,
which is automatically copied to the “Exposure:“ field.)
9. Click the
button. The corrected densities of the detectors within the
selected batch will be plotted on the graph in red.
10. Repeat steps 7-9 for each exposure group.
Chapter 5.
Advanced operation
© 2013 by Radosys Kft. All rights reserved
RADOSYS User Manual
File Ref. RS_Man82
Page
5-32
Revised at 7/8/2013
11. The background value will be automatically calculated from the group with 0
exposure.
12. The CF and EXP values are calculated from a power function fitting on all the
selected exposure groups.
13. The AO parameter is preset, it should not be changed.
14. If the result of fitting is not satisfactory, each parameter can be adjusted manually.
The calibration results window of the DMU software (with the fitted curve)
15. Enter an identifier in the “Batch name” box next to the
be used to look up this calibration later.
button. This can
16. The parameters can be accepted by clicking the
button. The
calibration is saved as “batchname@current-date-and-time” and can be seen at
the top of the “Previous calibrations” list on the right hand side of the window.
17. At the same time the program will generate an XLS file that contains the details of
the data plotted above as well as the relative deviations of the calculated
exposure values from the reference exposures. The average and standard
deviation of these deviations are also given for each batch. The system will
prompt you to choose a directory and a file name for the XLS file. You should
type the file name with the extension (xls).
Chapter 5.
Advanced operation
© 2013 by Radosys Kft. All rights reserved
RADOSYS User Manual
File Ref. RS_Man82
Page
5-33
Revised at 7/8/2013
Saving the exported XLS file
18. The fitted parameters will be copied to the “Calibration” window. You can still
modify the “Det ID From”, “Det ID To” and “Comment” fields. Click the
button if the calibration is new or the
button to update an existing
calibration.
19. With the calibration completed, the DMU main window will contain the correct
values in the “Corr.Dens.” (background corrected density) and “Rn Expos.”
columns.
5.5.5.1 Explanation and formulas for the calculated fields
Corrected Density: C = D− BG , where D is the measured track density, BG is the
background density value.
ln(C)+ CF
Radon Exposure: e exp , where C is the above corrected density, CF is the calibration
factor and EXP is the exponent.
The CF should be in the range of 2.5 – 7. The EXP parameter is close to, but usually
slightly smaller than 1 (0.85 – 1). The value of 1 means linear calibration.
Chapter 5.
Advanced operation
© 2013 by Radosys Kft. All rights reserved
RADOSYS User Manual
File Ref. RS_Man82
Page
5-34
Revised at 7/8/2013
5.5.6 CALIBRATION USING THE DMU-V6R SOFTWARE AFTER OCTOBER, 2012
Read this chapter at DMU sw versions installed after 15, October, 2012. For earlier sw
versions read Chapter 5.5.5.
5.6 TIPS AND TRICKS
<Update text to be inserted here>
5.6.1 HOW TO IMPROVE THE IMPRECISION AT TRACK COUNTING?
The Evaluation Parameter Set (EPS) determines the details of the track image analysis
and may influence on the results decisively. The EPS’s are editable and are available to
edit in the Measure/Automatic window. A few prototypes EPS are delivered with the
installation set of the software. These prototypes are optimized for routine operation,
where the basic requirement is a fast track analysis, about 1 min. per detector chip, but
with a moderate repeatability of 7%.
At some applications, for example when an analysis is conducted for metrology
intercomparison purpose, a better imprecision might be needed. The imprecision related
to the track recognition operation of the software can be enhanced by the usage of an
alternative EPS, which provides around 2% imprecision at repeated track analysis. The
price of the bigger precision is the longer time of the analysis, with 5 minutes. Therefore
the application of this mode is proper to refer as “Slow Mode”. These specific EPS can
be derived from any of the prototypes easily. The procedure for the creation of the
corresponding EPS is described here.
Open the Automatic window in the Measure pull-down menu.
At the line “Parameter Set” select your EPS prototype, for example “2K Small Tracks”
Select the Edit button. A window with a series of editable parameter settings options is
displayed.
Locate the “Focusing” line and change its value to “All”.
Locate the “If No Plane” line and change its value to “Focus All”.
And now save your new EPS. At the line of the name of the EPS, change the name of
the prototype to any other one is desired. For example to “2K Small Focus All”.
Click on the “OK” button. The window is closed and now the new EPS is available to
use.
Use the new EPS by selecting it at the line of the “Parameter Set”, when an analysis is
started in Automatic/Measure. The new EPS, like any of the registered EPS, is also
available at the “Manual” operation mode.
5.6.2 CHEMISTRY RELATED INFO
Merck NaOH + distillated water {Relevant text to be inserted here}
Chapter 5.
Advanced operation
© 2013 by Radosys Kft. All rights reserved
RADOSYS User Manual
File Ref. RS_Man82
Page
5-35
Revised at 7/8/2013
Second use of chemicals. {Relevant text to be inserted here}
5.6.3 TRACK SIZE OPTIMIZATION
TA-software + Sample images for optimal track sizes.
{Relevant text to be inserted here}
5.6.4 SYSTEM CALIBRATION
{Relevant text to be inserted here}
5.6.5 SETTING UP NETWORK CONNECTION (RSV6X VERSION)
Two options are available to set up network connection with the standard Radosys
notebook type computer. HP-nx6110.
Ethernet (cabled) network and/or wirless network (if you have a wireless access point in
the building).
5.6.5.1.1 Ethernet Network
Ethernet (cabled) network and wirless network (if you have a wireless access point in
the building).
For the Ethernet network, there is nothing to do, just connect the cable to the laptop
computer. If you have a DHCP server at your company, it will get a network IP address
automatically.
If you have to set up IP addresses manually on the windows computers, you have to do
it manually also under linux:
Go to "K menu" -> System -> Control Center (YaST).
Type the administrator password (RMet2000).
Click on "Network devices" on the left and "Network Card" on the right.
Select "Hwelett-Packard Company nx6110" and click "Edit".
Set up IP address, Netmask, DNS server, Gateway address as your local network
administrator provides them.
5.6.5.1.2 Wireless Network
To set up the wireless network, you need to do the following:
Go to "K menu" -> System -> Control Center (YaST).
Type the administrator password (RMet2000).
Click on "Network devices" on the left and "Network Card" on the right.
Select "Ethernet network card" and click "Edit".
Set up IP address if required by your network administrator, or leave it on automatic.
Click "Next" and set up the parameters of your wireless network.
If the settings are successful, the blue wireless light on the computer should light up.
Chapter 5.
Advanced operation
© 2013 by Radosys Kft. All rights reserved
RADOSYS User Manual
File Ref. RS_Man82
Page
5-36
Revised at 7/8/2013
5.6.6 WHEN ID CODE READING FAILS
There are occasions when the ID code reading may fail, which cases can not be
handled by the software.
- When there is a scratch on the area of dote codes on the surface of the chip.
- In the high track density region, above 100 tracks/mm2. At this case the dot code
structure is covered by tracks too dense and the software can not identify the code dots.
At any case, when the ID code reading fails, the code can be corrected in the software
manually. This can be done either within the Radometer software or within the DMU. At
this case read the alphanumeric ID code from the chip itself. The position number of the
chip in the slide may help to identify the chip itself. The position numbering concept is
described in Chapter 7.1.
- ID code correction within the Radometer track reader software:
In the Measure pull-down menu select Review Slide.
In the Slide Edit window select the last slide in the Slide ID line.
Edit the desired chip position by clicking on the corresponding field.
Click on the OK button to store the changes.
- ID code correction within the DMU-V6R database software:
In the main window, among the list of detectors, select the desired line by means of the
known slide ID or Date&Time of the measurement, together with the Position
information. If the Position column is not displayed, add this column to the chart
configuration after clicking on the Configuration button.
After selecting the desired detector line, click on the button "Edit Detector ID" and edit
the ID field. Click on OK button to save the changes.
Note: The Radometer software can be configured that the Slide Edit window be
displayed after the measurement of a slide automatically. This setting can be achieved
by modifying the actual EPS appropriately. For information about EPS settings refer to
the chapter “EPS Settings”.
Chapter 5.
Advanced operation
© 2013 by Radosys Kft. All rights reserved
RADOSYS User Manual
File Ref. RS_Man82
Page
5-37
Revised at 7/8/2013
5.7 RADOSYS SPECIAL TYPE DETECTORS
In the Radosys detector production program the RSKS type detector is the standard
type. A few special types are also available for specialty applications. In this chapter
type specific information for their operation and usage is given.
5.7.1 THE RADUET DETECTOR
The Raduet detector is an extension of the former standard type, the RSF type radon
detector.
This detector type is dedicated to combination detection of radon and thoron activity at
the same time.
It consists of two detectors – a standard RSF type detector and a modified version, the
latter with reduced response time. The main chamber is selective for the radon activity
primarily. But the secondary chamber is sensitive for both radon and thoron. By a simple
linear calculation the radon and thoron activity data results can be separated and
extracted.
The operation principle and metrology specification of the Raduet detector is reported in
the following paper:
“Up-to-date radon-thoron discriminative detector for a large scale survey” by Shinji Tokonami, Hiroyuki Takahashi, Yosuke
Kobayashi, Weihai Zhuo and Erik Hulber in Review of Scientific Instruments, Vol. 76: 3505-3509, 2005.
The cross sectional view of the Raduet detector is shown on the picture in the Chapter
2.5. On the picture the detector in the left is a standard radon detector called Rn-channel
of the Raduet detector. The detector in the right is the modified type, which is equipped
with enhanced sensitivity for thoron. This is called Tn-channel of the Raduet detector.
This can be identified easy by the six holes on the round of its body. These big size
holes provide enhanced ventilation rate, and consequently much shorter response time,
for thoron detection. Since the lifetime of the thoron is much shorter than of the radon,
the larger ventilation rate allows the thoron gas diffusing into the diffusion chamber
before it decays. Contrary, at the standard RSF radon detector the standard air gap acts
as a barrier for the thoron gas, while the air gap is much more transparent for the radon
gas. Consequently, the Rn-channel is almost non sensitive for thoron at all, while the Tnchannel performs high sensitivity for thoron, too. Both channels are sensitive for radon,
with almost the same level of sensitivity.
In other words, the CR-39 chip inside the Rn-channel registers only those tracks, which
come from radon decays. And the Tn-channel registers all the tracks coming from both
radon and thoron decays. This means that the counted track density in the Tn-channel is
the sum of the tracks originated from both radon and thoron decays. Proper calibration
data and combination calculation is able to extract the individual radon and thoron
activity data from these two track density values.
The Raduet detector consists of the radon and thoron sensitive diffusion chambers and
a plastic tray, which joints them together. These three components together form a unit.
When the Raduet detector deployed, the whole unit should be kept together in its
original form, during the time of exposure. Like at all types of Radosys detectors the unit
Chapter 5.
Advanced operation
© 2013 by Radosys Kft. All rights reserved
RADOSYS User Manual
File Ref. RS_Man82
Page
5-38
Revised at 7/8/2013
is delivered sealed into radon-proof foil bag. Removing the sealing the exposure period
starts instantly. For general information about the usage please find information in the
corresponding Chapter 4.1 describing the deployment of Radosys detectors generally.
Processing the exposed Raduet detector.
Dismantle and etching of the detector is done the same way like the standard Radosys
detectors, see Chapter 4.2. The difference is that the Raduet consists of two CR-39
chips. Like at all Radosys detector types the diffusion chambers are labeled, where the
ID code on the label is identical to the ID code engraved onto the surface of the CR-39
chips. The ID codes on the two CR-39 chips are adjacent. The ID code of the Rnchannel is always an odd number and the Tn-channel is labeled with the next even
number.
The track counting on the etched chips is done by the track reader software the normal
way. But now two track density values are provided - one for the Rn-channel and a
second one for the Tn-channel. These values are listed in the DMU software, but the
calculation of the activity concentrations is not implemented in the current version of the
DMU software. This calculation have to be done separately, for instance by means of a
spreadsheet software like the MS Excel. Consequently, the data list provided by the
DMU software has to be exported for this purpose. For information how to export data
list to Excel, see Chapter 5.5.4.
The channel specific exposure values in kBqh/m3 are calculated from the channel
specific track density values by the following calculation, which actually is a matrix
multiplication. (See also the Note 5.7.1 below)
RnExp=CF*(1.00*RnD-0.02*TnD)
TnExp=CF*(-1.11*RnD+ 1.21*TnD)
The activity concentration value is calculated from the exposure value and the time of
exposure as usually:
RAC=RnExp*1000/24/T
TAC=TnExp*1000/24/T
The following abbreviations are applied in these formulas:
RnExp:
Exposure value for the Rn-Channel, in kBqh/m3
TnExp:
Exposure value for the Tn-Channel, in kBqh/m3
RnD:
Track density counted for the Rn-channel, in mm-2
TnD:
Track density counted for the Tn-channel, in mm-2
CF:
Batch Depending Calibration Factor provided by the Radosys QC system.
T:
Time of exposure in Days
RAC:
Radon Activity Concentration, in Bq/m3
TAC:
Thoron Activity Concentration, in Bq/m3
Chapter 5.
Advanced operation
© 2013 by Radosys Kft. All rights reserved
RADOSYS User Manual
File Ref. RS_Man82
Page
5-39
Revised at 7/8/2013
Sample of calculation chart for Raduet detector.
Note 5.7.1.
The coefficients for the calculation of radon and thoron activity concentrations are
reported on the basis of the following paper.
“Up-to-date radon-thoron discriminative detector for a large scale survey” by Shinji Tokonami, Hiroyuki Takahashi, Yosuke
Kobayashi, Weihai Zhuo and Erik Hulber in Review of Scientific Instruments, Vol. 76: 3505-3509, 2005.
For individual calibration requests for Raduet detectors please contact NIRS at the
address and email address referred in this paper.
Chapter 5.
Advanced operation
© 2013 by Radosys Kft. All rights reserved
RADOSYS User Manual
File Ref. RS_Man82
Page
5-40
Revised at 7/8/2013
5.7.2 RADUET IMPRECISION
1. The calibration factor (CF) performs some variation from batch to batch. The
manufacturer Radosys supplies calibration factor data information on radon regularly.
For example
Detector batch
kBqh / m 3
CF
2
track / mm
R98560 - T24624
43.63
4%
T35425 - T63684
36.58
4%
Relative uncertainty
The matrix used for the exposure calculations is
a11 a12 1.112 − 0.119
=
2.576
a 21 a 22 − 2.434
and the uncertainties of the matrix elements are
a11 a12 0.107 0.028
=
.
a 21 a 22 0.204 0.216
If cRn and cTn denote the net track densities in the low and high air exchange rate
chambers, respectively, then the exposure to radon and thoron is calculated by the
following formulas:
E Rn = CF ⋅ (a11 ⋅ c Rn + a12 ⋅ cTn ),
ETn = CF ⋅ (a 21 ⋅ c Rn + a 22 ⋅ cTn ).
Thus, the uncertainties in the exposures can be calculated as follows:
D 2 ( E Rn ) = (a11 ⋅ c Rn + a12 ⋅ cTn ) 2 ⋅ D 2 (CF ) + CF 2 ⋅ ((a11 ) 2 ⋅ D 2 (c Rn ) +
+ (c Rn ) 2 ⋅ D 2 (a11 ) + (a12 ) 2 ⋅ D 2 (cTn ) + (cTn ) 2 ⋅ D 2 (a12 )),
D 2 ( ETn ) = (a 21 ⋅ c Rn + a 22 ⋅ cTn ) 2 ⋅ D 2 (CF ) + CF 2 ⋅ ((a 21 ) 2 ⋅ D 2 (c Rn ) +
+ (c Rn ) 2 ⋅ D 2 (a 21 ) + (a 22 ) 2 ⋅ D 2 (cTn ) + (cTn ) 2 ⋅ D 2 (a 22 ))
The D(cRn) and D(cTn) uncertainties can be calculated by exposing several detectors
(preferably a few tens of detectors) to the same exposure and then counting their track
densities several times (preferably 5-6 times). The standard deviation of these track
densities will, of course, depend on the exposure, so this calculation should be repeated
at different levels of exposure.
Chapter 5.
Advanced operation
© 2013 by Radosys Kft. All rights reserved
RADOSYS User Manual
File Ref. RS_Man82
Page
5-41
Revised at 7/8/2013
2. Example calculation
Let's suppose that the two Raduet detectors belong to the detector batch that has a
calibration factor of 43.63 kBqh/m3/(track/mm2) and the track density on the detector in
the low air exchange rate chamber is 10 track/mm2 and that in the high air exchange
rate chamber is 14 track/mm2. The usual uncertainties at these levels of track density
are about 0.7 track/mm2 and 0.8 track/mm2, respectively. Thus
- the radon exposure is 413 kBqh/m3,
- the thoron exposure is 511 kBqh/m3
and the uncertainty
- for the radon exposure is 63 kBqh/m3 (15%),
- for the thoron exposure is 200 kBqh/m3 (39%).
Chapter 5.
Advanced operation
© 2013 by Radosys Kft. All rights reserved
RADOSYS User Manual
File Ref. RS_Man82
Page
6-42
6 System Metrology Performance Information
{Relevant text to be inserted here}
Chapter 6.
System Metrology Performance Information
© 2013 by Radosys Kft. All rights reserved
Revised at 7/8/2013
RADOSYS User Manual
File Ref. RS_Man82
6.1
Page
6-43
LINEARITY
Chapter 6.
System Metrology Performance Information
© 2013 by Radosys Kft. All rights reserved
Revised at 7/8/2013
RADOSYS User Manual
File Ref. RS_Man82
6.2
Page
6-44
RADOSYS CR-39 QUALITY CONTROL STATISTICS DATA
Chapter 6.
System Metrology Performance Information
© 2013 by Radosys Kft. All rights reserved
Revised at 7/8/2013
RADOSYS User Manual
File Ref. RS_Man82
6.3
Page
6-45
ACCURACY AND IMPRECISION
Chapter 6.
System Metrology Performance Information
© 2013 by Radosys Kft. All rights reserved
Revised at 7/8/2013
RADOSYS User Manual
File Ref. RS_Man82
6.4
Page
6-46
Revised at 7/8/2013
THE QUALITY CONTROL SYSTEM OF THE RADOSYS MADE RADON DETECTOR PRODUCTS
6.4.1 INTRODUCTION
Any commercial product needs a well-established quality control.
Our radon detector products are also manufactured according to a well-defined quality
control procedure.
Our company always, since the birth of the Radosys product line, paid particular
attention to the quality of the products. Especially on the area of the manufactured radon
detectors, we were always focusing our efforts on to provide the best quality detectors
for our dear customers. A well-defined quality control has been applied at the
manufacturing our detector products since the beginning.
Today our radon detectors are manufactured with big quantity and continuously. This
condition of regular manufacturing makes us possible to fix our quality control procedure
in long term sense. This also means that now we are in the position that we can publish
the details about our quality control system.
The purpose of this document is to share this information with our dear customers in
order to enhance our technical support for our products.
By publishing this document, also information about the existing quality control
procedure is provided, as well as further plans of the near future is included.
6.4.2 QUALITY CONTROL OF THE MANUFACTURED CR-39 DETECTOR CHIPS
The Quality Control is conducted in two main steps.
6.4.2.1.1 Quality inspection on the dimension and surface quality of the manufactured chips.
Each sheet of detector chips is inspected according to the next rule.
Surface quality: Any chip having scratch or damage on its surface is removed and
rejected. This aspect is considered in order to ensure the best operation and accuracy of
the track analysis software.
Chip dimension: The width of the chips is inspected. The criteria of acceptance is a
width from 0.95 mm to 1.10 mm. Any sheet which does not meet this criteria is
discarded and rejected. This sorting procedure ensures the matching condition to size of
the holder frame, which is applied during the etching/analysis process.
6.4.2.1.2 Quality control on the application related physical characteristics of the manufactured
chips.
The CR-39 chips that provide the quality inspection data are selected by a systematic
way to be a true representative of the production series.
The next system is applied.
Today the single size of the Radosys production CR-39 sheet is 45 chips. Five CR-39
chips of 45 are removed for quality inspection purpose by means of a definite selection
map. The selection map is fixed providing a homogenous sample distribution along the
entire area of the production sheet. This is not a random selection, but a systematic way,
Chapter 6.
System Metrology Performance Information
© 2013 by Radosys Kft. All rights reserved
RADOSYS User Manual
File Ref. RS_Man82
Page
6-47
Revised at 7/8/2013
in order to eliminate any arbitrary decision by the production workmanship. But this
selection system may provide a homogenous sampling of the production sheets.
These five removed Q.C. chips are used for the next purpose.
- Three of them are developed and evaluated for the determination of the background
value. This means around 7% sampling rate. Any sheet providing a background value
exceeds 0.5 tracks per mm2 at any control chip of the three, that sheet is discarded and
rejected.
- A part of them is exposed for sensitivity calibration by systematic 0.7% sampling rate.
Standard RSFS type detectors are manufactured by means of these control chips. The
detectors are exposed in a radon calibration chamber with governmental accreditation.
After return these detectors are etched and analyzed in our lab. This provides a CF
[Calibration Factor], which value is characteristic for the whole batch of detector chips.
The typical size of a production batch is 20000.
- The remainder of the control chips is preserved for archiving, for any future
countercheck purpose.
6.4.2.1.3 Description about the QCS information files
In order to enhance our technical support service at our radon test products, the QCS
[Quality Control Sheet] system has been introduced.
This means that quality test data for each delivered Radosys radon test product series is
supplied. This data is provided in printed media format or in suitable electronic format,
floppy disk, CD, or data file by email. (See Note 1.)
The next information is included in the Quality Control Sheet, QCS:
--- Statistics about the background test. Average value and SD%, also the applied
quantity of the Q.C. sample expressed in percentage.
--- Information about the lot of the CR-39 plastic molding. Month of date of the molding,
with indication about the ID code range of detectors belonging to the same plastic
molding event. This range of detector chips comprises a production batch.
--- Sensitivity data and Calibration factor and statistics about, which data is characteristic
for the whole production batch. Average value and SD%, also the size of the Q.C.
sample expressed in percentage.
--- The QCS file are provided in two steps, as follows.
--- Step 1. The delivery-time-version includes the data about the background test. Also a
typical average value of the Calibration Factor is included.
--- Step 2. The completed version is issued within three month from the date of delivery
of the detector package. An exact calibration factor is included in the final version of the
QCS.
Note 1. From November, 2006 we introduce a full automatism for calibration data
settings. This means that the calibration chart will be available at our web site in file
format, which file will be processed by the Radosys system as a software upgrade, or
on-line for Radosys computers with internet access.
Chapter 6.
System Metrology Performance Information
© 2013 by Radosys Kft. All rights reserved
RADOSYS User Manual
File Ref. RS_Man82
Page
6-48
Revised at 7/8/2013
6.4.2.1.4 Sample of QCS [Quality Control Sheet] file
Quality Control Sheet
for Radosys brand radon detector products
QCS File Reference
Shipment Code
Customer Code
Date of Shipment
QCS Issue Date
QCS Revision Information
QCS Revision Date
Revised by
QCS_C32_051213
E8505
CC32/CC10
13/12/2005
21/12/2005
Preliminary QCS – Standard CF Reported
EH
ID Code Range
From
To
G86430
G87554
BID
S051017
Mean
SD
QSR
0.10
0.08
2
TR / mm2
TR / mm2
%
Mean
SD
QSR
0.02249
0.00125
0.1
TR m3 / kBq h mm2
TR m3 / kBq h mm2
%
CF-RSF
DMU Factor RSF
CF-RSE
DMU Factor RSE
44.47
1853
37.04
1544
Batch Info
BG Test
SEN Test
Conversion Factors
Explanation on the applied terminology
BID – Batch ID Of Plastic Mold Event at Manufacturing the CR-39 material
Mean - Mean value of Quality Control chips, that were included in the test
SD - Standard Deviation of Quality Control chips, that were included in the test
QSR - Sampling Rate of Quality Control Chips, that applied at the test
BG - BackGround. Initial track density at the time of manufacturing
TR - Number of Tracks
SEN - Sensitivity - Test condition: Exposure was carried out with RSF type diffusion
chamber
CFRSF –Multiply Track Density [tr/mm2] by CFRSF to get Exposure [kBqh/m3] at RSF
chamber
Chapter 6.
System Metrology Performance Information
© 2013 by Radosys Kft. All rights reserved
RADOSYS User Manual
File Ref. RS_Man82
Page
6-49
Revised at 7/8/2013
DMU Factor RSF– Enter this value in the DMU to get calibrated RAC data at RSF
chamber
CFRSE –Multiply Track Density [tr/mm2] by CFRSE to get Exposure [kBqh/m3] at RSE
chamber
DMU Factor RSE– Enter this value in the DMU to get calibrated RAC data at RSE
chamber
Chapter 6.
System Metrology Performance Information
© 2013 by Radosys Kft. All rights reserved
RADOSYS User Manual
File Ref. RS_Man82
Page
7-50
Revised at 7/8/2013
7 Radosys System Engineering Details
7.1
RADOSYS CR-39 CHIP STRUCTURE
The coordinate system of the chip scanning operation. This information is useful
at Manual Control Mode or at general track research applications.
Chapter 7.
Radosys System Engineering Details
© 2013 by Radosys Kft. All rights reserved
RADOSYS User Manual
File Ref. RS_Man82
Page
7-51
Revised at 7/8/2013
Components of the Radosys detector CR-39 chip.
7.2 RADOSYS RADON DETECTORS
Selected explanatory texts for the physics and engineering operation of the Radosys
detectors, as well as for their characteristics are collected together in this chapter.
7.2.1 GENERAL OVERVIEW ON RADOSYS RADON DETECTOR’S PRINCIPLE OF OPERATION
All types of Radosys radon detectors consist of the following components:
- Diffusion Chamber
- PADC/CR-39 chip
- Radon-proof foil pouch
- ID labels and logo labels
At certain models additional components may exist, which are specific for the given
application.
Regardless of the actual type of the detector, the core components are the diffusion
chamber and the PADC/CR-39 chip. From point of view for the principle of operation,
these components, and their performance, are the most decisive for the operation of the
detector. All the other components can be considered just added extras, providing useful
features for a test service operation or for a specific application area.
However, of course, at certain special Radosys detector are based on extra, nonconventional scientific approaches, which are dedicated for specific area of applications.
Chapter 7.
Radosys System Engineering Details
© 2013 by Radosys Kft. All rights reserved
RADOSYS User Manual
File Ref. RS_Man82
Page
7-52
Revised at 7/8/2013
But for all that specific types the fundamental core elements are the diffusion chamber
and the PADC chip, as well.
In this chapter the basic principle of operation is demonstrated by means of the RSKS
type radon detector. This explanation is focused on the principle of operation mainly
from scientific points of views.
The Radosys RSKS radon detector follows a conventional principle of operation, which
principle has been already described in many scientific papers since mid 80’s, and even
practical devices on the field have been utilized for ten/fifteen years. Therefore the
principle of operation is far not new and the strength of the Radosys detectors is not the
principle itself, but the enhancements achieved by means of their distinguishing
structure, production technology, quality control, metrology performance and related
services.
The radon detector consists of a diffusion chamber and a PADC chip inside.
The PADC chip is a specific plastic piece, which is sensitive for alpha particles; the latter
comes from decaying of the radon gas. The role of the diffusion chamber is that only
those radon decays contribute to the measurement result, that occur inside the
chamber. This principle makes the whole structure applicable for definite, traceable and
reproducible measurements from metrology point of views.
The inner structure and components of the RSKS type radon detector
7.2.2 ABOUT THE AIR-GAP OF THE DIFFUSION CHAMBER. PRINCIPLE OF OPERATION.
The diffusion chamber consists of pot and lid sections. These are matching plastics
parts. However like at all kind of matching plastics parts, this matching is not perfect and
there is a very narrow gap between the pot and lid. The size of this mismatch is in the
range of ten micrometers. The radon gas diffuses inside through this gap, while its path
Chapter 7.
Radosys System Engineering Details
© 2013 by Radosys Kft. All rights reserved
RADOSYS User Manual
File Ref. RS_Man82
Page
7-53
Revised at 7/8/2013
in the gap is much longer than the width of the gap, which is an important character of
this air-gap principle.
The radon is noble gas, it is completely neutral, and it does not take part in any chemical
reaction or surface-physics interaction. Its movement is driven by pure diffusion process.
The size of the radon atom is in the range of 10-4 micrometer. When this size is
compared to the size of the air-gap, the 10 micrometer, it is understandable that the
radon gas is able to diffuse into the diffusion chamber effectively.
The radon gas is radioactive element and its radioactive decay results in daughter
elements, which are also radioactive. Some of them also produces alpha particle, which
is able to create tracks on the sensor, the PADC chip. The character of the daughter
elements is quite different than of the radon atom. These are chemically reactive
elements and take part in many chemical and surface-physics interactions. As they are
born they are deposited to aerosol or dust particles in the air, so the aerosols carry the
daughter elements afterwards. The aerosol particles tend to be deposited to solid
surfaces, like the wall of the diffusion chamber.
The typical size of the aerosols is in the range of 0.1 micrometers. When the aerosol
enters the air-gap of the diffusion chamber, it migrates through a long but narrow
channel. During its route it gets deposited to the wall with high probability. Consequently
the air-gap acts as a barrier for aerosol particles and for the radon daughter elements as
well.
All these means that the air-gap of the diffusion chamber filters out the external decay
components of the radon gas, while the gap is transparent for the radon gas. Only those
alpha particles are registered by the PADC sensor, which are born inside the diffusion
chamber. So the point is that the radon detector works with a definite time stamp. Only
those radon decays contribute to the tracks created on the sensor, which occurred after
placing the detector to the site to be tested.
Chapter 7.
Radosys System Engineering Details
© 2013 by Radosys Kft. All rights reserved
RADOSYS User Manual
File Ref. RS_Man82
Page
7-54
Revised at 7/8/2013
The diffusion path of radon into RSKS type radon detector
7.2.3 ABOUT THE MATERIAL OF THE DIFFUSION CHAMBER.
The diffusion chamber is made of conductive plastics. This enhances the homogeneity
of the track density on the detector chip.
The geometry of the diffusion chamber is cylindrical. The detector chip takes place on
the axe of this cylinder and its surface is perpendicular to this axe. The entry point of the
radon, the air-gap is also symmetrical to this axe. Consequently, the whole structure
shows cylindrical symmetry. This ensures that the track density on the detector surface
is homogeneous. Without homogeneous track distribution the imprecision of the track
counting would be very wrong. Therefore any effect, which is able to reduce the desired
homogeneity, has to be avoided.
Electric surface charge on the wall of the diffusion chamber is one sort of these
unwanted effects.
- When the radon gas decays in the diffusion chamber, the resulted alpha particles are
charged particles and normally the travel trajectory distribution is symmetrical. At
presence of any surface charge on the wall causes distortion in this symmetry.
- Decay of the radon gas produces also daughter elements, which are radioactive, too;
and some of them are alpha particle emitters, too. The daughter elements, with
assistance of aerosols in the air, are depositing to the inner wall of the diffusion
chamber. This is the so called “plate-out” effect. Emitting alpha particles they contribute
to the track density on the detector chip. Consequently, it is desired that their distribution
on the wall be homogeneous as well. At presence of any surface charge on the wall
causes distortion in this symmetry.
Formation of electric surface charge on the inner wall of the diffusion chamber may
occur if the material of the chamber is insulator. With some rare exceptions the technical
Chapter 7.
Radosys System Engineering Details
© 2013 by Radosys Kft. All rights reserved
RADOSYS User Manual
File Ref. RS_Man82
Page
7-55
Revised at 7/8/2013
plastics are perfect insulators. But a few, special composite plastics types contain
conductive additives, which formulation gives electrically conductive character.
The Radosys diffusion chambers are made of conductive composite plastics. This
material selection eliminates the risk of formation of surface charges on the inner wall of
the chamber. The lack of potential surface charge formation on the wall keeps the
overall symmetry of the whole structure and of its physical operation.
The detector material, the PADC chip, is insulator. However if any electric charge is
formed on its surface, at the time of assembling the detector, this charge is conducted
away through the water contents in the air towards the conductive chamber rapidly.
7.2.4 ADDITIONAL INFORMATION
<Text for the engineering details chapter:>
RSKS type detectors:
Shelf life is 6 months. It lasts even much longer, however quality tests have been made
for this length of time.
Background tests. Figure.
Sensitivity variation in time, which depends on the temperature during storage.
Repeated calibration is recommended after six months.
Text for the engineering details chapter:
Bar code
ID codes identical on the pouch, on the top section of the canister and on the PADC
chip.
7.3
RADOSYS MICROSCOPE OPTICS OVERVIEW
The microscope operates on the principle of trans-illumination. Below the detector card
the light source is an LED with a wavelength of approximately 465 nm. Illumination
follows the Köhler principle, with the path of the beam as illustrated by the next figure.
The object, that is the detector is in the focal plane of the illumination condenser.
Chapter 7.
Radosys System Engineering Details
© 2013 by Radosys Kft. All rights reserved
RADOSYS User Manual
File Ref. RS_Man82
Page
7-56
Revised at 7/8/2013
A Wetzlar Will microscope objective of 40x magnification is placed above the detector so
that the object falls between the first and second focal planes. Its aperture angle (α) is
not fully utilized by the aperture angle of the condenser (β), where β<α, so that the
appropriate contrast effect may be achieved.
In order to the detector can be examined in images of two different magnifications, the
light is divided using a beam splitting prism system. The image that proceeds straight
through the beam splitter is reflected by a mirror into the upper camera. The size of the
camera chip is 8.8 x 6.6 mm, and magnification is 40x, so the area viewed is 0.22 x 0.16
mm. In order to shorten the route of the light, a condenser is placed in the path of the
light which leaves the beam splitter sideways, so that a magnification one-third of the
original magnification is received. Therefore the total area viewed is 0.65 x 0.48 mm.
7.4
RADOSYS MICROSCOPE MECHANICS OVERVIEW
7.4.1 MECHANICAL ARCHITECTURE
The Microscope Unit consists of the following main units:
the upper cover, which consists of a collar and a transparent plexiglass bulb;
the base, which includes the motor board and the microscope
The microscope consists of two, structurally distinct parts: the lower part and the upper
part. (Functionally, this distinction does not hold.) The upper part is held to the lower part
by three screws, and loosening these screws allows the upper part to be tipped toward
the right. Orientation pegs facilitate precise re-assembly.
The lower parts contains the illumination system, mechanisms for motion in the X and Y
directions and the detector-card holding tray. Within the unit there are three levels built
one on top of another.
Chapter 7.
Radosys System Engineering Details
© 2013 by Radosys Kft. All rights reserved
RADOSYS User Manual
File Ref. RS_Man82
Page
7-57
Revised at 7/8/2013
The lowest level is the base plate, on which the illumination optics, the stepping motor
moving the X table, the guide rails for the X table, and the gate covering the card
insertion slot are all mounted.
The second level is the X table, with the following units mounted on it: the stepping
motor moving the Y table, the roller opening the gate and the guide rails for the Y table.
The third level is the Y table. (The names of the tables are defined by the direction of
their motion.) This level is where the card holding frame is located.
The frame of the upper part is a welded tripod. The shaft that enables motion in the Z
direction is installed on the tripod, as well as the stepping motor that drives the shaft
through a worm-gear transmission, the card insertion motor, the electromagnets that
place the detector cards and the upper optical system of the optical unit.
The detectors to be analyzed are inserted into the Slide. The motion mechanisms are
responsible for getting the individual detectors under the objective, designating the
various examination points (motions in directions X and Y) and focusing the images
(motion in direction Z).
Front view of the Microscope without the upper cover.(V200X and RSV6 versions)
Chapter 7.
Radosys System Engineering Details
© 2013 by Radosys Kft. All rights reserved
RADOSYS User Manual
File Ref. RS_Man82
Page
7-58
Revised at 7/8/2013
Left view of the Microscope without the upper cover. (V200X and RSV6 versions)
7.4.2 MOVEMENTS
7.4.2.1.1 Card Insertion
When the instrument is in insertion position, the card may be placed manually in the
card holding tray. The signal coming from the optosensor that detects the presence of
the card activates the card insertion motor, which rotates a cogwheel to engage teeth
located along the edge of the card, taking the card and inserting it in the instrument.
7.4.2.1.2 Placement
The card insertion motor itself cannot fix the card to the tray. The rods of the
electromagnets installed on the tripod are responsible for further placement within the
card holder tray. While the tray moves, the rod of the activated electromagnet prevents
the card from any unexpected displacement. Therefore the card is fixed to the tray
firmly, and the card moves together with the tray exactly.
7.4.2.1.3 Positioning
During the operation, the card is moved within its optically relevant area. This is done by
remote controlling the motion of the card holding tray along the X as well as the Y
directions independently. Motion is executed by stepping motors, which make 500
steps/revolution. By means of a flexible gear coupling, the motor drives a lead screw
bearing two intertwined threads with a slope of 2 mm. Thus the movement produced by
each step of the motor is 4 µm.
The X and Y tables are driven by a rigidly fastened nut, welded to them by flexible
deformation. The Y shaft has one bearing, while the longer X shaft has two bearings.
Chapter 7.
Radosys System Engineering Details
© 2013 by Radosys Kft. All rights reserved
RADOSYS User Manual
File Ref. RS_Man82
Page
7-59
Revised at 7/8/2013
Each table rolls on a set of cylindrical guide rails. Each rail has two pairs of bearing
casings with 3 bearings rolling on one side and, in order to avoid over-definition, 2
bearings rolling on the other side of each. One bearing in each casing is placed on an
eccentric axis to allow adjustment for smooth, precise operation. Table motion is limited
by opto-sensor tabs, which prevent the rollers from running up against the rail supports.
7.4.2.1.4 Focusing the Microscope Objective
Focusing is achieved by moving the card vertically, rather than the objective, in the
following manner.
The objective of the microscope, together with the upper optical unit, is fixed. The
detector-card holding tray is flexibly supported in the Z direction on a glass plate that can
move in the Z direction. Motion is executed by a stepping motor with a precision of 500
steps/revolution, with a gear shaft fastened to its axle. The shaft-to-worm-gear ratio is
1:42.5. The lead screw revolving together with the worm-gear has a slope of 1 mm. Thus
the movement produced by each step of the motor is 0.05 µm. The glass plate moves in
the Z direction and, as a result of the flexible mounting, the card holding tray and
consequently the detector move up and down along with it. Through this procedure the
microscope can produce a focused picture anywhere within the range where the surface
of the detector expected to be. Any extreme position are limited by optosensor tabs, and
the entire range of the movement is approximately 0.7 mm.
7.5
RADOSYS MICROSCOPE CONTROL OVERVIEW (RADOSYS 200X VERSIONS)
7.5.1 CONTROL BOARDS
The entire operation of the Microscope is controlled by the Radosys Computer Unit.
Therefore no any manual action is needed for the hardware operation of the Microscope,
except the insertion and removal of the detector holder card.
However to be prepared for any unexpected specific event, some degree of manual
interaction with the hardware of the Microscope is permitted and the related hw facility is
available inside the Microscope. Such unexpected specific event may occur at any
unlikely malfunction or at improper operation of the Microscope.
IMPORTANT NOTE. Any manual adjustment at the inner section of the Microscope,
without a preliminary authorization by the manufacturer will discard the warranty option.
Please do contact the manufacturer or the local vendor before you open the cover of the
Microscope unit.
Each electrically operated component inside the Microscope has a more or less
separated circuit board, designated for the lowest level hardware tasks. Therefore each
of this components can be considered being independent peripheral devices. There is
an auxiliary function of this peripherals, beyond the main function of interfacing between
the central control unit and the mechanical tasks, that is the deepest level supervising
over the corresponding specific job. This concept is intended to be ensured that any
unwanted mechanical operation may be blocked at the deepest level of the hardware in
order to protect the mechanical/hardware components from fatal damages. This
protection is accomplished with a series of opto-electric sensors by means of a wired
protection logic.
Chapter 7.
Radosys System Engineering Details
© 2013 by Radosys Kft. All rights reserved
RADOSYS User Manual
File Ref. RS_Man82
Page
7-60
Revised at 7/8/2013
For example, a wired logic circuit of an opto-gate sensor blocks the power of the stepper
motor whenever the related motion gets out of the normal and permitted range.
Should a mechanical action was blocked by a peripheral device, so indicating a
mechanical failure, the remote Computer will stop its operation and an error message
with error code will be displayed.
In order to provide the opportunity of visual inspection, each periphery and/or basic
mechanical function is furnished with an indicator LED device for the visualization of its
error status. If the corresponding LED is on, the related function will operate correctly.
However if a LED is off, a mechanical function or a group of them will be blocked by a
wired protection circuit.
Two groups of indicator LED devices are reported here. Since this are the most
important in the practice of the user, in the sense of that the related kind of hardware
failure likely might be repaired by the user himself easily, without any assistance by the
manufacturer.
7.5.2 OPERATION STATUS INDICATORS (RADOSYS 200X VERSIONS)
7.5.2.1.1 The main error indicator on the motor-board of the Microscope unit
Whenever any peripheral error occurs in the Microscope unit, the LEDM1 is on and
is flashing. At normal operation this LED is off
7.5.2.1.2 Group of LED indicators related to X/Y motion
Chapter 7.
Radosys System Engineering Details
© 2013 by Radosys Kft. All rights reserved
RADOSYS User Manual
File Ref. RS_Man82
Page
7-61
Revised at 7/8/2013
Five LED indicators belong to the X-motion related operation. All of them are placed on
the same circuit board, forming a line of LED indicators. At normal operation of the Xmotion functions each of the five indicators are on.
Three LED indicators belong to the Y-motion related operation. All of them are placed on
the same circuit board, forming a line of LED indicators. At normal operation of the Ymotion functions each of the three indicators are on.
If any of this LED indicators was off, this would intend to indicate an error position at the
corresponding directional motion mechanism.
Should it happened that the indicators suggest improper operation, and the problem can
not be resolvable with the guidance of the Radosys Manual, please contact to the
manufacturer. This case please prepare a brief report about the status of each indicator
LEDs, in order to provide help for the most accurate interpretation about the source of
the problem.
Indicator LEDs related to the X-motion. The board is located close to the X-motor.
Please find a guide for the location of the X-motor at the image of the Left View of
the Microscope, shown above.
Chapter 7.
Radosys System Engineering Details
© 2013 by Radosys Kft. All rights reserved
RADOSYS User Manual
File Ref. RS_Man82
Page
7-62
Revised at 7/8/2013
Indicator LEDs related to the Y-motion. The board is located close to the Y-motor.
Please find a guide for the location of the Y-motor at the image of the Left View of
the Microscope, shown above.
7.6
THE SLIDE INSERT OPERATION
General description
After the etching process, one slide assembly contains max 12 detector chips. The same
slide assembly is used during the track analysis in the automated microscope. The slide
is inserted into the microscope and afterwards the movement is carried out by the
microscope mechanism automatically.
The mode of slide transport is different at the microscope Model RSV6 and
RSV60. The number of slides, that can be inserted at once for the analysis, this makes
the difference. At the RSV6 Model one slide can be inserted at once. At the RSV60
Model twenty slides can be inserted at once.
The slide transport mechanism is described here.
Slide transport operation at RSV6 Model
The insertion and removal of the slide looks like as of a credit card at a cash machine.
Both the insertion of the slide and its removal after the measurement happens at the
front face of the microscope, at the front slide slot.
- Slide insertion is requested by the software after invoking a user command to start the
measurement.
Chapter 7.
Radosys System Engineering Details
© 2013 by Radosys Kft. All rights reserved
RADOSYS User Manual
File Ref. RS_Man82
Page
7-63
Revised at 7/8/2013
- The microscope advances the slide tray ahead making its insertion slot visible for the
slide insertion.
- The slide is inserted into slide slot. The mechanism detects the presence of the slide
and pulls the slide inside.
- Afterward the microscope mechanism manages the movement of the slide assembly
inside automatically, without any manual interaction. The progress of the internal
movements is visualized in the Progress Window of the software.
- When the measurement completed, the mechanism advances the slide tray ahead,
making the slide slot visible together with the slide.
- The slide can be removed manually.
Slide transport operation at RSV60 Model
The insertion of the slides happens at the front face of the microscope. The removal of
the slide, after the measurement is automatic and it is dropped into a container at the
rear of the microscope. That is the completed slides are collected in a rear container
automatically, without manual interaction.
The RSV60 model was designed for big capacity operation with automatic processing 20
slides at once. But single slide operation is also available. These modes are selectable
alternatively by user commands.
The Slide Stack of the RSV60 Model Microscope
Mode of processing 20 slides at once
At this mode, the slide transport process comprises two distinguished steps.
Chapter 7.
Radosys System Engineering Details
© 2013 by Radosys Kft. All rights reserved
RADOSYS User Manual
File Ref. RS_Man82
Page
7-64
Revised at 7/8/2013
At the first step the max 20 slides are inserted into the microscope each by each, where
the mechanism arranges them into a stack. This step needs manual interaction, but just
insertion of the slides into the slide slot. Building up the stack of slides is made by the
mechanism automatically.
At the second step the stacked slides are removed from the stack each by each
and processed by the microscope mechanism automatically. The stacked slides are
processed by Last-In-First-Out logics.
- Slide insertion is requested by the software after invoking a user command to start the
measurement.
- The first slide is inserted into the front slide slot. The mechanism detects the presence
of the slide and pulls the slide inside.
- The slide is advanced into the slide stack automatically.
- The next slide is requested by the software. The next slide is inserted and advanced
into the stack by the mechanism automatically.
- The slide insertion process is repeated until the insertion of the slide number 20 or until
the user instructs the software to stop building the stack more.
- Afterward the microscope mechanism manages the movement of the slides inside
automatically, without any manual interaction. The progress of the internal movements is
visualized in the Progress Window of the software.
- Whenever the analysis of a slide accomplished, the slide is advanced by the
mechanism to the rear container automatically.
- When the slide stack gets empty and all the formerly stacked slides dropped into the
rear container, the process gets completed.
Mode of processing 1 slide at once
- Slide insertion is requested by the software after invoking a user command to start the
measurement.
- The slide is inserted into the front slide tray. The mechanism detects the presence of
the slide and pulls the slide inside.
- The slide is advanced to the position of analysis inside automatically. At the case of
single slide processing the slide stack is not utilized by the mechanism.
- Whenever the analysis of the slide accomplished, the slide is advanced by the
mechanism to the rear container automatically.
Chapter 7.
Radosys System Engineering Details
© 2013 by Radosys Kft. All rights reserved
RADOSYS User Manual
File Ref. RS_Man82
Page
7-65
Revised at 7/8/2013
7.7 RB4 ETCHING UNIT
Two regional subversions are available for the RB4 etching units.
- Units for 100V power standards, with USA/Japan power cord&plug.
- Units for 240V power standards, with EU Continental power cord&plug.
The performance of these regional subversions is fully identical, with one exception only.
The warming up time at the 240V version is much shorter, because of the greater power
rate of the heater component.
Typical Warming-Up characteristics of the 240V version RB4 unit.
Chapter 7.
Radosys System Engineering Details
© 2013 by Radosys Kft. All rights reserved
RADOSYS User Manual
File Ref. RS_Man82
7.8
Page
7-66
Revised at 7/8/2013
RADOSYS SOFTWARE RELATED ENGINEERING DETAILS
7.8.1 MENU CHART OF THE RM VERSION SOFTWARE (RSV6 MODEL)
7.8.2 INFORMATION ABOUT THE RADOSYS TRACK COUNTING CONCEPT
7.8.2.1 General information and also about the scientific background
There are two Radosys’s product lines today, where the Radosys Etched Track Reader
system is utilized.
RADOMETER product line, which is dedicated to medium/big size radon surveys.
N-DOSYS product line, which is dedicated to individual neutron dosimetry.
At equipments, units and accessories there is a big similarity, but at certain units, the
difference is significant, since these product lines belong to different application areas.
However at the level of general overview, the common part of the operation can be
discussed without disturbing the clarity of understanding. These common details are
overviewed below, nevertheless whenever is necessary the differences are noted.
7.8.2.2 Main Units and Components
Automated microscope and control computer, [for instance, version RS-V6 as the latest
version to date of January 2006]
Chapter 7.
Radosys System Engineering Details
© 2013 by Radosys Kft. All rights reserved
RADOSYS User Manual
File Ref. RS_Man82
Page
7-67
Revised at 7/8/2013
Track development, Etching Unit, [for instance, version RB4 as the latest version to date
of January 2006]
LINUX Operational System, which hosts the application software and the hardware
interface to the microscope
Application specific components:
Radometer application:
RS-RM type application software, track recognition software, version V1.3
Radon detectors, various types
N-Dosys application
RS-TA type application software, track recognition software, version V1.4
Pre-Treatment unit, [for instance, version PRV6 as the latest version to date of January
2006]
N-Dosys type personal neutron dosimeters
7.8.2.3 The principle of the Statistically Stable Track Reading Approach
7.8.2.3.1 Historical overview
In the history of the solid state nuclear track detectors, SSNTD, at the pioneer ages, the
nuclear tracks were counted by means of common, manually operated laboratory
microscopes. The microscopic objects were evaluated and counted visually. After a time
of practicing the observing person learnt how to qualify an object being a nuclear track.
Trying to achieve the best accuracy and safety, virtually all track-like objects were
qualified as nuclear tracks. Because of the nature of this kind of visual track reading, the
counted number of tracks might vary from person to person, also from time to time at the
same detector. The achieved accuracy was satisfying for basic research, but from point
of view of metrology’s requirements this way could not meet the overall demands at
nuclear dosimetry, or at least the achievable accuracy and repeatability were limited.
The introduction of the commercially available automated track reader systems, at late
80’s, started a new age at the routine application of SSNTD. The automatism itself
naturally increased the throughput, so it made possible fast processing even many
thousands
of
detectors.
At the same time the automatism brought also other advance, that the track recognition
got a definite character. An automated track reader system recognizes a track by a set
of criteria, which makes definite decision about each microscopic object, if this could be
qualified as a track. This feature enhances the repeatability, and consequently, also the
accuracy
of
track
counting.
Up to this point all the automated track reader systems work with similar approach. But
in the practice, there are many differences among the existing systems at their
performance.
A typical track reader system recognizes the tracks in one step and uses fixed set of
criteria at recognition. This approach attempts to recognize virtually all tracks with a
Chapter 7.
Radosys System Engineering Details
© 2013 by Radosys Kft. All rights reserved
RADOSYS User Manual
File Ref. RS_Man82
Page
7-68
Revised at 7/8/2013
recognition threshold being as low as it was possible. By other words, this approach tries
to reconstruct the visual method but on automatic, by-machine platform. This approach,
mistakenly, intends to gather as many tracks as possible, using minimized tolerance, in
order to achieve the maximum accuracy. But this concept is based on improper
presumption that the accuracy is increasing by decreasing the recognition threshold. In
the reality, at the region of lower recognition thresholds, the quality of the track’s image
is so bad that their contribution rather makes the standard deviation worse, so it does
not
improve
the
accuracy
at
all.
On the other hand, at a typical track reader system, the speed of track counting is
determined simply by the time, which is needed to deal with all the microscopic objects,
and consequently without any chance to optimize the process by the user.
7.8.2.3.2 The Radosys’s concept of track recognition technology
The Radosys’s track counting technology is based on the observation that a portion of
tracks provide uncertain quality of microscopic images, and that these tracks do not
contribute to the accuracy beneficially. These tracks can be ignored, and this ignorance
may even enhance the accuracy, moreover also the process speed is much faster.
A typical representative of the “uncertain” tracks appears with poor image contrast or its
size
takes
place
at
the
tail
of
the
size
distribution
diagram.
The Radosys’s track reader algorithms were developed in light of realizing those
important observations. It was deducted that the statistical stability of track counting was
more important than to count all the tracks. In other words, the repeatability performance
at the counted track density is more important than to deal with each potential track
image. It is important to emphasize that the ratio of the ignored track-like objects is just a
small portion, say 10%. But this small portion is able to influence on the achieved
imprecision,
standard
deviation,
significantly.
The legality of this approach is understood better when the importance of the calibration
is
considered.
The calibration factor establishes definite relationship between the counted track density
and the physical value to be measured, for instance equivalent dose or radon activity
concentration.
Any dosimeter application should be accompanied with a proper system calibration.
Actually, the characteristics and performance of the calibration work is decisive at
qualification of a dosimeter system, regardless of what kind of details have led to the
good
performance.
The calibration factor is a combination of various contributing factors, related to the
structure of the dosimeter, also the etching process and also the track counting
algorithm. These individual contributions can not be separated in the practice and only
the overall calibration factor can be determined. Therefore the way of the track
recognition is just one of the contributing factors. This is the main reason that
The Radosys’s track reader concept votes the technology of optimized recognition
threshold,
contrary
to
that
of
the
minimized
fixed
threshold.
Chapter 7.
Radosys System Engineering Details
© 2013 by Radosys Kft. All rights reserved
RADOSYS User Manual
File Ref. RS_Man82
Page
7-69
Revised at 7/8/2013
This concept is equipped with the following features:
The recognition threshold is set to a reasonable level, in order to avoid contribution from
those tracks, which perform uncertain quality of microscopic image.
The track recognition is carried out by two-steps process, where the
“unwanted/uncertain” tracks are filtered out by the lower level of the image processing
algorithm.
EPS to adjust the threshold by the user
Possibility for optimizing speed and accuracy
Main target principle: Recognition of all tracks is not necessary. The statistical stability of
track counting is more important than to count all the tracks. Repeatability performance
at the counted track density is more important than to deal with each potential track
image. The ratio between the counted and the uncounted tracks should be stable
statistically; this is the proper requirement. This ratio can be considered, involved in the
calibration process.
This concept is able to provide a very good throughput for routine analysis.
RM and TA software versions are different. The way of prefiltering are different. At RM
circular arcs are fitted by the low level image processing algorithm.
Autofocus operation by software.
7.8.2.3.3 The concept of Detector’s Batch Processing
- One of the key components of the system is the inexpensive, disposable holder card,
“slide”, which is used during both the development process and the track analysis. The
detector chips are inserted into slides after the exposure and they remains in the slide
permanently, so even after the completion of the whole process. Therefore this concept
also supports archiving the detectors. The analysis can be repeated on the archived
detectors later again.
7.8.2.3.4 The N-DOSYS’s unique track enhancement technique for neutron detection
A Radosys’s propriety technology is used for fast neutron detection.
The essence of this technology is that the latent tracks are made more visible and/or
enlarged by pre-treatment in carbon-dioxide. The pre-treatment is a requirement before
the
main
etching
step
by
sodium-hydroxide.
For details about the scientific details of the pre-treatment technique please refer to an
article,
as
follows:
Hulber, E. and Selmeczi, D. ‘Counting recoil proton tracks on PADC without pre-etching
step ..’, in Radiation Measurements, Vol. 40/2-6 pp. 616-619.
Chapter 7.
Radosys System Engineering Details
© 2013 by Radosys Kft. All rights reserved
RADOSYS User Manual
File Ref. RS_Man82
7.9
Page
7-70
Revised at 7/8/2013
CALIBRATION CONCEPTS
7.9.1 GENERAL INFORMATION
7.9.2 INTERPRETATION OF TERMS (DMU-V99 VERSION)
Interpretation of terms for the calculation of the calibration factor of the Radosys
The relationship between the counted track density and the physical values is
interpreted by the next equation.
D = ∫ sR (t )dt
Where
D= track density [mm-2]
s= sensitivity [(kBqhm-3)-1mm-2]
R= Radon Activity Concentration (RAC) [Bq/m-3]
The factory default value of the overall sensitivity of the Radosys is
S= 2.588*10-2 (kBqhm-3)-1mm-2
The contribution by the next factors are comprised in this value primarily:
Alpha registration sensitivity of the CR-39 chip
Characteristics of the Radopot diffusion chamber
Track recognition characteristics of the Radosys 2000 software
The DMU data analysis sw unit of the Radosys 2000 counts the time of the exposure in
days. Day is the input data for the length of exposure. Therefore the recalculated form of
the equation may be more useful in the practice:
D [mm-2]= 6.21*10-2*R[Bq/m-3]*T[day]
When the DMU calculates the RAC value from the counted track density, the inverse
function is applied. Actually, the next type of calibration equation is displayed in the
Calibration Set menu of the DMU.
RAC=A*Density+B
At the “factory” default calibration set the value B=0.
The value A is the inverse of the factor in the previous equation for D.
A=1610=(6.21*10-2)-1
Dimensions:
Chapter 7.
Radosys System Engineering Details
© 2013 by Radosys Kft. All rights reserved
RADOSYS User Manual
File Ref. RS_Man82
Page
7-71
RAC=[Bq/m-3]
A=[Bq/m-3mm2]
7.9.3 CALIBRATION DATA EXCHANGE AT DMU-V6R VERSION
Chapter 7.
Radosys System Engineering Details
© 2013 by Radosys Kft. All rights reserved
Revised at 7/8/2013
RADOSYS User Manual
File Ref. RS_Man82
Page
7-72
Revised at 7/8/2013
7.10 SCIENTIFIC BACKGROUND OF THE N-DOSYS NEUTRON DOSIMETER APPLICATION
The scientific background and principle of this application is introduced by a slide
presentation here.
The content of this chapter have been removed from RS_Man63, because of its large
file size. At printed or PDF version of this Manual this chapter is attached to the end of
this document.
Chapter 7.
Radosys System Engineering Details
© 2013 by Radosys Kft. All rights reserved
RADOSYS User Manual
File Ref. RS_Man82
7.11 ESTIMATION
Page
7-73
OF UNCERTAINTY OF RADON
DETECTORS – THEORETICAL APPROACH
Revised at 7/8/2013
MEASUREMENTS
WITH
ALPHA
TRACK
Exposure (E) is calculated using the following formula:
where CF and k are the two calibration factors (slope and exponent) calculated by the
DMU software, D is the measured track density, BG is the background track density, A is
the average track area on the detector and A0 is the offset parameter associated with
track area, with which we can also influence the weight (significance) of the track area
correction. The logic behind this correction is explained below.
In the automatic track counting process only those tracks are counted that fall
within a certain size range.
If the average track size is bigger than normal then some smaller tracks, which
would normally be excluded from the track counting process, may fall within this
size range and therefore will be counted.
If the average track size is smaller than normal then some tracks, which would
normally be counted by the microscope, may fall out of the above size range and
therefore will not be counted.
The upper limit of the accepted size range is set so that it does not affect the
track counting process in case of slight variations in the average track size.
A− A0 ) serves as a correction for this
The denominator in the above formula (√
phenomenon (the factor 16 was chosen so that the corrected track density falls into the
same order of magnitude as the original track density).
According to the propagation of uncertainty, the uncertainty of exposure is estimated by
the following formula (standard deviation is denoted by the symbol D(.) ):
Here we assume that the parameters CF, D - BG, A and k are uncorrelated.
In order to write the term D2(D - BG) in a more explicit form, let's go step by step through
the process of track creation.
There is some radon concentration inside the diffusion chamber. (This is what we
want to determine.)
At the beginning of the measurement the track density on the detectors is not
zero, there is some background density. It has a little fluctuation, so the exact
background track density is a random variable.
Chapter 7.
Radosys System Engineering Details
© 2013 by Radosys Kft. All rights reserved
RADOSYS User Manual
File Ref. RS_Man82
Page
7-74
Revised at 7/8/2013
During the measurement some of the 222Rn atoms (and its progeny) will decay
and emit alpha particles. However, at a given activity the number of emitted alpha
particles cannot be determined precisely as radioactive decay is a statistical
process. So the number of emitted alpha particles is also a random variable.
The spatial distribution of the radon atoms within the diffusion chamber can vary
from chamber to chamber. The directional distribution of alpha particles is
supposed to be homogeneous but it also has an uncertainty. These two
parameters influence the number of alpha particles that can reach the detector
surface. Moreover, if the same number of alpha particles reach two different
detectors then the number of tracks (and the track density) produced on the
detectors will not be identical because their sensitivity is slightly different. So
given a certain number of decays (i.e. alpha particles), the resulting actual net
track density on the detector (which is a well defined quantity) is itself a random
variable.
Finally, we have to count the tracks on the detectors, which has some
uncertainty. So the counted number of tracks and hence the measured track
density is also a random variable.
Based on the above train of
thought, the track density can be
written as:
where
BG is the background track density
is the number of decays (i.e. alpha particles) within the diffusion chamber during
the measurement. It obviously depends on the exposure (the product of radon
concentration and duration of measurement).
is the ratio of the actual net track density produced on the detector and the
number of alpha particles emitted within the diffusion chamber during the
measurement. This ratio can be called the detector sensitivity.
is the measured track density minus the actual track density on the detector.
Thus, if the counting equipment works properly, the expectation value of
should be zero.
Therefore
Chapter 7.
Radosys System Engineering Details
© 2013 by Radosys Kft. All rights reserved
RADOSYS User Manual
File Ref. RS_Man82
Page
7-75
Revised at 7/8/2013
where n is the number of background measurements, from which we determined the
average background level to subtract.
Substituting equation (2) into equation (2) we get
Now let's calculate the above partial derivatives.
Substituting these formulas into equation (3) and deviding by E2 we get
Chapter 7.
Radosys System Engineering Details
© 2013 by Radosys Kft. All rights reserved
RADOSYS User Manual
File Ref. RS_Man82
Page
7-76
Revised at 7/8/2013
The first three terms (4) of the sum represent the uncertainty of the calibration, which is
governed mainly by the uncertainty of the exposure given to the detectors by the
calibration facility. The next term (5) represents the uncertainty of the background track
density. The next term (6) represents the uncertainty in sheet sensitivity. The next term
(7) represents the uncertainty due to counting statistics. The last term (8) represents the
uncertainty of the readout.
If we are only interested in the gross uncertainty (and not the different kinds of it) then
the following formula is more helpful:
Chapter 7.
Radosys System Engineering Details
© 2013 by Radosys Kft. All rights reserved
RADOSYS User Manual
File Ref. RS_Man82
Page
8-1
Revised at 7/8/2013
8 Installation
8.1 UNPACKING
The instrument is shipped in three packages. The Operator’s Manual is enclosed in the
box of the Microscope Unit box. It is essential to open this box first in order to read the
Operator’s Manual and to act accordingly.
Use a knife, a pair of scissors or a scalpel to open the boxes. Cut the tape only, leaving
the carton material intact. Do not attempt to open the boxes with blunt objects, and only
cut the seals where necessary. Remove, but do not discard, the packing materials from
the box. Then lift out the equipment. When lifting, hold the Microscope Unit and the
Electronics Unit under the rim of each unit’s base rather than by the upper covers. The
pieces lifted must be placed on their feet only. Open the sealed protective plastic foil and
take out the units. Do not forget to take the accessories, such as cables, tools and floppy
disks, out of the box. Account for all contents, comparing against the packing list.
Keep all insulating and packing materials in the boxes. Save them, in case the
instrument needs to be moved to another location or must be shipped to the
manufacturer for service. Never move the RadoSys without the proper boxes and
packing materials. If the original packing material from the manufacturer is lost or
damaged, order a new set from the distributor of the instrument.
In order to repack the RadoSys, follow the reverse order. Before repack, remember to
reinstall the plastic protective insert (see section Pre-Installation Procedures) in the slide
insertion slot of the Microscope Unit. Cover the equipment with the plastic foil, reinsert
the desiccant and seal the foil with self-adhesive tape. Place the units in their own
boxes, with their feet down, remembering to lift them from under their bases. Replace
the accessories in the box and add the packing materials. Seal the boxes with tape.
8.2
PRE-INSTALLATION PROCEDURES
The following step must be taken prior to installation, once the RadoSys Microscope Unit
has been unpacked and positioned in the place of its intended use.
Pull the plastic protective insert out of the slot on the bubble-like plastic cover.
Chapter 8.
© 2013 by Radosys Kft. All rights reserved
Installation
RADOSYS User Manual
File Ref. RS_Man82
Page
8-2
Revised at 7/8/2013
The Power Converters of the Microscope and of the Computer Unit must be connected
to the power network by a power cable matching to the local standards and with Ground
wire feature only.
8.3
INSTALLATION PROCEDURE OF THE MICROSCOPE AND THE COMPUTER UNITS (RSV6X)
8.3.1 INTRODUCTION
In this section the steps required to install the RadoSys are specified. Please follow the
instructions carefully, verifying that the cables are plugged in correctly and that the
mains voltage setting is correct.
8.3.2 MICROSCOPE AND CONTROL COMPUTER
- Place the Microscope and the Notebook computer to a desk. Interconnect the units by
USB cable. For the installation of the battery to the Notebook and interconnecting to
main power please refer to the Manual of the Notebook. Interconnect the Microscope to
the main power by means of the 24V Desktop Power Supply.
- Switch on the notebook control computer
- Power up the microscope. (For units delivered before April, 2006.)
- The microscope is powered up automatically. (At units after April, 2006.)
- When the login window is displayed, login to the system as follows:
User:
rm
Password:
rm
Now the system is ready to start the track analysis application software.
Warning.
Please consider that the password is case sensitive in Linux. The Linux distinguishes
capital and normal characters.
Note: At certain password entering fields, the typed characters may remain invisible.
Whenever this happened the password should be typed by blind way.
8.3.3 GENERAL COMPUTER RELATED INFORMATION
The Control Computer is HP-Compaq nx6110 type notebook. This computer was
purchased from a local retailer with English keyboard, without pre-installed OS, and with
one year worldwide guarantee. Before the delivery of the system, the computer was
removed from its original package and Linux OS and Radosys application software
items were installed to this. The rest of the Computer package left intact. The battery
was not used during the software installation, therefore this is intact and please refer to
the original, HP-Compaq’s instruction for the installation of the battery. The original,
nx6110 package was not dedicated for Linux operation, but for general usage. Therefore
Chapter 8.
© 2013 by Radosys Kft. All rights reserved
Installation
RADOSYS User Manual
File Ref. RS_Man82
Page
8-3
Revised at 7/8/2013
some accessory items, for example add-on cables or driver CDs enclosed may be useful
for Windows operation only.
8.3.4 COMPUTER CONFIGURATION SPECIFIC INFORMATION
- (Applicable for systems delivered without Double OS Configuration Option)
During the software installation the originally empty Hard Disk was partitioned mainly for
Linux OS operation. But optionally, for extension purpose by the user, an MS-DOS
partition was also added. If installation of Windows system was desired by the user, this
MS-DOS partition should be used for this purpose and all the other, Linux specific
partitions should be left intact. Whenever a Windows OS is installed to the computer and
the Windows setup program intended to reformat or repartition the Hard Disk, simply
response NO. Only those versions of Windows Setup programs are welcomed, which
provides definite information about that the existing partitions would be left intact. Never
use OEM type Windows installation CD for this purpose.
- (Applicable for systems delivered with Double OS Configuration Option)
When the system was delivered with both Linux and Windows XP Pro double
configuration, the Windows OS and the Linux OS are both available to start up
alternatively at the time of powering up the computer. An extra HD partition was
implemented for data exchange between Linux and Windows operation. This HD
partition is available, as a logical drive, to read and write under both OS.
Be careful at installation of any application software under Windows OS control and
install only that software, which comes from reliable software vendor. Especially avoid
any application software, which could change the structure of the HD partitions. The
integrity of the whole system is secured the best when Administrator level of operation is
avoided during Windows operation.
See also Warning 8.
8.3.5 WARNINGS
- When the interconnecting USB cable is disconnected between the Microscope and the
Computer, or when the connector is loosen, the connection is not recovered by the
system automatically, but an error message is displayed. At this case restart the XWindows subsystem of the Linux OS.
- For the USB interconnection between the Microscope and the Computer never use
USB HUB or similar router device. But use the unit’s own USB sockets directly in order
to secure the stability of the communication.
- The software system of the notebook type Control Computer is delivered in completed,
ready-to-use condition. Adding more application software or Windows OS is permitted,
but only with particular care. No any operation is permitted, which may modify harmfully
or destroy the installed Linux system or its HD partition structure. Only a professional,
Chapter 8.
© 2013 by Radosys Kft. All rights reserved
Installation
RADOSYS User Manual
File Ref. RS_Man82
Page
8-4
Revised at 7/8/2013
expertise computer technician is able to add alternative OS, for example Windows, to
the computer with safety and without effecting on the functionality of the original setup
risky. The supplier of the system, Radosys Ltd does not admit any responsibility if this
strict rule is failed or neglected in any respect.
- (Applicable for Microscope units delivered before April, 2006.) When the computer is
switched off, this does not switch off the power supply of the Microscope automatically.
The power supply of the Microscope should be switched off manually.
(All the Microscope units delivered after April, 2006, those were equipped with
automatically controlled power switching off feature.)
8.4 SOFTWARE UPGRADES
The software upgrades are supplied by email or by means of CD.
Please notice that the install procedure for RSV6X system versions is different.
8.4.1.1.1 Files on CD
Should the software upgrade received on CD, this CD provides an automatic
installation as follows.
- Start up the Radosys notebook type control computer and login as rm user as usually.
- Insert the CD to the drive of the computer.
- The computer starts up the CD automatically.
- The window “Suse Hardware Detection” is displayed and
- The query “Start the media script?” is displayed in the window.
- Click on the button OPEN.
- A text window is displayed with the request:
Please enter the root password below!
Enter the root password and press ENTER:
RMet2000
This is the root password of this Linux system. Please consider that the password is
case sensitive in Linux. The Linux distinguishes capital and normal characters.
Note: When the root password is entered, the typed characters are invisible.
- When the root password entered correctly, the next message is displayed
Installing Radosys Manual…
UPDATE xx
Press Enter to close this window.
8.4.1.1.2 Files by Email
Should the upgrade file received by email, this should be copied to a removable media,
to floppy disk or CD. To invoke the upgrade, insert the media to the Control Computer
and click on the Desktop icon Run_RadoSript. The Radometer software scans all the
Chapter 8.
© 2013 by Radosys Kft. All rights reserved
Installation
RADOSYS User Manual
File Ref. RS_Man82
Page
8-5
Revised at 7/8/2013
available removable storage devices searching for upgrade files and when one found
the upgrade installation is done automatically.
When the root password is requested by the Installation software, please enter:
RMet2000
This is the root password of this Linux system. Please consider that the password is
case sensitive in Linux. The Linux distinguishes capital and normal characters.
Note: When the root password is entered, the characters typed are invisible.
Chapter 8.
© 2013 by Radosys Kft. All rights reserved
Installation
RADOSYS User Manual
File Ref. RS_Man82
Page
8-6
Revised at 7/8/2013
8.5 INSTALLATION PROCEDURE OF THE RB4 ETCHING UNIT
- Place it to a plastic tray. Remove the packaging materials. Interconnect it to the main
power outlet.
- The next type of chemicals are needed for the etching process.
- 1000 g of crystalline sodium-hydroxide with Puriss-Anal quality for the etching bath.
Available at any fine-chemical dealer. The size of the granulates (pellets) can not
exceed the 10 mm. The size of the granulate is limited by the diameter of the filling
funnel.
- 4000 ml of finely distillated water for the etching bath. The puris-anal quality is not a
requirement, it does not worth to apply this expensive sort of chemical water. However
the application of the water produced by a real distillation machine is highly
recommended to achieve the optimal performance. The application of any industrial
quality purified water, that is ion-exchanged or reverse-osmotic purified water should be
avoided.
-Note: The RB4 Type Etching unit does not need external power adaptor accessory. The
whole unit operates by connecting it to the power network by means of its main power
cord.
8.6
INSTALLATION PROCEDURE OF THE RADOBATH 99 ETCHING UNIT
Remove any packaging material from the inner space of the bath container.
Place the main etching unit onto a laboratory tray. Usage of the tray is an important
safety requirement. The tray collects some of the overflowing volume of the bath
solution. Normally, any overflow of the fluid is unexpected, if the usage is carried out
properly. However some leakage of the fluid occurs at the time of opening the bath
cover after heating. This small amount of fluid leakage is created by vapor deposition
at the inner surface of the bath cover. Select the height of the tray as big that it could
catch one liter of fluid at least at the case of emergency overflow.
Connect the main power cord of the adapter into the wall socket. The motor power
circuit does not contain any power switch, therefore the motor starts its operation at
the time of the power connection instantly. It is convenient to use a multi-socket
electric power distributor with mains switch in order to switch the power on or off.
Connect the mains cord of the bath heater unit to the wall socket or to the multi-socket
power distributor.
Chapter 8.
© 2013 by Radosys Kft. All rights reserved
Installation
RADOSYS User Manual
File Ref. RS_Man82
Page
8-7
Revised at 7/8/2013
Connect the low-voltage plug of the
motor power adapter cord into the
socket at the rear of the bath cover
section.
Insert the silicon drain tube onto the
outlet of the drain tap.
The heater can be switched on by the
tumbler switch on the lower front
section of the equipment.
Chapter 8.
© 2013 by Radosys Kft. All rights reserved
Installation
RADOSYS User Manual
File Ref. RS_Man82
Page
9-1
Revised at 7/8/2013
9 Maintenance and Troubleshooting
9.1
KNOWN SOFTWARE BUGS OR OTHER MALFUNCTION, SEEMINGLY SOFTWARE BUG
9.1.1 IMAGE CAPTURE RELATED MALFUNCTIONS
At normal start-up of the system, the main microscope image window is gray. If this was
black this might indicate malfunction of the image capture subsystem.
But please check the software settings before you warn about this kind of malfunction.
There is one software settings, which also may cause the main window black at start-up,
but which is a normal operation. When the “Track Marks” operational mode was selected
before the previous system shutdown, this setting was stored. This case, the next
system start-up applies the same system setting in this respect. The main image window
remains black until the actual track counting process started. This means that at “Track
Marks” option the image is refreshed at first, only during the track counting process,
actually when the first tracks are recognized.
9.1.1.1.1 The main microscope image window stays black after system start.
This may happen when some system settings at LINUX OS level have been altered.
- One of this occasion may happen, which is not a typical one, when the user with
system administration access rights, (as root user), alters some related system settings.
- However, also other occasion may happen, when the user alters the image capture
related system settings unintentionally, which has been already occurred many times
unfortunately. The standard installation of the LINUX system includes also a series of
utility software, utilizing the same hardware channels, which is dedicated to the
operation of the Radometer software. All of these sort of utility software are related to
video capture operations, for example TV or digitalization of external video sources. It is
highly recommended to avoid utilizing the Radosys system for other, video operation
application, but only for this application exclusively. Invoking any video capture related
utility software may cause serious interference with the Radometer application. At most
cases the system setting alteration by video utility software is irreversible. The Radosys
system’s software engineers can not protect the system configuration from this kind of
alteration at Linux system level. Just please do not invoke any video application software
at the Radosys system.
9.1.1.1.2 The main microscope image window stays black after system start.
A known but not yet resolved type, occasional system fault.
An occasional, rarely occurring system start-up fault has been detected.
- Description of the potential error condition:
At starting up the computer and starting the Radometer software, the main Radometer
microscope window remains black, without proper image capture condition.
- Suggestion for problem resolution:
Switch off the computer by normal Shut Down operation.
Unplug the USB cable than plug it again after 10 seconds.
Wait 10 seconds and start the computer again.
This procedure always recovers the proper operation.
Chapter 9.
Maintenance and Troubleshooting
© 2013 by Radosys Kft. All rights reserved
RADOSYS User Manual
File Ref. RS_Man82
9.2
Page
9-2
Revised at 7/8/2013
TROUBLESHOOTING
9.2.1 WHEN CLOSING THE X-WINDOWS FAILS
Any malfunction at the operation of the X-Windows system is unlikely, since this is an
extremely stable environment. However any time when an unexpected and unwanted
freezing of a process or of the X-Windows occurs, the X-Windows graphics environment
can be restarted easily. This is a unique feature of the X-Windows.
To restart the X-Windows press the keys Alt-Ctrl-Backspace simultaneously.
The graphics environment starts again by displaying the login window.
9.2.2 DEBUG INFORMATION FOR THE SYSTEM SERVICE (RADOSYS VERSION 2000/2003 ONLY)
RELEASE NOTE: This chapter is applicable for versions Radosys 2000/2003 only. All
the versions released after October, 2005, the software was equipped with integrated
Diagnostics software tool. Omit this chapter if you use a Radometer software version
introduced after October, 2005.
Any time when any irresolvable problem at the system operation should occurred,
please create an information file for your Radosys dealer as follows.
Create and send a few of log file to the dealer.
In order to help the expert to track what happens in your Radosys computer after
powering up. This log files will be analyzed and will be tried to locate the source
of the problem remotely.
Please create this log files according to the following steps.
1./ Start the RadoMeter software, not by the desktop icon, but in the
following way:
Open a Terminal Window. (By clicking on the black monitor icon at the
taskbar, which is located at the bottom edge of the window.)
Type the following command in the Terminal Window:
/radosys/RadoMeter/bin/rm >> rm.log 2>&1
(this command will redirect the messages printed on the screen to
the
rm.log file.)
2./ In the Maintenance menu, select Settings...
At the last line of the window: the "Logfile detail level" input field can
be found. Please increase this value to 5.
3./ Start the evaluation by clicking on the Start button. If any unwanted
event, that is an obvious malfunction occurs, perhaps the crash of the
Radometer sw, please close its window. If you find it better to do, please
Chapter 9.
Maintenance and Troubleshooting
© 2013 by Radosys Kft. All rights reserved
RADOSYS User Manual
File Ref. RS_Man82
Page
9-3
Revised at 7/8/2013
locate the Logout option of the KDE environment popup menu with the first
icon at the left bottom corner. Select Shutdown and the Restart option.
4./ Please locate and send us the following files by email:
/var/log/messages
/home/rm/.RadoSys/radometer.log
/home/rm/rm.log
The most easiest way of sending this files, if you copy them to a floppy
disk and you send them by the usual way. You may copy the files to a floppy
disk by the MC, Midnight Commander. This is a Norton Commander clone, and
this is a standard utility in your Radosys computer. Probably you know the
Norton Commander or the Windows Commander, all of this software work the
same alike. In your LINUX system, the most easiest way to invoke the MC, if
you open the Terminal window and simply type "mc".
9.2.3 DEBUG INFORMATION FOR THE SYSTEM SERVICE (RADOSYS VERSIONS RSV6X)
RELEASE NOTE: This chapter is applicable for versions Radosys RSV6X. All the
versions released after October, 2005, the software was equipped with integrated
Diagnostics software tool.
The Diagnostics software tool is available in the Maintenance menu of the Radometer
software.
………………………
9.3 CODE READING CALIBRATION
RELEASE NOTE: This chapter is applicable for Radometer software versions lower
than 1.17 only. From the version 1.17 release at November, 2004, the later versions
were equipped with automatic code reading calibration. Omit this chapter if you use
Radometer software version 1.17 or higher.
The fine adjustment of the automatic dot code reading capability is described here.
This calibration procedure is needed when any of the following events occurs.
Transportation of the Radosys Units.
Replacement of the Microscope Unit.
The number of false reading at the detector ID code is increasing dramatically.
During the calibration procedure a correction factor for the X-Y position settings is
determined by means of a Position Test Card. The Test Card is a standard accessory
Chapter 9.
Maintenance and Troubleshooting
© 2013 by Radosys Kft. All rights reserved
RADOSYS User Manual
File Ref. RS_Man82
Page
9-4
Revised at 7/8/2013
item delivered with the Computer Unit. Actually this item is a standard RadoSlide
detector holder with a specially prepared detector chip located in the position 2. A
rectangular valley with definite position is engraved into the surface of this test chip.
Start the Radometer software.
Click on the Feed button and insert the Position Test Card into the Microscope.
Enter to the Manual Control mode.
Move the microscope head to the detector position 2 by clicking to the number 2 at the
right of the Manual Control window.
Start the Autofocus operation of the Manual mode.
Search the image of the rectangular object by means of the movement control buttons.
You may increase the movement step size in the corresponding input field if it is
necessary.
Move the rectangular object to the middle of the image window. Set the Step Size to 1 in
order to achieve the finest positioning.
After proper positioning the rectangle to the middle open the Settings window.
Click on the button “Get From Manual Window” in the Settings window. The values in
the Position Correction X-Y fields are changing being the result of the calibration.
Click on the OK button in the Settings window.
Close the Settings window.
Close the Manual Control window.
Click on the Drop button and remove the Test Card from the Microscope.
The code position adjustment is done.
Chapter 9.
Maintenance and Troubleshooting
© 2013 by Radosys Kft. All rights reserved
RADOSYS User Manual
File Ref. RS_Man82
Page
9-5
Revised at 7/8/2013
9.4 TRAY INNER SECTION LUBRICATION
This maintenance step is needed just after a prolonged and regular usage of the
Microscope. Do not care of this requirement at the time of the first installation too much.
However take it into account after processing 10 thousands of detectors.
Chapter 9.
Maintenance and Troubleshooting
© 2013 by Radosys Kft. All rights reserved
RADOSYS User Manual
File Ref. RS_Man82
9.5
Page
9-6
Revised at 7/8/2013
REPLACEMENT OF THE BACKUP BATTERY (RADOSYS 2000 VERSION ONLY)
Remove
wall of thebycomputer
by a sliding
motion towards
the direction
Wheneverthe
it isside
recommended
the troubleshooting
information
that the backup
battery of
indicated
by
a
big
green
arrow
on
the
picture.
the computer motherboard should be replaced to a new one, please do it according to the
step-by-step instructions, as follows.
Switch the computer off. Remove all of the connecting cables. Place the computer to the
desk by its side. Proper orientation and position is displayed on the image below.
Remove two screws at the rear panel fixing the right most side wall of the computer case.
The location of this screws are indicated by arrows in green on this picture.
Locate the backup battery on the motherboard by means of the
next picture.
Chapter 9.
Maintenance and Troubleshooting
© 2013 by Radosys Kft. All rights reserved
RADOSYS User Manual
File Ref. RS_Man82
Page
9-7
Revised at 7/8/2013
An enlarged picture helps to identify the location of this battery accurately.
Chapter 9.
Maintenance and Troubleshooting
© 2013 by Radosys Kft. All rights reserved
RADOSYS User Manual
File Ref. RS_Man82
Page
9-8
Revised at 7/8/2013
Remove the backup battery as it is suggested by the next picture.
Place a new backup battery into the position of the older one, in order to
replace it. Place the computer side wall to its original position and fixed it by
the two fixing screws.
9.6
P
ACKING RSV60 UNIT FOR TRANSPORTATION
9.6.1 PACKING ELEMENTS
Items using for packaging:
•
•
•
•
•
Metal box with size of 750cmX550cmX380cm, including polystyrene foam bed
assembly, which is fixed onto the bottom of the box.
U-like polystyrene foam part to fix the microscope
Set of Cable Ties, which is in the pouch mounted to the inner wall of the box
Shaped plastic sheet to protect the metal door of the microscope against shacking
damages
A roll of adhesive stripe to fix the metal door of the microscope to the plastic dome.
Chapter 9.
Maintenance and Troubleshooting
© 2013 by Radosys Kft. All rights reserved
RADOSYS User Manual
File Ref. RS_Man82
Page
9-9
Revised at 7/8/2013
Packaging instruction step-by-step
Step 1.
Be ensured that the plastic dome-like cover of the microscope is fixed to the main body
of the microscope and the cover is firmly fastened by the rear hexagonal screw.
Step 2.
Place the Shaped Plastic Sheet between the metal door and the plastic dome, in order
to protect the dome against shacking damages.
Chapter 9.
Maintenance and Troubleshooting
© 2013 by Radosys Kft. All rights reserved
RADOSYS User Manual
File Ref. RS_Man82
Page
9-10
Revised at 7/8/2013
Step 3.
Fix the metal door to the dome by the Adhesive Stripe.
Chapter 9.
Maintenance and Troubleshooting
© 2013 by Radosys Kft. All rights reserved
RADOSYS User Manual
File Ref. RS_Man82
Page
9-11
Revised at 7/8/2013
Step 4.
Place the microscope into the metal box. There is a polystyrene bed on the bottom of
the box, which forms a nest for the microscope. Be sure that the whole body of the
microscope is inside the nest correctly. The legs of the microscope should stand on the
polystyrene floor of the nest firmly.
Check the correct positioning in the nest by checking the front, around the area of the
metal door.
Chapter 9.
Maintenance and Troubleshooting
© 2013 by Radosys Kft. All rights reserved
RADOSYS User Manual
File Ref. RS_Man82
Page
9-12
Revised at 7/8/2013
Step 5.
Place the U-like polystyrene part onto the microscope. The legs of the U-like polystyrene
part should fit to the matching pit of the polystyrene base bed correctly. Otherwise the
door of the metal box could not be closed.
Chapter 9.
Maintenance and Troubleshooting
© 2013 by Radosys Kft. All rights reserved
RADOSYS User Manual
File Ref. RS_Man82
Page
9-13
Revised at 7/8/2013
Step 6.
Close the door of the metal box and lock it by the two locks on it.
There are holes on the locks using padlocks to secure. Instead of padlocks use the
attached Set of Cable Ties to secure the locks.
Step 7.
Now the box with the microscope inside is ready for transportation.
Chapter 9.
Maintenance and Troubleshooting
© 2013 by Radosys Kft. All rights reserved
RADOSYS User Manual
File Ref. RS_Man82
Page
11-1
Revised at 7/8/2013
10 Glossary
11 Picture Gallery
Chapter 10.
© 2013 by Radosys Kft. All rights reserved
Glossary
RADOSYS User Manual
File Ref. RS_Man82
Page
12-2
Revised at 7/8/2013
12 System Specification
Technical Specification of RADOSYS® System
Throughput of the system: 1000 dosimeters per week or more
Detector specification:
Radiation sensitive component
Type: PADC/CR-39 radon and thoron sensitive plastic material
Typical background/transit track density value: 0.1 tracks per mm2
Dimension: 10x10x1mm
Extra feature: Double ID code, for both visual and automatic reading
Note 1.: This type of CR-39 chip is compatible with the Radosys system only
Note 2.: The CR-39 chips supplied to the N-DOSYS product line are not compatible with
the radon line.
Radon Detectors:
All Types of Diffusion Chambers are Made of Conductive Plastics
All Types are delivered with Accurate Calibration Information
All types are delivered with Quality Control Sheet
RSFS standard type: for indoor radon tests:
Individually Sealed into Radon-Proof Pouch
Tamper-Proof Design
Applicable for Both Long-term (80 Days) and Short-term (10 Days) Tests
Metrology Information: Range of Detection from 40 to 12000 kBqh/m3
RSFV special type:
Subtype of RSFS
Double Chamber Technology
Dedicated to Tests in environment with Unpredictable level of radon activity
Metrology Information: Range of Detection from 40 to 100000 kBqh/m3
RSFW special type:
Subtype of RSFV
Equipped with Water/Humidity Protection
Dedicated to Test in Humide envitronment, for instance in Spa, Cave, Mine
or Soil
RADUET special type:
Radon-Thoron Discriminating Detector
Unique, Double-Detector Structure, according to NIRS, Japan & Radosys
Recommendation
Dedicated to Thoron survey projects; a highlighted issue since 2005,
WHO’s Intnl Radon Project
RSFK special type:
Dedicated to Regional Radon Mapping Projects. This type is available by
individual contracts only.
Other available options: Custom-designed labels
Ready-made, assembled dosimeters
Chapter 12.
System Specification
© 2013 by Radosys Kft. All rights reserved
RADOSYS User Manual
File Ref. RS_Man82
Page
12-3
Revised at 7/8/2013
Detector Development Process:
Etching Unit (RB4):
Type of developed tracks: Circular tracks primarily
Etching substance: 25% / 6.25 molar sodium-hydroxide solution
Etching temperature: 90 centigrade, factory default setting
Etching time: 4.5 hours, factory default
Number of detectors developed at the same time: 432
Etching solution volume: 5000 g
Bath operation specialties: Temperature regulation, automatic liquid stirring
Other standard features: Set of accessory items for solution handling
Control features: Advanced programmable options by front-panel keyboard
Front Panel LCD Display with process information and temperature data
Regional Power Versions: EU 220/240 VAC or USA/JAPAN 90/120 VAC;
50/60Hz
Packaged weigh: 15 kg
Dimension: 400x400x600mm
Evaluation process (RM Track Analysis Equipment):
Microscope Unit:
Imaging component: B&W CCD Camera
Optical magnification: 100x
Object movement: Automatic XYZ directional movement
Extra feature: Automatic image focusing
Feeding capacity: 12 detectors at RSV6 Version
240 detectors at RSV60 Versionl
Packaged weight: 35kg at RSV6 Version
45kg at RSV60 Version
Dimension without package:
500mm x 500mm x 300mm at RSV6
Version
500mm x 800mm x 300mm at RSV60 Version
Computer Unit:
Architecture: Notebook HP-NX6110 or equivalent type
Operational software environment: LINUX
Power: 90 to 240 VAC 50/60Hz
Packaged weight: 8kg
Dimension without package: 100mm x 250mm x 300mm
Operational Characteristics:
Evaluation time per detector:
In fast mode optimized for productivity: 45 sec
In slow mode optimized for accuracy: 90 sec
Track recognition capability: Single and double/triple overlapping tracks
Area of detector scanned for track analysis: 50 mm2
Data report displayed:
Chart of track density
ID code recognition: Automatic dot code reading
Data access: By advanced data-base operation
Software options:
Chapter 12.
System Specification
© 2013 by Radosys Kft. All rights reserved
RADOSYS User Manual
File Ref. RS_Man82
Page
12-4
Revised at 7/8/2013
Double OS configuration – Linux and Windows XP
Option 1. – Data exchange through extra HD partition
Option 2. - WMWARE assisted configuration with both Linux and
Windows XP
Chapter 12.
System Specification
© 2013 by Radosys Kft. All rights reserved
RADOSYS User Manual
File Ref. RS_Man82
Page
13-5
Revised at 7/8/2013
13 Product History and Version Information
13.1 RB4 ETCHING UNIT
13.1.1 OPERATION WITH RB4-FW1 FIRMWARE VERSION
This is an outdated Chapter, since most of the earlier RB4 units had been already
upgraded to firmware version FW3. But we kept this chapter in the User’s Manual for
those users, who still owns an RB4 unit with FW1 firmware version.
Units with S/N. RB4-101, -102 and -103 were supplied with firmware version RB4-FW1.
The operation for these, 1st generation, units is documented in this chapter.
Note: The firmware of these units can be also upgraded, but the way of upgrading
differs from the procedure described in Chapter ‘Upgrading the Firmware of RB4 Unit’. In
this respect please contact the manufacturer or the local vendor.
The firmware version FW1 was designed to providing as much simple operation than
that of the former Radobath 99 unit.
Single button operation. The temperature regulator can be simply switched ON or OFF
according to the action desired.
Only one, factory default target temperature, 90 centigrade is implemented. The target
temperature is not selectable.
The main power switch locates at the left side wall of the equipment. Turn it to ON
position to power up the unit. When the LCD display is illuminating, this indicates the
power on status.
The temperature regulator can be controlled by the REGULATOR button of the front
panel keyboard. Push this button to start heating the etching solution. Or push this
button to stop heating.
The status of the regulator operation is indicated on the LCD display.
Note: Never switch on the regulator when the bath is empty. Switch it on only if the bath
is filled up by liquid. When this rule was failed the heater might cause damages on the
surface of the stainless steel pot.
Once the heater is on, the temperature regulator heats the liquid up to 90 centigrade
and keeps the temperature at this value with tolerance of +/-1.5 centigrade.
The front panel LED indicator indicates the status of the heater. When the LED indicator
is ON the heater is also ON and vice versa.
During the heating up period, the heater and also the LED indicator are ON, until the
target temperature reaches 90 centigrade.
During the period, when the regulator is keeping the temperature at the target value, the
heater and the LED indicator are ON and OFF periodically.
Chapter 13.
Product History and Version Information
© 2013 by Radosys Kft. All rights reserved
RADOSYS User Manual
File Ref. RS_Man82
Page
14-6
Revised at 7/8/2013
Note: Three additional buttons, the SETTING buttons, are located on the front panel
keyboard. These buttons has no any functions at the FW1 Firmware Version. But they
have extended functions at the FW2 Firmware Version.
13.1.2 UPGRADING THE FIRMWARE OF THE RB4 TYPE ETCHING UNIT
Upgrading the firmware of the RB4 unit requires establishing cable connection between
the RB4 unit and an external computer. An interface connector for this purpose is
located at the rear wall of the RB4 unit. The interface cable and the upgrade software
are supplied by the manufacturer.
14 Product Sales Codes versus Technical Codes. Comparison Chart.
Chapter 14. Product Sales Codes versus Technical Codes. Comparison Chart.
© 2013 by Radosys Kft. All rights reserved
RADOSYS User Manual
File Ref. RS_Man82
Page
15-7
Revised at 7/8/2013
15 User’s Manual Version History
15.1 MAN_2K_71
This release was available from 4th March, 2001 and accompanied the product in
unchanged form until 2006. Before 2001 many, continuously developing versions of the
Manual were published; the details are not listed here.
The version Man_2K_71 covers the product versions Radosys2000 and Radobath’99.
Between 2001 and 2006 the product information was updated by releasing a series of
Application Notes, from RSAN-101 to RSAN-114.
15.2 RS-MAN61
First release was published at 2nd October, 2006.
This is a significantly updated version, therefore the update details are not listed here.
All the text of the former version Man_2K_71 has been built into this version.
The version covers all the product versions; Radosys2000, Radosys2003, RS-V6,
RSV60, and the etching bath units Radobath’99, RSB4, also detector types RSFS,
RSFV and RADUET. The outdated detector types are not covered; Radoset and RSEseries, since these products was no longer available at the time of publishing this
version of the Manual.
15.3 RS-MAN62
First release was published at 12/12/2006.
Chapter 2.3. Raduet Type Detector
- New reference is added.
Chapter 15. User’s Manual Version History
- The body text of this chapter has been added.
Chapter 5.5.4. Data Exportation to Other Application Software
- This is new chapter.
Chapter 4.7.3. Routine Operation with DMU-V6R Version Software
- This is new chapter.
Chapter 5.2. Root User Operation.
- The login name was corrected. More information was added.
Chapter 15. Literature
- This is new chapter.
Chapter 2.4. RSNS type dosimeter
- Structure image added.
Chapter 4.8. N-DOSYS, NEUTRON DOSIMETRY APPLICATION SPECIFIC
PROCEDURE
- This is new chapter.
Chapter 7.9. SCIENTIFIC BACKGROUND OF THE N-DOSYS NEUTRON DOSIMETER
APPLICATION
- This is new chapter.
Chapter 5.6.6. WHEN ID CODE READING FAILS – This is new chapter.
Chapter 15.
User’s Manual Version History
© 2013 by Radosys Kft. All rights reserved
RADOSYS User Manual
File Ref. RS_Man82
Page
15-8
Revised at 7/8/2013
15.4 RS-MAN63
First release was published at 25/08/2007.
Chapter 2.5. RSKS Type Dosimeter
- This is new chapter
Chapter 7.9 SCIENTIFIC BACKGROUND OF THE N-DOSYS NEUTRON DOSIMETER
APPLICATION
The content of this chapter have been removed from RS_Man63, because of its large
file size. At printed or PDF version of this Manual this chapter is attached to the end of
this document.
Chapter 7.2. Radosys Radon Detectors
Text for 7.2.1, 7.2.2 and 7.2.3 was added.
Chapter 5.7. Radosys Special Type Detectors
Text for 5.7.1, The Raduet Detector, was added.
15.5 RS-MAN81
Chapter 4.5 MICROSCOPE MODEL SPECIFIC OVERVIEW. MODEL RSV6 VERSUS
RSV60
Chapter Title Update
Chapter 4.6 VERSION OVERVIEW. MODEL RSV6 VERSUS RSV8 AND MODEL
RSV60 VERSUS RSV80
New Chapter
Chapter 4.8.3
How to remove slides from auto-feeder unit at case of slide stack
failure
New Chapter
Chapter 5.5.5
Calibration using the DMU-V6R software
New Chapter
Chapter 5.7.2
Raduet Imprecision
New Chapter
Chapter 7.11 ESTIMATION OF UNCERTAINTY OF RADON MEASUREMENTS WITH
ALPHA TRACK DETECTORS – THEORETICAL APPROACH
New Chapter
Chapter 9.6 PACKING RSV60 UNIT FOR TRANSPORTATION
New Chapter
15.6 RS-MAN82
Chapter 4.7 VERSION OVERVIEW. MODEL RSV8 VERSUS RSV10 AND MODEL
RSV80 VERSUS RSV100
New Chapter
Chapter 4.7
VERSION OVERVIEW. MODEL RSV8 VERSUS RSV10 AND
MODEL RSV80 VERSUS RSV100
New Chapter
Chapter 15.
User’s Manual Version History
© 2013 by Radosys Kft. All rights reserved
RADOSYS User Manual
File Ref. RS_Man82
Page
15-9
Revised at 7/8/2013
Chapter 5.5.5
CALIBRATION USING THE DMU-V6R SOFTWARE BEFORE
OCTOBER, 2012.
Introductory is added
Chapter 5.5.6
CALIBRATION USING THE DMU-V6R SOFTWARE AFTER
OCTOBER, 2012.
New Chapter
Chapter 2.1
RSFS TYPE DETECTORS
Introductory is added
Chapter 4.8. ROUTINE OPERATION WITH THE RADOSYS RS-RM VERSION TRACK
ANALYSIS SW
Introductory is added
Chapter 4.10
RSV10X MODELS SPECIFIC OPERATION
New Chapter
Chapter 4.12
CALIBRATION DATA TABLE UPDATE
New Chapter
Chapter 15.
User’s Manual Version History
© 2013 by Radosys Kft. All rights reserved
RADOSYS User Manual
File Ref. RS_Man82
Page
16-10
Revised at 7/8/2013
16 Literature
This is a short list of printed papers and of information on the web for those, who intends
to learn more about track-etch theory, technology or about general radon test/survey
matters.
1. A good summary about general and/or radon related track-etch theory:
Nikezic, D., Yu, K.N., "Formation and Growth of Tracks in Nuclear Track Materials",
2004, Materials Science and Engineering R, 46 (3-5), 51-123.
2. An excellent book:
Durrani, S.A., Ilic, R., 1997. Radon Measurements by Etched Track Detectors. World
Scientific Publishing Co. Pte. Ltd., Chapter 2.1.4., 88-89.
3. A whole list of European country-wide radon surveys is available at this web-site, as
well as the reports themselves:
http://radonmapping.jrc.it
4. A complete radon map of the United States is available at the web-site:
www.epa.gov
Chapter 16.
© 2013 by Radosys Kft. All rights reserved
Literature