1
For Vista / Windows7 / Windows8
For Vista / Windows7 / Windows8
Technical Trading Tools
for Financial Markets
WinIT User Manual
For Vista / Windows7 / Windows8
Insight Trading Pty Ltd
ABN 96 003 946 932
PO Box 315
Blaxland
NSW 2774
Australia
Phone (sales)
Fax (sales)
Phone (support)
Fax (support)
Website
Email
July 2014
(02) 4751 2932
(02) 4751 9666
(03) 9768 9611
(03) 9796 2088
www.insighttrader.com.au
info@insighttrader.com.au
support@insighttrader.com.au
COPYRIGHT
The INSIGHT TRADER programs are copyright and all rights are reserved by the
author, Bernard Chapman.
The INSIGHT TRADER User Manual is copyright and all rights are reserved. The
reproduction of this manual, in whole or part, or its conversion to electronic medium
are prohibited unless prior consent, in writing, has been given by the author.
IBM is a registered trademark of International Business Machines.
Metastock is a registered trademark of Equis International
QP2 is a registered trademark of Quotes Plus Inc
MS-DOS, Excel, Windows 95, Windows 98, Windows NT, Windows 2000,
Windows XP, Vista, Windows 7 and Windows 8 are registered trademarks of
Microsoft Corporation.
LIMITED WARRANTY
Nothing herein shall exclude, restrict or modify any condition, warranty or liability
which may at any time be applied by the Trade Practices Act, 1974
(Commonwealth) or any other applicable law where to do so is illegal or would
render any provisions of these clauses void. Subject as aforesaid, these programs,
any data files and the User Manual are provided on an "as is" basis without warranty
of any kind, expressed or implied, including but not limited to their respective
quality, performance, merchantability and fitness for a particular purpose. Bernard
Chapman shall not be liable for any loss or damages of any kind whatsoever
(including, without limiting the generality of the foregoing, consequential damages)
arising out of or in connection with or incidental to these programs any data files
and the User Manual whether arising from any act, omission or failure (whether
negligent or not) of Bernard Chapman, his officers, servants, agents, independent
contractors or otherwise. If Bernard Chapman should be liable for a breach of a
condition or a warranty implied by Division 2 of Part V of the Act (other than the
conditional warranty implied by Section 69 of the Act) in relation to the supply of
goods or services or both which are not of a kind ordinarily acquired for personal,
domestic or household use or consumption, his liability shall be limited to any one
or more as he in his sole discretion considers appropriate with the limitations
specified in subsections (a) and (b) of Section 68A(1) of the Trade Practices Act
1974 (Commonwealth).
TABLE OF CONTENTS
Contents
TABLE OF CONTENTS ........................................................................................................................ 9
Insight Trading Pty Ltd
17
Support
17
Chapter 1 ............................................................................................................................................... 19
Getting Started. ...................................................................................................................................... 19
Insight Trader is both Powerful and Easy to Use
20
Five key components to Insight Trader:
21
Requirements
21
Summary of the Contents of this Manual
21
Installing Insight Trader
22
Installing from CD ......................................................................................................................... 22
Starting Insight Trader ................................................................................................................... 22
For Insight Trader Databases ......................................................................................................... 23
For Metastock® Format Databases ................................................................................................ 23
For BodhiOne Format Databases ................................................................................................... 23
For Quotes Plus Inc QP2® Databases ............................................................................................ 23
Help in Insight Trader
24
Keeping your program up to date
24
Date Convention Used in Insight Trader
25
Insight Trader Special Edition - ITSE
25
How do I use IT
26
Technical Analysis and Market Trading
27
IT is Easy to Use
27
Screen Layout ................................................................................................................................ 27
Utilities available ........................................................................................................................... 28
Lets Chart
29
The Floating Toolbar ..................................................................................................................... 30
Speedkeys ...................................................................................................................................... 30
Displaying the data for any day ..................................................................................................... 32
The Chart Edit Window ................................................................................................................. 32
Creating Structures such as Lines, Fans etc ................................................................................... 34
Adding Charts to the Working Area .............................................................................................. 35
Cascading and Tiling ..................................................................................................................... 35
Saving the Chart Arrangement ...................................................................................................... 36
Changing the Active Chart ............................................................................................................ 37
Maximising Charts and Activating in Sequence ............................................................................ 37
Refreshing Charts .......................................................................................................................... 37
Printing Chart Arrangements ......................................................................................................... 37
Quick Template ............................................................................................................................. 38
Exiting Insight Trader .................................................................................................................... 38
Summary........................................................................................................................................ 38
Chapter 2 ............................................................................................................................................... 39
Charting ................................................................................................................................................. 39
Overview
39
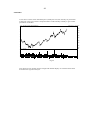
What is a chart ............................................................................................................................... 39
What types of Charts can I Use ..................................................................................................... 39
Chart Types ................................................................................................................................... 40
Other Display Options ................................................................................................................... 47
Scales ............................................................................................................................................. 49
Presentation of Charts .................................................................................................................... 51
Viewing Charts .............................................................................................................................. 52
Viewing Latest Data and Using the Notepad ................................................................................. 53
The Undo Facility .......................................................................................................................... 54
Managing your charts
54
Creating and Manipulating Charts ................................................................................................. 54
Saved Charts .................................................................................................................................. 59
Printing Charts ............................................................................................................................... 63
Importing charts into other documents .......................................................................................... 63
Latest Data Window ...................................................................................................................... 64
Moving Data Window ................................................................................................................... 65
Notepad and Alarm Below and Alarm Above ............................................................................... 65
Customising your Charts
71
Presentation Options ...................................................................................................................... 71
Drawing Tools ............................................................................................................................... 78
Other Operations in Lines Mode ................................................................................................... 83
Text ................................................................................................................................................ 86
Temporary Overlaying................................................................................................................... 87
Events and Reversals ..................................................................................................................... 87
The Undo Facility .......................................................................................................................... 89
Portfolio Information Displayed on Charts.................................................................................... 90
Chapter 3 ............................................................................................................................................... 93
Indicators ............................................................................................................................................... 93
Overview
93
Setting Indicator Parameters .......................................................................................................... 93
The Global Indicators of Velocity and Behaviour
95
Velocity ......................................................................................................................................... 95
Behaviour Index ............................................................................................................................ 95
Note ............................................................................................................................................... 96
Moving Average Type Indicators
96
Moving averages............................................................................................................................ 96
Moving Average Envelopes .......................................................................................................... 98
Bollinger Bands ............................................................................................................................. 99
Linear Regression .......................................................................................................................... 99
Line of Linear Regression ........................................................................................................... 100
Parabolic Stop and Reverse ......................................................................................................... 101
Chandelier Exit ............................................................................................................................ 102
Scaffold Exit ................................................................................................................................ 103
Removing Moving Average Type Indicators .............................................................................. 103
Volume Based Indicators
104
Volume ........................................................................................................................................ 104
On Balance Volume ..................................................................................................................... 104
Volume Accumulation ................................................................................................................. 105
Volume/Price Trend Accumulator ............................................................................................... 105
Force Index .................................................................................................................................. 105
Other Indicators
105
Momentum .................................................................................................................................. 105
Detrend ........................................................................................................................................ 108
Moving Average Oscillator ......................................................................................................... 109
Relative Strength Index ............................................................................................................... 110
Stochastic ..................................................................................................................................... 111
Slow Stochastic............................................................................................................................ 111
MACD ......................................................................................................................................... 112
MACD Histogram ....................................................................................................................... 113
Directional Movement Indicator +DI -DI ADX .......................................................................... 113
Directional Movement Indicator ADX/ADXR ............................................................................ 114
Coppock ....................................................................................................................................... 115
Average True Range .................................................................................................................... 115
Rate of Return .............................................................................................................................. 116
Linear Regression Growth Rate ................................................................................................... 117
Money Flow................................................................................................................................. 117
Money Flow Index....................................................................................................................... 117
Bull Power and Bear Power ......................................................................................................... 117
Williams %R................................................................................................................................ 117
Bollinger %b ................................................................................................................................ 118
%BBW (Bollinger Band Width) .................................................................................................. 118
Trend............................................................................................................................................ 119
SROC Smoothed Rate of Change ................................................................................................ 119
Velocity and Behaviour ............................................................................................................... 119
Divergences
120
Stacked indicators
121
Removing an indicator from the stack ......................................................................................... 121
Removing all indicators from the stack ....................................................................................... 121
Changing the size of the subchart ................................................................................................ 121
Chapter 4 ............................................................................................................................................. 123
Specialised Chart Customisation ......................................................................................................... 123
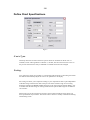
Chart Specifications
123
X-axis: ......................................................................................................................................... 124
Y-axis: ......................................................................................................................................... 124
Date Range: ................................................................................................................................. 125
Chart Type: .................................................................................................................................. 125
Main Chart Indicator: .................................................................................................................. 127
Subchart Indicator: ...................................................................................................................... 128
Define Chart Specifications
130
X-axis Type: ................................................................................................................................ 130
Scaling: ........................................................................................................................................ 130
Y-axis: ......................................................................................................................................... 131
Symbols: ...................................................................................................................................... 131
Linear Regression: ....................................................................................................................... 131
Accept the Form .......................................................................................................................... 132
Chapter 5 ............................................................................................................................................. 133
Advanced Productivity Techniques ..................................................................................................... 133
Overview
133
Slideshows
133
The Saved Chart Slideshow ......................................................................................................... 133
The Chart Arrangement Slideshow.............................................................................................. 135
The Autorun Slideshow ............................................................................................................... 135
Creating Reference or Highlight Lists ......................................................................................... 137
Generate a Chart Arrangement from a Reference List ................................................................ 142
Viewing a Large Number of Tiled Charts on Screen ................................................................... 142
Generate Saved Charts from Autoruns ........................................................................................ 142
Creating and Retrieving a Favourite Template ............................................................................ 143
Today File .................................................................................................................................... 143
The CommSec Today File ........................................................................................................... 144
The ASX Today File .................................................................................................................... 144
Kill all Today Files ...................................................................................................................... 145
Chapter 6 ............................................................................................................................................. 147
Configuration ....................................................................................................................................... 147
Overview
147
Graphics Colours
147
Screen Font
148
Printer Font
149
Configure Preferences
149
Browse Buttons............................................................................................................................ 150
Data file name for auto load on start up ....................................................................................... 150
Default Starting Date for Charts .................................................................................................. 150
Percentage of Screen for Subgraph .............................................................................................. 150
Path for Configuration and Data Files ......................................................................................... 150
White Space before Chart Axis ................................................................................................... 151
Paths for Alarm Sounds ............................................................................................................... 151
Command Line for Data Vendor ................................................................................................. 152
Price and Volume Factors ............................................................................................................ 152
Printed Charts .............................................................................................................................. 152
Display Info on Chart .................................................................................................................. 153
Other Options .............................................................................................................................. 153
Chapter 7 ............................................................................................................................................. 155
Management of Data ........................................................................................................................... 155
Overview
155
Single and Double Precision
155
Structure of an IT data file
157
File Manipulation
158
Creating Files ............................................................................................................................... 158
Viewing/Editing........................................................................................................................... 162
Saving data file ............................................................................................................................ 164
Loading data file .......................................................................................................................... 164
Browsing Data File ...................................................................................................................... 166
Deleting Data File ........................................................................................................................ 166
Portfolio Equity Curves ............................................................................................................... 166
Modifying Files
166
Checking Data File ...................................................................................................................... 166
Filling Data File ........................................................................................................................... 167
Adjusting Shares for Issues etc .................................................................................................... 167
Merging ....................................................................................................................................... 170
Printing and Exporting data ......................................................................................................... 173
Importing files in ASCII format .................................................................................................. 175
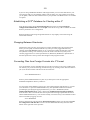
Other Data Formats supported
175
Establishing a BO or MS Database for Charting within IT ......................................................... 175
Establishing a QP2® Database for Charting within IT ................................................................. 176
Changing Between Directories .................................................................................................... 176
Converting Files from Foreign Formats into IT Format .............................................................. 176
Highlighter Functionality for Foreign Databases......................................................................... 177
Generate a List of All Codes in a Foreign Database .................................................................... 177
Backing up data
177
Checking data integrity
178
Deleting Block of Data from Whole Database ............................................................................ 180
Generate list of all securities with alarms set ............................................................................... 180
Deleting completely all alarms within Database.......................................................................... 180
Chapter 8 ............................................................................................................................................. 181
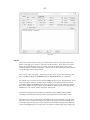
Downloading Data ............................................................................................................................... 181
Overview
181
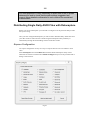
Distributing Single Daily ASCII Files with Datacapture
182
Express Configuration ................................................................................................................. 182
Detailed Custom Configuration ................................................................................................... 186
Running Datacapture for a Single Day ........................................................................................ 189
Distributing Many Daily ASCII Files with Datacapture
189
Running Datacapture for Many Days .......................................................................................... 190
Running Datacapture in Command Line Mode
191
Split Directories
191
Bulk Manual Update Utility
192
Setting up ..................................................................................................................................... 193
Insight Trader ASX Database Manager
195
User Supplied Fundamentals ....................................................................................................... 196
Updating Insight Trader from the Web
197
The Spiderweb Toolbar Button ................................................................................................... 198
Chapter 9 ............................................................................................................................................. 199
Systems ................................................................................................................................................ 199
Overview
199
Constructing a System
199
Structure of a System ................................................................................................................... 199
Syntax of the Criteria ................................................................................................................... 200
The Total System ......................................................................................................................... 208
Using a System
209
Setting up the System .................................................................................................................. 209
Filtering your Database................................................................................................................ 212
Profitability Testing ..................................................................................................................... 216
Batch Run Multiple Systems against Multiple Securities ............................................................ 220
Chapter 10 ........................................................................................................................................... 221
Portfolio Manager ................................................................................................................................ 221
Important Notice
221
Hardware requirements
221
Overview
221
Creating a Portfolio
224
Setting up Your Global Defaults ................................................................................................. 224
Registering a New Broker ........................................................................................................... 225
Entering the transactions.............................................................................................................. 228
Displaying the Calculated Portfolio ............................................................................................. 236
Printing Reports ........................................................................................................................... 242
Automatically Importing Transaction Lists from Brokers ........................................................... 247
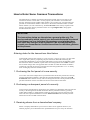
How to Enter Some Common Transactions
249
Entering dates for the transactions listed below .......................................................................... 249
1. Purchasing the first parcel of a new security ........................................................................... 249
2. Purchasing a subsequent parcel of a security ........................................................................... 249
3. Receiving shares from a demutualised company ..................................................................... 249
4. Bonus issues of shares of the same security ............................................................................ 250
5. Bonus issues of shares in another company (in specie) ........................................................... 250
6. Bonus issues of rights or options ............................................................................................. 250
7. Purchased rights or options ...................................................................................................... 250
8. Dividend reinvestment ............................................................................................................. 250
9. Making a call or instalment payment on contributing shares .................................................. 251
10. Receiving a capital return ...................................................................................................... 251
11. Short Selling .......................................................................................................................... 252
12. Receiving Dividends .............................................................................................................. 252
13. Adjusting for a reconstruction – split or consolidation .......................................................... 252
14. Merging companies by scrip for scrip rollover ...................................................................... 253
15. Demerging of securities ......................................................................................................... 254
16. Change of Name .................................................................................................................... 254
17. Selling a single parcel ............................................................................................................ 255
18. Selling several parcels of the same security........................................................................... 255
19. Selling all parcels of the same security .................................................................................. 256
20. Exercising a single parcel of rights or options ....................................................................... 256
21. Exercising several parcels of rights or options ...................................................................... 256
22. Exercising all parcels of rights or options .............................................................................. 257
23. Stapling of Securities ............................................................................................................. 257
Tips on entering a long term portfolio
259
Editing and Deleting Transactions
259
Other Features
260
General Formating ....................................................................................................................... 260
Risk Calculator ............................................................................................................................ 260
Company fundamentals, ratios and notepad ................................................................................ 264
Backing up your portfolio ............................................................................................................ 264
Wrapping Two or More Portfolios into One ................................................................................ 265
Creating a reference file for charting and systems testing ........................................................... 265
Passwording Portfolios ................................................................................................................ 265
Calculation of Portfolio Growth and Annualised Growth Rate ................................................... 266
Charting Directly from Portfolio Manager .................................................................................. 266
Charting Key Performance Indicators of your own Portfolio ...................................................... 267
The Significance of Annualised Growth Rate ............................................................................. 273
Transaction Codes used for Acquisition and Disposal ................................................................ 273
Exiting the Portfolio Manager ..................................................................................................... 273
Chapter 11 ........................................................................................................................................... 275
Documents Management System ........................................................................................................ 275
Overview
275
Storage and Retrieval ................................................................................................................... 275
Where are the files actually stored ............................................................................................... 276
Schemes for Further Organisation ............................................................................................... 276
Storage and Retrieval of Documents
276
On the Main Charting Window ................................................................................................... 276
On the F2 Notepad ....................................................................................................................... 277
On the Main Portfolio Summary Window ................................................................................... 277
On the Accounts Transactions Dialog ......................................................................................... 277
Customising the Word Document Templates
278
Encrypting Sensitive Portfolio Document Files
278
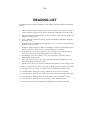
READING LIST .................................................................................................................................. 281
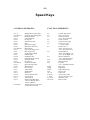
Speed Keys .......................................................................................................................................... 282
Specialized Mouse Operations ............................................................................................................ 284
Front Screen
284
Chart Edit Screen
284
On main chart .............................................................................................................................. 284
Just to left of vertical axis ............................................................................................................ 284
Just to right of vertical axis .......................................................................................................... 284
Text (on top left corner) or Lines, Fans, Circles etc (on handles)................................................ 284
Mousewheel Button ..................................................................................................................... 284
INDEX................................................................................................................................................. 285
17
Insight Trading Pty Ltd
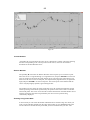
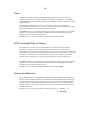
Congratulations on purchasing Insight Trader, the premier Australian designed package for
market analysis and investment.
Insight Trading produces software specifically designed for the Australian stockmarket and
futures markets. We know that your time is precious and we are therefore dedicated to
providing you with the productivity tools you need to allow you to process very large
amounts of information very efficiently.
Insight Trader has an internal database of the names and subsectors of every company on the
Australian Securities Exchange (ASX). This allows you to view very quickly charts of all the
banks, or all the gold stocks or all the chemical companies etc at the touch of a key. In fact, if
you wish, you can see a chart on every company on the ASX in about one hour.
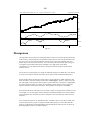
We are constantly upgrading the program by bringing out new versions with additional
enhancements. These updates are conveniently and transparently updated via the web from a
simple menu click and are available continuously throughout the year.
Support
For support on Insight Trader please contact Vestdata on one of the following:
1.
By phone:
(03) 9768 9611
during normal business hours (9am-5pm weekdays)
2.
By fax
(03) 9796 2088 - at any time
3.
By email:
support@insighttrader.com.au - at any time.
4.
At our Web site URL
http://www.insighttrader.com.au
We will attempt to assist you as soon as possible.
19
Chapter 1
Getting Started.
Welcome to Insight Trader, the state-of-the-art Australian software package that harnesses
the full power of the Windows Vista/Windows7/Windows8 32-bit or 64-bit operating
systems to greatly enhance the productivity of your analysis of the investment markets.
This chapter tells you how to get Insight Trader operational as quickly as possible and
provides a brief introduction on how to display and customise your charts.
Chapter 2 provides detailed instruction on constructing, modifying, manipulating, saving,
retrieving and printing your charts.
Chapter 3 explains the use of indicators
Chapter 4 tells you how to customise your charts to access specialised facilities.
Chapter 5 teaches you how to use the advanced productivity techniques.
Chapter 6 allows you to configure the various program options to your taste.
Chapter 7 shows you how to maintain your database of price and volume information on the
various securities that you follow.
Chapter 8 provides guidance on how to set up for various data downloading services
Chapter 9 explains the use and operation of the optional Systems Tester allowing you to
trawl your database to identify those securities satisfying the technical and fundamental
criteria that you have specified and to run profitability tests on individual securities according
to your buy and sell rules.
Chapter 10 tells you how to use the Portfolio Manager to keep track of the transactions in the
various portfolios of securities that you might hold and to value these now and at any
previous point in history.
Chapter 11 outlines how to use the Insight Trader Documents Management System to store
and retrieve all electronic documents related to your investment activities.
20
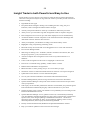
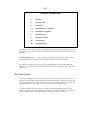
Insight Trader is both Powerful and Easy to Use
Insight Trader (or IT for short) is a state of the art technical analysis package designed for
ease of use and speed of analysis for large amounts of data. It provides you with a wealth of
features including:
Eight different chart types
Exceptional Point and Figure charting tools including auto box sizing, last price
indication, relative strength and rebased relative strength.
A library of important indicators. Stack up to 9 indicators under main price chart
Ability to save up to 100 000 living chart arrangements under 10 separate categories.
Each arrangement can consist of up to 506 charts displayed on screen simultaneously.
An internal database of all the companies on the Australian Securities Exchange, their
ASX GICS subsector and their main activities.
Ability to manipulate your database according to the GICS industry sectors.
Highlighter to flag exceptionally performing stocks
Hard and soft stop loss alarms that can be dragged and set on screen with the mouse
Provision for Managed Funds
Wide range of drawing tools - trendlines, Fibonacci and Gann retracements, fans, time
and price projections, cycles, astronomical events.
Autorun a template chart arrangement on all stocks in any GICS subsectors as a
slideshow
Create a chart arrangement of all stocks on a highlight or reference list
Fast access to commands using speedkey, toolbar buttons or menus.
Rebased charts and Relative strength charts
Black and white or colour printing of up to 12 or more charts per page.
Generation of charts in enhanced metafile format for inclusion in word processing docs
Update data via the internet or via fast manual bulk update
Over 24 years of historical database of Australian and international markets.
Document Management System for storage and retrieval of electronic documents
Optional Portfolio Manager to keep track of the transactions and current and past values
of all your portfolios.
Chart equity curves and other performance indicators to benchmark your portfolio against
index standards and automatically flag buy and sell transactions on your charts
Optional Systems Tester to filter your database or run profitability tests according to both
technical and fundamental criteria
Optional Database Manager service, updated via the web, to automatically housekeep
your ASX database including adjustments for splits, issues reconstructions, premium and
capital returns, name changes updating of fundamental information – GICS sector,
earnings per share, dividends per share, net asset backing, franking, shares on issue,
market capitalisation, debt to equity and forthcoming dividend.
Directly reads from Metastock®, BodhiOne and QuotesPlus® database formats.
Keep your software updated via the web for the latest changes.
21
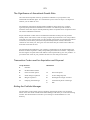
Five key components to Insight Trader:
There are five key components to the Insight Trader system:
1. Charting and analysis
2. Database management
3. Systems testing
4. Portfolio management
5. Documents management
Requirements
The minimum hardware and software requirements for IT for Windows are:
IBM PC or compatible or Apple Mac running Fusion or Parallels
Windows Vista/Windows7/Windows8
1 Gb of RAM
10 Gb of free hard disk space
Microsoft compatible mouse
Internet connection
Graphics card with resolution of preferably 1280x1024 or higher
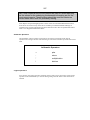
Summary of the Contents of this Manual
This manual is divided into the following chapters:
1. Getting started
2. Charting
3. Indicators
4. Specialised chart customisation
5. Advanced productivity techniques
6. Configuration
7. Management of data
8. Downloading data
9. Systems
10. Portfolio manager
11. Documents Management System
This Insight Trader manual is extensively illustrated with figures to facilitate your learning of
the program as quickly as possible. Where it is important to show you actual screens we have
included these directly. Where it is instead more important to discuss the principles behind
the charts we have illustrated using charts printed from Insight Trader as these are of much
higher quality than simple screen reproductions.
22
Installing Insight Trader
(Throughout this manual reference is frequently made to “directories”. It should be
understood that “directory” and “folder” are different terms for the same entity)
We strongly suggest that you operate Insight Trader in 1280x1024 screen resolution or
higher. Not all the toolbar buttons will be visible at the lower resolutions.
Installing from CD
Insert the CD into the CD drive and installation will start automatically. Follow the
instructions on screen until the installation is complete.
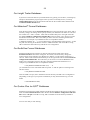
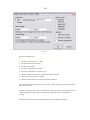
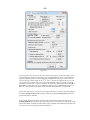
Starting Insight Trader
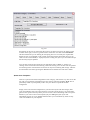
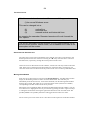
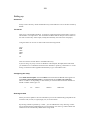
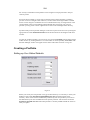
When installation is complete you will have a separate Insight Trader group window with
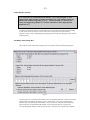
icons. Double click on the WinIT32 icon and a dialog box will appear asking you for your
Initial Registration Number that has been supplied with this package. Type it in here and
click OK. This initial registration number will allow you two months of operation during
which time you should complete the enclosed licence agreement and return it to Insight
Trading.
Fig 1.1
Keep this number recorded in a safe place (write it on the first page of your manual) as it can
be used to give you two months of operation if you need to reinstall following a hard disk
reformatting or changing to a new computer
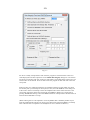
After you have sent back a completed copy of this agreement you should run the program,
select Format/Update from web and the process to enable your Final Registration Number
will be initiated. If you are unable to finalise your final registration number in this way then
you can call our office to carry out this operation manually.
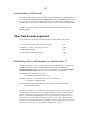
23
For Insight Trader Databases
If you have a historical data CD you should install it by placing it in the drive, cancelling any
attempt to autoinstall the program again unless you have not already done so, accessing
Utilities/Datacapture from the main menu and click the first toolbar button and then click
the Historical Data Install button.
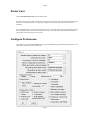
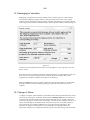
For Metastock® Format Databases
From the main menu choose Format/Preferences and a form will appear. First check, and if
necessary change, the settings which specify whether your database is in dollars or cents and
the volumes in 1’s 100’s or 1000’s. Then click the small button just to the right of the edit
box labelled Path for configuration and data files. This will allow you to browse to locate
the Metastock stem folder. This is the folder just below the ones containing the data files
themselves. For example if your Metastock files are in alphabetic folders
C:\MSDATA\ASX\A, B, …. Z you would browse to the ASX folder and accept that - so that
the path now showing in the edit box will be C:\MSDATA\ASX then click OK to accept,
OK to establish as and IT directory and OK to save configuration
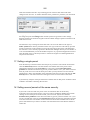
For BodhiOne Format Databases
Install the Bodhi Freeway software as directed. Then from the main menu choose
Format/Preferences and a form will appear. First check, and if necessary change, the
settings which specify whether your database is in dollars or cents and the volumes in 1’s
100’s or 1000’s. Then click the small button just to the right of the edit box labelled Path for
configuration and data files. This will allow you to browse to locate the BodhiOne stem
folder. This is the folder just below the ones containing the data files themselves. For
example if your BodhiOne files are in alphabetic folders:
C:\My Databases\BodhiOne\ASX\A, B, …. Z
you would browse to the ASX folder and accept that - so that the path now showing in the
edit box will be:
C:\My Databases\BodhiOne\ASX.
Then click OK to accept, OK to establish as and IT directory and OK to save configuration.
(Depending on the age of your specific installation you may instead need to log on to the
folder:
C:\Data\BodhiOne\ASX)
For Quotes Plus Inc QP2® Databases
Install the Quotes Plus Inc QP2® software and the historical data as directed. From the main
menu choose Format/Preferences and in the box labelled Path for configuration and data
files enter C:\IT-QP. Click OK to accept, OK to establish as and IT directory and OK to
save configuration
You are now ready to start charting.
24
Help in Insight Trader
There is an extensive help facility under the Help submenu of the main menu. This is in the
form of the normal hypertext help of Windows programs.
In addition you can position the mouse cursor over any toolbar button and a brief explanation
of its functionality will appear in a tooltip box or in the caption bar of the window in which it
resides.
At any point in the program pressing F1 will cause a popup menu to appear giving the
commands available at that point. In general there are three ways to activate the commands in
IT:
using the mouse on main menu items and toolbar buttons
using speedkey commands or single keystrokes
pressing F1 at various points in the program and selecting items from the
resulting context sensitive popup menus that appear.
After you have used IT for a little while you will remember the various speedkey commands
that provide the fastest way to move around the program.
All speedkeys available are tabled in the back of this manual and can also be displayed by
pressing F1 while any chart is on screen. To remove this display press ESC. Note that this is
the only F1 popup menu where the mouse will not activate the functions displayed because
they refer to operations accessible only from other parts of the program.
Keeping your program up to date
Insight Trader is being constantly upgraded to produce new versions with additional
enhancements. The latest version is also being constantly updated and these updates are
available free and automatically over the internet with a simple click on the Spiderweb button
on the main toolbar or from the main menu item Utilities/Update from web. Access this
regularly to download any updates that might be available.
25
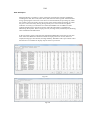
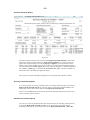
Date Convention Used in Insight Trader
Insight Trader has been extensively tested for Year 2000 compliance. However, for speed of
data input there is an option for a two digit year representation for dates before the year 2020.
For example a user would specify 251214 for Christmas Day in 2014 and 251200 for
Christmas day 2000.
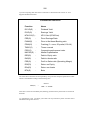
Depending on your preference for manual data input, you can either use the long date format
25122000 or the short date format as follows:
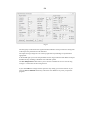
Date Representation
Long Date
Short Date
25121890
25121899
2512Z0
2512Z9
The 1890's use Z for the decade
25121900
25121909
2512A0
2512A9
The 1900's use A for the decade
25121910
25121919
2512B0
2512B9
The 1910's use B for the decade
25121920
25121943
251220
251243
The dates 1920 to 2019 require the
normal character for the decade
25121999
25122000
25122019
251299
251200
251219
25122020
25122050
25122020
25122050
Between 2020 and 2050 the shortdate
representation is equivalent to the long
Note that the ZAB characters will rarely if ever be utilised by most users
Insight Trader Special Edition - ITSE
Insight Trader Special Edition is a version of the program designed specifically for those
users who do not require sophisticated charting functionality and is therefore ideally suited to
fill the need for a fully functional standalone portfolio manager if this module has been
included. It can also be used for scanning the market if the systems tester is purchased as an
option but to get the most out of its capabilities full charting functionality is recommended.
ITSE charting is limited to linear bar charts or line charts and they cannot have constructions
such as trendlines or indicators nor can they be saved. For this reason the second half of
Chapter 1 and all of Chapters 2, 3, 4 and much of Chapter 5 are not applicable to ITSE.
Chapters 9, 10 will be applicable where the specific optional module has been purchased.
If at any time you wish to upgrade your ITSE program to full charting capability it is only
necessary to phone for a new registration number and the full power of Insight Trader
charting can be enabled instantly.
26
How do I use IT
Downloading the data
The first step is to input the price and volume information for the securities that you are
following. You can download end of day data via the internet directly from within IT by
simply specifying the command line option for the software of the data service of your
choice in one of the configuration dialogs. Alternatively, you can choose to input data
manually yourself from the newspapers and we have provided a special utility to speed this
process. Should you wish to chart intraday then you can access your data from a source such
as Commsec that supplies snapshot data during the day.
Housekeeping the database
For those users downloading a large number of securities or the whole of the ASX, an ASX
Database Manager subscription is available. This enables you to automatically perform the
regular, and otherwise tedious, housekeeping chores on your ASX database to keep it
properly organised following issues, splits, reconstructions, premium and capital returns,
name changes and new listings and delistings. It will also insert the fundamental information
such as DPS, EPS, NTA, franking, shares on issue, market capitalisation, debt to equity. You
are also alerted to any forthcoming dividends. See Chapter 8 for more details.
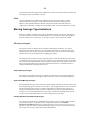
Charting the data
Secondly you will want to view this data in the form of charts and analyse it utilising the
powerful tools provided in the Insight Trader armoury. The basic philosophy behind
technical analysis is that patterns in past price and volume activity provide a guide to future
price performance.
Filtering the database
Thirdly you might wish to undertake a systems analysis of your database. You can construct
“systems” consisting of sets of buy and sell criteria involving technical indicators such as
moving averages, RSI etc together with fundamental criteria such as dividend yields, price
earnings ratios and price to net asset backing. You may wish to get the program to trawl your
database to identify all those securities currently satisfying the criteria that you have
specified. Alternatively, you may wish to use these buy/sell criteria to run a profitability test
on a single security over a period of historical data to see what profit you would have made
had you traded according to these rules.
Keeping track of your transactions
Finally you will want to keep track of all the buy/sell transactions you make, the dividends
you have received, charges and taxes to allow the Portfolio Manager to calculate the value of
your portfolios now or at any time in the past, chart its equity curve and to monitor its
profitability against specific benchmarks.
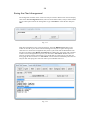
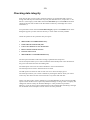
Storing your electronic documents for easy retrieval
You can easily store and automatically access files such as Word Processing and PDF
documents, contract notes, bank statements, spreadsheet files, emails, shortcuts, links to
webpages and image files of scanned paper documents. In fact you can store any type of file
that you require.
Start simply
In the beginning you should not attempt to use all of the many tools available simultaneously.
Instead, try to use the program in a basic way initially, gradually working your way into the
more advanced features over a period of time as you accumulate experience.
27
Technical Analysis and Market Trading
Although this manual will introduce you to some of the basics of charting and technical
analysis its main purpose is to show you how to operate the program. It is not intended as a
course in charting and technical analysis. This information can be found in books such as
those in the reading list at the end of the manual and is also available in courses given by
specialist providers.
It is important to realise that market trading is a risky undertaking and that profits are not
easy to generate consistently. Careless market trading, especially of futures, can quickly lead
to personal financial ruin.
Strategies for market trading should include:
Sound analysis of the markets
Careful attention to good principles of risk and money management
Self discipline and a realistic understanding of your own personal psychology.
There is a compelling argument that the final element may be the most important of the three.
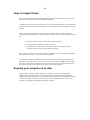
IT is Easy to Use
To start WinIT from the Insight Trader Group Window, double click the WinIT32 icon.
Alternatively click the Start button, then Programs, then Insight Trader group and then
WinIT32. The program will load and you will be presented with a message box asking you to
consent to the terms of the licence agreement. Press “Y” to accept and you are now ready to
go.
To exit Insight Trader at any time you can use the standard windows procedures of clicking
either File/Exit from the menu, the Exit toolbar button or the X in the top right hand corner of
the screen.
What follows in the remainder of this chapter is an introductory tutorial to help familiarise
you with the most common operations in the program. Later chapters examine these aspects
in greater detail as well as describe some of the more advanced features of the software.
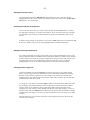
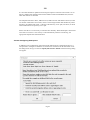
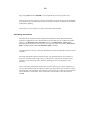
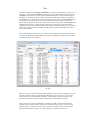
Screen Layout
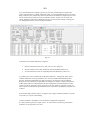
The first thing you will notice is the menu at the top with the main toolbar just below.
Underneath the toolbar is a large blank rectangular area where your charts will appear and
can be managed. Each button in the toolbar represents a commonly used function in the menu
and provides direct access to that function with a single click of the mouse.
28
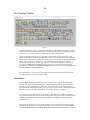
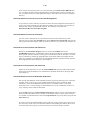
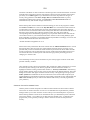
Fig 1.2
The diagram above shows each toolbar button numbered. The function of each button so
designated is indicated below. This key should be used as a general reference guide for the
manual but does not need to be examined in detail now.
1 - Quick chart current security
4 - Slideshow of saved charts
7 - Time constants
10 - Data mgt Load/erase/merge
13 - Risk Calculator
16 - Cascade charts
19 - Arrange alphabetical
22 - Activate next chart
25 – Print arrangement of charts
28 – Spider Web update
31 – Zoom out from RH
34 – D/W/M rotate
37 – Show Pfolio trades & data
40 – Notepad Alarms Fundmntals
43 – Xit Insight Trader
2 - Add new chart
5 - List highlights
8 - View data records
11 - New directory
14 - Load system
17 - Vertical tile
20 - Arrange by Velocity
23 - Overlay charts
26 – Convert Today file
29 – Zoom out full range
32 – Zoom in to RH edge
35 – Log/linear toggle
38 – Data for last bar
41 – Document store
3 - Replay saved charts
6 - Autorun highlights
9 - Save data file
12 - Load Portfolio
15 - Blank screen
18 – Horizontal tile
21 - Arrange by Behaviour
24 – Save charts arrangement
27 – Datacapture
30 – Zoom out fully RH edge
33 – Zoom fully in toRH edge
36 – Bar/Candle/Line rotate
39 – Scroll data box
42 – Help
You can remove any main toolbar button (except the Exit button) that you do not require by
holding down the Shift and Control keys and then clicking that button. You can restore all
buttons to the toolbar by holding down the Shift and Control keys and then clicking the Exit
toolbar button. Buttons so removed will remain hidden even when the program is restarted.
Utilities available
Under the Help menu you will gain easy access to a Calculator and Notepad to assist your
work if these are options you have installed with your Windows operating system. From the
Utilities menu you have available amongst other things a COMMAND prompt.
In addition to these there are under the Utilities menu three user configurable options - First
user file, Second user file and Third user file - that activate the batch files 1YOURS,
2YOURS and 3YOURS which users can set up for their own purposes.
Keep both your software and the Database Manager updated for the latest changes via the
Web by clicking the Spiderweb toolbar button or choosing Utilities/Update from web.
29
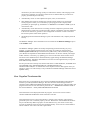
Lets Chart
This section has been designed to briefly introduce you to the more common operations in
the program. More detailed explanations of these and other functions will be given in later
chapters.
When WinIT starts up it loads a security file known as the default file. You can set this to be
whatever you like but the factory setting is CSL.
Just pass the mouse cursor over the first button from the left on the toolbar and in a little
window beside the cursor you will see Quick chart current security. Now move the cursor
over the other buttons on the toolbar and you will see a short description of each of their
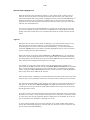
functions. Go back to the first button and give it a single click with the left mouse button. A
window will appear on screen with a weekly bar chart of CSL, the default file currently
loaded. Now place the mouse cursor over the bottom RH corner of the chart and drag it down
and to the right before releasing it. The chart will be stretched to a larger size. Then drag its
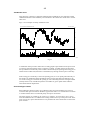
title bar to move the whole chart to a different position on the screen.
If you click on the maximise button (centre button on the top right hand corner of the
window) the chart will fill the working area. If clicked again this button will cause the chart
to be restored to its original position.
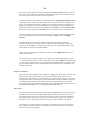
Fig 1.3
If at any stage you accidentally click the left mouse button on the chart proper the screen will
change to “chart edit mode” (to be explained later) filling the screen completely as shown
above. To exit from chart edit mode click x at the top right hand corner of the window.
In Chart Edit mode if you place the cursor over any bar it will display in the window’s
caption bar the position of the cursor as well as the open, high, low, close and volume values
for that date.
30
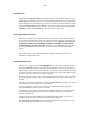
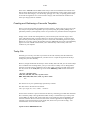
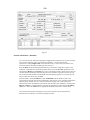
The Floating Toolbar
Fig 1.4
Next place the mouse cursor over the chart itself and press the right mouse button. A second
toolbar, the floating toolbar, will then appear which can be dragged by its titlebar anywhere
on the screen. The various buttons are grouped under functional headings.
Again placing the mouse cursor over any button will indicate its function but now in the
titlebar of the toolbar. Click on the third button of Chart types and the toolbar will disappear
and the chart will change to candlesticks. To bring the toolbar back just click the right mouse
button when the cursor is over the chart. You could change this back to a bar chart by
pressing the second button of Chart types. However, we will use speedkeys instead so for
now press the Splat button (third button of Exit options) to remove the toolbar without
performing any other function. Right Clicking anywhere on the grey area of the toolbar will
have the same effect as the Splat button.
The functionality of 15 of the most commonly used floating toolbar buttons has also been
provided on buttons 29-40 of the main toolbar.
Speedkeys
Press the B key on the keyboard and the chart will return to its original bar chart display.
Press C and it will go back to candlesticks. A menu of these speedkeys can be accessed at
any time by pressing the F1 key. Try this now. A list of speed keys will appear which are
also tabled in the back of this manual. You will see B - bar chart and C - candlesticks the two
speed keys we have just used. The ESC key will remove the list of speedkeys.
So you can access the same functions via menus, toolbar buttons or speedkeys. Speedkeys
are practical and generally the fastest but will take a little more time to learn. Therefore most
experienced users employ speedkeys where available in combination with the mouse for
other operations.
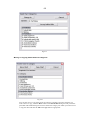
Again place the mouse cursor over the chart and press the right mouse button to bring the
floating toolbar back again. Click the second button of Volume indicators to add the OBV
indicator to the subchart of the window. Bring the floating toolbar back once more and click
31
the fourth button of Subchart indicators to select RSI for the subchart and we will add RSI to
the subchart after accepting the default time constant.
To remove any indicator from the subchart simply position the mouse cursor opposite the
indicator to be removed in the right hand margin of the chart (to the right of the vertical price
axis) and click the right mouse button.
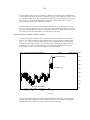
Fig 1.5
Bring the floating toolbar back yet again and click the sixth button V of Axes to toggle the
subchart and all its indicators off. Then from the floating toolbar again choose the first button
Vol of Volume indicators to add volume to the subchart so again have our bar chart with
volume.
To change the time display of the chart press M for monthly and the chart will change to a
monthly display. Press W and it will change back to weekly. Press F6 to zoom in and F6
again to zoom further in. Pressing F5 will allow you to zoom back out. There are many ways
to zoom the charts which we will explore in detail later.
Press G key to toggle a grid on and off your chart or use button 4 of Axes on the floating
toolbar
Press F key to toggle between logarithmic and linear axes on your chart or use button 3 of
Axes on the floating toolbar or button 36 of the main toolbar.
32
Displaying the data for any day
If you press Ctrl J (or click button 5 of Data display on the floating toolbar or button 39 of
the main toolbar) you will enter the chart edit window (to be discussed in the next section)
and a vertical cursor and data box will allow you to see the prices for any day by moving the
mouse around to the desired date. The price level of the arrow cursor is also shown in the
caption bar of the data window. Ctrl J will toggle you out again back to the front screen or
just Right Click on the mouse.
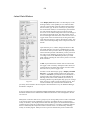
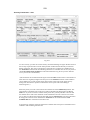
The Chart Edit Window
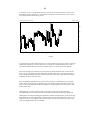
Now click on the chart itself with the left mouse button and the chart will expand to fill the
whole screen with a status bar below.
Fig 1.6
This is called the chart edit window as it allows you to draw trendlines and other structures
such as cycles and text with maximum accuracy. Click on the right mouse button and the
same toolbar will reappear with all these Drawing tools grouped together. The function of
each button so designated is indicated below. This key, listing the various functions
available, should be used as a general reference guide for the manual but does not need to be
examined in detail now.
Remember, placing the mouse cursor over any button on the floating toolbar will indicate its
function in the titlebar of the toolbar.
33
Fig 1.7
Chart Types
Display
2 – Reset Y scales
3 – Log/linear
4 – Grids
5 – Log/linear Vol
6 – Subchart
7 – Overlay
8 – Lock Y scales
1 – Line chart
1 – Daily
2 – Bar chart
2 – Weekly
3 – Candlesticks
3 – Monthly
4 – Point and figure
5 – Equivolume
Axes
6 – Equicandles
1 – Reset X scales
7 – Gann Swing
_____________________________________________________________________
Hide
Zooming
1 – Hide issue/splits line
2 – Hide chart
1 – Full Zoom out
2 – Zoom out
3 – Zoom in
4 – Zoom out lock right
5 – Zoom in locked right
6 – Zoom last few days
7 – Lock dly wkly mthly
Compression
Paging
1 – Page to beginning
2 – Page left
3 – Page right
4 – Page to end
1 – Daily compression
2 – Weekly compression
Event
3 – Monthly
compression
1 – Event
_____________________________________________________________________
8 – MACDhistogram
16 – Williams %R
9 – DMI +/-DI ADX
17 – Bollinger %b
1 – Momemtum
10 – ADX/ADXR
18 – Bollgr Band width
2 – Detrend
11 – Coppock
19 – Trend
3 – Movg avge oscillator
12 – Average True
20 – LRGR
4 – RSI
Range
21 – SROC
5 – Stochastic
13 – Rate of Return
22 – Money Flow Index
6 – Slow stochastic
14 – Money Flow
23 – Velocity
7 – MACD
15 – Elder Ray
24 – Behaviour Index
_____________________________________________________________________
Subchart Indicators
Volume Indicators
Moving Averages
1 – Volume
2 – On balance volume
3 – Volume accumulatn
4 –Volume/price trend
5 – Force Index
1 – Single Moving Avge
2 – Multple Moving Avs
3 – Regression line
Stop Indicators
1 – Parabolic SAR
2 – Chandelier Exit
3 – Scaffold Exit
Range Indicators
1 – Bollinger bands
2 – Mov Av envelope
3 – Line Linear Regrssn
Remove
1 – Remove main chart
indicator
34
_____________________________________________________________________
Drawing Tools
Shapes
Detection
1 – Lines
2 – Text
3 – Cycles
4 – Fib/Gann Retrace
5 – Fib/Gann fans
6 – Fib time projections
7 – Fib price projections
1 – Arrow
2 – Rectangle
3 – Round rectangle
4 – Ellipse
1 – Divergence
2 – Reversals
3 – Pivot points
Exit Options
Data Display
1 – Time constants
2 – Notes for security
3 – Display data box
4 – Extended databox
5 – Moving Databox
1 – Save edited chart
2 – New security
3 – Remove toolbar
4 – Exit chart editing
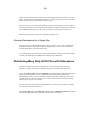
Creating Structures such as Lines, Fans etc
Move the cursor to button 5 of Drawing tools - Fibonacci/Gann fans. Click it with the left
mouse button then select Fibonacci in the dialog box that appears.
Fig 1.8
Position the mouse cursor at the starting point for the fan and click the left mouse button.
Move the cursor to the right and locate the second point for the fan and click the left mouse
button again. You can then move the cursor away to leave the fan in position. However, it
can still be moved by dragging its reference points. Dragging involves holding down the left
mouse button while moving the mouse to a different position.
Now bring the mouse cursor back near the first or second point and drag it to position it more
accurately. Both reference points can be repositioned in this way. To drag the whole structure
bodily, position the mouse cursor to a point more or less midway between the two reference
points and drag. The whole fan will move bodily.
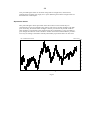
Fig 1.9
After positioning the fan to where you want it to be click the right mouse button to bring up
the Choose colour dialog box. First select whether you want the line to be solid, dotted or
35
dashed and then click on a colour for the fan. This will set a copy of the fan in the current
position.
Now press the right mouse button to retrieve the floating toolbar and click the Save button
(first button of Exit options). You will be returned to the main screen and the chart of CSL in
the window will be updated with the fan that we have just constructed.
Try this same operation again but selecting Lines mode (first button of Drawing tools) to
allow you to draw trendlines instead of fans.
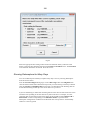
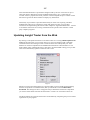
Adding Charts to the Working Area
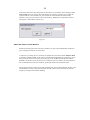
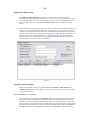
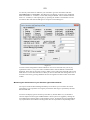
To add another chart in a separate window to the working area, click on the second button
from the left on the main toolbar “Add new chart” and a dialog box will appear. (Pressing the
speedkey +/= achieves the same result.) Click on the Select button and the box on the right
will display all the files in the directory. Select one by clicking on it and press OK. A second
chart will appear in its own window in the working area. Keep adding charts in this way until
you have a total of 6 on the screen. Then press the close button to close the dialog box.
Charts added in this way inherit the characteristics of the currently active chart - displaying
the same chart type and indicators etc as the original.
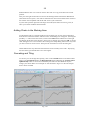
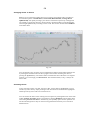
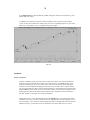
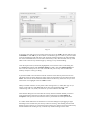
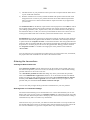
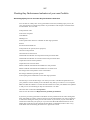
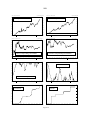
Cascading and Tiling
To see how you can arrange these quickly, click on the Cascade button on the main toolbar.
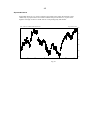
Then try the Vertical tile button, the Horizontal tile button and finally the Arrange charts
alphabetically button. You will see immediately the effects of these different ways to
arrange your charts. Below is an example of four tiled charts. Fig 2.15 in the next chapter
shows charts cascaded.
Fig 1.10
36
Saving the Chart Arrangement
The arrangement of charts on the screen can easily be saved to disk for later retrieval. Simply
click on the Save Arrangement button, button 24 on the main toolbar, and you will be asked
to type a descriptive title for the arrangement. Type “Test charts” in the edit box and press
OK.
Fig 1.11
That chart arrangement is now saved for posterity. Press the Blank screen button on the
toolbar to clear all of your charts from the working area and you are again starting with a
clean slate. To retrieve the arrangement that you have just saved click the third button from
the left on the main toolbar Replay saved charts and a dialog box will appear with a number
of titles of saved arrangements. If you see your title there “Test charts” double click on it
and your six charts will be restored just as you saved them. If you do not see your title just
start typing the first few letters of “Test charts” into the edit box immediately above the list
and your title will spring into view from where you can double click on it.
Fig 1.12
37
Changing the Active Chart
At any one time a specific chart known as the “active chart” will have “the focus” ie its title
bar will be highlighted. Look at your chart arrangement now to determine the one that is
active. If you click on the Windows submenu of the main menu you will see the list of chart
titles at the bottom of the submenu. One of these is ticked and you will notice that it is the
same one as your active chart.
Clicking on any one of these titles in the menu list will highlight that window and make it
active, bringing it on top if it is overlapped by other windows. Alternatively, clicking on the
title bar of any actual chart window will achieve the same objective. Pressing the left or right
arrow keys or clicking on the Next chart activate button 22 on the main toolbar will activate
each chart in turn.
Maximising Charts and Activating in Sequence
If you click on the maximise button of any chart, ie the central button in the group of three at
the top right hand corner of its window, it will cause the chart to fill the whole working area
of the screen covering all the other charts. Then press the left arrow or right arrow keys to
cause each of the other charts to be maximised in turn. The Activate next chart button 22 on
the main toolbar will perform the same function as the right arrow key. Now press the restore
button on the same line as the main menu to restore the maximised chart to its original
position.
The active chart at any time can also be maximised or restored to its unmaximised position
by pressing the up arrow and down arrow keys respectively or by clicking the centre button
in the top right hand corner of the window containing the chart.
Refreshing Charts
Pressing ENTER from the front screen will refresh all charts in the current arrangement and
update them with any data such as additions to the database as well as transferring any global
formatting such as hiding or revealing detailed data and extending or reducing alarm lines.
Printing Chart Arrangements
If you wish to print the arrangement of charts select the Print arrangement button on the
main toolbar. Do not print charts whose windows are overlapped (unless one of them is
maximised) as the result will not be satisfactory. Before printing your charts you are given
the opportunity to enter a caption which will appear at the bottom of the printed chart and
then you are asked to specify whether you require portrait or landscape orientation.
Remember to press the Apply button before exiting this dialog box to ensure that your
changes are properly established.
38
Quick Template
The menu item View/Quick Template allows you to instantaneously pull up the first saved
chart arrangement in the current category. The speedkey for this is Alt+Q. If you have
created a favourite template as a saved chart, or say a chart arrangement of all your portfolio
securities, then you can access this immediately via Alt+Q at any time. It will not alter the
position of the cursor in your list of saved charts. Make sure that this template/chart
arrangement always remains in the first position, say, by adding a couple of spaces in front of
its title.
Exiting Insight Trader
There are many ways to exit Insight Trader. Click on button 43 of the main toolbar, choose
File/Exit from the main menu, press the speedkey Alt X, click the x button in the top right
hand corner of the main Insight Trader session window or press Alt F4.
Summary
Congratulations! You now have a basic understanding of how to construct charts of different
types, size their windows, add indicators, draw lines, arrange many charts on the screen, save
and retrieve these arrangements, change the active chart, maximise charts and print an
arrangement of your charts to your printer.
You are now ready to start serious work.
39
Chapter 2
Charting
Overview
What is a chart
Charting is a technique for displaying numerical data in a visual format that allows a much
more rapid and insightful interpretation of its significance than is possible with say just a
table of numbers. Charts are the basis of technical analysis. This overview section describes
what functionality is available in the program. A later section will detail the operations
required to achieve the various effects.
Charts can be:
Created from scratch using custom settings specified by the user
Created from an existing template of settings
Saved to disk as a single chart or as a screen arrangement of several (up to 506) charts
together
Retrieved or replayed from disk if previously saved with all original settings and
constructions but updated with any new data
Subjected to various techniques of technical analysis
Overlaid on one another
Run as a slideshow (i) of saved charts or (ii) using a chart template on a list of securities
Printed with large numbers of charts per page
What types of Charts can I Use
There are eight basic chart types in Insight Trader:
1. Line charts
2. Bar charts
3. Candlestick charts
4. Point and figure charts
5. Equivolume charts
6. Equicandle charts
7. Gann swing charts
8. Scatter diagrams
These will now be discussed in detail.
40
Chart Types
Bar Chart
84SPI2 - Day Time Share Price Index >
D @ D 011013-110414
5600
5500
5400
5300
5200
5100
5000
4900
18M
Vol = 1,994,700
0
OCT
NOV
DEC
JAN
FEB
MAR
APR
2013
2014
Fig 2.1
A bar chart consists of a main price chart and a volume subchart. It is displayed in the form
of separate vertical bars, one for each time period say monthly. Fig 2.1 shows a daily bar
chart for the SPI (Share Price Index futures). In the upper price chart you will notice a tick to
the left and a tick to the right of each bar. The top of each bar represents the high price for the
day, the bottom the low price, the tick to the left is the opening price for the day and the tick
to the right is the closing price.
In the subchart there is a simple vertical bar, the height of which represents the volume or the
number of securities traded on that day. For commodity futures markets such as the SPI
where open interest is available (ie the number of contracts currently open) a line plot of this
open interest is displayed going from the left to the right overlaying volume.
Bar charts for weekly and monthly periods are also frequently used.
Coloured bar charts are the same as normal bar charts except that bars that close higher than
they open are coloured differently (say green) from bars that close lower than they open (say
red) in a similar way to candlesticks.
41
Line Chart
A line chart is a chart where individual prices (usually the close) for each day are joined with
a single line. This type of chart is simple and filters out the intraday volatility to give cleaner
presentation of the data.
ANZ - AUSTRALIA & NEW ZEALAND BANK >
D @ D 040111-110414
3600
3400
3200
3000
2800
2600
2400
2200
2000
1800
50M
Vol = 3,945,200
0
J F M A M J J A S O N D J F M A M J J A S O N D J F M A M J J A S O N D J F M A M J J A S O N D
2011
2012
2013
2014
Fig 2.2
Line charts are also used for relative strength and rebased displays. A line chart format must
be used for the regression analysis.
42
Candlestick chart
This chart type is based on a Japanese technique that is hundreds of years old and is called
candlesticks because of the similarity of its elements to the outline of a candle with a wick at
either end.
Fig 2.3 is an example of a daily candlestick chart.
TLS - TELSTRA CORPORATION LTD
011113-110414
530
520
510
500
490
70M
0
NOV
DEC
JAN
FEB
MAR
APR
2013
2014
Fig 2.3
A candlestick chart provides a much more visually graphic representation of the price action
of a security than the usual bar chart to which it is related. A candle replaces the bar where
the top and bottom of the body of the candle is determined by the opening and closing prices
and the wick at either end (referred to as the shadow) by the high and low prices of the day.
If the closing price of the day is above the opening price (ie it is an upday) then the body of
the candle is an unfilled rectangle bounded at the top by the high and at the bottom by the
low. If the closing price is below the opening (ie it is a down day) then the rectangle is filled
(usually black or red). Candles and patterns of candles are given quaint names and have
associated technical implications.
Point and Figure Charts
Point and figure charts provide a way of filtering out lower level fluctuations in prices to
reveal the main price movements. With this type of chart there is no consideration of volume
or of time and the chart is constructed purely from price movements.
The chart consists of columns of X’s and O’s (or squares). As prices move up to a given
level then additional X’s are added to the existing column of X’s up to that price level. If the
price reverses by a preset amount then O’s are plotted in the next column down to the lowest
price reached.
43
A “boxsize” or price increment for each X or O must be set before the chart is drawn. Also
the number of boxes (usually 1 or 3) required to establish a reversal and start a new column
in the opposite direction must be preset.
BHP - BHP BILLITON LTD 10x3
010813-110414
4000
3900
3800
3700
3600
3500
3400
S
D
M
14
Fig 2.4
A point and figure chart of more than 1 box reversal cannot have both X’s and O’s in the one
column but a single box reversal chart can. It is important to understand that a new X or O
can only be added if the price moves by a full box above or below the last box plotted.
Since it is the high price and the low price for the day from which the chart is constructed
there is no way of seeing from the chart where the last closing price is. Insight Trader has
overcome this problem by placing a small horizontal tick just to the right of the last column
indicating the level of the last close.
Since choosing an appropriate box size for a given security is something of an art, Insight
Trader allows you to specify an automatic box size and the program will choose this value
for you. The value supplied should be regarded as a starting guide only which the user may
need to refine later.
Although time as such is not used in the construction of this type of chart the times
corresponding to the various boxes that are plotted are indicated along the horizontal axis.
Although the normal point and figure calculation is based on high and low prices for the day,
if high and low are not available then point and figure will be calculated on the close or any
other set of values you might specify. If you wish you can force the chart to use close only,
even if the high and the low are available.
44
Also point and figure charts can be drawn using relative strength close, rebased close,
rebased relative strength close, high, low or open. (Rebasing and relative strength charts are
discussed later in this chapter.
Equivolume Charts
Like point and figure charts equivolume charts do not have a time axis but they are
constructed as a series of rectangles lying side by side. The top of each rectangle is the high
price for the day, the bottom of the rectangle is the low price for the day and the width of
each rectangle is proportional to the volume for the day. Equivolume is a way of looking at
price changes as a function of the cumulative number of securities traded and does provide a
novel way of looking at the market. Weekly and monthly equivolume charts are also used.
CBA - COMMONWEALTH BANK
010813-110414
8000
7900
7800
7700
7600
7500
7400
7300
7200
7100
7000
S
O
N
D
F
14
Fig 2.5
M
A
45
Equicandle Charts
Equicandle charts are very closely related to equivolume charts where the thickness of the
candle body is proportional to the volume traded for that period. However, in place of the
high/low rectangle we have a candle with its corresponding body and shadow.
WBC - WESTPAC BANKING CORPORATION LTD >
D @ D 020913-110414
3500
3400
3300
3200
3100
3000
O
N
D
F
14
Fig 2.6
M
A
46
Gann Swing Charts
Gann swing charts like point and figure charts are a technique for filtering out “noise” so that only the
major movements are indicated. Swing charts can be based on time swings, price swings or a
combination of both time and price. Time swings can be specified as one or more periods while the
price filter can be specified in either absolute price units or % price units. For a time swing chart the
prevailing swing is reversed if the price moves in a direction against it for the specified number of
time units. For a price swing chart the prevailing swing is reversed if the price moves in a direction
against it by at least the number of price units or the %price specified.
Inside days and outside days require specific consideration and there are several different ways of
treating these situations.
Depending on the amount of data to be plotted the chart will be either the rectangular display as
shown below or the alternative sawtooth representation.
ANZ - AUSTRALIA & NEW ZEALAND BANK >
Swing 1 period
D @ D 010812-110414
3600
3400
3200
3000
2800
2600
2400
2200
S
O
N
D
F
M
A
M
J
J
A
13
S
O
N
D
F
14
Fig 2.7
M
A
47
Scatter Diagrams
Instead of a chart of lines joining data points a scatter diagram is a chart of data points each
individually marked by a cross, square, triangle, plus asterisk or even a vertical histogram
bar. This produces a scatter of points on the screen and hence the name scatter diagram.
Unlike bar and candlestick charts, a scatter diagram or even a line chart is not restricted to
having the horizontal axis as time. The chart below shows a scatter diagram of the gold price
as a function of the silver price over a given period of time.
SecGRate vs PfoGRate - for Pfo <Gold> from 08/10/12
D @ D 011013-280314
64
62
60
58
56
54
52
50
48
46
44
42
40
38
20
21
24
25
26
27
28
31
1
2
3
4
7
8
JUN 1971
MAY
Fig 2.8
Other Display Options
Although the above seven chart types are the basic formats in which data is displayed there
are two additional options for displaying data in line and point and figure charts that should
be mentioned now.
48
Relative Strength
A relative strength chart is simply a plot of the ratio of the closes of one security to those of
an index or even another security for each date in a range. This ratio value can be plotted in
the form of either line chart or a point and figure chart.
RHC/XAO - RAMSAY HEALTH CARE LTD
D @ D 010812-110414
1
0.9
0.8
0.7
0.6
0.5
A
S
O
N
D
2012
J
F
M
A
M
J
J
A
S
O
N
D
2013
J
F
M
Fig 2.9
Relative strength is most often used to assess the strength of a particular security relative to
the broad market index eg the All Ordinaries Index or a subsector index eg the Banking
Index.
A
2014
49
Rebased Charts
Charts can be rebased or rescaled such that they all commence from the value of 100. This
makes it very easy to compare relative performance of one stock with another as they both
start off from the same point on the left hand side of the chart. Subsequent individual price
action will generally cause them to diverge. It is common to overlay two or more of these
charts on the one screen to allow direct comparison of their performances.
TLS TPM
D @ D 030112-110414
600
500
TPM
400
300
200
TLS
100
0
J
F
M
A
M
J
J
A
S
O
N
D
2012
J
F
M
A
M
J
J
A
S
O
N
D
2013
J
F
M
Fig 2.10
It is possible to combine both relative strength and rebasing to get a rebased relative strength
chart. Like relative strength, rebasing can be displayed on either a line chart or a point and
figure chart.
Scales
Logarithmic and Linear Axes
The displays shown so far have utilised what is known as a linear vertical axis where the
distance representing a given price increment, say 1 cent, remains constant over the whole
chart. However, there is another type of scaling called logarithmic where the distance
representing a given price increment reduces as the total value increases. A valuable
characteristic of logarithmic axes is that a given vertical distance on the chart from any
particular price level represents a fixed proportion of that price.
A
2014
50
SHL - SONIC HEALTHCARE LTD > -0.8% -14 to 1791 Ex Div 280214 27c (45%)
D @ D 060990-110414
2000
1000
900
800
700
600
500
400
300
200
100
90
80
70
60
50
40
30
20
10
9
8
7
6
5
4
3
90
91
92
93
94
95
96
97
98
99
00
01
02
03
04
05
06
07
08
09
10
11
12
Fig 2.11
For example a doubling of the price from 10 cents to 20 cents will occupy the same distance
as a doubling in price from 20 cents to 40 cents or from 40 cents to 80 cents and so on. This
is a very convenient way of viewing securities whose price varies over a wide range or when
viewing long term charts where the decrease in the value of money amongst other things
causes a progressive and exponential increase in the price of a security or index.
All chart types except point and figure can be displayed as logarithmic. Line charts and
scatter diagrams can have the horizontal axis as well as the vertical axis logarithmic.
Grids
Horizontal and vertical grids as shown in Fig 2.11 can be toggled on or off the charts.
Daily, Weekly and Monthly Displays
Bar, candlestick, equivolume and equicandle charts can be displayed as daily, weekly, or
monthly from a file of daily data. The information for each of these periods is accumulated
during the charting process and plotted as a single object eg bar, candle, rectangle etc.
However, the underlying file remains as a daily file and any indicators such as RSI or
moving averages will be calculated as daily indicators even though the bar chart displays as
monthly or weekly.
Should you wish you can actually compress the file in memory to weekly or monthly and any
indicators and any indicators will now be calculated on the basis of the compression state eg
weekly or monthly.
13
14
51
Zooming
When any chart is displayed it is possible to zoom in and out to include less or more data as
required. You can zoom out to cover as much as one century on the horizontal axis or zoom
in to include as little as one day. Several techniques can be employed to zoom your charts.
Automatic and Fixed Scaling
Scaling on the horizontal and vertical axes can be left free to adjust automatically to
encompass the data you are attempting to plot or you can specify fixed limits for both axes.
In addition to this you can set up a “running time window” to show for example the last 100
days. If this chart is saved and retrieved at any later date it will continue to show the last 100
days from the date it is retrieved. Should you wish to do so you can also set “white space” on
the right hand side of the chart to allow room for projecting trendlines etc.
SHL - SONIC HEALTHCARE LTD > -0.8% -14 to 1791 Ex Div 280214 27c (45%)
D @ D 011113-110414
1900
1800
1700
1600
1500
NOV
DEC
JAN
FEB
MAR
APR
2013
2014
Fig 2.12
Presentation of Charts
The charts described above can be presented to the user in several ways.
Single Charts and Multiple Chart Arrangements
A chart can be shown as a single chart in one window on the screen or as one of a group of
several (up to 506 - each in its own separate window) charts together on the one screen.
52
Overlaid Charts
Any charts which have been constructed in windows on the same screen can be overlaid on
one another. Only the scaling applicable to the first chart will be shown and subsequent
charts will be automatically assigned distinguishing colours.
Viewing Charts
Each chart or arrangement of charts can be viewed as a standalone static display or as part of
a moving slideshow of many chart arrangements viewed consecutively. Such slideshows can
provide a very time efficient way to view and assess large amounts of data in a relatively
short time.
Replay Slideshow
The first type of slideshow is the replay slideshow where saved charts are displayed
automatically, one after the other with a set time delay separating them of between one and
twenty seconds. This gives you the opportunity to view and assess saved charts presented in
many different formats. Each of the chart arrangements can display many different securities
on the one screen.
The Chart Arrangement Slideshow
Another manually operated form of slideshow is to place all charts, up to a maximum of 506
on a single screen as a chart arrangement. By maximising one of these charts you can then at
leisure manually page through the rest with each individual chart being maximised in
sequence.
Autorun Slideshow
Alternatively you may wish to view a large number of individual securities but displayed
using a fixed template chart arrangement. Although this template can show many charts on
the one screen all such charts will be charts of the same security. It is therefore important to
choose a template where the individual charts, if there are more than one, will show different
aspects of the same security eg a long term candlestick chart, a short term candlestick chart,
point and figure and a chart containing indicators might be suitable.
For this type of slideshow you need to specify a reference list of the securities that you wish
to display. This reference list can be constructed manually in a word processor or can be
generated automatically a number of ways from within the program. For example the
highlight list generated during downloading of daily data is often used as a reference list for
an autorun.
During the autorun the template will display a chart arrangement for the first security on the
list. After the specified time separation the second security on the list is displayed using the
same template and so on. If at any time you wish to tag a security for closer examination later
you can hit a key while it is displayed and it will be appended to a short list known as the tag
list. The list itself can be used later as a reference list for another autorun using the same or
another template.
It is even possible to automatically generate saved charts during an autorun should you so
wish merely by indicating that the next autorun will save the charts automatically.
53
Saving and Retrieving Charts
Charts constructed on screen can be saved to disk for later retrieval with all original settings,
indicators, trendlines etc intact except that the charts will be updated with additional
information that may have been entered into the database.
It is actually chart arrangements, consisting of 1 to 506 windows that are saved to disk. There
are 10 separate categories into which you can save your chart arrangements and each
category can contain up to 10 000 arrangements. Since each arrangement can be 506 separate
charts, the maximum number of individual charts that can be saved is therefore 50 600 000.
Such saved arrangements can be retrieved at any time for inspection and possible
modification before resaving these modifications to disk.
Refreshing Charts
Pressing ENTER from the front screen will refresh all charts in the current arrangement and
update them with any data such as additions to the database as well as transferring any global
formatting such as hiding or revealing detailed data and extending or reducing alarm lines.
Printing Charts
Chart arrangements can be printed in black and white or colour to any printer supported by
Microsoft Windows. The resolution of printed charts can be extremely high, much higher
than displayed on screen. For this reason it is possible to usefully print up to 20 charts per A4
page.
You can also produce enhanced metafiles of charts to import into your wordprocessor
documents. These are vector pictures that can be stretched and shrunk to enable you to
position and size your charts in these documents without loss of resolution.
Viewing Latest Data and Using the Notepad
Latest Data
While a chart is displayed you can access a small window which will detail the latest data for
that security. For a normal security it will show the open, high, low, close, volume and open
interest, change and turnover as well as the derived fundamental information such as
Dividend Yield, Price Earnings Ratio, Price to Net Asset Backing, Franking and other
fundamental data provided the raw information such as DPS, EPS, NAB and Franking have
been entered into the Notepad for that security.
The Notepad
Every security file has an associated Notepad, accessible from the chart, into which you can
enter your freeform notes on that security as well as the raw fundamental information above.
You can also set alarms from within this Notepad to audibly alert you when the price has
fallen below or risen above your stop levels. The price levels of any alarms set are shown on
the charts.
54
Data Window
In addition to these you can access a small window from the Chart Edit screen which will
display data from past dates as a cursor is moved along the chart.
The Undo Facility
There is an undo facility that will allow you to reverse the last 100 changes that you have
made on the current chart. You can actually move backwards and forwards through the
sequence of screen changes that have occurred since you last switched to that window.
Managing your charts
This section will detail the specific operations required to perform the various functions
outlined in the previous section of this chapter. Let us first learn to create and manipulate the
charts we will be using.
Creating and Manipulating Charts
Quickchart Current File
When Insight Trader first opens it automatically loads a security file called the default
security file. This is factory preset to be CSL but it can be changed to be any other security,
from Format at the main menu as will be described in a later chapter.
The quickest way to create a chart is to click once on the first button on the main toolbar
Quick chart current file. A window will appear with a bar chart of the default file CSL.
Pressing this toolbar button is equivalent to clicking View on the main menu and then
clicking the first item on the submenu Kwickchart. This is an example of how toolbar
buttons are identical to menu items but quicker to use. The equivalent speedkey for this
operation is Alt C
If you press this button again you will see that it does not cause another window to appear
but will merely redraw the chart in the current window. The only time that it adds another
window is if there are currently none in the working area. If there is more than one window,
Kwickchart redraws the chart in the window that is currently active - ie the one with the
highlighted title bar.
Chart New Security in the Active Window
If you wish to see another security in the same window simply press the N key (N for New)
and a dialog box will appear requesting you to enter its code. Type in ANZ and click OK or
hit ENTER. This is the easiest way to change the security in the active window. Another way
to achieve the same thing is to take the mouse cursor to the active window and click the right
button to bring up the floating toolbar.
55
If you then click on the third last button on the bottom row of buttons on the floating toolbar
New security, then you will get the same dialog box as before requesting you to input the
required code. It is not necessary for you to know the actual ASX code of the security
because if you type in the name or part of the name eg ‘WESTPAC, but precede it with an
apostrophe, it will find the code for you.
Fig 2.13
Add a New Chart in a New Window
Instead of replacing the chart in the active window you may wish to add another window to
your working area with its own new chart.
A simple way of doing this is to click the second button on the main toolbar Add new chart
or press the speedkeys Alt L or the +/= key and the following dialog box will appear. If you
know the code of your new security then just type in say NAB in the left edit box and hit
ENTER or click OK. If you do not know its code then type in its name or part of its name in
the second edit box (but do not include an apostrophe in this case) and click Select.
The program will then search for all codes matching the name and will tabulate these in a list
below with the security code, name and main activity. These can be sorted on any column
simply by clicking on the column heading.
56
Fig 2.14
Double click the required one and your security will be loaded into memory and charted in its
own new window inheriting the same format and settings of the chart in the previous active
window.
Alternatively if you are sure that the part of the security name that you have typed in will
uniquely select the security that you want then simply hit Enter or click OK (rather than
Select) and the security will be immediately charted.
Note that after the security has been charted the dialog box will disappear. Should you
instead wish the dialog box to remain after charting the first security to allow you to select
more from the list simply uncheck the box Close dialog on acceptance. This option will then
become your default for subsequent sessions.
This dialog box is resizable and can be made narrower by dragging its right hand edge to the
left so as to display only the codes. When charting multiple selected codes the box can then
be repositioned out of the way on one side of the screen from where you can scroll and
double click on codes you wish to chart.
You will have noticed that on the dialog box above that there are five Action radio buttons. If
the first one is selected your security will chart in its own new window. If the second one is
selected then a new window would not have been created and the new security would have
been charted in the active window replacing the existing one. The third one will load the file
into memory without charting it. The fourth one will merge the new file with the currently
loaded one while the fifth one will delete the file from disk.
57
If you wish to see and choose from all securities in the directory then leave the two edit
boxes at the top of the dialog box empty and click Select. The list box will then fill with all
the codes in the directory. Select the one you want, by scrolling to it if necessary, and click
on it to highlight it then click OK (or simply double click it) to load it. The Code to load and
Security name edit boxes can be cleared using the mouse on the Clear button to the right.
Had you instead wished to see only those codes starting with B (or BHP) then type B* (or
BHP*) in the Code to load edit box, click Select and the table below it will display all the
codes commencing with B (or BHP). Double click the one you want to load.
This second toolbar button from the left is equivalent to selecting View
from the main menu and then clicking the item Load security to
chart. However, perhaps the quickest way to add charts is to use the
speedkey +/=. This is the = key on the main keyboard which when
shifted gives +. Hit this key, type in your code or part of the security
name, and then hit ENTER. Repeat this process for as many codes as
you want and windows will continue to be added to the working area
with charts of the chosen securities formatted according to the original
settings.
Charts added in this way inherit the characteristics of the last active chart on screen including
chart type, moving averages, indicators and rebasing or relative strength modes.
Substituting a new security in an arrangement of charts
If you have an arrangement of charts displayed in the working area, for example say six
different chart types with indicators of ANZ and you wish to see this same arrangement of
chart types and indicators but for NAB then all you need to do is press Ctrl N and type in the
dialog box that appears the code of the new security NAB (or if you have forgotten its code
then an apostrophe and its name:
‘National Australia Bank.) This will then substitute the
security NAB for ANZ in all the charts appearing on screen.
If any of your charts are ratios or relative strength plots eg ANZ\XAO then the new security
will be substituted in the numerator position of the ratio.
Adding a Portfolio Equity Curve
To obtain a list of files for all available portfolio equity curves click the button "Pfolio
equity" on the "Add new chart" dialog box to allow you to quickly select a list of available
portfolio equity curve files to chart then double click your choice.
Deleting Charts from the Working Area
Any chart in the working area may be deleted by clicking the x button in the top right hand
corner of its window.
All charts may be cleared from the working area by clicking button 15 on the main toolbar
Clear screen. This is equivalent to selecting Windows from the main menu and clicking the
Blank screen item. The speedkey Alt B also blanks the screen.
58
Arranging Charts on Screen
Buttons 16-19 on the main toolbar allow you to arrange your multiple charts according to
four standard options. Cascade charts, Vertical tile, Horizontal tile, Arrange charts
alphabetically will rapidly rearrange your charts to show them respectively overlapped on
one another to expose their title bars, tiled vertically, tiled horizontally or tiled horizontally
and arranged alphabetically according to ticker code. This can also be done from Windows
in the main menu.
Fig 2.15
You can maximise any one chart of your arrangement to make it fill the whole working area
by clicking the maximise button at the top right of the window containing the chart or
pressing the up arrow key. The restore button if clicked will restore the chart to its original
position or you can simply press down arrow. The maximised chart, if any, is always the
active chart.
Activating Charts
At any time there will be one chart, the active chart, with its title bar highlighted. You can
activate any other chart by simply clicking its title bar which will itself become highlighted
and the previously active chart will “lose the focus”.
You can activate all charts in the working area in sequence by clicking button 22 on the main
toolbar Activate next chart which is equivalent to selecting Windows from the main menu
and clicking Activate next chart. Alternatively, the speedkey option for this operation is to
use the left and right arrow keys on the cursor keypad which will allow you to activate in
both directions.
59
As you do so you will notice the title bar of the next chart activated becoming highlighted.
However, if your chart is maximised as discussed previously then the next highlighted chart
will become maximised replacing the previous one. By maximising one of the charts in your
working area and pressing the right and left arrows, you can very rapidly switch between
maximised views of any of the individual charts in your working area.
Remember the arrow keys are extremely useful speedkeys for manipulating charts on screen.
Left and right arrow activate the previous and next charts respectively. Up and down arrow
maximise and restore the currently active chart.
Generating Reference List of Securities for Foreign Databases
When using foreign databases eg BodhiOne, Metastock or QuotesPlus a list of all (or
selected codes) can be generated from the Load New Security dialog (2nd toolbar button).
When the Select button is clicked the list of codes showing in the table below are written to
the standard list file SELECTED.LST. This list can then be used as the reference list for
filtering in the System tester, autorunning or charting.
Saved Charts
Saving Charts
When you have created a single chart or group of charts (up to 506) in your working area
then you can save this arrangement to disk. When you come to retrieve this arrangement the
windows containing the charts will be restored to their original positions and the charts
themselves will be recreated with all the workings such as indicators trendlines, text that
existed when they were saved. However, any additional price and volume data that have been
received since it was first saved will allow the chart to be updated to the current date.
To save any chart arrangement that you have created press button 24 on the main toolbar
Save arrangement of charts or select Windows from the main menu and click the item
Save arrangement. The corresponding speedkey is Ctrl S. You will then be presented with
a dialog box inviting you to type in a title or description of the chart arrangement that you
will identify it by for later retrieval. Click OK and all is done.
The chart arrangement will be saved into the currently active Category of the ten categories
that are available. These titles will be ordered alphanumerically in the list of chart titles.
Retrieving Charts
To retrieve a chart arrangement from disk select the button 3 on the main toolbar Replay
saved charts or select View from the main menu and click the item Replay saved charts or
simply press Alt R. The following dialog box will appear showing all the titles in the large
list box in alphanumeric order.
60
Fig 2.16
Scroll down to the one you want using the up arrow or down arrow keys, the mouse on the
scrollbar at the right, or start to type the first few characters of its title in the Search title:
edit box and the title you are looking for will spring into view. To load your required title
double click on it or highlight it with a single click and click the chart button above. Your
charts will be reconstructed (or “replayed”) in the working area just as you saved them except
that now they may be updated.
You can also search the list of titles for text fragments such as “BHP” or “weekly” by
clicking on the search button and entering a first search string. You can also enter an optional
second string and it will search the list of titles for any title containing both strings. After the
first match has been found, pressing the Next button will find the next title with a match.
Quick Chart Templates
There is a special saved chart arrangement in each category, which is the very first one on the
list, and you can pull this arrangement up at any time by using the speedkey Alt Q. This is
particularly useful if you frequently wish to see your charts in a particular format
arrangement.
Simply create a saved chart arrangement in your favourite layout with time ranges, chart
types, and indicators that you require and save it into the current category. To ensure that it
goes into first position and stays there just save it with a title commencing with a few spaces.
Whenever you wish to retrieve the template just press Alt Q and your layout will
immediately appear on screen. Ctrl N will then allow you to substitute any other security
code in all windows of your template.
61
Editing Saved Chart Titles
The above dialog box has an Edit title dialog box that allows you to edit the currently
highlighted title. After you have made any changes that you wish click on the Accept edited
title button to save the changes.
Deleting Saved Chart Arrangements
Click on the title of the chart you wish to delete and then click the Erase button. A dialog
box will appear asking you to confirm your intention. If you no longer wish to be prompted
for confirmation press Cancel to silence further warnings for the remainder of the current
session.
To delete a large number of saved charts you can press Alt E. If these keys are held down Alt
E will very quickly remove the currently highlighted chart and others following it.
Editing Previously Saved Charts
Any chart arrangement previously saved to disk can be retrieved and edited in any way and
then saved back to disk in its modified form including the addition or deletion of any number
of charts. When a previously saved chart arrangement is being resaved to disk you are given
the opportunity to save it as a modification of the previously saved one or to add the
modified chart as a new saved chart arrangement to the currently selected category.
Changing Chart Categories
You have available 10 separate categories into which you can save your charts and the
names of these categories can be customised to your requirements eg Industrials, Mining,
Portfolio stocks, Futures, Currencies etc. Each category can contain up to 10 000 chart
arrangements of up to 506 separate chart windows. This makes a total of up to 50 600 000
individual charts that can be saved.
To change to a new category click the Category button in the Saved charts dialog box and a
list of category titles will be displayed in the new dialog box which will appear as below.
Category titles can be edited as in the previous dialog and to change from the current
category to any new category simply double click the title of the chart category or select it
with the mouse and press Change to. The dialog box for Saved charts will change to display
the titles in the new category. To retrieve a chart arrangement in the new category just select
as before.
Note that whenever you save charts elsewhere in the program they will be saved into the
currently active category.
62
Fig 2.17
Moving or Copying Charts between Categories
Fig 2.18
You can also move or copy charts from one category to another. Just select the chart you
wish to move or copy, click the Move button on the Saved chart dialog box and you will be
presented with another dialog box as below. Select the category into which you wish to move
or copy the chart and click the Move or Copy button as appropriate.
63
Cycling Saved Charts
From the Saved chart dialog box highlight the chart title from which you wish to commence
a slideshow. Then click Cycle. The saved charts from that title onwards will be displayed in
sequence separated by a time delay as set from Runslides on the main menu and selecting
the Delay item. Pressing ESC at any time will allow the slideshow to be aborted. Pressing
the spacebar will temporarily halt the slideshow to allow the currently displayed arrangement
to be manipulated and possibly resaved. To recommence the slideshow after this temporary
delay press F9.
Stepping through Saved Charts
If you have retrieved a saved chart arrangement on to the screen from disk then it is possible
to step forward to the next chart arrangement in the list or back to the previous one by
pressing the plus (or spacebar) and minus keys respectively without the need to return to the
dialog box.
Printing Charts
Any chart arrangement can be printed in black and white or colour to a printer supported by
Microsoft Windows by clicking on button 25 Print arrangement of charts on the main
toolbar or choosing File from the main menu and clicking the Print charts item. The
speedkey Ctrl P also performs this function.
You are then given the opportunity to print an optional caption at the bottom of the printed
chart arrangement and then to set up your printer, for example by changing from portrait to
landscape etc, before printing commences.
Importing charts into other documents
If you press the speedkey Ctrl+Shft P instead of Ctrl P the chart in each window will
produce an enhanced metafile in the \WINIT\WORKING\EMF directory with a filename
CHARTnn.EMF where nn is a 2 digit number from 00 to 99. Each new metafile produced
adopts a number, one above the last one produced, until it reaches 99 when it cycles back to
00 overwriting the previous one by the same name. Metafiles are vector pictures of your
charts that can be imported into word processing documents and can be stretched or
compressed to size without loss of resolution.
For example, to import a metafile chart into a Word document select Insert/Picture from the
main menu of Word and browse in the WINIT\WORKING\EMF directory until you have
found your picture to insert.
To reset (ie delete) all EMF files select Utilities/Reset all EMF files from the main menu.
This deletes all EMF files in the current WORKING\EMF folder and resets the numbering
back to chart00.EMF.
64
Latest Data Window
Click Display data box (button 3 of Data display on the
floating toolbar) or the speedkey F12 to obtain the data
relevant to the last date in the file and the background to
the box will be grey. If the F7 or F8 keys are pressed (or
the mousewheel rolled) to scroll the display then the data
box will instead show data relevant to the last period
shown on screen and the background colour will change to
the tooltip background colour. The data window will be
shown in the upper left hand corner of the screen. This is a
toggle which will be switched off by clicking this button
again.Note that Turnover will be described as 'today', 'this
week', 'this month' depending on the compression state of
the file.
Apart from the price, volume, change and turnover data
the global indicators of Velocity and Behaviour are also
shown below and if you have chosen to display Portfolio
trades and other portfolio information you may see listed
the value of your holdings, the profit you are currently
recording as well as the additional purchase you could
make without violating the risk criteria you have set in the
Risk Calculator.
If ESC is pressed then the window will be removed but
the toggle is still on and any subsequent charts which are
plotted will have the latest data window activated. Click
this button at any time to toggle it off.
If button 4 of the Data display group - Display extended
data box – is clicked instead (or button 38 on the main
toolbar, or Ctrl F12 is pressed) then extra information is
supplied. This extra information is the DividendYield,
Earnings Yield, NTA Yield, P/E Ratio, Price/NTA, %
Franking, Market Cap, Moneyflow/day (proxy for average
Fig 2.19
daily $ turnover), Debt to equity and Debt to assets. This
will be available only if the relevant information has
previously been inserted in the F2 notepad as described below or by the Database Manager
described in Chapter 8.
If you are employing User Supplied Extended Fundamental Information using CSV files as
described elsewhere in this manual then additional information will be displayed in the last
two sections.
Moneyflow on the F12 data box is a good proxy for average daily turnover and is calculated
as an average of the last 20 traded days irrespective of whether the file is compressed to
weekly or monthly. Also displayed in brackets after this figure is the minimum MoneyFlow
recorded for any single day in that 20 day period. However, if it used as a subchart indicator
then it is affected by the compression state of the file where it is calculated by summing
weekly or monthly figures. Money Flow for a period is measured as period volume times
65
period closing price and hence the longer the period the less accurately will it reflect true
turnover so daily compression should be used wherever possible. Because Money Flow
varies widely over time, in order to get a better indication of this variation you should view it
as a subchart indicator.
The speed key for the latest data window is F12 and for the extended data window Ctrl F12.
However F12/Ctrl F12 functions can be interchanged so the most frequently used option can
be invoked without also pressing the Ctrl key. From the main menu check or uncheck
'Format/Reverse F12/Ctrl F12'.
Moving Data Window
It is possible to display previous data values directly from the chart by moving the mouse
cursor to the bar corresponding to the date of interest. This facility is accessed from the
Moving Data box button 5 of Data display on the floating toolbar to take you immediately
from the front screen, via the chart edit mode, into the Moving Data Window. Right Click
on the mouse to exit. Alternatively click on button 39 of the main toolbar. Speedkey Ctrl J is
an alternative and toggles between these two states.
You can move the cursor to highlight the next or previous bar by pressing the right or left
arrow keys or rolling the mousewheel.
Notepad and Alarm Below and Alarm Above
Clicking Notes for security, the second button of Data display on the floating toolbar, or
pressing the F2 key while a chart is showing will cause a form to appear on which notes may
be written, fundamental information displayed and also on the form there is provision for two
price alarms to be set. Button 40 from the main toolbar also performs this function.
This information can be accessed at any time a chart is displayed using that data file.
Notes
You can write notes in freeform in the main edit box for the particular security file whose
chart is active. This provides a very quick and easily accessible facility for documenting
your information on a particular security.
The Database Manager uses the first line of the Notes as above so
that any manually entered notes should commence at line 2 or after
Documents
By clicking the Docs button on the F2 notepad you can access a Word document file for that
security that will provide an even more flexible and sophisticated format for you to record
your notes and display charts because the full power of Microsoft Word will be at your
disposal. (You must have Microsoft Word or a compatible wordprocessor installed on your
computer to utilize this feature)
66
In addition the F2 notepad is one of the four windows in Insight Trader that accept drag and
drop documents. The other three are the main charting window, the Portfolio Summary
window and its Accounts Transaction dialog.
Any documents relating to this particular security that your wish to store for later retrieval
can be dragged and dropped anywhere on the F2 Notepad dialog. You can access these
documents at a later time for viewing or editing by pressing the Docs button. For further
information on the Insight Trader Document Management System please consult Chapter 11
at the end of this manual.
Fundamental Information
In addition to the notes there is provision to insert the information for Dividend, EPS, NTA,
and % Franking and the other fundamental values shown.
The nearest forthcoming dividend exdate (where this is available) will appear in the final
fundamental field in the form Exdate/Dividend in Cents/Franking/Payment date. Any chart
of the security will also show in the caption bar the first three of these. In addition a vertical
bar (in the colour attributed to the open interest field) of a length equal to the dividend plus
the imputed tax credit will drop from the top border of the chart and be positioned between
the exdate and the previous day. This information will continue to be displayed on the chart
until the next dividend is announced
Accessing Fundamental Information from the Internet
You can quickly access extensive financial information for any company from the internet.
From the currently active chart just press Ctrl+F2 to retrieve information for that company
from the Financial Times website (FT.com). Holding the Ctrl key while clicking the
corresponding F2 Notepad toolbar button will achieve the same result.
When in the portfolio manager also using the Ctrl key with the F2 Notepad toolbar button
will allow you to access this information in a similar way for the currently highlighted
company in the main summary screen for your portfolio.
67
Fig 2.20
Alarms
Alarms will sound if the latest low price of that security reaches or falls below the Alarm
Below or the high price reaches or rises above the Alarm Above. These alarms will sound
during the normal datacapture process or from within the program Insight Trader itself
whenever that file is loaded. A check box enables you to use the closing price rather than the
low or the high to activate these alarms.
Stops can be of two main types – fixed stops or trailing stops. If you want a fixed stop just
put in a Value for Above and/or Below and check Alarm on close if you require this.
For trailing stops you need to first set starting Values for the stops as described above. If you
want a percentage trailing stop make sure the ATR box is not ticked and put the required
percentage values in the Trail % boxes where appropriate. If you want ATR stops instead
then tick the ATR box and put values for the number of ATRs required in the appropriate
Coeff boxes. You will also need to specify the ATR period.
When the F2 notepad is accessed again at a later date the stop Values will be updated
according to the trailing calculation. These will also automatically adjust on the charts.
The alarm stop levels are indicated by short dashed lines on the right hand side of the chart.
If an alarm is hit a prominent message to that effect is displayed on the top left hand corner
of all charts of that security and it is also indicated in the Portfolio Manager main Summary
screen by highlighting the row of the security in question in either bright red or bright green.
68
The Three Alarms
There are actually three Alarms (or Stops) available to alert you to price levels having been
crossed for a particular security - Alarm above, Alarm Below, Alarm Below Soft. In the
Alarm Below box in the F2 Notepad if you place a single number in this box this will be the
normal hard sell stop. If you place after this number a slash followed by a second number eg
483/495 the second number will be the soft stop. Similar to the Alarm Below normal hard
stop, if the daily low falls below this number, then a warning banner (purple instead of red)
will appear at the top of any chart of that security. (If the 'Alarm on close' option has been
ticked on the F2 notepad then it is the close of the day rather than the low which must be
below the soft stop before the alarm is activated) A similar purple warning (for the soft stop)
will be shown in the portfolio manager on the row corresponding to the security where the
alarm has been triggered.
The horizontal dashed line marking the level of the soft stop takes its colour from the cursor
line and can be changed from the main menu "Format/Preferences/Graphics colours". The
colours of the other two stops lines are taken the same as those of Candle up and Candle
down.
Whether the Alarm on close box has been ticked or not will determine globally for all stocks
whether it is the day's close or instead the extremes of the day's trading which activate the
stops. This setting controls the behaviour for all three stops for all stocks. However, it is
possible to override these global settings by placing an H, L or C after any of the numbers for
any of the stops for any particular stock. (NB It is not case sensitive and h, l or c will do)
For example, if the 'Alarm on close' option is not ticked then it is the day's high and low
respectively that will determine whether the 'Alarm above' and 'Alarm below' (including the
Soft stop) are triggered. However, if we set the alarms, say, as follows:
1. Alarm above 163
2. Alarm below 147/152c
the 'C' after the soft stop means that the soft stop will only trigger if the day's close is below it
while the other two are still activated by the extremes.
You can use any of HLC for any of the stops even using an L in the 'Alarm above' or an H in
the 'Alarm below' Some examples are as follows:
1. Alarm above 163
163h
2. Alarm below 147
147/152
163l
163c
147/152c
147c/152
147h/152
/152
/152c
Extending Alarm Lines
You can extend the alarm lines from the short dashed line on the right hand side of the chart
to span the whole time range by toggling with the tilda (~) key. (Note that the shift key is not
required) This allows you, for example, to compare your stop price with patterns providing
historical support and resistance.
69
Suppressing Alarms
To hide the indication of alarms on any chart the speedkey Ctrl+Shft+H will hide all
manifestations of the alarm including the short horizontal dashed alarm level on the right
hand side of the chart and any red or green banner at the top of the chart indicating that the
alarm has been hit. This allows you to print charts without the alarm indications. In any event
the alarm banner is automatically removed when printing irrespective of whether this hide
option has been invoked.
Alarms triggered by loading security files
When distributing data with the data capture utility Datacapture (see Chapter 8), an alarm
will sound whenever a stop is hit during the datacapture process if the alarm and highlighter
are switched on. Securities that have their stops hit will appear in the highlighted list in
Insight Trader with all criteria set to zero.
Alarms are triggered whenever a security file is loaded into Insight Trader, where stops have
been hit and the siren will sound if the siren in the program itself is enabled under
Format/Alarm status from the main menu. Also any charts for securities where the stops
have been hit will be prominently marked in colour in the upper centre of the screen. The
sound used for these alarms is a wave file, many examples of which will be found in the
\WINDOWS\MEDIA directory. You can specify the path for the particular wave file that you
wish to use for the alarm from the menu Format/Preferences.
It is possible to switch off the siren for the stop loss alarm from both Datacapture and from
within Insight Trader. You can switch off the alarm from within the program from Format
on the main menu by unchecking the item Alarm status. To switch it on again click this
menu item to check it again. If you wish to change the default alarm status for future sessions
then select Save configuration from Format on the main menu after you have set the alarm
status to the desired state. It is not recommended that either of these alarms are switched off
as it would defeat the purpose of alerting you to these stops having been hit.
Creating a list of Alarmed Securities
Whenever the Check Data Integrity Option (see Chapter 7) is run a file ALARMSET.LST
will be produced that contains all the stocks that have alarms set and lists these together with
their current activating price if alarms have been hit. This file is accessed like any LST file
by clicking the lightbulb button on the main toolbar and loading this file which is is available
as a standard LST file like HILITE from the dropdown list box from the Enter Highlight File
Name dialog box.
The speedkey access to the Notepad is to press the F2 key and for this reason this notepad is
sometimes referred to as the F2 Notepad.
DO NOT RELY ON THIS ALARM FOR TRADING DECISIONS AS
COMPUTER SYSTEMS CAN FAIL.
70
Dragging Alarms with the Mouse
From the Chart Edit window, by using the mouse, alarms can be set, dragged, deleted and
rounded from any chart by following the instructions below:
Moving the cursor close to the right hand edge of the chart will cause the price level
to be displayed in the caption bar of the Chart Edit window.
To set an Alarm Below, Ctrl Left Click at the price level required and the price will
be rounded according to ASX rules.
To set an Alarm Above, Shift Left Click at the price level required and the price
will be rounded according to ASX rules.
Moving the mouse over an existing alarm will display its type and value in the
caption bar.
To delete an Alarm, Ctrl Right Click on it.
To move an alarm drag it with the left mouse button to the new position and release:
o
The price level will be rounded to .01 if no key is held
o
Holding the Shift key down while dragging and before release will round
to the nearest 0.1 cent
o
Holding the Ctrl key down while dragging and before release
will round to the nearest cent
o
Holding the Shift+Ctrl key down while dragging and before release
will round to nearest 0.5 cent
The rounded price level during dragging will be displayed in the caption bar.
Adjusted and Compressed Files
Any dependent file that is adjusted for issues should have a percentage sign appended to the
name for the masterfile. Eg if "BHP" is the name of the masterfile, then when this is adjusted
for issues, the adjusted file will be saved as "BHP%". (Note that this is done automatically by
Datacapture if you are downloading via the internet or manually updating using BULK. If
this is done then any notes will be attached to the masterfile BHP and not the adjusted file
BHP%). The adjusted file will have the notes appended when dependent files are updated
through the program.
The use of the character "%" is reserved for dependent files adjusted
for issues etc. Also the character "@" is used to indicate that a weekly
or monthly compression has been performed on the file.
If the resident file contains either of the characters @ or % then notes will be attached to the
unadjusted file. If you are attempting to write to a notepad with a resident file BHP or BHP%
or BHP@W or BHP%@M etc the notes will be written to the masterfile BHP.
71
Customising your Charts
Presentation Options
This section will detail the manner in which you customise each of your individual charts to
present the data in the format you require. Aspects to be considered here include:
Chart type
Direct, relative strength or rebased plots
Linear or logarithmic axes
5 or 7 day calender axes
Automatic or fixed scaling
Daily weekly or monthly display
Subchart size and contents
Volume toggle between log and linear
Grids
Hiding issues/splits line
Overlaying one chart on another
Chart Type
Changing the chart type of any displayed chart is very easy and can be done from the floating
toolbar or via speedkeys. Having created a chart in a window as described previously you can
change its type by placing the mouse cursor over the active chart and clicking the right
mouse button to retrieve the floating toolbar. Clicking on one of the seven buttons of Chart
types allows you to change the chart type to line, bar, candlestick, point and figure,
equivolume, equicandles, swing. (Scatter diagrams are accessed via View in the main menu
and choosing the item Chart specs. This will be dealt with in Chapter 4.)
The speedkeys L, B, C, P, E, Q and U perform the same function. The charts immediately
redraw to the chosen type.
Pressing the C key (or using the candlestick button on the floating toolbar) allows you to
rotate between candlesticks, coloured bars and candlesticks that have their shadows coloured
differently according to whether they have closed above or below the last period close.
For point and figure you will be prompted for additional information on the Boxsize (default
auto) and the Box reversals (default 3). If you specify the number of boxes to reverse as a
negative value then this will force the chart to be drawn on the basis of close only even if
high and low are available.
For Gann Swing Charts you need to enter the number of periods and filter limits. Filter
limits can be expressed in either points or in percentages. Setting the number of periods to
zero will give a price only swing chart. Setting the filter limits to zero will give a time only
72
swing chart. Setting both will give a swing chart for both time and price. The swing charts
switches between the rectangular representation and the sawtooth depending on the amount
of data to be displayed.
Relative Strength and Rebased Plots
A relative strength chart, which is simply the ratio of one security to another security or
index is simply constructed by pressing N for New and entering in the box provided:
BHP\RIO
for the RS of BHP to RIO or
ANZ\XAO
for the RS of ANZ to the All Ords
Note that the separation character is a backslash not a forward slash.
To plot a rebased chart that starts from the left at 100 units on the vertical axis type N for
New and enter in the edit box provided:
ANZ\
and hit OK or press ENTER.
This will give a rebased chart of ANZ.
If you require a rebased relative strength chart you would enter instead:
ANZ\\XAO
for a rebased relative strength chart of ANZ to the All Ords.
Once you have invoked either relative strength or rebase mode as above then you can simply
press N for New (to change the security in the current window) or the +/= key (to place a
new security in a new window) and enter say:
NAB
and you will get a chart of NAB\ NAB\XAO or
mode of the active chart.
NAB\\XAO depending on the current
To exit the relative strength or rebase mode just press Ctrl Z and the current chart will revert
to a normal line chart of the denominator security.
Note that relative strength and rebased charts are only possible using line or point and figure
charts.
Linear and Logarithmic Axes
You can toggle your vertical axis type between linear and logarithmic from the floating
toolbar by clicking button 3 of Axes - Log/linear . Pressing the speedkey F will perform the
same function. Button 35 of the main toolbar also performs this function.
You can also make your horizontal axis logarithmic or linear if they are non calendar axes
but this is done from View in the main menu at the Chart specs item. This is discussed in
Chapter 4.
73
5 or 7 Day Calendar Axes
Mostly you will want to plot your data according to a 5 day calendar axis spanning only the
normal trading week days. However, for certain types of analysis, such as Gann, you may
wish to use a 7 day week. This is accessed from View on the main menu by clicking week
length and then 7.
Automatic or Fixed Scaling
Usually you will want to allow the program to choose your scaling ranges for you. This is
called automatic scaling where the chart axes are arranged to include all the data in the
security file. Should you wish to do so you can set up (from Format on the main menu under
Preferences) so that automatic scaling will plot your charts from a fixed date onwards eg
010113. This will be dealt with in Chapter 6.
You can toggle between automatic and fixed scaling from the floating toolbar retrieved by
Right Clicking your mouse over the active chart. After clicking buttons 1 or 2 of Axes you
can specify the scaling you want on the X (horizontal) or Y (vertical) axis. The
corresponding speedkeys for this operation are X or Y.
From the dialog box which appears click on Automatic or Set scales as required. If you
choose Set scales :
X-axes
You will be asked for the limits you require. For a fixed period say 010114 to 300614 enter
in the ddmmyy format as follows:
Fig 2.21
and your chart will be plotted to include the dates you have specified. To allow tidy scaling
the actual date range shown may be a little larger than your limits. If you leave the last date
blank the chart will scale to include today’s date.
If you leave the first date blank it will chart from the first record in the file or from the
Default date for charts if you have set this value in the Configure/Preferences dialog box
shown later in fig 6.2.
74
You can also set a “running time window” to plot say the last 100 calendar days with 10 days
white space in front of your chart for projecting trendlines etc. This would be achieved by
placing:
-100
in the first edit box and
@+10
in the second edit box.
The @ symbol indicates the current date so you are asking to include 100 days ago to today
plus 10 days. If you save this chart to disk and retrieve it at any future date it will always
show the last 100 days with 10 days of white space in front. As time goes on days are
dropped off the left and others added to the front of the chart.
Default white space applicable to all charts plotted can be selected from the
Format/Configure Preferences option from the main menu.
Y-axes
Setting the vertical axis is similar to that above but you only need to specify the lower and
upper bounds say 100 to 500.
Zooming
Zooming is the process which allows you to focus and magnify detail in your charts or to
step back and see the long term big picture. Buttons 1-6 of Zooming on the floating toolbar
can be clicked to achieve zooming in various ways. Button 1 zooms out the chart fully to
display all data in the file. Button 2 will zoom out to show 50% more data than is currently
displayed. Buttons 2 and 3 zoom out and in, keeping the central point of the chart as a fixed
reference. Buttons 4 and 5 zoom out and in but keep the last point on the right hand side of
the chart as the fixed reference. Button 6 zooms out on the last 80 days. A selection of these
zooming functions is also accessible from buttons 29-33 of the main toolbar.
These operations are also available from speedkeys as indicated on the toolbar buttons - Ctrl
F3 to zoom out completely. F3 and F4 to zoom out and in with a central point reference and
F5 and F6 to zoom out and in with a final point reference. To zoom in completely on the last
80 days use Shft F6 (not Ctrl F6 as this key is reserved by Windows). Ctrl F5 will zoom
right back from the last day shown.
In addition to these zooming option there is a Zoom submenu on the main menu that
provides preset time ranges from 1 months to 15 years. Click Zoom and then select the
required time period. These options can also be accessed via the keyboard eg: For a 3 year
period – press Alt+3. For a 5 month period – press Ctrl+Alt+5
An additional form of zooming is available from the Chart Edit Window to be described later
in this chapter.
Scrolling the Chart
There are additional operations available only from speedkeys. F7 and F8 will scroll the
chart left and right by one day at a time, Shft F7 and Shft F8 by one week at a time and Ctrl
75
F7 and Ctrl F8 by one month at a time. PageUp and PageDn keys will page the chart
backwards and forwards in history one page at a time. The Home and End keys will take you
to the beginning and end of the file respectively. The < and > keys have the same function as
F7 and F8 in that they can also be used to scroll the display left and right by one day at a
time. Some of these have equivalents on the floating toolbar under Paging.
Rolling the mousewheel forwards or backwards will have a similar effect as that produced by
F7 or F8 except that every click of the mousewheel roll will move the data fast - at 1/8 of a
screen at a time. If you single click the mousewheel button you can toggle the movement to
slow where each click of the mousewheel roll changes the display one day at a time and is
therefore identical to F7 and F8. Click the mousewheel button again and it reverts to fast
scroll.
Note that double clicking the mousewheel button toggles between two different states. The
default is that rolling the mousewheel will cause the data in the active chart to scroll as just
described above. Double clicking the mousewheel button will put the system into the other
state where any mousewheel rolling will cause active chart to change between the different
charts on screen (if there are more than one) and it is therefore equivalent to pressing the left
and right arrow keys.
Using the Day by Day Scrolling for Simulated Trading
You can advance charts in a day-by-day mode where pressing the keys F8 or ">" or using the
mousewheel as described above will advance the chart one day at a time. This gives you the
opportunity to practice your trading technique by taking paper trades and exiting using
historical data advanced one day at a time. The keys F7 or "<" or mousewheel will similarly
take the chart back one day at a time. In default mode it will always retain a fixed number of
days on screen where as one day is added to the front of the chart the oldest day drops off the
end. You can, however, choose to anchor the first day on the chart to always remain the first
day on the chart by accessing the menu item under "Format/Preferences" and placing a tick in
the option "Scroll Anchor". In this second method the number of days displayed on screen
will increase by one each time the F8 or ">" key is pressed.
All alarms are set to trigger whenever the final price in the file violates the stop price. When
using the above day-by-day feature you will more likely want the alarm to trigger on the
price for the final day displayed on the screen rather than on the last day in the file. The
speedkey Ctrl+Shft+? will allow you to toggle between these two modes. This speedkey
operates only when there is at least one chart on screen.
Locking in the Daily, Weekly or Monthly Display
During the zooming of charts the display for a chart will automatically change between daily,
weekly and monthly depending on how much data there is to display on the screen. Should
you however wish to maintain a particular display mode during zooming then it is possible to
lock in the current mode. From the floating toolbar click button 7 of Zooming - Lock daily
weekly or monthly display. Alternatively, the speedkey Ctrl K will achieve the same result.
These commands will also toggle the lock off.
This lock is also toggled off when you change the chart type to bar, candles etc with the
speedkeys or corresponding floating toolbar buttons.
76
Daily Weekly or Monthly Display
For those chart types for which daily, weekly or monthly displays are relevant - ie bar charts,
candlesticks, equivolume and equicandle you can change the display from the floating
toolbar. Buttons 1-3 of Display on the floating toolbar Daily, Weekly, Monthly can be
clicked to change the display. Alternatively, pressing the speedkeys D, W or M will achieve
the same result. Button 36 on the main toolbar will rotate between these displays.
Buttons 1-3 of Compression on the floating toolbar are Compress daily, Compress Weekly
and Compress Monthly. These have the effect of actually compressing the resident security
file in memory so that all calculations such as indicators are performed on a daily, weekly or
monthly basis as appropriate. The corresponding speedkeys to achieve this effect are Shift D,
Shift W and Shift M.
At the top right hand corner of each chart just before the date range you will notice a marking
like W@D. This indicates that the chart is a weekly display of a file whose compression
status is daily. M@M indicates a monthly display of a file compressed to monthly.
When in compressed mode for weekly or monthly there is an option to allow an uncompleted
bar to display at what would be the end of its period rather than on the date the last day’s
contribution to it - ie a partly formed monthly bar at 2/7/14 can optionally be positioned on
30/7/14 rather than on the 2/7/04. Tick the box Partial bars to period end on the
configuration dialog from the menu Format/Preferences.
Subchart Size
The subchart, below the main chart, which usually contains volume bars and indicators, can
be changed in size to occupy between 10% and 50% of the whole chart window. Choose
View from the main window and click Subchart size and then click the % of the window
that you want the subchart to occupy. To toggle the subchart so that it disappears completely
use Subchart - button 6 of Axes on the floating toolbar or use the speedkey V. The subchart
can consist of up to 9 indicators stacked vertically under the main chart.
The currently active chart and any subsequent chart will be drawn with the altered setting.
Other currently displayed charts can be updated by activating each of them then pressing the
Quickchart button, the first button on the main toolbar.
The subchart size can also be very quickly altered over a very wide range by clicking the left
mouse button in the margin to the right of the vertical axis of the chart at the level where you
require the top of the subchart to be positioned. You can also drag this position to any
location.
Volume Log / Linear / Spill Toggle
If your volume subchart is suppressed towards the axis by one or two large volume spikes
you may wish to change to Logarithmic volume in the subchart or Spill the volume into the
main chart so that large bars do not dominate the chart.
This can be done (i) from the floating toolbar - button 5 of Axes - Volume Log/Lin (ii) from
the main menu View then Volume log then on. Or it can be toggled on or off using speedkey
S.
77
Grids
Grids on a chart are often helpful to the eye in estimating times and prices for parts of the
chart remote from the axes. Grids can be toggled on or off by clicking Grids - button 4 of
Axes on the floating toolbar. Alternatively use the speedkey toggle G.
If you press Shft G repeatedly instead the grids will cycle from none to horizontal to vertical
to both and back to none.
Items Displayed in the Caption Bar of the Chart Window
Only if the compression state of the chart is daily you will see displayed in the caption bar of
its window a number of items. For example:
-1.6%
-109 to 6857
Down 1.6% for the day
Down $1.09 to $68.57
(H-58%)
(L-10%)
(C-S=25%)
(H-S=32%)
the percentage that the current price is below a recent high (peak)
the percentage that the current price is above a recent low (trough)
the percentage difference between the current price and Stop price
the percentage difference between the recent peak and the Stop price
Ex Div 050314 58.883c (0%)
Dividend Exdate
Dividend
(Franking)
For the percentage price differences above, the period for the recent high and low is set as a
number of calendar days prior to the date of the last period in the file. This is set in the
Preferences dialog under the main menu Format/Preferences.
Hide Issues/Splits, P&F Markers, Alarm levels, Compression Status etc
Share securities that have been subjected to issues or splits have this adjustment indicated on
the chart by a vertical dotted line. This line can be toggled off by clicking button 1 of Hide on
the floating toolbar - Hide issues/splits line. Alternatively use the speedkey toggle H.
This also hides other details including the dashed lines on the charts indicating stops,
compression status, bid and ask levels on an intraday chart and any information on
forthcoming dividends.
To hide the indication of alarms on any chart the speedkey Ctrl+Shft+H will hide all
manifestations of the alarm including the short horizontal dashed alarm level on the right
hand side of the chart and any red or green banner at the top of the chart indicating that the
alarm has been hit.
Hide the Price Chart itself
Pressing Ctrl H or by clicking button 2 of Hide on the floating toolbar - Hide chart will
allow the price chart itself to be hidden to allow you to see the other features such as moving
averages etc uncluttered by the price action. Just press Ctrl H to toggle it back on again.
78
Overlay 2 or more Charts in one Window
If you have two or more charts in their own separate windows these charts may be overlaid
one on top of the other in a single window - the currently active window. This is done by
clicking button 23 on the main toolbar or from Windows on the main menu selecting item
Overlay charts.
Note that only the scaling for the currently active chart will be shown. It is important
therefore to ensure that any charts overlaid will have meaningful comparative scales,
particularly along the horizontal axis. It is therefore usual to set scales on the horizontal time
axis, and frequently also on the vertical axis to ensure meaningful comparisons.
Once charts are overlaid in this manner the process is irreversible. Should you think that you
may need to revert at some stage to the individual component charts then the arrangement of
individual component charts should be saved as a chart arrangement just prior to overlaying.
In this way they can be accessed at any time in the future as the individual component charts
by retrieving the saved arrangement.
Drawing Tools
The Chart Edit Window
In order to draw trendlines and other structures on your charts you will need maximum
magnification for greatest accuracy. For this reason you can click on the actual chart area of
the chart of your choice and it will expand to full screen to give you the Chart Edit
Window. From this full screen view you will be able to add your trendlines, fans,
retracements, target arcs etc. (You can also enter this chart edit mode with speedkey Alt G
and exit it with Ctrl Q).
Alternatively, if you access any of the Drawing Tools buttons from the floating toolbar, or
use their speedkey equivalents, if you are not already in the Chart Edit Window you will be
automatically placed in this window in the appropriate edit mode for the function that you
require.
When these structures are completed you will click the Save button on the floating toolbar or
use the speedkey Ctrl S and you will be returned to your working area with all the
constructions transferred to the appropriate chart.
To enter the chart edit window click with the left mouse button on the chart on to which you
wish to construct your trendlines or press Alt G. The chart will spring to full screen as shown
in Fig 2.22. The bottom status bar will show the mode that you eventually choose (such as
Lines), the number of days spanned by the ends (or reference points) of the trendline or other
structure, the percentage by which the second end point is above or below the first, the slope
of the line, overlay status, D W M lock, Y scale lock, 5/7 day scales, DW or M display status
DW or M compression status, date range.
In Chart Edit mode if you place the cursor over any bar it will display in the window’s
caption bar the position of the cursor as well as the open, high, low, close and volume values
for that date.
79
If you Right Click the chart the floating toolbar will appear with the various Drawing tools
buttons that you require.
In addition to the technical structures such as trendlines, fans, projections, retracements,
cycles etc there are available four Shapes that you can use to highlight aspects of your charts.
These are a circle/ellipse, arrow, rectangle and round rectangle.
Fig 2.22
Trendlines
Simple Trendlines
To draw a trendline simply move the cursor to the point at which you wish the trendline to
commence and click the left mouse button. You will notice the word Lines appear on the
status bar indicating we are now in Lines mode. Then move the mouse cursor pulling the
trendline to the second point marking the end of the line you wish to draw. (If you wish the
line to be constrained to remain exactly either horizontal or vertical during this operation then
hold the Shft key down while you move the mouse.) When you have the second point in the
desired position click the left mouse button and the cursor will detach from the end of the
line and “handles” will appear at its ends and midpoint.
Although the cursor is now detached this line is still mobile and it is possible to drag either
end of the line to new positions with the mouse. By dragging the line at its midpoint you can
move it bodily to a new position without changing its slope or length. When the line has been
adjusted correctly you will need to set the mobile line in position and assign it a colour.
80
To do this click the right mouse button to bring up the Choose Colour dialog box. You can
set the line to be solid dotted or dashed by clicking the appropriate button and then clicking
the colour of your choice. The line is now set in position.
If you wish to draw a trend channel you should tick the box Autospawn parallel line before
choosing the colour. In this case, after the first line is set, your mobile line will jump away
giving you the opportunity to draw a parallel line by repositioning it from its midpoint or to
drag it to a completely new position. Setting lines in this manner will keep spawning new
parallel lines until you escape from Lines mode using the Exit button on the Choose colour
dialog box or by pressing the speedkey ESC twice. This will also remove the mobile line.
(It it also possible, at any time in the Chart Edit screen, to spawn a line that has already been
set by positioning the mouse over the line and holding the Shft key down and Right
Clicking.)
We entered Lines mode simply by clicking on the Chart edit window and our line
commenced drawing. You can also enter Lines mode without immediately commencing
drawing by clicking Lines – the first button of Drawing tools on the floating toolbar. Lines
mode can also be entered via speedkey Ctrl L.
When you have positioned your mobile line to where you want, Right Click to choose a
colour and set the line.
(You can also press any of the number keys on the top row of the main keyboard 1, 2, 3,
…. 9, 0 to obtain the colours you saw on the choose colour dialog. Shift n and Ctrl n (where
n is one of these number keys) will give you dotted lines and dashed lines respectively. Once
you have memorised the colours corresponding to these numbers the use of speedkeys will
facilitate your work.)
Slopes of Trendlines
Once you have commenced drawing a trendline by dragging the second point of the line with
the mouse you will see three figures on the left of the status bar below. The first is the
number of days between the two ends of the line, the second is the percentage by which the
second point is above or below the first point, and the third is the slope of the line expressed
as an annualised growth rate. If the chart is linear then this growth rate will be a simple
percentage growth rate per annum. If instead the chart is logarithmic then the growth rate will
be expressed and designated as a compounding annualised growth rate.
Gann Lines
Gann lines are constructed by entering Lines mode from Lines button 1 of Drawing tools on
the floating toolbar (or using speedkey Ctrl L) and positioning the mouse cursor over the
point through which you wish to construct your Gann line. Then press G and a dialog box
will appear requesting that you enter the price increment that you wish to use (the side of
each square on your Gann chart) and then enter the price number and the time number.
For example if you want the squares on the grid of your Gann chart to be 5 cents and you
wish to draw a 2x3 Gann line then you would enter 5 as the price increment, 2 as the price
number and 3 as the time number.
81
It is important to realise that prior to drawing a Gann line you need to have decided the size
of each logical grid square (ie the price increment) that you will be using for the chart. It may
be 1 but does not have to be. The time side of the grid square is automatically chosen to be 1
day, 1 week or 1 month depending on the current display status of the chart. To draw a
falling Gann line input the price number as negative.
Note that Gann lines can only be constructed on a linear chart. Also, although a 1x1 Gann
line is at a logical 45 degrees to the axis on the screen it will generally not appear so because
the physical arrangement of the pixels on the monitor and also the nature of the scaling you
have chosen for the chart will stretch it in one direction or the other.
Point and Figure Trendlines and Price Targets
If you are using point and figure charts you can draw logical 45 degree lines. Position the
ends of your mobile trendline to approximately where you wish them to be and press the
keys < or > to give a 45 degree line going up or down. Note that the left end of the line
stays fixed and the right end moves up or down to achieve the necessary angle. However, if
the trendline is too long such that it would go out of the chart boundary then the mobile
trendline will not move. You must then make your trendline shorter.
NAB - NATIONAL AUSTRALIA BANK 20x3
D@D
010993-180297 1800
Last price indictor
1700
1600
1500
Price target arcs
1400
1300
1200
1100
1000
45 degree trendlines
D M J
94
SD
MJ
95
S D M J
96
900
SD
97
Fig 2.23
With point and figure charts you can also draw elliptical arcs indicating price targets from
areas of congestion. Stretch the mobile trendline horizontally across the area of congestion
and press the PgUp or PgDn keys to get your price target up or down.
82
The arc so produced is mobile like a simple trendline and can be moved around the screen by
dragging on its two reference points at the ends of the line or at its midpoint to move it
bodily.
Both the 45 degree lines and the target arcs are set in place just like a simple trendline and
can be saved to disk with your point and figure chart for later retrieval.
Cycle Grids
You can overlay a regularly spaced time grid on your charts by clicking Cycles - button 3 of
Drawing tools on the floating toolbar. Alternatively you can use the speedkey Ctrl C. The
word Cycles will show in the status bar indicating we are in Cycles mode.
Click the mouse cursor on the point at which you wish to position the first cycle reference
gridline and move the cursor to the right dragging the second reference gridline. The
reference gridlines are shown dotted and the actual reference points on these gridlines are
joined by a line. These reference gridlines actually span four cycles to make the positioning
of closely spaced grids more accurate. When you have positioned the second reference
gridline to where you wish just click the left mouse button.
Like the trendline this grid is still mobile and can be moved by dragging either end of the
joining line or dragging the midpoint of the joining line to shift the whole grid bodily to a
new position. When you are satisfied with its position set the grid in place by clicking the
right mouse button and using the Choose colour dialog box or the 1-9, 0 speedkeys as
explained for trendlines above. A figure representing the number of days between gridlines is
shown adjacent to the second reference point.
Fans Retracements X-projections Y-Projections
Fans, retracements and X- and Y- projections are other constructions that are manipulated
and set in place similarly to the trendlines, arcs and cycles that we have discussed. They are
accessed from the buttons 4-7 of Drawing tools on the floating toolbar ie Fibonacci/Gann
Fans, Fibonacci/Gann retracements, Fibonacci time projections, Fibonacci price
projections.
Alternatively, before you enter lines mode, the respective speedkeys Ctrl F, Ctrl R, Ctrl X
and Ctrl Y can be used to rapidly enter these modes. Like Lines and Cycles each of these
structures has two reference points and can be manipulated and set in position in an identical
way.
Shapes
There are also available four Shapes that you can use to highlight aspects of your charts.
These are a circle/ellipse, arrow, rectangle and round rectangle.
83
Deleting Trendlines and Other Structures
Once you have set a trendline or other structure on a chart it is possible to delete it. Place the
mouse arrow cursor over the line joining the (invisible) reference point handles, hold down
the Ctrl key on the keyboard and Right Click.
Editing Trendlines and Other Structures
It is also possible to edit it a trendline or other structure on a chart. Place the mouse arrow
cursor over the line joining the (invisible) reference point handles and Right Click. The
structure will then become mobile with visible handles and you can move it, resize it and set
it again in a different colour.
Extending Trendlines
Trendlines may be extended by going into Lines mode, placing the cursor over the line you
wish to extend and pressing the + key. Pressing the - key will shorten the trendline instead.
Spawning Trendlines
Place the mouse arrow cursor over the line joining the (invisible) reference point handles of
the trendline or other structure, hold down the Shft key on the keyboard and Right Click and
an identical (but mobile) line will be created that will jump away from the first for you to
position it where desired.
Alternatively from Lines mode you may spawn a trendline parallel to an existing one by
placing the cursor over the line and pressing the S key. A dialog box will appear requesting
you to specify the length as a proportion of the existing one. You can choose to have one of
equal length or one which is a Fibonacci ratio of the existing one or one of custom length.
Other Operations in Lines Mode
There are a number of other operations apart from drawing trendlines that are possible from
within Lines mode. These include zooming, a window showing data, a window showing the
Y-value of the cursor, a window showing percentage retracement from two fixed points. But
first we will examine how to change the form of the lines cursor.
84
The Lines Cursor
After Lines mode has been entered the cursor which appears is:
(i) the normal Windows arrow
This can be changed into a:
(ii)
(iii)
(iv)
vertical line
horizontal line
crossed vertical and horizontal lines
by pressing the spacebar. Repeated pressing will cycle through the
four options.
The cursor remembers its last position in Lines mode enabling you to
set the cursor position, switch charts, and reestablish the cursor at the
same place on the screen.
Horizontal and Vertical Lines
The Lines cursor can be moved around the screen with the cursor keys or the mouse to the
desired position for the start of the line. Pressing V or H at any time will draw a vertical or
horizontal line, respectively, through the current position of the cursor.
Unless the cursor is taken down into the subchart, vertical lines will only extend to the main
chart. If the cursor is taken below the horizontal axis of the main chart, pressing [V] will
cause the vertical line to be drawn from the position of the cursor to the top of the main chart.
Moving Data Window
From any active chart in the front screen click Moving Data box – the fifth button of Data
display on the floating toolbar or button 39 of the main toolbar. This will take you
immediately from the front screen, via the chart edit mode, into the Moving Data Window
showing day of week, date, High, Low, Close and volume values (if these are available)
corresponding to the date of the current cursor position.
Moving the cursor to different dates will change the data displayed in the window. You can
move the cursor to highlight the next or previous bar by pressing the left or right arrow keys
or rolling the mousewheel. Pressing the right mouse button will exit from this mode. The
speedkey Ctrl J is the speedkey alternative and toggles between these two states.
The Y-value or price level of the cursor is also shown in the caption bar of the data window.
85
Fig 2.24
Y-value Window:
If speedkey Y is pressed while the Lines cursor is displayed, a window will appear showing
the value corresponding to the vertical position of the cursor, which can be moved as
described for the Data Window above.
Retrace Window:
The speedkey R will invoke the Retrace Window which requests you to set the first point.
Move the cursor to a significant high (or a significant low) and press ENTER to set the first
point. A marker will be left at this point and the cursor will jump to the right trailing a line.
Then move the cursor to the second point, the complementary significant low (or significant
high) and press ENTER to set the second point. The second point will be marked and the
cursor will jump slightly upwards, again trailing the line.
The window will now show the values of the first point, the second point Fibonacci targets
and the percentage retracement represented by the position of the cursor relative to the first
and second points. The cursor can be moved around as described for the Data Window above
with the percentage retracement represented by the current cursor position being
continuously displayed.
Zooming using Lines Mode
In Lines mode you can stretch the mobile rubberband across the date range into which you
wish to zoom and either double click the right mouse button or press Ctrl W and the chart
will be redrawn to include the time period that you have bracketed with your line. This
86
zooming process can be repeated indefinitely or until the chart has been zoomed in to cover
only one day.
NB These lines do not have to be placed on the axis nor do they have to be horizontal. It is
convenient generally to span the actual data you want to include in the zoomed chart so the
line will usually be at some angle to the axes. Autoswitching between daily/weekly/monthly
displays can be disabled/enabled with the speedkey Ctrl K.
Text
Text can be positioned anywhere on the chart by invoking the Text mode with speedkey Ctrl
T or by clicking Text - button 2 of Drawing tools on the floating toolbar. When in text mode
the beam cursor (I) can be positioned to where you require the text string to start. Pressing
ENTER or the left mouse button will allow text entry to commence and the cursor will jump
to the left leaving a flashing caret.
Text is then entered as required, using the backspace DEL to remove incorrectly typed
characters. Pressing ENTER or Ctrl ENTER will complete text entry on that line. The
cursor is then moved to the commencing position for the next string and the process repeated.
When all required text strings have been completed ESC will exit the Text mode.
The difference between completing the line of text with ENTER or
Crtl ENTER is that, in a saved chart, text that has been completed
with Ctrl ENTER will always remain fixed in the same position on the
screen while text completed with ENTER (the most common option)
will move with the underlying data as new data is added to the
database.
Also, moving text can be zoomed while fixed text disappears on zooming. Moving text is
tied to the date and price location corresponding to a point just to the left of and above the
first character in the line of text. Both fixed and moving text can appear on the one chart
together.
Deleting Text
To delete text which has been set after ENTER or Ctrl ENTER has been pressed, it is only
necessary to move the mouse arrow cursor over the upper left corner at the start of the line of
text to be removed and Ctrl Right Click. Text can also be removed from saved charts using
this method.
Editing Text
A text string may be edited by moving the mouse arrow cursor over the start of the line of
text to be edited and Right Clicking. A flashing caret will appear on the end of the text string
and the editing operation can commence. Press ENTER or Ctrl ENTER to accept the
changes.
87
Dragging Text to a New Position
You can drag text with the mouse by placing the arrow cursor over the upper left corner of
the text string holding the left mouse button depressed while dragging it to the new location.
When the left button is released the text will disappear from the old location and reappear at
the new position.
Temporary Overlaying
Overlaying
From the Chart Edit Window it is possible to temporarily overlay one chart or one indicator
on another. However, such temporary overlays cannot be saved to disk but are useful for on
the spot comparisons. Permanent overlaying is achieved from the main toolbar as described
previously.
The floating toolbar has an Overlay button at position 7 of Axes. The speedkey O will also
put you into overlay mode which means that the next chart that you plot on the Chart Edit
Window will be overlaid on to the currently displayed chart. This can sometimes be used for
example for overlaying a bar chart on a point and figure chart of the same security or
overlaying one indicator on another. Note that charts overlaid in this manner cannot be saved
as replays. If an attempt is made to save an overlayed chart then it is only the second chart
that will actually be saved.
Permanent overlaying is done as described earlier in this chapter using the Overlay charts
button in the main toolbar.
Locking in the Existing Y-Scaling
If you wish to set the Y-scale for subsequent charts drawn in the Chart Edit Window to be
that which is currently displayed then click the button 8 of Axes on the floating toolbar Lock
Y scales. The Y-scale will then remain fixed for any other charts drawn subsequently. This is
a toggle and will therefore also release the lock. The corresponding speedkey is Z.
You might for example wish to overlay the bar chart of ANZ on to a point and figure of the
same security as mentioned in the paragraph above but with exactly the same Y-scales. Draw
the point and figure chart and then, using speedkeys, press Z to lock in the Y-scale displayed,
then press O for overlay and then B for bar chart. The bar chart will then be overlaid on to the
point and figure and the Y-scales will correspond.
Events and Reversals
Astronomical and Other Events
There is a belief amongst many traders that astronomical events such as new moons, full
moons eclipses and other events have a significant influence on market behaviour and that
many major turning points can be correlated with such events.
88
Insight Trader provides a facility for Grids of EVENTS to be overlaid on to any chart so that
for example, lunar phases, eclipses, elections, earthquakes or anything that you like for that
matter can be compared with market action. It is only necessary to create an ASCII file using
a text editor or a wordprocessor and saving the file as an ASCII or text file. Save it with a
filename EVENTnn.DAT (where n is any digit 0-9) with a heading such as New Moons and
a list of dates below in the format ddmmyy. For example:
New Moons
230512
281113
130614
... etc
Save this file into the \WINIT directory. At any later time a series of grid lines at these dates
can be overlaid onto any chart just by pressing two keys in the range 00-99 while the chart is
displayed. (There is an event button also on the floating toolbar). By specifying a shift in
days when prompted, the grid will be displaced by this amount. These grids will be saved if
the chart is subsequently saved as a replay file. The following files have been provided:
EVENT01.DAT New Moons
press 01
EVENT02.DAT Full Moons
press 02
EVENT03.DAT Lunar Eclipses
press 03
EVENT04.DAT Solar Eclipses
press 04
These files will need to be updated periodically using the Notepad editor above.
EVENT09.DAT and EVENT10.DAT are reserved for use by the systems profitability tester
to overlay a grid of the buy and sell events on the chart of the security being tested .
EVENT05.DAT to EVENT08.DAT and EVENT11.DAT to EVENT99.DAT can be
constructed by the user for whatever purpose is required.
89
R - Reversals
Reversals are available from button 2 of Detection on the floating toolbar - Reversals.
Speedkey access is by pressing R from any chart. This will allow the chart to be redrawn
showing reversals, Key reversals, LHC and HLC events. These events are as defined by
Bernstein in his book “A Handbook of Commodity Cycles - a Window on Time”. Reversals
are toggled off using the same commands.
These events will be indicated on the chart by the following characters:
up/down arrow
K
*
-
upside/downside reversal
key reversal
HLC or LHC event with reversal
This facility only operates if an HLC bar chart has been selected.
J - Pivot Points
Pivot points are available from button 3 of Detection on the floating toolbar or via speedkey
on any chart by pressing J. Enter the number of periods required to confirm by a close under
or over the required low or high. Click the toolbar button or press J again to toggle the option
off. If the periods to confirm are different between the toggling on and the toggling off then
the pivot points on the longer confirmation that do not also occur on the shorter will remain
displayed. This allows differences to be identified.
The Undo Facility
There is an undo facility that will allow you to reverse the last 100 changes that you have
made on the current chart. You can actually move backwards and forwards through the
sequence of screen changes that have occurred since you last switched to that window.
Press the Backspace key to go to previous saved states
Press Ctrl Backspace to go forward to newer saved states
Switching from one child window to another in the front screen will reset the buffer
of saved states (ie all but the current state is lost
90
Portfolio data displays on charts
Portfolio Information Displayed on Charts
Average buy price
for all open positions
How much do I currently own
How much capital profit have I made
How much more can I buy
Buy flag
Buy flags
Sell flags
51
Fig 2.25
A "Show Trades" button 37 on the main toolbar allows you to toggle on and off certain
portfolio information on the charts so long has you have already previously loaded a
portfolio. This portfolio information includes the average price paid on any existing open
positions, buy and sell transaction flags as well as information on your current holdings of
that security, the capital profit to date and the maximum additional amounts that can be
purchased without violating your risk criteria as set in the Risk Calculator.
Buy and Sell flags and Average Price Paid
If the security displayed on the existing active chart has open positions in the portfolio that
you have currently loaded then a short dotted line will appear on the right hand side of the
chart at a price level equal to the average price paid for the securities that you currently hold.
If the security is one that exists in your portfolio either as a current holding or a previous
holding then your buy and sell trades are automatically flagged on the chart as tiny squares
on the relevant bars or candles at the price level that you paid and on the exact date of the
transaction. This means that on weekly or monthly charts these flags might appear between
bars which are situated at the end of the relevant period. Changing to a daily display will
allow each flag to fall on its respective daily bar. If there have been any capital adjustments
to the chart following the transaction dates then the price levels of the squares will be
adjusted accordingly. The actual prices paid can be shown if you change to the unadjusted
chart.
Buy transactions have a short trailing tail attached to the square that points up at about 45
degrees and are given the same colour as that which has been set for the point and figure
91
crosses. Sell transactions have a trailing tail that points down and is given the same colour as
the point and figure squares.
Profit, Holdings and Maximum Additional Purchase
When you are reviewing charts the extended F12 data box can display the value of your
existing holdings in that stock as well as the profit and the maximum extra amount that it is
possible to add to your holdings consistent with your risk management settings in the Risk
Calculator and the last recorded price. So long has you have already previously loaded a
portfolio there will be displayed on the F12 databox, underneath the Velocity and Behaviour
Index figures for a charted security the current value of your existing holdings in that
security, the current capital profit as well as a value representing the amount that can be
added to your existing holdings of that security in the loaded portfolio without violating any
of your risk management limits. A sell stop price must have been already set (stoploss) for
that security for this display to appear.
If the security is not a current holding in your loaded portfolio there will be displayed the
maximum holding permissible under the limits of the risk management criteria specified in
your Risk Calculator settings. However, it is essential that a sell stop price (stoploss) has
been set for that security otherwise this display will not appear.
93
Chapter 3
Indicators
Overview
Indicators are nothing more than derivatives of the raw price and volume information that
you see on a bar chart. Although in reality indicators provide no more information than is
present in the raw data they do offer an alternative way of looking at it.
There are two main types of indicator:- (i) trend following indicators and (ii) oscillators.
Trend following indicators such as moving averages are intended to allow you to identify and
stay with a trend. Oscillators like RSI on the other hand are most useful when the price is
moving between the limits of a trading range and they can define prices as being
“overbought” or “oversold”.
For convenience we will divide our indicators into four groups:
(i) Global Indicators
(ii) Moving average type indicators plotted on the main chart
(iii) Volume based indicators shown in the subchart
(iv) Other indicators shown in the subchart
Setting Indicator Parameters
Indicators often require parameters such as time constants to be specified. These can be set
by accessing the Default parameters for indicators dialog box. There are four ways to do
this:
(i) From button 7 Time Constants on the main toolbar
(ii) From View on the main menu and choosing the item Time constants
(iii) From Time constants - button 1 of Data display on the floating toolbar.
(iv) Pressing speedkey Alt T
The dialog box that appears is divided into four sections as shown below.
94
Fig 3.1
The first group on the left are the regular subchart indicators with provision for setting each
of the respective parameters for all indicators.
The triple moving averages are set in the top right with any leads/lags or exponential if
appropriate.
In the middle right you can set the parameters for the range indicators that define envelopes.
Included are any leads/lags, bandwith sizes and other options
The Set multiple MAs button allows you to set time constants for two sets of 9 moving
averages - a short term set and a long term set
If you click OK these changes will be operative only during your current session. If you
press the Save as defaults button they will be the new defaults every time you open the
program.
95
The Global Indicators of Velocity and Behaviour
There are two proprietary indicators that we consider are sufficiently important that we have
made them global within the program. These indicators have been developed so that, when
used in combination with fundamentals, they may assist the user to identify stocks that are
financially sound, well behaved and that are rising strongly in price. These indicators we
have called Velocity and Behaviour.
Velocity is a single value measuring the rate of price increase for any security based on the
compounding rate of price growth from three different time frames
Behaviour assesses a type of statistical volatility that is not captured by traditional measures
such as ATR or Bollinger and acts so that the smoother the price change over time compared
with the rate at which it is rising or falling the closer this indicator approaches 100%.
The parameters for Velocity and Behaviour are set separately from other indicators under
Format/Define Velocity from the main program menu. Whenever these indicators are
accessed they take their parameters from this setting which cannot be altered elsewhere. The
three time frames are user configurable with defaults of 65, 130 and 195 days with equal
weightings but you can adjust these settings to suit your requirements.
Velocity and Behaviour are implemented as both subchart indicators and system functions.
The latest values of these indicators are also displayed on the F12 notepad for the currently
active chart. In the Portfolio Manager main summary screen each of your holdings will
display the latest values of both these indicators for its relevant security. When you run a
Systems scan the report includes columns for both Velocity and Behaviour and the report
itself is always ordered on Velocity so that the fastest moving stocks are at the top of the list
and are presented first when the list is charted. In addition toolbar buttons are provided on the
main Insight Trader window to allow you to order an arrangement of charts by Velocity or by
Behaviour.
Velocity
Velocity is intended to provide comparative measures of the compounding rates of price
increase or decrease for different securities that are not easy to discern from direct
observation of their charts because charts scale automatically. Velocity is expressed in terms
of percent per annum compounding (%pa cpd) and can range from minus 100 %pa cpd to
plus several thousand %pa cpd. If for example a security displayed a velocity of 100%pa cpd
what this means in practical terms is that if it continued to exhibit the same velocity over two
years then at the end of the first year it would have doubled while over two years it would
have quadrupled in value.
Behaviour Index
The indicator Behaviour is always positive with values ranging from 0 to 100% and is
intended to differentiate between those stocks exhibiting steady rises or falls in contrast to
those displaying erratic wide swings likely to knock you out of positions by prematurely
violating your stops. Good smooth price growth gives rise to Behaviour Index values
approaching 100% while stocks exhibiting erratic short term swings which are large relative
to the long term price growth rate give values for the Behaviour Index approaching zero.
96
You should be aware that high values of Behaviour will also be recorded for those stocks that
are falling smoothly and steadily over time.
Note
Velocity and Behaviour included in F12 databox always show their values in a daily
compression mode irrespective of the compression mode of the accompanying chart.
However, their subchart indicators take the compression mode of the chart itself eg if
compression of the chart is weekly then the parameter units of the chart indicator are weekly.
Moving Average Type Indicators
There are a number of indicators that can be classified as moving average type indicators (or
main chart indicators) as these are plotted directly over the main price chart. The speedkeys
for these indicators are Control keys. A moving average can also be placed on volume.
Moving averages
The moving average is perhaps the most popular trend following indicator. It is used to
smooth out shorter term variations in price and other information to reveal the longer term
underlying trend. The moving average is calculated at any point by a process of averaging a
number of previous points subjected to a weighting procedure.
The longer the period of the moving average the greater will be the smoothing but the longer
it will take for the moving average to react to changes in price and a large portion of the trend
may well have been missed before it turns and gives its signal. Moving averages are therefore
known as lagging indicators because of this inertia and the choice of a suitable period is a
compromise between smoothing and reactivity.
Simple Moving Averages
The simple n-period moving average is arguably the most effective (see Colby and Meyers
ref 8) and is calculated by summing the values for the previous n periods and dividing by n.
Exponential Moving Averages
The exponential moving average on the other hand weights and sums all previous values with
more weight being given to the more recent values. The weighting factors can be varied such
that the resulting moving average is roughly comparable to a simple moving average of n
periods. So although all previous values are considered we specify an exponential moving
average as an “n period exponential moving average” because the weighting factor chosen
will give a result somewhat similar to an n period simple moving average.
Plotting Standard Triple Moving Averages
You can place a maximum of 3 standard moving averages on any one chart. Before plotting
any moving averages it is important to have set the time constants on the Default
parameters for indicators dialog box as described above. If you require only two moving
averages set the time constant for the third moving average at zero (or leave it blank). If you
only require one moving average then use the method below.
97
To plot moving averages retrieve the floating toolbar by placing the mouse cursor over the
chart and pressing the right mouse button. Click Triple moving averages - button 2 of
Moving averages and you will be asked to indicate whether you require simple or
exponential moving averages and whether for standard or multiple moving averages. Enter as
appropriate and click OK or press ENTER. The corresponding speedkey for this process is
Ctrl A.
The Reset times button will retrieve the default parameters dialog box for review and change
if required.
When regularly using the same three moving averages a quick method is to press Ctrl A and
then Enter.
RHC - RAMSAY HEALTH CARE LTD > -2.4% -114 to 4670 Ex Div 040314 34c (100%)
MOV AVS 65(0) 130(0) 260(0) day
W @ D 160412-110414
4599.6923 4264.0846 3878.8462
6000
5000
4000
3000
2000
1800
5,000,000
Vol = 1,499,800
0
A
M
J
J
A
S
O
N
D
2012
J
F
M
A
M
J
J
A
S
O
N
D
2013
J
F
M
A
Fig 3.2
There is also provision to plot only a single moving average and this is button 1 Single
moving average. The speedkey for this process is A.
Moving Average on Volume
By selecting the first button in the Volume Indicator group on the floating toolbar (or
pressing speedkey I and then 1) you will be requested to supply the number of periods for an
exponential moving average on volume. Enter the number required and a moving average on
volume will appear in the subchart. If you enter zero this will produce a volume chart with no
moving average.
Plotting Multiple Moving Averages
To plot multiple moving averages ensure that you have set and enabled the long and short
term time constants from the time constant form accessed through the speedkey Alt T .
2014
98
Pressing Ctrl A will present the dialog allowing you to choose Multiple moving averages
rather than standard moving averages. Two sets of moving averages of different colours - the
long term set and the short term set will be plotted giving a maximum of 18 moving averages
on the one chart.
Moving Average Envelopes
By placing a band around a moving average you can define a region on the chart where most
of the price action will occur. If the price penetrates the boundaries of this region then the
implication can be that something unusual is occurring such that prices are accelerating more
strongly than normal. The band is calculated so that the upper limit is a given percentage
above the moving average and the lower limit is the same percentage below the moving
average.
ANZ - AUSTRALIA & NEW ZEALAND BANK > -1% -34 to 3385 Ex Div 071113 91c (100%)
W @ D 160412-110414
MOV AVS 13(0) day 5% band
3600
3000
2000
80M
Vol = 20,930,100
0
A
M
J
J
A
S
O
N
D
2012
J
F
M
A
M
J
J
A
S
O
N
D
2013
J
F
M
A
Fig 3.3
To access moving average envelopes retrieve the floating toolbar and click Moving average
envelope - button 2 of Range indicators. The moving average time constant chosen will be
the first moving average set on the Time constants form. You will then be asked for the
percentage width of the band, which will vary with the volatility of the specific security, and
to specify whether the moving average is to be simple or exponential.
AutoEnvelope
However, Moving Average Envelopes are by default created according to an automatic
calculation that determines the percentage width of the bands. This calculation is based on
the bands enclosing at least a certain percentage, say 95%, of bars completely within the
envelope. Whenever the MA envelope option is requested 'Auto' will be displayed in the box
for the 'Percentage band='. The automatic calculation can be overridden if preferred by
replacing this with a specific number for the percentage band required.
2014
99
You can alter the number specifying the default maximum percentages of the bars say 5%
that can extend out of the envelope by calling up the 'Default Parameters for Indicators'
dialog box and entering say '5' in the 'Band' field for 'MA Envelope'. This will ensure that no
more than 5% of bars extend out of the envelope.
The corresponding speedkey for moving average envelopes is Ctrl E.
Bollinger Bands
Another type of envelope was developed by John Bollinger where the width of the band is
not a fixed percentage of the moving average of a security but varies according to its
volatility. It is set to be a number of standard deviations above and below the moving
average.
VOC - VOCUS COMMUNICATIONS LTD > -4.1% -19 to 446 Ex Div 040314 .8c (100%)
W @ D 160412-110414
Bollinger 75( 0) day 2sd
500
400
300
200
180
160
140
14M
Vol = 3,636,600
0
A
M
J
J
A
S
O
N
D
2012
J
F
M
A
M
J
J
A
S
O
N
D
2013
J
F
M
A
Fig 3.4
Bollinger bands are accessed by selecting Bollinger bands - button 1 of Range indicators on
the floating toolbar . You will then be requested to enter the number of standard deviations
for the bands. This defaults to 2. The speedkey for Bollinger Bands is Ctrl B.
Linear Regression
A linear regression calculation can be performed on all of the closing values on the chart by
accessing Regression line – button 3 of Moving Averages or using the speedkey Ctrl G on
any chart. The chart will immediately change to a line chart and display the regression line
and its parameters (see Fig 4.4). These commands are toggles and will remove the regression
line if accessed again. The speedkey Ctrl Z, which removes moving average type indicators,
ratio and rebased mode also removes regression.
When a linear regression line is plotted on a chart the growth rate of the line is displayed viz:
Grate = - the slope of the regression line in percent per annum compounding
2014
100
Line of Linear Regression
The line of linear regression (not to be confused with the linear regression line just discussed)
is the locus of the right hand end of a linear regression line segment drawn through a fixed
number of closing prices. As the range of dates moves from earlier to more recent times the
locus of the right hand end of the line traces out a curve that looks similar to a moving
average. Alan Hull uses this line as a Range Indicator displacing it up and down from a
central “cord” by a certain number of ATRs. This divides his chart into four distinct zones –
a Sell Zone, a Buy/Hold Zone, a Profit Take/Hold Zone and a Profit Take Zone. To do this
division into zones he uses a 13 week period displacing the upper line by 2.5 ATRs and the
lower line by 3 ATRs. As part of his method the lower line is forced to “flatline” ie it is
prevented from falling below the highest value that it has reached to date in accordance with
the philosophy that a stop loss price should never be lowered under any circumstances. Since
the Line of Linear Regression indicator as implemented here is as an envelope for general
application, if the user wishes to employ it for the Hull Range Indicator it will be necessary
to visually “flatline” the lower bound.
BGL - BIGAIR GROUP LTD > -4.9% -5 to 96.5 Ex Div 260813 1c (100%)
W @ W 200412-110414
LineLinreg 13 week 3 ATR below 2.5 ATR above 97.5659 77.8352 114.008
120
100
90
80
70
60
50
40
30
8,000,000
Vol = 1,568,300
0
A
M
J
J
A
S
O
N
D
2012
J
F
M
A
M
J
J
A
S
O
N
D
2013
J
F
M
A
Fig 3.5
To access the Line of Linear Regression select button 3 of Range indicators on the floating
toolbar or use the speedkey Ctrl I. You will be requested to input the required three
parameters with defaults as indicated above. Click OK or press ENTER to accept.
This indicator has arguments for its period and its range displacements up and down for an
envelope. Set both the latter to zero if you do not want an envelope. For a "variable" period
as described by Alan Hull tick the appropriate checkbox and the period value will be ignored.
If you want ATR displacements rather than % displacements then check the ATR boxes and
enter the relevant number of ATRs for the upper and lower bounds.
2014
101
Parabolic Stop and Reverse
Welles Wilder, the originator of many innovative trading indicators, developed the Parabolic
Stop and Reverse System - SAR. It is so called because the system of stops when plotted
resembles a parabola. When a trade is initiated a stop is set and is moved up incrementally
each day in the direction of the trade, slowly at first but increasingly more rapidly so that the
stop becomes progressively tighter. When the stop is hit the trade is reversed immediately to
a trade in the opposite direction. As such you always have a position in the market.
There are three parameters required for this indicator for which the defaults are .02 .02 .2.
The first parameter is the starting acceleration factor which is increased each day by an
amount set by the second parameter up to a maximum of the final parameter. The
acceleration factor determines the tightness of the stop.
AMC - AMCOR > -0.8% -8 to 1013 Ex Div 250214 19.5c (0%)
W @ W 200412-110414
Parabolic/.02/.02/.2 SAR at 1069.77
1200
1000
900
800
700
600
60M
Vol = 17,923,100
0
A
M
J
J
A
S
O
N
D
2012
J
F
M
A
M
J
J
A
S
O
N
D
2013
J
F
M
A
Fig 3.6
To access the Parabolic select button 1 of Stop indicators of the floating toolbar Parabolic
stop and reverse or use the speedkey Ctrl O. You will be requested to input the required
three parameters with defaults as indicated above. Click OK or press ENTER to accept. You
will get a chart as shown above.
2014
102
Chandelier Exit
The Chandelier Exit is designed as a stop indicator to trigger an exit from either a long or
short position. It has been described by Alexander Elder in his book Come into my Trading
Room. For a long position it sets a stop by taking the highest price reached in the previous,
say, 22 days and then setting the stop to say 3 ATRs below this high. An optional ratchet can
be set so that the stop can only be raised but never lowered. For a short position this works
analogously but in reverse.
To access Chandelier Exit select button 2 of Stop indicators of the floating toolbar or use
the speedkey Ctrl M.
HGG - HENDERSON GROUP PLC > -2.8% -13 to 447 Ex Div 070514 0c (0%)
W @ W 200412-110414
Chandelier 22 week High - 3 ATR ratchet 419.159
500
400
300
200
180
160
140
120
50M
Vol = 27,048,400
0
A
M
J
J
A
S
O
N
D
2012
J
F
M
A
M
J
J
A
S
O
N
D
2013
J
F
M
A
Fig3.7
Enter the period and number of ATRs required from the high. If you wish to ratchet the
indicator (ie stop it falling) then tick the ratchet box. . Click OK or press ENTER to accept.
When on ratchet the value of this indicator may initially "flatline" at different places
depending on where you start the chart.
2014
103
Scaffold Exit
The Scaffold Exit is very similar to the Chandelier Exit being designed as a stop indicator to
trigger an exit from either a long or short position. The difference is that, for a long position,
the stop is set from a low rather than a high. For a long position it sets a stop by taking the
lowest price reached in the previous, say, 22 days and then setting the stop to say 3 ATRs
below this low. An optional ratchet can be set so that the stop can only be raised but never
lowered. For a short position this works analogously but in reverse.
To access the Scaffold Exit select button 3 of Stop indicators of the floating toolbar or use
the speedkey Ctrl U.
Enter the period and number of ATRs required from the low. If you wish to ratchet the
indicator (ie stop it falling) then tick the ratchet box. Click OK or press ENTER to accept.
When on ratchet the value of this indicator may initially "flatline" at different places
depending on where you start the chart.
CAJ - CAPITOL HEALTH LTD > -1.7% -1 to 59.5 Ex Div 240314 .4c (100%)
W @ D 160412-110414
Scaffold 22 day Low - 3 ATR ratchet 44.6045
70
60
50
40
30
20
10
9
8
7
6
5
4
3
40M
Vol = 11,537,200
0
A
M
J
J
A
S
O
N
D
2012
J
F
M
A
M
J
J
A
S
O
N
D
2013
J
F
Fig 3.8
Removing Moving Average Type Indicators
Any of the moving average type indicators mentioned above can be removed from the
current chart by pressing Ctrl Z or accessing the Remove button on the floating toolbar.
M
A
2014
104
Volume Based Indicators
Volume
Although volume is raw data and not strictly an indicator it is included in this section for
completeness as you will often wish to revert to volume in the subchart after having plotted
other indicators there. Volume is accessed via the floating toolbar by activating button 1 of
Volume indicators. The speedkey for volume is to press I to activate the menu for Indicators
and then 1 for Volume.
If you wish to display an exponential moving average on your volume then enter a non-zero
value for the number of periods in the dialog box that appears.
Fig 2.3 from the last chapter shows volume as a histogram for a daily chart.
On Balance Volume
Joe Granville originated the concept of On Balance Volume. It is an example of an
accumulation index where one starts with an arbitrary large number and adds or subtracts a
variable incremental value each day. On Balance Volume simply adds the volume for the day
(or other period) if the day’s close is above the previous day’s close or subtracts it if it is
below. An increasing On Balance Volume is claimed to indicate that strong hands are
accumulating and a declining OBV that strong hands are distributing.
TGR - TASSAL GROUP LTD > -1.2% -5 to 408 Ex Div 070314 5.5c (50%)
W @ D 020412-110414
500
400
300
200
100
400,000
OBV
-100,000
A
M
J
J
A
S
O
N
D
2012
J
F
M
A
M
J
J
A
S
O
N
D
2013
J
F
M
Fig 3.9
OBV is accessed by clicking On balance volume - button 2 of Volume indicators on the
floating toolbar . The speedkey is I for the Indicator menu then 2 for OBV. No parameters
are required.
A
2014
105
Volume Accumulation
Volume Accumulation was developed by Marc Chaikin and is an accumulation indicator
similar to OBV except that only a proportion of the day’s volume is added or subtracted
depending on whether the close of the day was above or below the midpoint of the day’s
range. The proportion is the proportion by which the close is above (or below) the midpoint
on its way to the high (or the low). the interpretation of this indicator is similar to that of
OBV.
Volume accumulation is accessed by clicking button 3 of Volume indicators on the floating
toolbar. Using speedkeys press I for the indicator menu and 3 for Volume accumulation. No
parameters are required for this indicator.
Volume/Price Trend Accumulator
This is another accumulation indicator based on volume but where the volume for the day is
accumulated after weighting it by the difference between today’s close compared with
yesterday’s close.
Volume/price trend accumulator is accessed by clicking button 4 of Volume indicators on
the floating toolbar. Using speedkeys press I for the indicator menu and 4 for Volume/price
trend accumulator. No parameters are required for this indicator.
Force Index
Force Index is a volume based indicator developed by Alexander Elder. It is an oscillator
measuring the force of bulls behind every rally and the bears behind every decline. It is
defined as the product of today’s volume and the difference between today’s price and
yesterday’s price. It is generally smoothed with an exponential moving average.
The Force Index is accessed from the floating toolbar by clicking Force Index - button 5 of
Volume indicators. Specify the smoothing period required.
Speedkey access is via I for the Indicator menu and selecting K
Force Index.
Other Indicators
Momentum
Unfortunately there are some inappropriately named indicators in the general category of
momentum indicators that we will need to clarify.
A simple n-day momentum is just the difference between the price at a given time P i and that
n days previously Pi-n ie Momentum=Pi-Pi-n. (Momentum is also sometimes incorrectly
referred to as price velocity. True price velocity would properly be defined as (P i-Pi-n)/n.)
106
This simple concept of momentum has limited usefulness because a high priced security
rising by the same percentage as a low priced security over a given period will have a much
higher momentum. This means that we cannot easily compare one security with another.
The so called Rate of change is a related indicator that has overcome this problem by being
defined as the price at a given time divided by the price n days previous and will therefore
directly compare different priced securities for the same value of n.
However, even so called Rate of change is not actually a rate of change at all (because it is a
pure number with no dimensions of time) and should rather be called the ratio of change as
it will not allow you to directly compare the rate of increase of price of a security for
different time periods.
Assume for the sake of argument that you are looking at a security trading at 1000 cents that
is increasing steadily by 100 cents every 5 days. The 5 day “rate of change” will be 1.1 but
the ten day “rate of change” will be 1.2 even though the true “rate of change” is a constant 20
cents per day.
Insight Trader has redefined Momentum to be the true fractional rate of change in price so
that we can directly compare different priced securities AND different time periods.
We define the n period Momentum as:
Momentum=(Pi-Pi-n)/Pi/n*15
Pi is the price for the time period i, P i-n is the price n periods previously, n is the time
constant of the momentum. 15 is simply a factor to make the resulting numbers a manageable
size and has the effect of making this definition of momentum to be equivalent to the true
fractional rate of increase in price (per 15 days).
This definition of momentum will give the same value for all securities which have been
steadily increasing in value by a fixed percentage per day of today’s price irrespective of the
original prices of each security and irrespective of the time period chosen for the indicator. It
is a true fractional rate of change. For example if you get a 10 day momentum value for today
of 0.05 this means that the price over the 10 days has increased at a rate of 5% (of today’s
price) per 15 days (ie 1/3% per day).
Over longer periods the price momentum of a security is better measured by the previously
discussed global indicator of Velocity.
107
MIN - MINERAL RESOURCES LTD > -0.4% -5 to 1159 Ex Div 140314 30c (100%)
W @ D 011012-110414
1400
1200
1000
900
800
700
0
5 day Momentum = -0.01
Mom
0
O
N
D
2012
J
F
M
A
M
J
J
A
S
O
N
D
2013
J
F
M
A
Fig 3.10
To access momentum click Momentum - button 1 of Subchart indicators on the floating
toolbar and enter the required number of periods for the parameter. Alternatively use the
speedkey I to access the indicator menu and 5 for Momentum.
2014
108
Detrend
Detrending is the process of removing longer term cycles from a chart to reveal the shorter
term variations which overlie these. Detrend is simply calculated by subtracting a moving
average from the price. A moving average smooths out the shorter term variations and
reflects only those longer term cycles. By subtracting this from the price we are left with the
shorter term fluctuations with the underlying trend removed.
One can detrend by simply subtracting the moving average but sometimes it is better to lag
the moving average by approximately one half of its period to “centre” it before doing the
subtraction. Detrending is used frequently in cycle analysis to identify the shorter term
cycles by removing the confusion of superimposed longer term cycles.
ICQ - iCAR ASIA LTD > -6.8% -8.5 to 117
MOV AVS 30(0) day
W @ D 110912-110414
131.2167
160
140
120
100
90
80
70
60
50
40
30
20
18
1
30(0) day Detrend = -0.1083
Detr
0
S
O
N
D
2012
J
F
M
A
M
J
J
A
S
O
N
D
2013
J
F
M
A
Fig 3.11
Detrend is accessed from the floating toolbar by clicking button 2 of Subchart indicators. A
dialog box will then request the time period and also the lead or lag required. By speedkey
you would press I for the Indicator menu then 6 for Detrend.
2014
109
Moving Average Oscillator
A moving average oscillator is the difference between two simple moving averages of
different periods. It allows moving average crossover points to be more easily detected and
constitutes an oscillator in its own right. It is implemented in Insight Trader as a proportion
of the value of the longer term average.
FXL - FLEXIGROUP LTD > -2.1% -8 to 371 Ex Div 070314 8c (100%)
W @ D 010212-110414
500
400
300
200
180
0
5/ 10 day MA Osc = 0.0205
MAOs
0
F
M
A
M
J
J
A
S
O
N
D
2012
J
F
M
A
M
J
J
A
S
O
N
D
2013
J
F
M
A
2014
Fig 3.12
Moving average oscillators are particularly useful in pinpointing more accurately the
crossovers of two moving averages and helping to detect divergences.
This oscillator can be plotted from Moving average oscillator – button 3 of Subchart
indicators on the floating toolbar. Speedkeys use I for the indicator menu and 7 for the
Moving average oscillator.
The moving average oscillator is implemented as the difference between the shorter moving
average and the longer no matter in what order the time constants are entered.
110
Relative Strength Index
Relative Strength Index or RSI is probably the most popular of all oscillator type indicators.
It was developed by Welles Wilder and has nothing to do with the normal definition of
relative strength that is simply the ratio of one entity to another. RSI operates purely on, and
requires only, the closing price.
Since the calculation of relative strength is fairly involved, for a detailed explanation it is best
to refer to the original publication outlining its definition. However, for any period of n days,
it is based on the ratio of the average points gained on the n days up closes to the average
points lost on the n days down closes. The averages used are in fact exponential type
averages and utilise all previous data.
SEA - SUNDANCE ENERGY AUSTRALIA LTD > +0.5% +0.5 to 96
W @ D 031212-110414
120
100
90
80
70
100
7 day RSI = 50.1
RSI
0
DEC
2012
JAN
FEB
MAR
APR
MAY
JUN
JUL
AUG
SEP
OCT
NOV
DEC
2013
JAN
FEB
MAR
APR
Fig 3.13
The oscillator fluctuates between 0 and 100 and any value above 70 is referred to as
overbought and any value below 30 is referred to as oversold. The most important use of RSI
according to Wilder is in identifying divergences when the oscillator is in these extreme
regions. RSI requires one parameter and Wilder used a value of 14 days in his original work.
RSI - Relative strength index is accessed from the floating toolbar by clicking button 4 of
Subchart indicators and entering the number of periods required. Speedkey access is
obtained by pressing I for the Indicator menu and 8 for RSI.
2014
111
Stochastic
The stochastic was developed by George Lane and is calculated on high, low and close for a
given period. It is defined as the ratio of the latest close minus the low for the period and the
high minus the low for the same period expressed as a percentage. This is referred to as the K
line. The D line is calculated as the simple 3-day moving average of the K line. This
indicator will obviously not calculate for close only data.
The two lines are plotted together on the same chart and vary from 0 to 100. Overbought and
oversold regions are above 70 and below 30 as for RSI. Signals are given when the K line
crosses the D line and when divergences are noted. The interpretation of the stochastic is
quite involved and a full reading of the original text is suggested.
The stochastic is accessed from the floating toolbar by clicking Stochastic - button 5 of
Subchart indicators on the floating toolbar and entering the number of periods required for
the indicator. Speedkey access is obtained with I for Indicator menu and 9 for Stochastic.
Note that Larry Williams’ %R is 100 - Lane’s Stochastic %K.
Slow Stochastic
The slow stochastic is a smoothed version of the normal stochastic where the new K and D
lines are simply 3 day smoothed versions of the K and D lines of the normal stochastic. This
version of the indicator is generally preferred over the unsmoothed one which tends to jump
around excessively.
NST - NORTHERN STAR RESOURCES LTD > -3.7% -4.5 to 116.5 Ex Div 060314 1c (100%)
W @ D 020413-110414
140
120
100
90
80
70
60
50
100
14 day %k = 73.276 %d = 58.369
SSTO
0
APR
MAY
JUN
JUL
AUG
SEP
OCT
NOV
DEC
2013
JAN
FEB
MAR
APR
Fig 3.14
Slow stochastic is accessed from the floating toolbar by clicking button 6 of Subchart
indicators and entering the number of periods required for the indicator. Speedkey access is
obtained with I for Indicator menu and A for Slow Stochastic.
2014
112
MACD
Moving Average Convergence Divergence (MACD) trading method was developed by
Gerald Appel as a price momentum indicator. It is an oscillator calculated as the difference
between the 26 period exponential moving average and the 12 period exponential moving
average to give the first line. This difference is in turn smoothed by a 9 period exponential
moving average called the signal line. Although these were the original periods suggested the
user can experiment with other values.
There are a number of ways to interpret signals from this indicator that involve the shorter
line crossing the slower line and also crossing above and below the zero line. Divergences
can also be significant.
MTU - M2 GROUP LTD > -1.6% -9 to 567 Ex Div 130314 11.5c (100%)
D @ D 130213-250214
800
700
600
500
400
30
26/12/9 day MACD = 8.32 Signal = 3.635
MACD
-20
FEB
MAR
APR
MAY
JUN
JUL
AUG
SEP
OCT
NOV
DEC
2013
JAN
FEB
Fig 3.15
MACD - Moving average convergence divergence is accessed from the floating toolbar
with button 7 of Subchart indicators and entering the three parameters required. Speedkey
for this indicator is I for the Indicator menu and B for MACD.
2014
113
MACD Histogram
The so called MACD “Histogram” is actually the difference between the two oscillator lines
of the MACD traditionally presented in the form of vertical bars or a histogram although it
can be equally well (and perhaps more conveniently) presented as a line chart. This indicator
is used and interpreted by a number of authors in different ways and again it is best to consult
these texts for details of the different approaches taken.
MTU - M2 GROUP LTD > -1.6% -9 to 567 Ex Div 130314 11.5c (100%)
D @ D 130213-250214
800
700
600
500
400
8
26/12/9 day MACDh = 4.686
MACDh
-12
FEB
MAR
APR
MAY
JUN
JUL
AUG
SEP
OCT
NOV
DEC
2013
JAN
FEB
Fig 3.16
MACDH - MACD Histogram is accessed from the floating toolbar with button 8 of
Subchart indicators and entering the three parameters required. Speedkey for this indicator is
I for the Indicator menu and C for MACDH.
Directional Movement Indicator +DI -DI ADX
Welles Wilder is the originator of the Directional Movement Indicator or DMI which is
designed to assess the degree to which a market is trending and allows comparison between
the directional movement or trend in different markets. This is a fairly complex indicator to
both calculate and interpret and the reader is referred to the original text for a more detailed
treatment.
Two lines known as the +DI and -DI are generated, the first of which measures positive or
upward movement and the second measures negative or downward movement. Some
interpretations suggest that a buy signal is given when the +DI line crosses above the -DI line
and a sell signal when it crosses below the -DI line.
2014
114
There is a third line called the ADX or Average Directional Movement Index is an
exponential smoothing of the Directional Movement or DM which is itself a function of +DI
and -DI.
VRL - VILLAGE ROADSHOW > -1.9% -14 to 705 Ex Div 050314 13c (100%)
W @ W 060112-110414
800
700
600
500
400
300
260
70
14 week PDI = 17.21 MDI = 22.665 ADX = 31.196
+/-DI
0
J
F
M
A
M
J
J
A
S
O
N
D
2012
J
F
M
A
M
J
J
A
S
O
N
D
2013
J
F
M
A
Fig 3.17
These three lines of the Directional movement indicator - +DI -DI ADX are accessed from
the floating toolbar button 9 of Subchart indicators. The user is then asked to input the period
required for which a suggested value is 14. Speedkey for these indicator lines is I for the
Indicator menu and D for +DI -DI ADX.
Directional Movement Indicator ADX/ADXR
There is a further DMI line called the ADXR or Average Directional Movement Index
Rating. This is the average of today’s ADX and the ADX n days ago where n is the number
of periods set for the parameter of DMI.
ADX and ADXR are plotted together in much the same way as a pair of signal and trigger
lines.
These two lines of the DMI ADX/ADXR are accessed from the floating toolbar button 10 of
Subchart indicators. The user is then asked to input the period required for which a suggested
value is 14. Speedkey for these indicator lines is I for the Indicator menu and E for ADX
ADXR.
2014
115
Coppock
The Coppock Indicator is a ten month weighted moving average of the average of the
fourteen month and eleven month simple momentums for an index. Ed Coppock’s original
suggested action was to buy or accumulate stock when the indicator was below zero. This is
a long term indicator and was not intended as providing a corresponding sell signal.
XAO - ALL ORDINARIES INDEX > -1% -54.076 to 5423.461
M @ D 310174-110414
7000
6000
5000
4000
3000
2000
1000
900
800
700
600
500
400
300
200
100
800
Coppock = 135.684
Copp
-600
1980
1990
2000
2010
Fig 3.18
The Coppock indicator is accessed from the floating toolbar by clicking button 11 of
Subchart indicators. There is no adjustable parameter for this indicator. Speedkey access is
via I for the Indicator menu and selecting F Coppock.
Average True Range
Average True Range was concept introduced by J. Welles Wilder to measure the volatility
of a market. True Range for a day is defined as the difference between its high and its low
so long as the previous days close was inside this range. If the previous day’s close was
outside this range then we need to add to today’s range either the amount that yesterday’s
close was above today’s high or the amount that yesterday’s close was below today’s low –
depending on what circumstances were applicable.
Average True Range is simply the average of all the True Ranges for a given number of
periods. This measure is used extensively in technical analysis and in the application of many
other indicators.
116
The Average True Range indicator is accessed from the floating toolbar by clicking button
12 of Subchart indicators. Specify the period and it will be plotted in its raw form or as a
percentage of the price if the % box is ticked. Speedkey access is via I for the Indicator menu
and selecting G ATR.
Rate of Return
The Rate of Return has been defined by Alan Hull as the proportional change in price of the
Line of Linear Regression annualised from its period of measurement. The Rate of Return as
implemented here has a definition slightly modified from the original (that had the current
share price rather than the LLR as the denominator):
(LLR(now) - LLR(delta periods ago)) / LLR(now) expressed as an annualised percentage.
This can be calculated using daily, weekly or monthly compressed files.
The Rate of Return attempts to measure how fast the price has been rising. It is expressed
both proportionally and annualised – eg 30% pa - so that values obtained from different
securities with widely differing share prices may be validly compared.
RHC - RAMSAY HEALTH CARE LTD > -2.4% -114 to 4670 Ex Div 040314 34c (100%)
W @ D 030106-110414
6000
5000
4000
3000
2000
1800
1600
1400
1200
1000
900
800
60
260 / 130 day Rate of Return = 35 % pa
RoR
-30
2006
2007
2008
2009
2010
2011
2012
2013
2014
Fig 3.19
The Rate of Return indicator is accessed from the floating toolbar by clicking button 13 of
Subchart indicators. Specify the period required for the underlying LLR and the separation,
delta, of the two reference points.
Speedkey access is via I for the Indicator menu and selecting H
RoR.
If you specify delta as zero this indicator will simply calculate the annualised proportional
slope of a regression line for the specified period and plot the value on the chart at a time
corresponding to the right hand end of the line.
117
Linear Regression Growth Rate
Linear Regression Growth Rate is the slope of the linear regression line covering a number
of periods back from the date at which it is to be measured. This number of periods is the
single parameter that this indicator takes. LRGR is expressed in terms of percent per annum
compounding. It is accessed from button 20 of Subchart indicators.
Speedkey access is via I for the Indicator menu and selecting R
LRGR
Money Flow
Money Flow is an indicator that attempts to approximate average daily turnover by taking the
product of the closing price and the volume for each bar and averaging this product over a
given period. It is expressed in $ per day irrespective of the compression of the file.
The Money Flow indicator is accessed from the floating toolbar by clicking button 14 of
Subchart indicators. Specify the period required.
Speedkey access is via I for the Indicator menu and selecting I Money Flow.
Money Flow Index
Steven Archelis has defined Money Flow Index in a way that is some what analogous to the
formula for RSI except that this indicator purports to measure whether money is flowing into
increasing prices in a stock or into decreasing prices.
The Money Flow Index indicator is accessed from the floating toolbar by clicking button 22
of Subchart indicators. Specify the period required.
Speedkey access is via I for the Indicator menu and selecting Q
Money Flow Index.
Bull Power and Bear Power
Bull Power and Bear Power are the two components of the Elder-Ray index as developed by
Alexander Elder to reveal the power of bulls and bears below the surface of the markets.
Bull Power is the difference between the high and the exponential moving average. Bear
Power on the other hand is the difference between the low and the exponential moving
average. It is implemented here as two lines on the same indicator subchart, the top one being
Bull Power and the bottom one being Bear Power.
The Elder-Ray Index is accessed from the floating toolbar by clicking button 15 of Subchart
indicators. Specify the period required.
Speedkey access is via I for the Indicator menu and selecting J
Elder Ray.
Williams %R
Williams %R is an oscillator described by Larry Williams that is very closely related to the
stochastic (100 – Stochastic %K) and it measures the tendency for prices to close each day
near the extremities of their recent ranges.
The Williams %R is accessed from the floating toolbar by clicking button 16 of Subchart
indicators. You need to specify the period required.
Speedkey access is via I for the Indicator menu and selecting L
Williams %R.
118
Bollinger %b
%b is an indicator based on the Bollinger Bands which have been described earlier in this
chapter. It measures the proportional extent to which the price has closed between the bottom
band and the top band. For example if the price has closed on the bottom band then %b will
equal zero. If it closes on the top band then %b will have the value 1. For a close half way
between the two bands the value of %b will be 0.5. Because the price can close outside the
bands it is possible for this indicator to assume values below zero and above 1.
SGN - STW COMMUNICATIONS GROUP LTD > -0.3% -0.5 to 143.5 Ex Div 270314 5.3c (100%)
W @ D 010312-110414
180
160
140
120
100
90
80
1
13 day / 2 std devs Bollinger %b = 0.761
%b
0
M
A
M
J
J
A
S
O
N
D
2012
J
F
M
A
M
J
J
A
S
O
N
D
2013
J
F
M
A
Fig3.20
The %b indicator is accessed from the floating toolbar by clicking button 17 of Subchart
indicators. You need to specify the period required as well as the number of standard
deviations that the bands should cover.
Speedkey access is via I for the Indicator menu and selecting M
%b.
%BBW (Bollinger Band Width)
%BBW is another indicator based on the Bollinger Bands and it is simply the standard
deviation, expressed as a percentage of the moving average value at any point, that is
obtained when the Bollinger Band width is calculated. It is the Bollinger band width where
the bands are created to be one standard deviation in extent.
%BBW is accessed from the floating toolbar by clicking button 18 of Subchart indicators.
You only need to specify the period required as the Bollinger bands are assumed to be only
one standard deviation wide.
Speedkey access is via I for the Indicator menu and selecting N
%BBW.
2014
119
Trend
Trend is an analogous calculation to Rate of Return except that it is based on moving
averages rather than a line of linear regression except that it is expressed as an annualised
compounding growth rate like LRGR. This can be calculated using daily, weekly or monthly
compressed files.
Trend attempts to measure how fast the price has been rising. It is expressed both
proportionally and annualised – eg 30% pa - so that values obtained from different securities
with widely differing share prices may be validly compared.
The Trend indicator is accessed from the floating toolbar by clicking button 19 of Subchart
indicators. You will need to specify the period required for the underlying MA and the
separation, delta, of the two reference points.
Speedkey access is via I for the Indicator menu and selecting O
Trend.
SROC Smoothed Rate of Change
Although there are several way to calculate SROC, an oscillator developed by Fred
Schutzman, we employ the variation described by Alexander Elder. We first need to
understand the concept of Rate of Change. This is simply today’s closing price divided by the
closing price a given number of periods ago and the result will oscillate around 1. If we wish
to smooth it we first take an exponential moving average of the closing prices and then
calculate a rate of change on this moving average rather than on the individual prices.
The SROC indicator is accessed from the floating toolbar by clicking button 21 of Subchart
indicators. You will need to specify the period required for the underlying EMA and the
separation, delta, of the two reference points.
Speedkey access is via I for the Indicator menu and selecting P
SROC.
Velocity and Behaviour
The global indicators Velocity and Behaviour discussed at the beginning of this chapter can
also be plotted as subchart indicators. It is important to understand that in this situation the
compression state (days, weeks or months) of the chart will affect these indicators and the
Velocity settings set under Format/Define Velocity will refer to the relevant period rather
than days. These can be accessed as the final two buttons 23 and 24 of Subchart Indicators
on the floating toolbar.
Speedkey access is via I for the Indicator menu and selecting S
T
Velocity
Behaviour
or
120
RHC - RAMSAY HEALTH CARE LTD > -2.4% -114 to 4670 Ex Div 040314 34c (100%)
W @ D 010212-110414
6000
5000
4000
3000
2000
1800
1600
100
Compression day Velocity = 72 % pa cpd
Velocity
-10
100
Behaviour = 88 %
Behaviour
20
F
M
A
M
J
J
A
S
O
N
D
2012
J
F
M
A
M
J
J
A
S
O
N
D
2013
J
F
M
Fig 3.21
Divergences
One important use of indicators is their performance relative to the actual price performance
of the security. Certain indicators can generally follow the price movements such that when
the price goes to a new high the indicator will also reach a new high. Similarly they will
follow the price for new lows. However, this is not always the case and the price may go to
new highs but the indicator falls short of making a new high itself. Under these
circumstances we say that there has been a divergence between the price action and the
indicator action.
The occurrence of divergences can signal an imminent change in trend but this is not always
so and so some authors consider that other criteria must also be satisfied simultaneously.
Insight Trader allows the detection of divergences on the indicators of RSI, Stochastic and
Slow Stochastic. From the floating toolbar click on Divergence - button 1 of Detection and
this will toggle on the detection of divergence on these indicators. Divergence is highlighted
by a line joining the peaks (or troughs) on the indicator chart where this is moving in the
opposite direction to that of the price chart. The speedkey for this process is Ctrl D.
Note that the detection of divergence is restricted to peaks or troughs which commence in the
overbought or oversold regions of these indicators and that should the value of the indicator
pass through the 50% line then any test for divergence currently underway will be aborted
and reset.
Also note that divergences are identified as they would have been on the day on which they
occurred when the new peaks or troughs are made. Subsequent price action may take the
peaks or troughs further such that hindsight type identification of divergences on historical
data might put divergences in different places.
A
2014
121
Stacked indicators
CBA - COMMONWEALTH BANK > -0.7% -53 to 7736 Ex Div 170214 183c (100%)
W @ D 011112-110414
8000
7000
6000
5000
1,600,000
OBV
-200,000
100
RSI
0
100
SSTO
0
160
MACD
-160
60
MACDh
-80
60
Velocity
0
100
Behaviour
20
7 day RSI = 59.3
14 day %k = 89.796 %d = 83.379
26/12/9 day MACD = 51.714 Signal = 45.196
26/12/9 day MACDh = 6.519
Compression day Velocity = 7 % pa cpd
Behaviour = 41 %
NOV
DEC
2012
JAN
FEB
MAR
APR
MAY
JUN
JUL
AUG
SEP
OCT
NOV
DEC
2013
JAN
FEB
MAR
APR
Fig 3.22
Whenever you select an indicator for charting it will add itself underneath any other volume
chart or indicators that may already be in the subchart - up to a total of 9 stacked under the
main chart.
Removing an indicator from the stack
Any indicator may be removed from the stack simply by placing the cursor in the margin to
the right of the vertical scale next to the indicator to be removed and clicking the right mouse
button.
Removing all indicators from the stack
To remove all indicators press the speedkey V to toggle the subchart off or click button 6 of
Axes on the floating toolbar. If you now invoke a new indicator it will be the first on a new
stack.
Changing the size of the subchart
To quickly change the size of the subchart place the mouse cursor in the margin to the right
of the vertical axis at the level where you wish to reposition the top of the subchart and click
the left mouse button. Dragging the mouse instead will allow you to alter the subchart
continuously.
2014
123
Chapter 4
Specialised Chart Customisation
This chapter describes a limited number of specialised operations that enable certain effects
to be achieved that are not possible otherwise. However, most users will never have to
concern themselves with these options and can therefore skip this chapter, at least on a first
pass through the manual.
So far we have placed all of our indicators in the lower portion of the window or subchart.
However, it is also possible to place these indicators in the main chart and in fact have
different indicators in both the subchart and the main chart. Moreover it is possible to chart
different elements of your data file eg Open High Low Close Volume separately or even
perform calculations on them prior to charting.
Insight Trader has an extremely flexible file structure that allows you to place information in
your data files in a great variety of ways. You are not limited to the usual 4, 5 or 6 field
HLCV, OHLCV or OHLCVI file structures (O - Open, H - High, L - Low, C - Close, V Volume, I - Open Interest). You can have between 2 and 20 fields (or locations) in your files
in which you can put data of different types.
The first field is always a date field but the other 19 could all be closes from 19 different
securities. There is even another data type called an accumulator where daily data is added to
the file as an incremental value that gets added to the accumulating total. When charted the
cumulative total is plotted but the data when viewed or entered is the incremental value. This
data type allows advance/decline type indicators to be easily managed.
In addition to the above, this section will show you how to plot scatter diagrams, to create
charts where the horizontal axis is not time and which can even be logarithmically scaled and
to perform linear regression analysis.
Chart Specifications
Selecting the option View/Chart specs from the menu or using the speedkey Ctrl+Alt F will
display two rectangles on a dialog box. The first is a list of all the data entities (which are
referred to as fields) available in the file together with their corresponding field numbers. The
second is the Define Calculation Required form on which you can customise the specific
information that you want to be displayed on the chart.
124
Fig 4.1
X-axis:
The first entry to be completed is the number of the field you wish to plot as the X-values.
This will normally be field number 1, the date, but can be any other field number in the file.
Y-axis:
The second entry defines the field, or field combinations, to be plotted as the Y-value and can
be:
(i)
a single field number
(ii)
the difference between two field nos eg. 5-3
(iii)
the ratio of two field nos eg. 6/15 also called relative strength)
(iv)
the product of two field nos
(v)
a combination of the products and ratios of 3 field nos
2*13*4 or 2*13/4
(vi)
A file name terminated by a backslash eg. BHP\ (rebased chart)
(vii)
Two file names separated by a backslash eg. BHP\RIO (Relative strength
chart)
(viii)
Two file names separated by two backslashes eg. BHP\\RIO. (Rebased
relative strength)
eg. 6*15
eg. 2/13/4,
125
Note that option (v) allows you to plot compound indices like the currency corrected ratio of
the All Ordinaries to the Dow by dividing the Ords by the Dow and multiplying by the
Aussie dollar.
The final three options (eg. BHP\RIO) will ignore the currently loaded data file and take the
ratio of the default field of the first file to the default field of the second if present and
rebasing if appropriate. The example above will give the relative strength of BHP to RIO by
dividing the default field no of file BHP (ie. the close) by the default field of file RIO (ie.
also the close). If either file does not exist this specification will not be accepted.
In the Y-axis box:
To obtain a rebased plot enter the filename and terminate with a
backslash.
To plot the relative strength of one security by another where these
exist in separate files, enter their filenames separated by a backslash
eg. BHP\RIO.
To plot the rebased relative strength separate the two filenames with
a double backslash eg BHP\\RIO
Date Range:
The date range for plotting ie. the start date and finish date is specified next. This will select
all data from the file with dates occurring between, and including, these two extremes. Data
outside this range will be excluded. Dates must be entered in the form ddmmyy. If zero, or no
character at all, is entered for either the start or finish date, this will refer to the FIRST or
LAST date in the file, respectively.
This is indicated as such as soon as the user leaves this edit box. If a default starting date has
been specified in the Preferences form from Format in the main menu, then the FIRST date
will be taken as this default date rather than the very first date in the file.
NB Setting the date range allows you to select records from a range of
dates for plotting. It does not set SCALES on the X-axis, an option
which is available on the next form.
Chart Type:
This dropdown list box will show the several different types of charts that are possible. The
required type can be selected by clicking the button to the right of the box to display the list
and then clicking on the one desired. The chart types which are available from this form are:
126
(i)
Line or scatter
(ii)
High-low-close bar chart daily
(iii)
High-low-close bar chart weekly
(iv)
High-low-close bar chart monthly
(v)
Point and figure
(vi)
Equivolume daily
(vii)
Equivolume weekly
(viii)
Equivolume monthly
(ix)
Gann swing chart
Candlesticks and equicandles are also available but are accessed directly from the chart using
the single keystrokes C and Q.
The last three options are selectable only if an associated volume field follows the main chart
field specified for the Y-axis.
Strictly speaking, chart types (ii) to (viii) are really only applicable for a field which is the
close of a high-low-close set. For example, daily HLC bar charts will be plotted from a daily
HLC file. Weekly HLC bar charts will be calculated from daily HLC data or plotted directly
from a weekly HLC data file. Similarly, monthly HLC charts will be calculated from daily
HLC data or plotted directly from a monthly HLC file.
However, (iii), (iv), (v), (vii) and (viii) are still selectable for a simple close field of a data
file with more frequent entries (provided that, in the case of equivolume charts, the relevant
volume field follows). Weekly and monthly charts will be automatically calculated from
daily data files by accumulation of the appropriate daily close information. Similarly,
monthly charts can be accumulated from weekly close files.
It should be understood that the calculations performed on a close only file will not be strictly
correct since, eg. a weekly HLC bar chart calculated from an isolated daily close field alone,
will only show the weekly range for the daily closes. The bars produced will be, in general,
somewhat shorter than if the whole day's trading range had been included. Nevertheless, this
facility has been made available because it will be of value under appropriate circumstances,
provided the limitations of the calculation are borne in mind.
127
Main Chart Indicator:
Since up to 9 indicators may be stacked under the main price chart the following option
should only be used in very specialised circumstances.
Provided the Line or Scatter option has been selected for the chart type above, it is possible
to perform one of a number of calculations on the Y field (or field product, ratio, spread etc
described above). In addition the following is a list of the indicators which can be plotted in
the main chart, together with the number of parameters or time constants required by each,
which must have been previously specified (see above) in the Time Constants form. These
are displayed in the drop down list box where a single click will select the one required.
Indicator
No of Parameters
(I)
Direct
0
(ii)
Momentum
1
(iii)
Moving average oscillator
2
(iv)
Detrend
2
(v)
Relative Strength Index
1
(vi)
Stochastic
1
(vii)
Slow Stochastic
1
(viii)
MACD
3
(ix)
MACD Histogram
3
(x)
+DM/-DM ADX
1
(xi)
ADX/ADXR
1
(xii)
Coppock Indicator
0
Please note that the Coppock is a long term indicator and requires at least two years of data
before displaying any information of significance.
128
MIN - 14 unit S-STOCH
- MINERAL RESOURCES LTD > -0.4% -5 to 1159 Ex Div 140314 30c (100%)
D @ D 030613-110414
100
90
80
70
60
50
40
30
20
10
0
20
26/12/9 day MACDh = 1.976
MACDh
-20
JUN
JUL
AUG
SEP
OCT
NOV
DEC
2013
JAN
FEB
MAR
APR
Fig 4.2
Subchart Indicator:
A subchart can be plotted under the main chart and is used for displaying volumes and
derived volumes associated with securities on the main chart. It can be used as well for the
same indicators as listed for the main chart above. The available indicators are:
2014
129
(i)
None
(ii)
Volume
(iii)
On balance volume
(iv)
Volume accumulation
(v)
Volume price trend
(vi)
Momentum
(vii)
Detrend
(viii)
Moving average oscillator
(ix)
Relative Strength Index
(x)
Stochastic
(xi)
Slow Stochastic
(xii)
MACD
(xiii)
MACD Histogram
(xiv)
+/-DI ADX
(xv)
ADX/ADXR
(xvi)
Coppock Indicator
(xvii)
Linear Regression Growth Rate
(xviii)
Velocity
(xix)
Behaviour
Options (ii)-(v) are available only for securities on the main chart which have an associated
volume field following. Options (vi)-(xix) have time constant requirements as specified in
the preceding section.
When this dialog box (also known as the First Form) is complete it is accepted by clicking
OK.
This will lead into the next dialog box also known as the Second Form, the Define Chart
Specifications form, which enables you to customise the details of how the chart will be
presented.
130
Define Chart Specifications
Fig 4.3
X-axis Type:
This drop down list box shows the three options which are available for the X-axis viz.
Calendar, Linear and Logarithmic. If field no 1, the date, has been chosen for the X-axis in
the previous form then this entry will default to Calendar and cannot be changed.
Scaling:
Two options for scaling are possible viz. Autoscaling and Set Scales. Autoscaling will search
the data and automatically adjust the scale to an optimum for the display.
Set scaling will allow you to adjust the scaling to your requirements and is quite independent
of the date range chosen for the data in the previous form. The date range for set scaling
should be entered in the From: and To: edit boxes to the right using the format ddmmyy. For
a sensible chart the date range for scaling should at least span the date range for the data but
can exceed it.
When scales are set the program will choose a range which includes the range which you
have specified but may exceed it. The actual scale is chosen to sensibly round off the starting
and finishing values.
131
Running Time Window:
A running time window may be set by entering, say, -100 in the from:- option and nothing in
the to:- option. This will fix a time window to show only the last 100 calendar days. Specify
-365 to show data back to a year ago.
As data is added to the data file additional days are added on to the display and excess days
are dropped off the end. If in addition you place the character @ plus a positive number in
the to:- option then blank space to accommodate this number of days will be left at the front
of the chart to allow you to project trendlines and cycle grids into the future.
The ranges should be specified in the following form:
From:
ddmmyy
To:
@+100
OR
From:
-360
To:
@+100
Specifying the @ character will allow the computer SYSTEM date (ie today) to be used to
set the upper date of the range.
The first example shown above will fix the lower date in the range as specified and the upper
date in the range will be set at the system date with 100 days of white space in front for
projecting trendlines. The example on the right is a running time window showing almost a
year of data with 100 days of white space ahead of the last point plotted.
Y-axis:
The options for scaling on the Y-axis are identical to those for the X-axis except that
Calendar axes are not possible.
Symbols:
If the chart type has been specified as Line or Scatter in the previous form then data symbols
can be plotted in one of several different shapes viz. none, crosses, plusses, squares, triangles
and bars. The drop down list box will display the options from which the desired symbol is
selected. The size for the symbols can be similarly selected from zero to 6.
Linear Regression:
A linear regression calculation can be performed on all displayed data points by checking this
option. Regression mode can also be toggled on and off directly from the chart using the
speedkey Ctrl G. Before regression is invoked, if the horizontal axis is not time, it is usual to
have selected a symbol of a certain size, and the Suppress Line option below should be
checked also to prevent the individual points being joined by straight line segments. This will
also hide bars and candles which can also be toggled on and off directly from the chart using
the speedkey Ctrl H. The speedkey Ctrl Z, which removes moving average type indicators,
ratio and rebased mode also removes regression.
132
TGR - TASSAL GROUP LTD > -1.2% -5 to 408 Ex Div 070314 5.5c (50%)
D @ D 020413-110414
500
400
300
200
180
G/rate = 98.3% pa cpd
160
APR
MAY
JUN
JUL
AUG
SEP
OCT
NOV
DEC
2013
JAN
FEB
MAR
APR
Fig 4.4
When a linear regression line is plotted on a logarithmic chart the slope of the line is also
displayed viz:
G/rate = - the growth rate of the regression line in percent per annum compounding
Accept the Form
To accept this form click OK and the chart so specified will be plotted.
2014
133
Chapter 5
Advanced Productivity Techniques
Overview
Insight Trader has been designed to allow you to process, organise and analyse very large
amounts of information in a very short time. Because of the sheer quantity of information that
needs to be assessed, you must have this process streamlined to enable you to utilise your time
most effectively.
Firstly, Insight Trader can store the whole of the ASX in a single directory and this means that
you are not forced to switch between many directories to find the various securities that you
need. Secondly, the format used to store the data on disk is very efficient in terms of disk
space required and also loads and saves extremely quickly.
Thirdly, the program has an internal database containing information on every company on the
ASX including its code, full name and the industry GICS subsector to which it belongs. This
allows you to group, organise and manipulate whole industry sectors with a few keystrokes.
Finally, Insight Trader uses speedkeys extensively. This allows you to bypass so much of the
form filling in that bedevils and slows down the operation of many Windows based programs.
In this environment we have developed several tools to maximise your productivity. These are
the slideshows, the generation of reference (or highlight lists) and the Today file. In addition,
the automatic box size facility for point and figure charts was developed to enable you to run
slideshows of point and figure charts without having to individually choose box sizes for each
security trading at different price levels.
Slideshows
With experience you will soon develop an ability to make a rapid assessment of a chart,
perhaps within a matter of a few seconds. Slideshows enable you to view charts rapidly, one
after the other, without you needing to press keys or to activate the computer in any way.
After setting the slideshow in motion you can sit back and watch one chart after another being
presented to you for your perusal. They are separated from one another by a user customisable
time delay. In this way it is possible to view and assess a chart of every company on the ASX
in a period of about one hour.
The Saved Chart Slideshow
We dealt with saved charts and their uses in previous chapters and saw how it is possible to
save up to a total of 100 000 arrangements of charts (each containing up to 506 individual
charts) in ten separate categories. After switching to the chart category of interest you can
click button 4 on the main toolbar, enter the delay required between frames, and watch each of
the 10 000 saved chart arrangements in this category be thrown up on to the screen for your
inspection.
134
At any time you can freeze the display by pressing the ESC key and then clicking Yes to abort
the slide show. After this you can even go in and manipulate the chart by zooming or editing it
by adding notes or trendlines etc and perhaps even resaving it. You can then continue the slide
show by pressing the F9 key. The various saved chart arrangements you are viewing might
very well be quite different from one another and consist of different numbers of charts and
types of charts on each screen.
This type of slideshow requires that each of the (up to 10 000) saved chart arrangements will
have had to have been constructed by you and saved to disk beforehand – a process that
involves significant effort, normally over an extended period of time.
However, a slideshow of saved charts is valuable because of the variety of chart formats that
can appear consecutively, you can have several different securities on a screen at the one time
and you can have constructions such as trendlines and indicators individually customised for
each chart. You would use this slideshow frequently to view the charts and securities of
special interest to you such as various views of your portfolio stocks or securities and indices
on a watch list.
You can click button 4 on the main toolbar, or press the speedkey F9, to commence the
slideshow immediately using the default time separation between charts and starting from the
first saved chart in the category. If you wish instead to customise the settings before you start
then click Runslides from the main menu and select the item Delay. Enter an appropriate
number of seconds between 1 and 20 as the separation required and click OK.
Should you wish to start at a saved arrangement other than the first arrangement in the
category you should enter its position number in the list into Start at in the Runslides
dropdown menu. Then click the final item in the Runslides menu - Commence - to start the
show.
To find the position number of any chart arrangement in its list retrieve the list of saved charts
by pressing Alt R. Then highlight the required saved chart title by clicking on it once. The
number (eg for 25) will be shown as Saved chart 25/520 on the dialog box.
Running the Saved Chart Slideshow Manually
If instead you wish to manually progress the slide show just press the + or – keys to move
forwards or backwards through the saved charts. The same effect can be obtained by putting
Scroll Lock on and then rolling the mousewheel to move through the saved chart
arrangements.
Although this is conveniently done on a desktop numeric keyboard if you are instead using a
laptop you need to press the Shift key as well as the + key. Accordingly the Space Bar has
been enabled to perform the same function as the + key when moving forward through saved
charts. Use the - key to go backwards as before.
Note that double clicking the mousewheel button toggles between two different states. The
default is that rolling the mousewheel will cause the data within a single chart to scroll.
Double clicking the mousewheel button will put the system into the other state where any
mousewheel rolling will cause the focus to move between the different charts on screen and it
is therefore equivalent to pressing the left and right arrow keys.
135
The Chart Arrangement Slideshow
Another manually operated form of slideshow is to place all charts, up to a maximum of 506
on a single screen as a chart arrangement. By maximising one of these charts with the
UpArrow key you can manually page through the rest in sequence by pressing the LeftArrow
or the RightArrow keys. You can also move through the charts (by first double clicking the
mousewheel button to toggle into a suitable mode) and then rolling the mousewheel.
A chart arrangement for this purpose can be created manually one window at a time or by
generating them automatically using the technique Generate a chart arrangement from a
reference list described later in this chapter.
The Chart Arrangement slideshow must necessarily be progressed manually and is limited to a
maximum of 506 component charts per arrangement - unlike the automatic option that is
available in the Saved Chart slideshow and the Autorun slideshow to be discussed next.
Nevertheless it is extremely convenient and extensively utilised.
The Autorun Slideshow
The saved chart slideshow is of course limited to whatever securities and chart formats you
have saved individually yourself – unless you have generated them via the automatic option.
They will normally be limited in number and though it would be possible to view every
security on the ASX in this way there is fortunately a much more convenient way of achieving
this. Generally the saved chart slideshow is also not suitable for viewing securities in a list that
may be changing radically and unexpectedly from day to day.
The autorun slideshow provides an answer to this restriction by running the slideshow using a
fixed chart arrangement format for each security in a list of security codes. It is usual to
retrieve a saved chart arrangement setup with the format you require and then to specify a
reference list of securities, each of which you wish to see presented in this format. A chart
arrangement in this format is then presented to you for each security in the list in turn. These
lists can be constructed quickly, easily and automatically and you can have as many of them
as you wish.
Creating the Reference List
The structure of a reference list is very simple and such a list is therefore easy to construct
manually or automatically as will be described later. Create an ASCII file with a text editor or
wordprocessor with your list of security codes (in any order) in the following form. The first
line should be set out as a date and a descriptive title enclosed in quotes and separated by a
comma:
“19-3-14”,”My Portfolio List”
ANZ
BHP
RIO
GEM
….
Etc
When your list is complete then save the file under a name like “PORTFLIO.LST” into the
WORKING\LST directory off the main directory that contains your ASX data. Mostly this
will be \WINIT . The name must have the extension LST but the rest of the name is up to you.
136
For foreign data format databases such as BodhiOne, Metastock or QuotesPlus databases this
will be the WINITSYS\WORKING\LST off the main stem directory.
If you are using Notepad, Wordpad or Microsoft Word under very early versions of Windows
to create the reference list then you must, when saving for the first time, specify that it is a
Text file. Furthermore you must enclose the filename in quotes to prevent it being saved with
an additional unwanted TXT extension eg PORTFLIO.LST.TXT because Insight Trader will
not recognise it as a valid .LST file.
Commencing the Autorun Slideshow
To run this as a slideshow you first need to create a chart arrangement in the format that you
wish to view all the securities on the list. It does not matter which security you choose to
construct this template with as the original security will be replaced in turn by each of the
codes on your reference list. Use only one security code per arrangement but it can be used in
combination with another security code so long as the other code is part of a relative strength
plot.
When the slideshow is run the code that is used in the denominator of any relative strength
plot will remain fixed and the substitution from your list will occur in the numerator code
only. Any point and figure charts in the template should be set up with an auto box size.
It is most common to retrieve a suitable saved chart arrangement that can be used as a
template for the autorun. If you have created an arrangement specially for this purpose you
may want to save it to disk as a saved chart arrangement so that you can retrieve it again to
reuse regularly in the future.
Load the chart template of your choice, choose View from the main menu and select the item
Autorun Highlights. A dialog box will appear asking you for the name of the Reference list
file which must be located in the WORKING\LST directory. Enter in the edit box the name of
the file you have just saved (without the extension) or browse to it using the button with the
three periods:
PORTFLIO
and click OK
Another dialog box will appear requesting you to input the delay or time separation between
consecutive screens. Enter a number between 1 and 20 and press OK. You will also need to
answer whether you wish the slideshow to commence at the first code in the reference list or
to resume a previously interrupted autorun. Then the slideshow will commence.
Halting the Slideshow
To temporarily halt the slideshow to give more time for careful perusal of charts of special
interest just press the ESC key. The chart can then be viewed at leisure, manipulated and even
saved to disk before the slideshow is recommenced by pressing Ctrl F9. Should you wish to
terminate the slideshow at any time just press ESC without later pressing Ctrl F9.
137
While the slideshow is underway, if you should wish to return to the previous security in the
list pressing PgUp will cause the slideshow to go back one frame. This can be repeated several
times to go back several frames.
It is possible to resume an interrupted autorun even after you have switched your computer off
by selecting Resume run rather than First code when you are restarting the autorun using the
same reference list.
Running the Slideshow Manually
If you wish to progress through the slideshow manually set the time delay between frames at
zero. Pressing PgUp/PgDn or rolling the mousewheel will then allow you to step manually
forwards or backwards through the list of securities leaving you unlimited time to view each
chart. Alternatively you may press the spacebar to advance to the next chart.
You can perform operations on the charts, including editing and saving, during a manual
autorun.
Creating Reference or Highlight Lists
The reference lists required for an autorun are critical to the process and can be generated
manually or can be generated by the program in several different ways. The generation and
management of these reference lists (sometimes referred to as highlight lists) is the subject of
this section. They can also be used for generating chart arrangements as well as system scans.
Manually Generated Reference Lists
The creation of manually generated reference lists has been described in the section above.
The Highlighter List
Whenever the Datacapture utility is run to distribute daily information from an ASCII file,
downloaded via the internet from a data service or input manually using the BULK utility, it is
possible to set a filter, known as the Highlighter, which will automatically flag exceptionally
performing securities and place them on a reference scratch list called HILITE.LST. There are
up to three criteria used for the selection process based on momentum, volume and price. The
setting of these criteria is discussed in Chapter 8.
In addition to the highlighted securities any securities that have hit their alarm levels are also
placed on this list.
After you have downloaded the day’s data you will be able to immediately access this
highlight list and autorun it against a template in exactly the same way as for a manually
generated list explained above. So you can at once view charts of all the high performers of
the day with a few simple keystrokes.
138
If you wish to save this list before it is overwritten then choose File/Archive Hilite list and
give it a unique file name. Names like HL141225 constructed from a back to front date are
very convenient as they are listed alphanumerically in date order when you are browsing the
directory.
Generate Reference List from on screen Chart Arrangement
It is possible to create a reference list of the securities from the arrangement of the charts on
screen. This will be useful if each chart displays a different security but if any securities are
identical they will also be duplicated in the list. This function is accessed from
File/Generate Ref List from chart arrgmnt.
Generate Reference List from a Portfolio
You can create a reference file of your portfolio stocks that can be used like any other
reference list. From the main Portfolio menu choose File/Create reference file and a list file
will be generated containing the codes for all the securities in your portfolio (See Chapter 10)
Generate list of all securities with alarms set
Whenever the Check Data Integrity option is run from the Utilities menu a file
ALARMSET.LST will be produced that contains all the stocks that have alarms set and lists
these together with their current activating price if alarms have been hit. This file is accessed
like any LST file by clicking the lightbulb button on the main toolbar and loading this file
which is is available as a standard LST file like HILITE from the dropdown list box from the
Enter Highlight File Name dialog box. (See Chapter 7)
Generate list of all securities with alarms hit
Whenever the Systems tester is run a file SYSALARMS.LST will be produced that contains
all the stocks from the Reference List used that have had their alarms hit on the target date.
(See Chapter 9)
Generate Reference List from ASX GICS Subsectors
The internal ASX database works intimately with the program by allowing you to create lists
of all the security codes in any given standard ASX GICS subsectors such as the Gold
subindustry, or the whole Materials Economic Sector, Consumer Finance or the whole
Financials sector. Or all the Energy or all the Health Care. Or any combination of these. Or
every company on the board for that matter.
From the File menu press Generate Ref list from Sectors and you will get a list displayed of
all the standard ASX GICS sectors and their code numbers. Select a sector, range of sectors,
or a number of individual sectors and click Accept Selection. If you want the lot just press the
Select all button.
To select several items hold the Ctrl key down and click on each of those you wish to select.
For consecutive items click on the first item and then while holding the shift key down click
on the last item in the range or press the arrow key down until the range is selected.
139
Fig 5.1
The default file to write to is the scratch file SELECTED. If you choose this default then it
will overwrite the previous SELECTED list. If you choose another name like "GOLDS" then
it will generate a file GOLDS.LST in the current IT directory that you are logged into and will
not be overwritten unless you do so intentionally at a later date. This file can then be used
repeatedly in the future.
When you have done this you will have generated a reference list file which you can then
Autorun in the same way as described above. So you can set it up to run a slideshow of, say,
all the Gold companies, all the Banks or even every stock on the board.
(This reference list file can also be used to select an ASX GICS sector or sectors to filter with
the Systems Tester. You then specify your reference file for filtering to be this file you have
just generated.)
To create a list of indices for all of the industry subsectors click on the column header Industry
Sector and the list will be sorted according to this column. All indices will be at the bottom or
the top of the list making it easy to select them as a range and to create a reference file say
SUBSECTOR INDICES.
As time goes on, the internal database supplied with every copy of Insight Trader will get out
of date as names change, companies change their subsectors, new listings appear and
companies are delisted or relisted. However, you can keep this information up to date if you
subscribe to the Insight Trader Database Manager Service described in Chapter 8. Industry
subsector reference lists created as described above should be regenerated at regular intervals
to keep them current.
140
Systems Filter Highlight List
When the Systems Tester described in Chapter 9 is run in Filter mode you must specify a
reference list of the securities to include in the search (which of course can in fact be the
whole of the market) and it will produce a highlight list (in the scratch file called HILITE) of
all those securities that have satisfied the conditions that you have specified. The filter list
produced in this way can be autorun as the reference list in the same way as any of the other
reference lists mentioned above.
You can even specify the scratch file HILITE as a reference file for filtering. If you do this
you can run a number of systems consecutively on HILITE and it will gradually reduce the
number of securities in the file to a list of all those that satisfy the criteria of all the systems
tested.
Tag List
During an autorun, as the various charts are flashing by, you will from time to time see one
that you wish to keep a note of. However, because the speed at which the process is
proceeding there is not time to write and watch simultaneously. To solve this problem we
created the Tag file which is just another secondary highlight list that you create yourself as
you are viewing a primary autorun slideshow.
During the autorun, by pressing either the Insert key or DownArrow key, you can add the
codes of any currently displayed securities to the Tag file reference list without interrupting
the rolling display. This temporary file is given the name TAG and can be used just like any
other reference file including autorunning it in its own right:
For example you may wish to do an autorun of all the gold stocks from a reference list
generated from the File menu under the option Generate Ref List from Sectors as explained
above. During the autorun you may see several securities that you would like to investigate
further. If you press INS or DownArrow while any of these securities are still displayed then
that security name will be added to the TAG list.
After the first autorun is finished you can then autorun the TAG file which contains only those
securities that you are particularly interested in. In effect you have created your own shortlist.
The TAG file will keep adding security names to its list until you specifically reinitialise it to
start again. To do this choose Init/Save Tag file from View on the main menu which gives
you the option to save the current file TAG under a different name before you start the TAG
file off again from scratch.
If you do not wish to save the existing TAG file just leave the name blank when requested for
the name to save under. You do not need to specify the drive or directory if you do not wish to
as it will choose the currently logged IT data drive and directory as the default. If you do not
give an extension to the filename it is assumed to be "LST".
To create a short shortlist from your current TAG file save it under another name and then
autorun this renamed file tagging any securities that you consider are really exceptional. This
process can be continued indefinitely.
141
The Watch List
Another file called WATCH.LST is available for adding security codes to whenever you see
a chart that you would like to keep tabs on. Simply hold the Ctrl key down and click the left
mouse button on the chart proper. This will automatically add that code in the window on to
the WATCH list if it is not already there. To remove a code from the WATCH list if it is there
click the left mouse button with the Shift key held down. To remove all previous securities
from the WATCH list and add a new code to a newly initialised WATCH list hold both Ctrl
and Shft keys down while left clicking on the chart of the security to add.
Accessing Reference List files
Whenever you need to access a reference list file for autorunning, system filtering, charting
etc you will be presented with a dialog box requesting the name of the file. A drop down list
box will offer you the choice of the eight standard scratch files – HILITE, TAG, WATCH,
ALARMSET, SELECTED, ASX100DB, ASX200DB, ASX500DB, ASXSmallOrdsdb,
ASXSubIndicesdb, ASXSectorIndicesdb. Alternatively you can Browse for the file, type it
in, or hit the Generate button if you wish to generate a list from the ASX GICS industry
sectors.
The last three files are only available for Database Manager subscribers where they are
automatically updated each week.
Viewing Reference Lists
You can view a reference list from File/Highlight list, or by pressing the speedkey Alt J or by
clicking the light bulb on the main toolbar. Enter the highlight or reference list file name in
the box provided and a dialog box will appear listing each security code, name, main activity,
and if it has been generated from system filtering - criteria met, 10 day momentum, percentage
by which the volume is above the 10 day moving average of the volume, percentage by which
the price is above the 10 day moving average of the price.
Double clicking any security on the list will chart it. Selecting any security, range of securities
or several individual securities and pressing the Chart button will create a chart of each one
selected.
Immediately pressing the ENTER key or clicking the Chart all button will throw up a chart of
every security on the list on the screen at the same time.
You can resort the list on any column by clicking the column header before printing it or
pressing the Resave list button to resave it to disk.
Attempting to resave a Filter report displaying in a Highlighter dialog will immediately take
you to the Filter report dialog to allow you to sort and resave from there to maintain the
integrity of the filter list.
A button "Get data" has been added on the List Highlights dialog to allow you to retrieve
fundamental and other data for the list of securities currently displayed.
The Close dialog on acceptance check box should be unticked if you do not wish it to close
after charting any selection. Otherwise it will be closed.
142
Generate a Chart Arrangement from a Reference List
You can very simply and quickly create a tiled arrangement of charts from any reference list.
From the main menu choose View/Generate chart arrangement (or press Ctrl+Shft+A) and
enter the name of the reference list to chart. If you don’t have a sample chart on screen the
program will create one for you in the form that all charts will be presented. (If this is not in a
suitable format press Cancel and customise the chart before choosing View/Generate chart
arrangement again.)
Click OK and charts of all the codes on the reference list will be tiled on the screen up to a
maximum of 506. You can abort the process at any time by pressing the ESC key.
If there is a regression line on the template chart being used the charts resulting from the
generation you will be asked if you wish to automatically arrange these in order of decreasing
slope of the regression line. This aids in sector analysis allowing the charts of the strongest
sectors (or the strongest stocks) to be automatically placed in the upper left hand corner of the
main program window decreasing in turn to the weakest in the lower right.
Viewing a Large Number of Tiled Charts on Screen
If you have a very large number of charts on screen simultaneously they become too small to
view usefully in their tiled arrangement. Under these circumstances you can maximise one by
pressing the Up Arrow key and consecutively maximise each of the others in sequence by
pressing the Left and Right Arrow key. This can be considered as another form of manually
operated slide show that is extremely convenient and quick and easy to operate. If you first
toggle into a suitable state by double clicking the mousewheel you can then move through
these charts in an identical way by rolling the mousewheel.
When paging through the windows of a chart arrangement in this manner, as the final chart is
accessed there will be a beep indicating that you have reached the end ot the list. Otherwise is
is possible to continue cycling through all the charts again without realising. This beep can be
suppressed from the Format submenu by unchecking the item Alarm status.
Generate Saved Charts from Autoruns
This facility bridges the gap between the Autorun and Saved Chart Arrangement slideshows
by allowing you to generate saved charts automatically during any autorun.
To do this, display a chart arrangement of the desired format by plotting it directly or selecting
a suitable replay chart as described above. Then choose Generate replays from the View
Menu. A dialog box will appear to enable you to compose the title of the saved charts. You
are given the opportunity to place a text string before the code - Pre text, a text string after the
code - Post text, and the Title or company name.
For example you might choose "Gold" as the pre text, "Daily candlestick" as the post text and
you might choose to include the company name. All replay charts subsequently generated
during the next Autorun will be given titles like:
Gold NCM Newcrest Mining Daily candlesticks
Gold NST Northern Star Resources LTD Daily candlesticks
143
Then select Autorun from the View menu and you will be warned before the autorun starts
that all charts displayed in the next autorun will be automatically saved as replay charts in the
current saved chart category. Use this facility sparingly as it is easy to quickly generate many
saved chart arrangements so as to fill an entire category with the maximum 10 000 saved
charts per category that are available.
Creating and Retrieving a Favourite Template
There is a special saved chart arrangement in each category, which is the very first one on the
list, and you can pull this arrangement up at any time by using the speedkey Alt Q. This is
particularly useful if you frequently wish to see your charts in a particular format arrangement.
Simply create a saved chart arrangement in your favourite layout with time ranges, chart
types, and indicators that you require and save it into the current category. To ensure that it
goes into first position and stays there just save it with a title commencing with a few spaces.
Whenever you wish to retrieve the template just press Alt Q and your layout will immediately
appear on screen. Ctrl N will then allow you to substitute any other security code in all
windows of your template.
Today File
Normally you can only view data in your charts at the end of the day after the market has
closed and you have downloaded from your data service or input the figures from the day’s
trading into your files manually.
However, Insight Trader has the facility to show intraday data such that you can watch today’s
bar or candlestick etc forming before your eyes. The colour of today’s bar is distinguished
from the rest of the chart by a different colour. This colour is chosen to be that of the cursor.
The file, known as the Today file is given the name IDddmmyy.TDY and has the form as
follows:
“19-3-14”, “Intraday data”
ANZ, 603, 620, 601, 615, 150, “Up 10c to 615”
BHP, 1865, 1880, 1860, 1875, 3270, “Up 45c to 1875”
….
Etc
The first line is any two quoted strings separated by commas
The other lines in the file have the format:
code, open, high, low, close, volume, “comment”
If a file of this structure is put into the main IT directory containing your ASX data AND that
file is named by today’s date eg ID190305.TDY if today is 190305 then if you call up a file
such as BHP, any data for that security that exists in the Today file will be appended to the
chart that is drawn. Moreover the title of the chart will have appended to its beginning the
comment, at the end of each line in the Today file, which can if you wish be empty. You
would therefore see as the title of the chart:
Up 45c to 1875:- BHP Billiton LTD
144
You can use the today file not only to supply the intraday data to the chart but it can also
simultaneously be used as a reference file for an autorun.
Constructing the Today File
Just as for any list file, the Today file can be constructed manually from information that you
receive during the day using a text editor or wordprocessor and saving the file as an ASCII or
text file. Alternatively you may be getting intraday data via the internet or perhaps snapshots
from your broker or a data service at various times during the day. Should you wish to have
these downloads automatically processed into the correct Today file format then we may be
able to provide a service to assist you by writing a conversion utility. Alternatively you could
arrange for your data provider to output the information in the correct format for you.
The CommSec Today File
You can download a Watchlist file from the CommSec Ltd website that contains intraday
information for the stocks in several of your watchlists giving Open, High Low, Last and
volume – as well as Bid and Ask - up to the time that the file was constructed. Each watchlist
file can contain only a limed number of codes (~30). However, you can create several of these
watchlists and combine them in a “group” that can be downloaded as a single file.
This file can be converted into a valid Insight Trader Today file by selecting from the main
menu Utilties/Convert Commsec Today file or clicking button 26 on the main toolbar. This
process will automatically combine the information in all these files to create an intraday
snapshot.
Accessing a chart of any security within that list will now have appended to its history this
very latest information. The process can be carried out as many times during the day as you
like to allow you to update your charts to monitor their progress intraday.
From the Commsec website you can also download the “End of day” file in Insight Trader
format that allows you to update data for the whole exchange that will be valid up until the
time that you downloaded. Please contact us if you wish to receive detailed instructions for
streamlining this process.
The ASX Today File
Provision for downloading a snapshot file, similar to that provided for the TODAY file from
Commsec, has been enabled for those users who are not Commsec clients. For this we use
facilities on the ASX website.
You will need to construct a number of watch lists on the ASX site and having done this then
you can download these lists at any time during the day into your WINIT directory and click
the menu item Utilities/Convert ASX Today file. This will provide charts with the final bar,
candle etc for today as it has formed so far for all those securities on your watch lists. Using
this method you can keep track of your charts during the day.
145
At the time of writing the prices supplied in these ASX watchlists are 20 minutes delayed.
Kill all Today Files
An option 'Kill all Today Files' is available under the Utilities menu to remove the intraday
files created from downloading the relevant files from the Commsec or ASX sites during
trading
.
147
Chapter 6
Configuration
Overview
Different users like to customise certain program settings according to their aesthetic preferences and
to facilitate their specific patterns of work behaviour. Insight Trader makes it possible to customise the
colours of the background, lines and fonts and to change printer line thickness. You can also change
font types and sizes for both the screen font and the printer font as well as the various ways in which
certain options such as grids and scaling will be presented.
Graphics Colours
Perhaps the most personal aspect that you will want to configure is the colour scheme for your charts.
Choose Format from the main menu and select the Graphics colours item. A window will appear
showing a reduced representation of a chart with the objects on it that require to be assigned colours.
There are 20 buttons representing each of the various objects and a number from 0-15, the current
colour number for that object, appears on each of these buttons. By pressing any button for a particular
object the colour and number for that object will change by one. There are two more buttons under the
top 20 - one controlling the Direction in which the colour number will change and the other providing
one of 9 preset Standard configurations.
If the direction of the arrow is to the right the colour number of any button will increase if pressed, if to
the left it will decrease. The direction of the arrow can be toggled left and right by pressing the
direction button.
Note that any one of the 9 standard colour schemes can be used as it stands or as a starting point to
modify to suit your own taste. Once you accept a new colour scheme, either a standard one or one that
you have customised, it will overwrite colour scheme number 0 which is the current scheme in use. If
you customise one and save it but change it to another at a later date the first one will be lost. However,
the standard colour schemes will always be available.
148
Fig 6.1
Adjust the colours to suit your taste, click OK and press OK to save the configuration. Note that any
charts on screen will be cleared whenever you save a new configuration to disk.
If you wish to permanently alter any of the standard configurations, then after you have customised it
to a format that you might want to use frequently just press the button Reset Std. You will then be able
to quickly change your colour settings to any of your own 9 customised standard configurations.
Screen Font
Choose Format/Screen font from the main menu
The fonts that you choose can be of several types - fixed or proportional, scalable or nonscaleable. A
fixed font such as Courier New has a constant spacing between the characters. A proportional font
such as Arial on the other hand varies the separation such that each character occupies more or less
space depending on whether they are fat like a W or thin like an I.
However, both of these fonts get compressed or extended when the chart window is reduced or
increased in size and as such they are both referred to as scalable. Nonscaleable fonts are like Fixedsys
or System (fixed and proportional fonts respectively) do not compress when the chart is reduced
We recommend Arial of size 12 as a good screen font that is both proportional and scalable. When you
have selected both the size and type of your font click OK to accept and the font will be used for the
current session. If you want to save the new font as your permanent default choose Format/Save
configuration and click Yes.
149
Printer Font
Choose Format/Printer font from the main menu
The choice for the printer font is similar to that for the screen font but can only be determined by trial
and error ie by printing charts to your printer using the various sizes and types of font which are
available.
We recommend Arial of size 24 as a good printer font. You accept and select the printer font and save
the configuration as for the screen font above. You can if you wish use an entirely different font for
your printer to that which you use on screen.
Configure Preferences
Choosing this item from the Format menu or pressing Alt O brings up the following dialog box. You
may need to enter the various options here.
Fig 6.2
150
Browse Buttons
You will notice that there are small buttons to the right of several of the input boxes that have ellipses
(…) on them. These buttons allow you to browse for a date, a folder or a file instead of typing in the
information by hand.
Data file name for auto load on start up
When Insight Trader first starts it loads into memory what is known as the default security file which is
specified in the first edit box.
Enter into the box the filename of the security that you would like to see whenever you first enter your
program. It may for many people be the file for the All Ordinaries Index.
Default Starting Date for Charts
This item allows you to set the date you would want all your charts to commence from if you do not
specify a date when you create your charts. If you leave it blank it will default to the first date in each
file. However, you may wish to set it at the beginning of a particular year say 010114 if you are mainly
interested in more recent activity.
Percentage of Screen for Subgraph
The default initial subchart size can be set by entering an appropriate number in this box between 10
and 50. This can be varied during any session as described in Chapter 3 under Stacked Indicators.
Path for Configuration and Data Files
This path will be the stem directory off which reside the alphabetic (or DATA) subdirectories
containing the data files that you wish to analyse. It will normally be \WINIT\ but ensure that you do
not append a subdirectory DATA to this specification. You can have any number of Insight Trader
directories containing data of various sorts but most people will have just one.
The easiest way to create a new IT directory is to change this path to whatever name you would like for
this directory and click OK. It will recognise the directory as not yet valid and ask you whether you
wish to create it. If you do the directory will be created and the necessary files required by the program
will be placed into it to enable it to operate as a normal IT directory. Note that when you log on to an
existing older IT directory, WinIT may not recognise it as valid yet because there might be extra files it
will need to insert to make it operational. Anyway click Yes to establish as a new directory.
Changing to an Established IT Directory
If you have already established one or more directories in this way they are then logged as your
working directories in a list which can be accessed by clicking toolbar button 11 or with the speedkey
Alt D. To rapidly change from your current directory to one listed in the box that appears just double
click it and the change will be immediate. However, all existing displayed charts in your working area
will be removed.
151
If you wish to remove an established directory from the list just highlight it and press the Delete button.
Note that it will only be removed from the list. The directory itself will remain intact on your hard
drive.
Managing all User generated files in the WORKING Folder
The directory structure allows simple access, transfer and backing up of most of the current operating
files that are configured or changed by the system or user. All portfolio .PFL and .PFO files are
contained in a subfolder PFL, all files relating to saved charts are stored in the CHARTS subfolder, all
files relating to systems are in a subfolder SYSTEMS, all .EMF files are in a subfolder EMF, all
general configuration files are in the CFG subfolder, all reference and hilite .LST files are in the LST
subfolder, all documents are in the DOCUMENTS subfolder, all CSV files for User Supplied Extended
Fundamental information are in the CSVfiles subfolder, all exported files are in the EXPORT
subfolder.
For a native Insight Trader database these subfolders are all contained in the WORKING folder that is
itself a subfolder of the WINIT folder. For other formats - Metastock, BodhiOne, and QP databases the
WORKING folder is a subfolder of the WINITSYS folder that is in turn a subfolder of the relevant
stem directory of the respective database.
If the Insight Trader database is in a folder other than the folder containing the program executable
files, any SYSTEMS files will be found in the WORKING\SYSTEMS folder off the WINIT folder or
in the folder containing the program executable files if this has been given a name different from the
default name WINIT. All other subfolders will be in the WORKING folder off the folder containing
the main database.
The WORKING folder contains most of the files that the user changes with the exception of notes and
alarms in the F2 notepad. These others are contained within the security data files themselves for a
native Insight Trader database or, for foreign databases, they will be found in the Notes folder off the
WINITSYS folder.
By transferring the WORKING folder from one Insight Trader accessible database to another you
should be able to transfer your saved charts, systems, reference files, portfolios and configurations. For
foreign databases the Notes folder should also be transferred. This procedure should only be
undertaken by users who are familiar with copying of directories from one part of their hard disk to
another.
White Space before Chart Axis
Some people like space to be available between the last day plotted and the right hand axis. You can set
here the default number of days of white space you need to extend trendlines into the future for
example. This will apply to all charts plotted. However, you can also customise white space for
individual charts when you set the X-axis date range using speed key X or in the Second Form that
appears on choosing View/Chart specs from the main menu. Choosing @+10 in the second date limit
will set the later limit 10 days from today.
Paths for Alarm Sounds
Here you can specify two “wave” files that will be used as the siren alarm to be sounded whenever
files, for securities that have hit their up or down stops, are loaded. Alarms are triggered when the low
for the day hits or falls below the Alarm below stop set in the F2 Notepad. Similarly if the high for the
152
day hits or exceeds the Alarm above stop then the siren will also sound. If the Alarm on close option
has been checked on the F2 notepad (Fig. 2.20) then the alarms will activate on the closing price rather
than the high or low prices.
The sounding of the siren can be enabled/disabled from the menu under Format/Alarm status
although a prominent visual indication will still appear on the charts.
Many suitable wave files with the extension “.WAV” can be found in the \WINDOWS\MEDIA
directory. By double clicking on such files under Windows Explorer their respective sounds will be
generated to allow you to experiment with and select one for the purpose.
Command Line for Data Vendor
If you have proprietary software from a data vendor for downloading data into the current directory
you can then put the command line here to enable you to access that software directly from within the
Insight Trader program under the Utilities/Data service download menu option. This facility is
entirely optional.
This option can be used to run other programs apart from that of your data vendor by inserting the
appropriate command line here.
Price and Volume Factors
For each database that you are using you must specify on the place provided on this form whether your
database is in dollars or cents and whether the volumes are kept in singles, 100’s, 1000’s or whatever.
If the databases have not been specified then any native Insight Trader database will be assumed to
have prices in cents and volumes in 100’s while Metastock, BodhiOne and Quotes Plus will be
assumed to be in dollars and volume in singles.
NB. You must check this separately for each database that you access.
Printed Charts
These options allow you to specify whether you wish your printer to produce charts in colour or black
and white. Selecting the colour option for a black and white printer may print your charts in shades of
grey which, depending on the colours you have chosen, could cause certain lines to disappear
altogether.
You can select a line density between 0 and 4 for your printed charts and if you want your moving
averages to be plotted as dotted and dashed lines rather than solid lines check the appropriate box here.
153
Display Info on Chart
The section 'Display info on chart' at the bottom left of the dialog allows you to customise the various
pieces of information that you wish to show on screen. It enables you to reduce clutter by omitting
those items you do not need. These optional items include:
1) Splits/issues lines
2) Alarm levels
3) Indicator values on the subchart
4) Scale 0.00
5) %/price change
6) Ex dividend
7) % off High/Low
These options allow the display of:
1) The vertical dotted Splits and Issues lines
2) The Alarm banners and Alarm Above, Below and Soft stop horizontal dotted lines
3) The numerical values of the subchart indicators
4) A forced display of 2 dec places for databases in dollars. It also forces display of full numbers, for
all databases, rather than the scientific 'E format' (eg E+8) that reduces very large or very small
numbers to manageable size.
5) The percentage price change in the caption bar of the chart window
6) The Ex-Dividend in the caption bar of the chart window
7) (H-58%) (L+10%) (H-S=35%) (C-S=22%) that provide a percentage distance that the current price
is below a recent High and above a recent Low, and the distance that your hard stop is away from the
recent high and the last price traded. The period for the recent high and low is set as a number of
calendar days prior to the date of the last period in the file. By default all options are on and the period
for determination of the last highs and lows is 720 calendar days.
Other Options
Check the boxes against the other options as appropriate for logarithmic scaling, grids on X and Y
axes, volume logarithmic and maximise new charts. Choosing Maximise new charts will
automatically maximise the windows of any new charts added to your working area. However
remember that as you are adding charts there may be other charts that you have created previously
hidden underneath the currently maximised one. To reveal these press the Down Arrow to restore the
currently maximised chart to its original unmaximised position.
Allow multiple instances enables you to have more than one copy of Insight Trader operational
simultaneously but it will warn you before it launches the second instance. If it is not ticked then any
attempt to launch another instance of the program will fail but will cause the window of the one
currently running to maximise.
Use old pfolio manager should be ticked only if you wish to use the old portfolio manager, supplied
with previous versions of Insight Trader in place of the new one. It is possible to easily switch between
them at will with this check box.
Partial bar to period end allows an uncompleted bar to display at what would be the end of its period
rather than on the date the last day’s contribution to it.- ie a partly formed monthly bar at the 2/7/04 can
154
optionally be positioned on 30/7/04 rather than on the 2/7/04. This option is available only in
compressed mode for weekly or monthly.
Scroll Anchor. You can scroll charts in a day-by-day mode where pressing the keys F7, F8 or “<”,">"
or using the mouse wheel to practice your trading technique. In default mode it will always retain a
fixed number of days on screen where as one day is added to the front of the chart the oldest day drops
off the end. You can, however, choose to anchor the first day on the chart to always remain the first day
on the chart by placing a ticking this option. In this second method the number of days displayed on
screen will increase by one each time the F8 or ">" key is pressed.
Encrypt docs with WinZip. For security of sensitive portfolio document files such as scanned bank
statements you can easily encrypt these as they are being dropped on to the Account Transaction
dialog. It is necessary that WinZip be installed in the 'Program Files' folder along with its
"commandline addon".
When the dialog box is correct select OK to accept and Yes when asked to save the configuration.
Some of these options can be overridden elsewhere in the program. There are other options such as the
Alarm status from the Format menu and also weeklength and indicator time constants that are not on
this form. There is therefore also the provision to Save configuration from the Format menu without
going into the Preferences dialog box.
155
Chapter 7
Management of Data
Overview
Before we can draw any chart we need to supply the computer with the necessary data, ie. the
historical information on price and volume changes over time. The program organises this
information into data files, which need to be created and then kept updated on a regular basis
to record subsequent trading activity.
File creation and regular updating can be done either automatically via the internet from a
data service, or manually where the information is punched in from the keyboard.
We will be examining the following aspects of files:
Single and double precision data storage
Structure of an IT data file
File Manipulation
Creating
Viewing/Editing
Saving
Loading
Browsing
Erasing
Modifying Files
Checking
Filling
Adjusting
Merging
Exporting
Importing
Single and Double Precision
Only a few years ago the costs of memory storage and disk storage for data were major
considerations so attempts were made to reduce these as far as possible. One way to reduce
costs was to store numbers in single precision which meant that you were limited to numbers
with say five significant digits eg 4837.3. This meant that you could not accurately represent
numbers such as 1234837.3.
156
As prices of memory chips and hard disks have fallen to a fraction of their original levels,
reducing these costs is no longer a major issue. Therefore we have given you the option of
keeping your data files in either double precision or single precision.
The advantages of double precision are that you can display your data in eight significant
digits of precision with up to four decimal places allowing values such as 115,794.32
11,579.418 or 1125.5794 to be displayed. More importantly it will also greatly reduce the
problem of occasional large spikes in volume, or error spikes in price, which can
permanently reset the precision of the whole file. Moreover, double precision is the native
mode of 32 bit processors and as such is actually faster than single precision.
The disadvantages of double precision are that it requires twice the disk space to store the file
compared with single precision. Once you have converted a file to double precision you
cannot then change it back to single precision unless you replace it from a backup etc.
However, it would be unlikely that you would want to convert back.
You can choose to either convert your whole database for double precision or only selected
files. After you have converted any file, all subsequent data in that file will be able to accept
the increased precision. However, it will not allow previously recorded data to be displayed
in double precision unless that file is reprocessed from the beginning.
If you were to convert your whole ASX database you will need to have available
approximately 25 Mb extra of disk space. The exact value will depend on the size of your
hard drive partition and whether you are running FAT16, FAT32 or NTFS.
To do a total conversion to double precision set the option in the Datacapture utility
configuration "All files in double precision" as described in Chapter 8. Whenever a file is
updated by Datacapture during a download it will be resaved in the new format. Before you
do such a total conversion it would be advisable to backup your whole database in the
unlikely event you wished to convert back to single precision. Any files not updated during
this Datacapture process will remain in single precision.
To convert an individual file, rather than the whole database, to double precision simply load
the RAW (non-%) data file (rather than the adjusted % data file) using Toolbar button 10 and
save the file using Toolbar button 9, checking the box "Save in double precision" before
pressing OK. Next time you download, the % file will also be updated. If you want the % file
to be updated immediately, simply select from the menu Edit/Adjust issues and save the file
as ABC% or whatever the code is.
All tick data files are stored in double precision.
If you convert any files to double precision you must use only the new utilities that can
handle the new file format ie Datacapture v9 and Database Manager v9 or later. Previous
versions of Insight Trader ie WinIT32 v 8.3, DOSIT v 8.1 and earlier do not support double
precision.
157
Structure of an IT data file
This section is included as a technical reference only for those users who have an interest in
constructing their own Insight Trader files. It can be skipped by most other users.
The Insight Trader file structure is extremely flexible. Like any database file it is composed
of “records” where each record is the set of data for any one day. Each record is divided into
“fields” which are slots into which the individual values for the various types of data are
inserted. For example a file for ANZ might contain the following record for 14/2/97:
250214 623
656
620
661
573
Field 1 is the date 25/02/14, field 2 is the open, field 3 is the high, field 4 is the low, field 5 is
the close and field 6 is the volume. The record for the 15th will be similar except that the
values in the six fields will be different.
All records in any given data file must have the same number of fields. The maximum
number of fields in any record is 20 and the minimum is 2. The total number of records in
any file is in practice unlimited. There is also no limit to the number of data files that can
exist in a particular directory (except for any imposed by the operating system itself). Also
you are not required to have a record for every day so that if a security does not trade every
day you do not need to insert dummy records for the notrades days.
There are 9 different types of data fields that you can use:
D
-
date
O
-
open
H
-
high
L
-
low
C
-
close
V
-
volume
I
-
open interest
A
-
accumulator
X
-
unrestricted field
The first 7 field types are self explanatory. The X data type is not specific and can represent
anything that does not require to be treated in any special way. The A data type is an
accumulator used for advance/decline type indices where daily entries (usually both + and -)
are accumulated internally to give a running total rather than storing them directly as the
numbers are input.
There are several restrictions that must be observed for these 9 data types:
Field 1 must be the only D field
HLC must always appear together as a block
158
O must always be followed by HLC
I must only follow V
V must follow a price field to which its volume relates (either HLC or X)
Because field one is always D it is normally omitted from the specification. The most
common file structures that you will meet are:
HLCV
-
used if open is not available
OHLCV
-
used for most shares
OHLCVI
-
used for commodities and futures
X
-
used for single values
XV
-
used for price and volume only
Because these are the most commonly used file structures there are template files in the data
directory for each of these types that can be loaded and used to create new files with the
required structure.
Although the above structures are the most common there are many other combinations that
you can use. For example the WORLD and SYDNEY files that come with your program
have the following structures respectively:
HLCVAAAXXXXXXXXXXXX
XXXXXXXXXXXAA
Other structures could be:
HLCVHLCVHLCVHLCVAAA
XXXXXXXXXXXXXXXXXXX
or whatever your requirements might be, consistent with the restrictions mentioned above.
Although it is possible to accommodate more than one security in a single file it is
recommended that, in general, structures such as the second last listed above only be used for
specialised purposes.
File Manipulation
Creating Files
Most of the time you will not need to create a file as the program does it for you
automatically, if a file by that name does not currently exist. If you are downloading via the
internet from a data service, or you are manually updating files using the BULK utility, any
159
new files will be initialised automatically for you. Most people, in fact, never create any file
themselves and this section can be skipped by most users.
When downloading data via internet, or manually entering data using
BULK, files are automatically initialised by the utility Datacapture. You
do not have to manually create individual files for each security.
However, there are occasions when you might want to create a file to your own specifications
and it can be done in the following manner. Before attempting to create a file you should
familiarise yourself with the structure of an IT file as described in the section above. For
most of the common file structures there exist in your data directory template files that can be
simply loaded up, modified to your needs and saved under the name you require.
An easier alternative to setting up files from scratch each time is to
load one of the preexisting template files - HLCV, OHLCV, or OHLCVI,
alter any data on the dialog under the menu Edit / Define data file to
suit, and save as a copy with a new name. (This leaves the original
HLCV file intact)
To create a new file from scratch you must choose File from the main menu and select
Create new data file, give the file a name and define its structure including the type of
information which you wish to include in it. The first dialog appears asking you to give a
filename of up to 8 characters without an extension.
160
Fig 7.1
You are then presented with a form consisting of a line along the top for inputting a title
which will be printed at the top of every chart along with the security name. Eg you may
wish to type in Broken Hill Proprietary in the BHP file and each chart constructed from this
file will have BHP - "BHP Billiton Ltd" printed in the title.
If the file is currently set to double precision then the appropriate check box will be ticked.
Note that it is not possible to change the precision of the file from this dialog. To change an
individual file to double precision you must save the file and tick the check box on the save
file dialog as described later in this chapter. To save your whole database in double precision
you must do this through Datacapture as described in Chapter 8.
Then there are three columns which must be completed with the details of the data that you
wish to include in the file. The first of the columns is for the field name, the second for a
code indicating the type of data it represents and the third the maximum value you expect it
to reach. The different data types, together with their respective codes, are as follows:
161
Data Type
Code
For:
Put:
1.
The date
2.
Opening price (of an OHLC set) O (on the close)
3.
High
4.
Low
5.
Close (of a HLC set)
C (on the close)
6.
Volume
V (on the close)
7.
Open interest (of an HLCVI set) I (on the close)
8.
Accumulators
9.
Unrestricted field
A (on the accumulator)
Shares (Subject to issues/splits)
S (on the close)
Default field (for plotting)
D
(Several codes can be placed together in the one entry)
The date is always the first field.
High-Low-Close Sets must be three fields following in that order and the close must be
specified by placing a C in its code column.
If a volume field follows the close to which it refers, a V must be placed in the code column
for the CLOSE. A volume field can also follow an unrestricted field.
If an opening price is specified, it must precede the high of the HLC set and an O must be
placed in the code column for the CLOSE.
If open interest is specified, it must follow a volume and an I must be placed in the code
column for the close or the unrestricted price field to which the volume refers.
Accumulators are data types for which you enter a difference, or change, for each day (week,
month). These are then internally added to the accumulated total, up to the current date, but
are displayed and entered as differences in the database portion of the program. The most
common accumulator is the advance/decline where the number of shares that have declined
in value over a period is subtracted from the number that have advanced in value. An
accumulating field must have an A placed in its code column.
162
Because share prices can be diluted by occasional splits, issues and reconstructions, provision
must be made for correcting previous prices for the dilution or concentration factors. Share
prices are therefore identified by placing an S in the code column for the share price CLOSE
(only). You cannot perform the above share price adjustments on a file if the S is not in the
CLOSE field. (You will get a message of “No shares specified”)
The default field for plotting on the Y-axis, which is set when the file is first loaded, is
indicated by placing a D in its adjacent code column. Once the file is loaded, if required, the
field for plotting can easily be changed for another in the Define calculations and date
range form discussed in Chapter 4.
The third column contains an estimate of the maximum value that a field will reach. (For
economy of memory, all values are stored as two-byte integers with a range of values
between ±32 000. This integer must then be multiplied by a factor, which is calculated from
the maximum value entered in column three, to give a scaled number for the actual field
value. It follows that all fields are limited to about five digits of precision, which is sufficient
for most purposes.)
The maximum number that can be stored will be at least as great as the estimated maximum
value, but can be up to ten times as great. If a field is later entered with a value greater than
that allowed by the number in column three, then a warning message will appear and will
abort the editing to allow you to either correct the entry or to update this maximum value to a
larger number before editing is recommenced. If it is necessary to increase the value it should
be increased by a factor of 10.
When the details for all fields have been entered and corrected, pressing OK will accept the
entered structure as defining the file.
The View/edit records dialog box will appear from which data input can be commenced for
the daily records. See the next section for details on entering data. For the moment you would
only need to create one (maybe fictitious) record and then save the file by clicking the Save
file button and inputting an appropriate name to save if different from the one you first
specified.
Viewing/Editing
This particular option allows you to both view the individual records in your data file and to
change them by altering existing records, deleting records, inserting records or appending
additional records to the end of your file.
(If you are manually and regularly updating a number of securities then the use of the BULK
utility will greatly speed up this process. Very few users will ever use this facility. This is
discussed in Chapter 8.)
To enter this mode click button 8 View data records from the main toolbar or choose the
item View data records item under the Edit menu. Alt I is the speedkey to access this dialog
which will appear displaying the final record in the currently resident data file.
163
If the currently loaded file had been an adjusted or compressed file then you would have been
warned and asked if you wished to load the appropriate unadjusted or uncompressed file
instead. Normally you would answer Yes to this question.
The actual data for that record is displayed in the long white vertical edit box. The field
names for each of the items is shown in the long grey edit box to the left. These field names
cannot be changed from this form but can be altered from the Define file dialog box that we
encountered previously.
Fig 7.2
On the left of the form you have the record number and the day of the week that cannot be
edited but underneath is the date and time that you can change. The slider bar under the date
and time allows you to scroll through the records of the file by moving the thumbtrack button
left or right.
The time box is only relevant for intraday tick data files which have a caret “^” appended to
their file names.
Clicking on the arrow buttons at the end of the scroll bars will move one record at a time.
Clicking inside the scroll bars will move to the beginning of the next or previous year (or in
the case of tick files to the beginning of the next or previous day). Taking the thumbtrack
button to the furthest position on the right will present a newly dated blank form ready to be
filled in and appended to the existing data file.
You can search for a particular record number or a particular date (ddmmyy) by inserting the
relevant value in the edit box. Click the appropriate button below and the particular record
you are seeking will be displayed.
164
The right hand side of the form contains the controls to change or edit the file in several
ways. By clicking the mouse cursor in the large edit box to the right you can enter or edit
numbers manually. In the Edit record group of buttons you can repeat the line containing the
edit caret on to the line below it, you can accept the record with its changes or you can
abandon the changes for that record and start again or if it is a completely new record you
can skip its date entirely.
As you are appending records to the end of a file by editing in this way, after you accept a
new record a blank one will be presented to you for further input. This new record will be
automatically dated to the next day, week or month depending on the autodate status
indicated in the list box - Daily, Weekly, Monthly. If autodate status is off there will be no
automatic dating of records and you will have to enter the dates manually yourself.
In addition to these facilities you can delete records by placing the number of records (from
and including the current one) that you wish to remove. You can also insert records before
the current record by entering the number of records required to be inserted. They will be
autodated depending on the setting of the autodate status.
When you are satisfied with the changes you have made click Save file to save it to disk.
Since no permanent changes are made to the file until you save it you can abandon your
whole edit session by clicking Exit edit. Should you be using this dialog to view records only
then you should not press the Save file button but use Exit edit to leave the form.
Saving data file
To save the currently resident data file click button 9 Save data file on the main toolbar or
select Save data file from the File menu. The speedkey for this operation is Alt A. You will
be presented with the Save file dialog box where you can leave the filename as it is, edit it to
what you want, or browse your disk to see what already exists.
You are also given the opportunity to permanently convert the file to double precision by
ticking the appropriate check box.
When you have altered the name to what you require then click OK. If the file already exists
on disk you will be asked if you wish to overwrite it.
Loading data file
To load an existing data file click button 10 Data management - Load/erase/merge on the
main toolbar or access it from the File menu by selecting the Data file management item or
use the speedkey Alt K and the following dialog box will appear. It is the same dialog as
shown in fig 2.14 except that the Load into memory radio button is selected.
165
Fig 7.3
If you know the code of your new security then just type in say NAB in the first edit box and
hit ENTER or click OK. If you do not know its code then type in its name or part of its name
in the second edit box and click Select. The program will then search for all codes matching
the name and tabulate these in a list below with security code, name and main activity. This
table can be sorted on any column simply by clicking on any column heading.
Click the required one (if not already highlighted). You will also notice on the dialog box
five Action radio buttons with Load into memory ticked. Click on Load into memory if
this is not the currently active one. Then click OK and your security will be loaded into
memory ready for viewing or editing.
If you had wished to see and choose from all securities in the directory then leave the two
edit boxes at the top of the dialog box empty (using the clear button if convenient) and click
Select. The list box will then fill with all the codes in the directory. Select the one you want
and click on it to highlight it then click OK to load it.
Had you instead wished to see only those codes starting with A (or ANZ) then type A* (or
ANZ*) in the edit box, click Select and the list box will accumulate all the codes
commencing with A or (ANZ). Click the one you want and then click OK.
Note that the dialog box will close after the security has been charted. Should you wish to
select and load more than one from the list simply uncheck the box Close dialog on
acceptance. This option will then remain active as your default for subsequent sessions.
It is often useful under these circumstances to resize this dialog box by dragging its right
hand edge to the left until only the security codes are showing. After shifting the narrowed
dialog box out of the way to a convenient point on the screen, charts of several securities may
then be added to the working area by consecutively double clicking on their codes.
166
Browsing Data File
Sometimes it is more convenient to view the data in a file in a browse mode where 19 records
at a time can be perused rather than examining one record at a time. To do this choose
Browse data file from the Edit menu. A list box will appear displaying data for the most
recent dates. You are then able to scroll through the whole file. If your file is very big you
might need to press the Next block button to see the next section of the data file. Click
Cancel to quit browse.
Deleting Data File
The process for deleting an existing data file from your database is the same as that for
loading a data file (see Loading data file above) except that you will click the radio button
Delete file in the Action group. You will be asked to confirm your action before it is
implemented.
Portfolio Equity Curves
The Pfolio Equity button allows you to immediately select all available Portfolio Equity files
generated from your portfolios in the Portfolio Manager. When the list appears double click
the one you require and the relevant equity curve will be immediately charted.
Modifying Files
Checking Data File
Should you have cause to suspect that your data file might contain certain logical errors then
you can perform specific checks on it by choosing Check data file from the Edit menu. You
will be asked whether you wish to search for:
Dates out of order
Zeros in any field
High Low Close inconsistencies
If you choose to check for zeros then you will be requested to input the field that you wish to
check. Remember that the number you input is the field number taking the date as field 1. If
any inconsistencies are found you will be told the record number that is the problem. When
all record numbers have been noted you will be told that the check is complete and you can
edit the various records to correct any problems you have found as described in the
Viewing/Editing section above.
167
Filling Data File
This facility is usually only applicable to compound files such as
WORLD (WORLDFIL), SYDNEY (SYDFIL) where all the data in any
record may not be available at the one time or where some securities
are not traded on certain days while others are. Ordinary simple
security files do not normally need to be filled.
Often when entering data by hand it is necessary to omit entries because the information has
not yet become available or because it is not applicable for that daily record. The field for
that day will be set to zero and will show up as a spike on the chart.
If entries are missing it is most convenient to leave them as zeros in your master file as they
are then easy to identify as such for later editing. However, for the purposes of plotting and
analysis, especially when dividing by a field with a missing value, it is desirable to "fill"
these blank entries with the last recorded non-zero value for that field.
This is achieved by using the Fill option from the Edit menu and specifying the field number
which you wish to fill. If all fields are to be filled then type all. To abort this process enter
nothing and then press ENTER. A file that has been filled is immediately renamed to
NONAME.DAT to prevent accidental overwriting of the masterfile. If you wish to save the
filled file choose the Save data file option and provide a name which is different from that of
your masterfile.
NB Before filling a file, first check to see whether there are "zeros" or blank entries in the
first record. If so, enter some satisfactory non-zero number to avoid filling subsequent entries
with zeros.
Adjusting Shares for Issues etc
Share prices are subject to splits, issues, reconstructions, premium and capital returns and
should be corrected for the diluting effects which are a consequence of these events. The
Database Manager service (see Chapter 8) performs this function automatically for you via
the web unless you wish to do it manually yourself as described below.
You will first need to enter the necessary information in the data file and then carry out the
operations to adjust previous prices in the file.
For shares which are subject to such adjustments, Insight Trader maintains two separate files
An unadjusted raw data file which contains all the original prices as well as the
information required to perform any adjustments.
A file which is an adjusted form of the raw data file
168
The adjusted file has the same filename as the unadjusted file except that it has a % character
appended to it eg BHP is the raw data file and BHP% is the adjusted file.
This enables Insight Trader to access the original information at any time to readjust a
previously incorrectly adjusted file and also to access original prices for valuing portfolios at
any time in the past. If this information has been adjusted for charting purposes it would give
incorrect data for portfolio calculation.
However, this does not apply to tick files where there is not a separate unadjusted and
adjusted file. Once the adjustments are made to a tick file the terms of the adjustment are
removed from the file and the file is saved under its original name.
If you are updating your database by downloading from a data
service, or using the BULK manual update facility, although the % files
are actually dependent files, they are automatically recreated and
updated by Datacapture every time it is run. Such files therefore do
not have to be saved originally as dependent files. If Datacapture is
saving a file in which it detects adjustment information it will
automatically also adjust this file and save it to a corresponding % file.
Entering Adjustment Information
Fig 7.4
To enter adjustment information for the currently loaded file choose Issues splits from the
Edit menu. You may be informed that you are about to edit the adjusted file in which case
you should choose to load the unadjusted file instead. The following dialog box will appear
consisting of three columns to allow details of up to 15 issues, splits and reconstructions to
be entered.
169
The first column is for the dates of each issue (in the form ddmmyy). The date of each issue is
the date that the shares went ex rights etc. In the second column, the ratio of the number of
shares offered for every share held is entered - eg. a 1 for 4 issue will be entered as 1:4, a 2
for 3 issue will be 2:3. The third column is for the cost of each new share issued. With
reconstructions, a 5 into 1 reconstruction will be entered as 5>1. With splits, a 1 into 2 split
would be entered as 1>2.
For example:
A 3 for 1 rights issue with an exercise date of 251213 and a cost of 100 cents per unit is
specified as:
Date
Ratio
Cost
251213
3:1
100
If this was a bonus issue it would be entered as:
251213
3:1
0
If this was a 1 into 2 split it would be entered as:
251213
1>2
0
A reconstruction where 10 shares are consolidated into 1:
251213
10>1
0
If there is a simultaneous return of capital and/or premium enter the cost as the total moneys
returned per old share:
251213
10>1
15
If there is a capital and/or premium return without consolidation then simply set the ratio as 0
and the cost equal to the total moneys returned per old share:
251213
0
15
If the data in the file has already been adjusted for the dilution effects of issues, the
information for these issues should not be included in this form.
170
Adjusting the File
Choosing Adjust issues from the Edit menu will automatically adjust all share prices in the
file according to the issue information which has been specified in the Issues/splits
specification dialog box above.
The file will be renamed to append a % sign to the code to avoid accidentally overwriting the
masterfile, which should be kept in its raw unadjusted form. The adjusted file can be saved to
disk, if required, preferably as suggested with a % character appended eg BHP and
BHP%.
Merging
General
It is possible to merge two data files to produce a composite file. This will allow you to:
Append records to the beginning/end of a file from another file.
Replace one or more fields, over a range of dates, with others from another file.
Rearrange fields within a file.
Increase/reduce the number of fields in a file.
If you wish to merge two files you first need to load into memory the file with the earlier
starting date (using the method described above under Loading data file). This file will be
referred to as the Current file C. Then you need to access the same dialog box again and
enter the name of the other file (referred to as the Import file I) that you wish to merge with
the current file to produce the Final composite file F. Click the Action button Merge with
XYZ and then click OK to accept.
171
If Date Ranges Overlap
It is important to understand that when C and I are merged, if and
where their date ranges overlap, records from I will replace those for
dates that existed originally in file C. Those records in I that do not
have corresponding dates in C will be inserted in their appropriate
positions in F.
To achieve a particular result it is sometimes necessary to delete records from the beginning
or end of one of the two files C and I to remove the overlap and to save them under
temporary names, before undertaking the merging process using these temporary files instead
of the originals.
The Merge Files Dialog Box
After a file has been selected for merging you are presented with the following dialog box:
Fig 7.5
At the top there is a list of the field numbers and corresponding fields for both the current file
and the import file. Below this there two rows of edit boxes - the top one containing the
numbers 2-20 representing the field numbers of the current file. The bottom boxes that are
white need to have inserted the field numbers in the import file that are to replace the
corresponding field numbers of the current file above. This process is repeated for all fields
172
you wish to be replaced. If the bottom boxes are to be numbered identically to those at the
top then pressing the Match button will achieve this automatically.
Below there is a group of Options for merging from which you must select one:
The first option will completely remove all original data from the current file. If the field
in any record in the current file is not overwritten by a value from the field for the
corresponding date in the import file then that field position will be set to zero.
The second option will merge data from file I beginning with the first date in the import
file
The third option will only start merging data from file I from the last date in the current
file.
Common Merging Operations
Below is a summary of the steps necessary to achieve the indicated modifications with a
current file C and an import file I.
To append records from one file to the beginning or end of another file, where both files
have identical field structures:
If necessary remove any records in either file that are not required. Save the modified
files as C (for the file with the earlier start date) and I (for the file with the later start date)
Load file C.
Choose the merge option and select file I
Enter the merge field numbers to be identical with their corresponding current field
numbers by pressing the Match button.
Select under Options either of the last two radio buttons as required
To replace one or more fields in file C with fields from file I over a required date range:
If necessary load file I and remove unwanted records (outside the date range required)
and save modified file as ITEMP.
Load file C.
Choose the merge option and select file I (or ITEMP) as appropriate.
Specify field positions in file I that are to replace the corresponding field positions in file
C.
If the fields being replaced are not the same type as the substitute fields, or if you wish to
blank out all original entries for that field in file C, check the first radio button under
Options or otherwise choose buttons 2 or 3 as appropriate
To rearrange the order of fields in file C that is currently resident:
Choose the merge option and select file C (ie. merge file C into itself).
Specify field positions in import file C that are to replace the corresponding field
positions in current file C.
173
Check radio button 1 under Options
* To increase/reduce the number of fields in a file
Choose Create New File from the New File Menu and set up a file specification
containing the number of fields required for the new file structure but giving only dummy
names in column 1 (say all "a") and dummy maximum values in column 3 (say all "1").
This is file C.
Edit the first record and enter the starting date required and accept.
Choose the merge option and select file I.
Specify the field positions in file I that are to replace the corresponding fields in file C
Click radio button 1 under Options.
Dealing with Old and Reused Codes
When using the Portfolio Manager you need to ensure that all security data files relevant to
your portfolio are in your database including any files that may have changed their codes,
become delisted or their codes reused since you first owned them.
You may find that these files have been moved to the OLDFILES folder from where you can
restore them to their original locations. Make sure, however, that if you subscribe to
Database Manager that you have also unticked the options 1) Delete old codes from database
after merging and 2) Remove delisted companies from the Database Manager configuration
dialog otherwise these files will be removed again to the OLDFILES folder the next time that
Database Manager is run.
Where the ASX sometimes reuses a previously delisted code, say XYZ, we employ a
convention of renaming the old file to Z1-XYZ. If your portfolio contains such a security
with a code that has subsequently been reused, then you should ensure the old file Z1-XYZ is
installed in the database and that any references to this security in your portfolio are renamed.
To change the name and code you should access the button to the right of Ticker symbol in
the Security Transaction form. Just type in the new code Z1-XYZ and any previous security
transactions in the portfolio involving the old code will have their code changed to the new
ticker.
Printing and Exporting data
Hardcopy printouts or ASCII or DIF disk files of data from the resident Insight Trader data
file may be obtained by choosing Print/export data from the File menu.
174
Fig 7.6
Specify in the dialog box:
the device required (printer or disk)
the disk filename if appropriate
the data range needed
the range of field numbers desired
the format of the date as one of five types
Whether a DIF file rather than a normal ASCII file is required
Whether quotes on names are needed
Whether output needs to be comma separated or tabulated
If an ASCII disk file is required as input to another program choose the option to enclose the
field names in quotes.
Printing to any device may be frozen at any time by pressing any key. If the next key pressed
is ESC then the file will be truncated at that point but any other key will continue the
printing.
DIF files are an old format used to import data into some spreadsheet programs.
175
Importing files in ASCII format
Provided that they conform to one of a number of simple data structures, ASCII data files can
be converted to IT format by selecting the Datacapture option of the Utilities menu. Set up
the record structure and source and destination directories as described in Chapter 8. Note
that Datacapture will only import ASCII files with up to a total of 7 fields including the date.
The ability to convert data files in this way allows the data to be interchanged between
different programs.
Other Data Formats supported
Insight Trader can now directly read data and chart from four different data formats:
(i) Its own native Insight Trader format as previously
(IT)
(ii) Metastock format (<255 files per directory)
(MS)
(iii) The BodhiOne format
(BO)
(iv) The Quotes Plus Inc QP2® format
(QP)
Establishing a BO or MS Database for Charting within IT
Just log on to the "stem" directory of the appropriate BO or MS database - ie the directory
just below the one(s) where the individual data files are stored. This is done from
Format/Preferences either by typing the name of the stem directory into the box Path for
configuration and data files or by browsing for the directory on the hard drive.
For example if your data files are stored in:
C:\My Databases\BodhiOne\ASX\A...Z
then either browse for, or type in the name of, the stem directory as:
C:\My Databases\BodhiOne\ASX
Note that with later installations of Bodhi the files would be stored instead under:
C:\Data\BodhiOne\ASX
IT will detect whether it is a valid IT, MS or BO directory and inform you accordingly. (It
does not matter what the names of the individual subdirectories off the stem directory are
called as it will appear from the program that the securities in them are all in one big
directory.) If IT detects that the directory is not any one of these three formats or that the
directory does not yet exist then it will ask if you want to create a new valid IT directory
around the stem directory that you have specified. For the two foreign formats, IT will create
a directory branch WINITSYS off the stem directory to contain all of its working files eg
saved charts, portfolio files, list files, Database Manager files, notes etc.
176
If you are using a BodhiOne database with Insight Trader you can create data files for your
own purposes that you can manually update. This has many uses. For example it will allow
you to update, chart and value unlisted trusts in your portfolio. The Bodhi Viewer is available
on request.
Establishing a QP2® Database for Charting within IT
From the main menu choose Format/Preferences and in the box labelled Path for
configuration and data files enter C:\IT-QP. Click OK to accept, OK to establish as and IT
directory and OK to save configuration
Running Insight Trader using foreign data formats is only slightly slower than using the
normal native format.
Changing Between Directories
This directory that you have just logged on to will be remembered by the program and in
future you can rapidly switch between this any other previously logged directories by
clicking on the New directory button (no 11) on the main toolbar and selecting it from the
list by double clicking. You will always know the format of the directory that you are
currently logged onto as it will be specified as IT, Metastock, BodhiOne or Quotes Plus in
the blue caption bar at the top of the main Insight Trader program window.
Converting Files from Foreign Formats into IT Format
You can manually convert individual files for specific securities one by one by loading each
into memory (as you do for charting) and then saving it by clicking on the "Save file" button
(No 9) on the main toolbar. The file will be saved into the:
stem..\WINITSYS\DATA
directory if the WINITSYS directory has not yet been split or into the appropriate
WINITSYS alphabetic directory otherwise.
To convert the whole database, first log on to the required foreign stem directory to convert.
(It is advisable to "split" the WINITSYS directory into alphabetic subdirectories before
proceeding by specifying the appropriate directory (ie stem...\WINITSYS) under
Utilities/Split data directory option.) Then select Utilities/Import foreign format data
from the menu. The converted IT files will be placed into their appropriate data directories
off the WINITSYS directory. You can then actually view these newly converted files in their
native IT format by logging on to the
stem..\WINITSYS
directory from the form accessed from Format/Preferences. Either type the path into Path
for configuration and data files or browse for the WINITSYS directory from the small
button on the right side of the input box
177
Highlighter Functionality for Foreign Databases
BodhiOne, Metastock or QP databases are unable to produce the Highlight list generated by
Datacapture as these databases are maintained by non-IT applications. If you wish to have the
same functionality as provided by the Highlighter in Datacapture then you should load and
run the standard System filter Highlighter method from the list of Systems - using a reference
list containing all securities. The hits displayed in the resulting file HILITE list should
include those that would have appeared from the Datacapture Highlighter. Any securities
whose alarms have been hit should appear within a separate list file SYSALARMS.LST that
is produced whenever the Systems tester is run.
Generate a List of All Codes in a Foreign Database
When using foreign databases eg BodhiOne, Metastock or QuotesPlus a list of all (or
selected codes) can be generated from the Load New Security dialog (2nd toolbar button).
When the Select button is clicked the list of codes showing in the table below are written to
the standard list file SELECTED.LST. This list can then be used as the reference list for
filtering in the System tester, autorunning or charting.
Backing up data
Backing up your data files and program files is one of the most important tasks you need to
undertake. Just remember that if you have a hard disk crash or data corruption - and such
crashes are quite common - then you may not be able to access your data - ever. This loss
may represent months or even years of hard work and you will stand forlornly by your
computer regretting bitterly that you did not establish a systematic backup procedure.
Remember that if for any reason you have the need to manually copy
any files from a CD (eg by using Windows Explorer) then these files
may end up as READ ONLY on your hard drive and it may not be
possible to update them. You can overcome this by removing the read
only attributes using Windows Explorer or alternatively by typing from
the \WINIT directory at a DOS or COMMAND prompt:
ATTRIB -R *.* /S
This will remove the read only attributes from all files in the WINIT
folder and in any folders within the WINIT folder
Make sure that no Insight Trader software is running when you do this.
IMPORTANT: This problem only arises in earlier versions of Windows
Data can be backed up in many ways using tape backup systems, CD burners, removable
hard drives, memory sticks, Microsoft utilities and other backup utilities. You should use one
of these systems that backs up your whole hard disk as your main protection and only use
other methods as a supplement to your major backup procedure.
It is worth considering using a disk image backup system that create an image of your whole
drive and are designed to allow you to restore your system to its original state.
178
Checking data integrity
From time to time you may wish to check the integrity of your database and to remove
foreign files that may have found their way into your data directories, corrupt files or old
files etc. (This integrity check differs from the Check data option of the Edit menu which
checks the logical order of dates in the file and the consistency of the High-Low-Close
information.)
You perform this check from the Check data integrity option of the Utilities menu. In the
dialog that appears you must enter the directory to check which is usually \WINIT.
Check the options for the operations that you require:
Shift bad files to a BADFILES directory
Clean bad ticks from intraday files
Convert live database to new monoformat
Remove alarms from all securities
Check for null records
Shift OLD files to an OLDFILES directory
The first option will detect and remove foreign, orphaned and corrupt files.
The second option allows you to clean out bad ticks from intraday files with a threshold of
the given % deviation from the surrounding ticks.
The third option will convert an old live database to the new monoformat.
The fourth option will remove alarms from all securities.
The fifth option will check for null records with “zero” dates and empty prices
The sixth option allows you to remove old files by entering the date for which you wish to
remove any files where the last record in the file is any earlier than this date.
Unless you really wish to remove old files it is recommended that you do not choose the fifth
option as these old files can be required by Database Manager to merge where a company has
changed its name etc and by the Portfolio Manager to value portfolios at past dates.
However, if you do wish to remove old files then use this method rather than doing it through
non IT utilities when incomplete removal of files can cause problems.
179
Fig 7.7
If a file is so badly corrupted that it will cause the program to crash then there will be two
codes displayed in the blue caption bar of the Check data integrity dialog box. One of these
will be the corrupt file. Take note of the two codes before proceeding further. Then test to see
if both codes can be charted. If one of them causes the program to crash then this will be the
corrupt file.
If the two files were ANZ and AAP then you should first attempt to chart ANZ. If it charts
successfully then you should press the key N (for New) and enter ANZ-% in the dialog box
as the code to chart in an attempt to chart the unadjusted file. If this crashes then this is the
corrupt file. If not then do the same with AAP (and AAP-%). Delete any corrupt files by
pressing ALT K and entering AAP* then Select. Delete for example both AAP and AAP% if
AAP has been identified as corrupt.
(When charting files it is the adjusted or % file say BHP% that is loaded by default. If you
want the unadjusted file instead you need to press N for New and specify BHP-%. Normally
when a file becomes corrupted it is the unadjusted or non-% file that is affected.)
180
Deleting Block of Data from Whole Database
Sometimes bad data may be inserted into all securities in your End-of-Day or Live database
for a particular day or time. You can remove this bad data en masse from all securities from
the form. Tick the checkbox Delete block of data and specify whether it is for Live or Endof-Day data.
(a) To remove a single day from all securities in your EOD database specify the
Year/Month/Day only in the From: option and leave the To: option blank.
(b) To remove a range of days from your EOD database specify as in (a) but using both the
From: and To: options.
(c) To remove a block of data from your Live database you must specify both the To: and
From: limits and supply in addition the hours, minutes and seconds if necessary. If you leave
hr, min, or sec blank then zeros will be assumed for these fields. This option is no longer
used.
Generate list of all securities with alarms set
Whenever the Check Data Integrity Option is run a file ALARMSET.LST will be
produced that contains all the stocks that have alarms set and lists these together with their
current activating price if alarms have been hit. This file is accessed like any LST file by
clicking the lightbulb button on the main toolbar and loading this file which is is available as
a standard LST file like HILITE from the dropdown list box from the Enter Highlight File
Name dialog box.
Deleting completely all alarms within Database
To do a mass removal of all alarms set in your database tick the option Remove alarms
from all securities on the form before clicking Start check.
181
Chapter 8
Downloading Data
Overview
The Insight Trader Datacapture utility (DATACAPT.EXE) accessible from the Utilities
menu, or from button 27 of the main toolbar, enables a series of individual Insight Trader
data files to be automatically updated via an internet data service providing a single daily
ASCII file.
In addition it can be used to import data from an ASCII file containing historical data for a
single security only.
This utility is also used to update data files using the ASCII file produced by the Bulk
manual update utility for rapid manual updating.
Updating can be done one day at a time or if the data service utilises a date systematic
naming convention for its ASCII files then a very rapid procedure is available for importing
hundreds of files in one go. This can reduce the average processing time from minutes per
day to only a few seconds per day.
Datacapture can accept a very wide range of record formats and naming conventions for the
ASCII files it is required to import.
Twenty two separate data services have already been customised in Datacapture to enable
instant configuration but any data service may be used which can provide an update file in
one of the many acceptable ASCII formats. In addition, the proprietary downloading
software from these companies can optionally also be accessed directly from the Utilities
menu provided you have entered the appropriate command line in the Format/Preferences
configuration dialog.
The data presented to Datacapture must be in a general ASCII format. This is usually
achieved through the software provided by the data service, which downloads a daily data
file via internet from the host computer, and converts it to the ASCII file which can be read
by the various charting/analysis programs to update their own data files.
Note that you do not need to initialise files manually. Datacapture does
this automatically for you.
To provide consistency with most other users we suggest that you
arrange with your data vendor that data is distributed so that share
prices are expressed in cents rather than dollars and cents and
volumes are in 100’s. However this is optional.
182
For most purposes it is only necessary to select one of the 22 preset
dataservices and to check that the path settings suggested are
correct. More detailed configuration is only required for specialised
customisation.
Distributing Single Daily ASCII Files with Datacapture
Before you can use Datacapture you will need to configure it for the particular data provider
that you are using.
After you have configured Datacapture you will be able to distribute daily ASCII files from
your data vendor in either interactive mode using the Datacapture utility manually or
automatically through the downloading software of the data vendor.
Express Configuration
An express configuration for any one of up to 30 preset data services will suffice in most
cases.
Select Datacapture from the Utilities Menu and the WinIT Datacapture utility will be
launched. Click the first toolbar button Instant Configure and you will be presented with a
dialog as shown below.
Fig 8.1
183
Data providers frequently change their service. Before entering any arrangement with a data
provider or this list please confirm with them that they currently provide data suitable for
Insight Trader.
Select the data service you require and press the Reset Data Provider button. Datacapture
will now be configured for most services so long as any software from the data service has
been installed in the standard directories on the same drive as the Insight Trader program.
You will then be asked if you wish to install historical data from CD and if so follow the on
screen instructions. If you wish to install historical data from CD but do not wish to reset to
the default settings for your data provider then click the Historical data install button
instead.
To check that these default settings are correct select the second toolbar button Custom
configure and another dialog will appear as follows.
Fig 8.2
Check that the data paths are correct. The default paths shown should be correct in most
cases. For example the ASCII source path should be the path specified by your data vendor
for these files. If your data provider does not supply their own software and you are simply
downloading a file from the internet manually then place these daily ASCII files into the
184
\WINIT\ENDOFDAY directory. The destination path should be the main Insight Trader
directory to which you wish your data to be sent.
When specifying the Insight Trader destination path for data files only
use the main IT directory eg \WINIT . Do not include any subdirectory
off \WINIT such as DATA or A or B etc.
You are also given the opportunity to specify the paths and filenames of two “wave” files
that will play a sounds for the siren whenever an up or down alarm is activated. There are
usually a number of such wave files in the \WINDOWS\MEDIA directory which are more
interesting than the default sounds that are used if you do not provide your own wave paths
and filenames.
The check boxes on the right should be marked as shown with the Verify disk writes
unchecked as this is only used for diagnostic purposes to determine whether the files written
to disk can be read. If you wish to use the Highlighter and Siren facility as described below
then these boxes should be checked also. If you want the alarms to activate on the closing
price rather than the high and the low prices then check the box Alarm on close.
The other check boxes which should remain as shown control whether:
the maximum value adjustment will be automatic
an out of order entry will be inserted or ignored
the dependent files adjusted for issues/splits are automatically updated.
screen output is complete or suppressed for all but highlighted and stoploss alarm
activated securities.
dummy trades (with zero volume) transmitted by some data vendors will be ignored
all files will be saved as double precision
If the Insert mode option in the options dialog is on it allows you to insert data prior to the
last day in the Insight Trader data file. This is useful if you have accidentally missed out
updating one or more days and then inadvertently added data for later dates. This can happen
also if you attempt to update data in the wrong order. Without the INSERT option ON you
are automatically prevented from updating these missed dates.
Highlighter
When updating large numbers of securities through the Datacapture it is possible to set a
filter which will automatically flag exceptionally performing ones. Checking the Highlighter
box in the dialog shown in Fig 8.2 will enable this facility. If switched on you will need to set
the parameters you require. Click the third toolbar button Highlighter and the next dialog
box will appear requesting you to set the options available.
185
Fig 8.3
You first need to specify the period or Time constant over which the filter is to operate eg
10 days. The highlighter operates in such a way that there are three criteria that any security
has to satisfy before it will be highlighted.
(a)
Momentum (for the time period) has to be greater than the percentage limit you
specify.
AND
(b)
Volume has to be greater than the specified percentage above the moving average of
the volume over the time period.
AND
(c)
The price has to be greater than the given percentage above the moving average of
the price for the time period.
Set the values you want in the four edit boxes and ensure that the Highlighter on box is
checked. Then press OK to accept.
The list of highlighted stocks so produced after Datacapture is run to update the files can be
viewed by selecting Highlight List from the File menu in the main Insight Trader program
and specifying HILITE as the file to view.
Any of the three criteria can be disabled by putting its percentage limit equal to zero. For
example, if all the percentage limits are set to zero, all stocks will be highlighted.
The figure below is an example of a typical highlight list output from Datacapture.
186
Fig 8.4
Detailed Custom Configuration
The procedure outlined above will be suitable for most people who can skip this section and
proceed immediately to Running Datacapture for a Single Day.
However, if you have subscribed to a data service other than those ten preconfigured above,
or if you require advanced facilities, then you will need to customise the options in
Datacapture in detail to enable it to operate with your source data.
Before proceeding, however, you will need to understand the general structure of the ASCII
file required.
ASCII Format Required
This section is presented for technical reference only and may be skipped unless specialised
information is required.
Datacapture can handle a wide range of ASCII formats such as follows:
1.
HLCV
eg.
2.
OHLCV
eg.
3.
BHP 11/25/14 1080 1060 1075 17351
BHP 11/25/14 1065 1080 1060 1075 17351
OHLCVI
187
eg.
4.
BHPKA 11/25/14 125 140 115 135 1432 67210
OHLCVIT
eg.
BHPKA 11/25/14 125 140 115 135 1432 67210 154000
Where:
OHLCVIT stands for Open High Low Close Volume (open)Interest Total-open-interest
Note however, that the file format is extremely flexible:
the code name is optional
the date can be in one of seven formats
the OHLCVIT fields can be in any order
the field delimiters can be a space, tab or comma or any of these three with any additional
numbers of spaces or tabs.
The internal date delimiters can be slashes “/” or hyphens “-“ .
there may be an extension field following the code (eg BHP, WMA, .., .. ) to append to the
code to construct a composite code for say the warrant BHPWMA. There may also be a field
following the code or its extension providing the name of the security eg:
WBC, Westpac Banking Corporation, .., .., …
there may be one or more header fields in the file to ignore
New files are initialised automatically after Datacapture detects which of the above four
formats is required.
In a single precision file all fields in Insight Trader format are represented by 2-byte integers
with approx 5 digits of precision. The OHLC fields will be automatically setup for maximum
values of a little over 3000.0 cents ie. $30 and can include decimals of 1 cent. The V and I
fields will be automatically set up for maximum values of a little over 300. These values will
not be large enough in many cases but will be automatically increased by the utility if
necessary. Some data services provide the volume fields in hundreds of shares (ie. the
volume divided by 100). Most services allow you to scale these fields and we suggest
hundreds for ordinary shares on the ASX and prices in cents.
(The default maxima for all fields in all new files can be changed by altering the template
files HLCV.DAT, OHLCV.DAT, OHLCVI.DAT and OHLCVIT, which are used for
initialisation. Load each into the Insight Trader program, alter the maximum values on the
Define File Specification form and resave the files.)
With double precision data it is generally unnecessary to alter the template files.
188
It is essential that data is updated in chronological sequence unless the insert mode is on. If
files are updated with 25NOV14 data before 24NOV14 data with INSERT OFF, then the
latter data will not be included.
The template files HLCV.DAT, OHLCV.DAT, OHLCVI.DAT and OHLCVIT.DAT, which
are used for initialisation of new files, must be in the Insight Trader data subdirectory where
the files to be updated will reside - ie DATA if the directory is not split (see below) or the H
and O subdirectories respectively if it is split.
Please note that it is not necessary to initialise files manually. When Datacapture realises that
a file does not exist for a new security it will automatically initialise one utilising the
appropriate template file mentioned above.
Custom Configuring Datacapture
In addition to the configuration options discussed under Express Configuration above it is
also possible to configure in detail the record structure of each line in the ASCII file. From
the dialog shown in Fig 8.2 Click the Specify file structure button and the following dialog
will appear.
Fig 8.5
189
If there are extra fields as discussed above check the appropriate boxes. If there is no code
field in each record because the data all relates to a single security whose code is contained
within the file name eg NAB.TXT then check that box.
If there is a line or two of data of say headings at the top of the file that you wish to ignore
then enter the number of such header lines that should be skipped. If the fields are not in the
normal OHLCVI order then enter the order in which they are presented in each record.
When these specifications have been completed press OK to save.
Running Datacapture for a Single Day
Now that you have configured Datacapture it can be run at any time - either automatically
through the software of your data vendor calling this utility or you can run it yourself by
selecting Datacapture from the Utilities menu.
To manually update click the fourth toolbar button Go which will present you with a dialog
in which you should enter the name of the ASCII file to be distributed.
Distributing Many Daily ASCII Files with Datacapture
If you have many daily data files to distribute at one time you can do this extremely
efficiently so long as these files are named according to a systematic date convention.
If you choose Date range rather than Single file on the Datacapture configuration dialog box
then all the daily data files are first read and the data for all the dates and securities
accumulated in memory. Then each Insight Trader security file is opened only once, all its
new data inserted , and then closed only once. This can mean that the average processing
time per day is only 10 to 15 seconds.
If you are not using one of the preconfigured data services then you will need to customise
the convention used for the filename.
Select Date range rather than Single file and then click the Filename scheme button on the
Custom configure dialog of Fig 8.2 when the dialog below will appear.
190
Fig 8.6
Select the appropriate date coding scheme used in the filename and any characters used
before or after this date should be entered in the Predate and Postdate boxes. The Extension
to the filename should also be entered. Press OK to save.
Running Datacapture for Many Days
You can run Datacapture manually to update many days at once by selecting Datacapture
from the Utilities menu.
From the Custom configure dialog Fig 8.2 select Date range rather than Single file then
click the fourth toolbar button Go which will present you with a dialog in which you should
enter the Starting and Finishing dates for the files to be distributed. The finishing date can
be left blank allowing all data up to the current date to be processed.
If you are distributing an ASCII file containing data for more than one date ensure that it has
a filename corresponding to the first date for any data in the file. For example, for a file
containing data for the whole month of July 2001 the file should be named 02JUL11.D or
010712.TXT or whatever depending on the Filename scheme as specified in the
Datacapture configuration. Furthermore the filename must correspond to a valid weekday
otherwise it will be ignored.
191
Running Datacapture in Command Line Mode
After configuring Datacapture in interactive mode as described in the preceding sections for
the source and destination paths and data service it can then be run in command line mode.
This is how the software of the data services that call Datacapture automatically access this
utility.
The general syntax of the command is as follows:
DATACAPT
ASCIIfilename [destination directory]
The DATACAPT command is followed by the name of the ASCII file to be distributed and
optionally by a destination directory which will override that specified in the configuration
file.
The command line mode is especially useful for calling from other programs or from batch
files.
An example of such a command where the configured destination directory is overridden by
a second command line parameter:
DATACAPT 16AUG14.D \FUTURES
This will now override the destination path set in the configuration file by redirecting the
output to the \FUTURES directory.
Should you wish to process all files from a given starting date up to the present (ie a date
range) then you can use in place of the filename a date followed by an optional string of
characters (that will become the predate) eg:
DATACAPT 160814AF \FUTURES
If the filename scheme has been specified as in Fig. 8.6 above then this command will
process all files of the form
AF16AUG14.D
for the date 160898 up to the present, from the source directory specified in the configuration
dialog of Datacapture into the destination directory \FUTURES.
Split Directories
There is an option to split each DATA directory into multiple directories based on the letters
of the alphabet. Data files are placed in the subdirectory of the letter of the first character of
the filename, eg BHP goes into directory \WINIT\B. This has been designed specifically for
192
the users who take the whole of the ASX market and who would otherwise have been
operating with up to 10,000 files in the one DATA directory. Splitting the directory can lead
to speed increases of 50-100% in operations such as downloading, loading data files from
disk or the operation of the Database Manager. This is because the operating system only has
to look through a list of a few hundred files rather than many thousand for the one it wants.
Apart from the speed increase, the operation of the program with a split directory will be
transparent to the user who can still operate other directories as previously and these other
directories can be split or not split. Insight Trader automatically detects whether a directory is
split or not and accommodates it accordingly without the user being aware.
You can also use this facility to automatically distribute to their correct alphabetic
subdirectories, into a directory already split, any number of new files which you may wish to
include in your database. Simply place them into the \WINIT\DATA subdirectory and split
the directory again. They will then be moved into their correct directories.
To split a directory carry out the following:
Backup all your Insight Trader directories.
If the directory contains less than 1000 files there is probably no point in splitting it.
From the Insight Trader Utilities menu choose Split data directory. You will be
presented with a dialog in which you should enter the name of the directory to split
eg. \WINIT or \FUTURES (DO NOT include the DATA subdirectory specification!)
Then click the Split directory button and the progress will be displayed
This will split the directory as required and transfer the files over from the existing
DATA subdirectory.
When the utility has completed the process press Cancel to return to Insight Trader.
Whenever you wish to insert some new historical data into a currently
split directory just place all the new data files into the \WINIT\DATA
subdirectory and then run Split Data Directory. This will automatically
move all the data files out into their correct alphabetic subdirectories.
Bulk Manual Update Utility
This utility is only used for very specialised applications and can be ignored by most users.
For updating large numbers of shares manually there is available a very efficient DOS utility
accessible from the Utilities menu which allows a temporary ASCII file to be produced
containing the prices for all securities of interest for one day. This file uses the same naming
convention as the Almax data service for its files and uses the same structure. Eg. the file for
Christmas day 2015 would be automatically named 25DEC15.D and would have the same
structure. It can be distributed to the individual IT data files in exactly the same way as
described above using Datacapture.
193
Setting up
Directories
Firstly create a directory off the \WINIT directory called ASCII to receive the files created by
BULK.
The list file
Then set up a file named LIST.DAT (a sample is supplied with the program disks), using an
ASCII editor or wordprocessor. This should list all shares/indices that you want to follow in
the order in which they will be input (usually determined by the order in the newspaper).
Using the editor set out a list of ASX codes in the following manner
ANZ
BHP
CBA
DMP
ERA
etc
Then save this file as LIST.DAT in the WINIT directory.
If you are using very early versions of Windows with Notepad, Wordpad, Microsoft Word
you should save it as a Text file and enclose the filename in quotes eg “LIST.DAT” to avoid
having an unwanted .TXT appended automatically to give “LIST.DAT.TXT”
Configuring the utility
Select Bulk manual update from the Utilities menu and when the BULK menu appears set
the Path for ASCII destination files to \WINIT\ASCII and the Data type required to
HLCV or OHLCV etc depending on what format you wish the final file to have. BULK can
handle a number of data types viz:
C
CV
HLCV
OHLCV
OHLCVIT
Entering the data
When you choose update to enter the information you will be automatically prompted for the
next share and, in order, its (open) high, low, close and volume.
By entering numbers separated by + and/or - you can add/subtract in any field. Eg. volume
may be obtained and accumulated from several exchanges. Just enter eg. 61000+32988+364
and these will be automatically added before being stored.
194
By pressing F10 instead of ENTER you can duplicate the previously typed in entry.
There is the provision to skip any securities not traded on a particular day. If you hit ENTER
for all fields of any record then that record will be ignored and not included in the ASCII file
produced for updating.
With practice you can become very quick entering this data manually.
Distributing the ASCII file
When the file for the day has been completed the Datacapture utility DATACAPT.EXE
should be configured and run as described above for the data services Vestdata and Almax.
However, the Maximum value Automatic option on the Datacapture options dialog
should be left unchecked to catch any typos you may have made. Also set the ASCII source
path to \WINIT\ASCII and the IT destination path to \WINIT.
The information for the day will then be distributed to all the individual files when you chose
to update.
If DATACAPT detects that the maximum value you specified needs to be increased as a
result of a value that it has found it gives you the option to Increase the maximum value,
Truncate it to the maximum value, Abort the updating process or to Modify the value
manually.
This is particularly useful if that number was a typo because it gives you the opportunity to
correct it during the DATACAPT process. Please note however that the correction is only in
the IT data file. The ASCII file from which it is derived will still contain the original number
which should be corrected later, most conveniently from the editor, when the process is
finished.
195
Insight Trader ASX Database Manager
Insight Trader ASX Database Manager is an optional subscription service designed
specifically for people who are downloading the whole of the market to allow then to keep
their whole ASX database organised simply and easily by adjusting for company
reconstructions, providing fundamental data and allowing you to analyse your data according
to GICS industry sectors.
Data from your data service is transmitted to you via a series of three letter ASX codes, one
for each company. For various reasons these codes may change from time to time. The
company name can also change as can its main activity or GICS subsector. Sometimes the
company may split its stock, make rights or bonus issues, reconstruct its capital and/or
return portion of its capital or premium. These changes affect the share price so previous
prices need to be adjusted to allow a valid comparison over time for charting analysis. A
reconstruction can also lead to a suspension of trading of the primary ASX code which is
temporarily replaced by another known as a deferred delivery share.
It can be a major chore to properly carry out the housekeeping manually on your ASX
database, which can typically be 4,500 files in size. It is necessary to hunt down all the
necessary information from various sources and insert it in the appropriate files, merging all
the separate files together that need to be merged and removing from the database all the old
files, that have been merged with new ones (typically about 450 files). After that, adjusted
files needed to be generated for any securities that have been the subject of splits issues and
reconstructions.
The Database Manager service does all this for you. It will:
Insert the company name into each security file so that it will appear as a title in your
charts.
Insert the main activity of each company in the first line of the F2 notepad for that
security.
Insert any previous ASX codes for each company in the first line of the F2 notepad.
Insert data for issues, splits, reconstructions, and capital and premium returns in the issues
form of the file for each security so that the previous prices can be adjusted for these
changes.
Insert the fundamental information of Earnings Per Share, Dividend Per Share, Franking,
Net Tangible Asset Backing, Shares on issue, Market Capitalisation and Debt to Equity to
allow the derived information of Price Earnings Ratio, Dividend Yield and Price to Net
Tangible Assets to be automatically calculated and displayed and searched for using the
Systems Tester
Flag the nearest forthcoming dividend exdate (where this is available) and this will appear
in the F2 Notepad as Exdate/Dividend in Cents/Franking/Payment date. The chart will
also show in the caption bar the first three of these. In addition a vertical bar (in the
colour attributed to the open interest field) of a length equal to the dividend plus the
imputed tax credit will drop from the top border of the chart and be positioned between
the exdate and the previous day.
Merge the appropriate files where the ASX codes have changed or where deferred
delivery shares have temporarily replaced the normal shares. It can then move these old
files , that have been merged with the current files, out of the working directory into a
196
new directory for later archiving. (If they are older than 6 months). This merging can be
carried out as regularly as required to ensure all active deferred delivery securities are
properly joined to the parent security.
Automatically create "%" files adjusted for splits, issues, reconstructions.
This database also interacts continuously with the normal operation of your Insight
Trader program to allow you to load files by specifying part of the company name
preceded by an apostrophe eg. 'WESTPAC or 'BROKEN to load WBC or BHP if you do
not know the code.
Automatically create reference lists consisting of all the companies in particular ASX
GICS subsectors. These lists can then be used to autorun a slideshow of all the companies
in the chosen subsectors, generate a chart arrangement of all these or used as reference
lists for the Systems Tester filter operation.
The highlight list and Portfolio Manager reports will include the code, company name &
activity.
The Database Manager where installed can be accessed from the Database Manager option
of the Utilities menu.
The Database Manager updates are usually transparently performed weekly (say every
Tuesday - but can be done anytime) for the user simply by clicking on the menu item
Utilities/Update from web option and the Web Updater utility will automatically update
your database for adjustments and fundamental information. It will also refresh your Insight
Trader software, if necessary, by updating your version to the latest release of that version.
The most recent standard notices that automatically appear during the Database Manager
updating NOTICE1, NOTICE2 and NOTICE7 can all be accessed again directly at any time
from under the Help submenu.
We also provide lists of the top 100, 200 and 500 stocks as ASX100db.LST, ASX200db.LST
and ASX500db.LST, ASXSmallOrdsdb.LST, ASXSubindicesdb.LST,
ASXSectorIndicesdb,LST as standard lists in the dropdown list box that appears when you
attempt to select a list. This facility is only available for Database Manager subscribers and is
updated weekly
User Supplied Fundamentals
Some users have a requirement for more extensive fundamental information than the basic
measures provided by Database Manager. We have therefore enabled Insight Trader to
optionally utilise additional fundamental information sourced by the user and presented to the
program in the form of CSV files that are placed in the ....\WORKING\CSVFILES folder in
the relevant database – usually WINIT\WORKING\CSVFILES.
This information can be displayed within the program - and in some cases be used to
calculate additional fundamental values and used in searches.
This information may be sourced from broker’s websites, other websites, other software,
generated by the user or manually input by the user. Because the same fundamental measure
may be calculated by different people in several different ways, the various sources may
provide very different values for the same nominal quantity. Users now have the freedom to
choose whatever source best suits their requirements.
197
This extended information is presented to Insight Trader by the user in the form of up to 6
CSV files that are dedicated to specific fundamental measures, up to 11 files that can
override values or populate the vacant positions in the F2 notepad and up to a further 9 CSV
files that are general in nature and able to display any information.
This facility is provided as a specialist functionality for those users requiring extended
fundamentals and who are competent to obtain and utilise CSV files. You will find
instructions for implementing this feature under "Help/User supplied fundamentals". Contact
us for further instructions for sourcing information from specific broker websites or third
party computer programs.
Updating Insight Trader from the Web
By clicking on the Spiderweb button on the main toolbar or accessing Utilities/Update from
web from the main menu you can easily keep your version of Insight Trader continually
refreshed with the latest changes in that version and at the same time update your ASX
database for the latest adjustments and fundamental information as described above. The
Web Updater utility automatically knows what has to be downloaded to bring you up to date
and it even automatically updates itself from time to time.
Fig 8.7
Should you wish to download again any component that you have already downloaded (eg
because of a problem in communications) then you should first choose Utilities/Reset
downloads. The dialog box above will appear and you should check off those components
you wish to redownload. Note that the items Data 1 to Data 4 are reserved for future use.
The Web Updater also performs the function of automatically completing the process of final
registration of your program.
198
The Spiderweb Toolbar Button
The Spiderweb toolbar button 28 on the main toolbar that accesses the webupdater can be
used with the Shft, Ctrl and Alt keys to perform certain specialised tasks as follows:
Alone - Downloads anything that needs downloading (as before)
Alt - Reprocesses the already downloaded Database Manager
Shft - Forces a re-download of the latest Database Manager
Ctrl - Forces a download of the latest Program files.
Only use Ctrl with the Spiderweb button if you are happy to trial the latest update to the
program as we often upload beta versions for our beta testers to trial the changes before
release to the general public. Updates released to the general user base will come down
automatically when you click the Spiderweb alone. Clicking this every week will keep your
program and Database Manager up to date.
199
Chapter 9
Systems
Overview
The Systems Tester is an optional module in Insight Trader. It allows you to set up
mechanical trading rules consisting of sets of combined technical and fundamental criteria
that must be satisfied for certain actions to be triggered. Each set of criteria (or system) is
arranged in two sections - the Buy Alert and the Sell Alert criteria. The resulting system is
then used in either one of two distinct modes:
As a filter to enable you to trawl your whole database to identify those securities
satisfying the criteria that you have specified.
As a profitability tester to enable you to calculate the profit you would have
made had you traded a particular security over historical time according to your
rules.
In filter mode you specify a reference list of securities that you want investigated (maybe the
whole market) and the systems tester will construct a highlight list of all those securities
satisfying the criteria on either the buy side or the sell side.
This list will display, for each security, certain standard technical and fundamental values
like momentum and dividend yield. The list can be ordered according to this information as
well as alphabetically. The list can be printed out, used as a highlight list for an autorun or it
can be used as a reference list for another systems filter.
In profitability tester mode it will create a report of all the trades it has made listing costs,
brokerage, profits and a comparison with a simple buy and hold strategy. In addition it
creates two event files - one containing the buy events and the other the sell events. These are
overlaid on your charts to reveal the dates on which your hypothetical trades were made.
Constructing a System
Structure of a System
A system is composed of a set of up to 16 criteria, each of which specifies a condition that
must be satisfied. These conditions are constructed using the important quantities of price
and volume that are the basis of your charts. They can also involve functions derived from
the various indicators as well as fundamental quantities such as dividend yield. There are in
addition a number of specialised functions particular to the systems tester.
The values of these functions can be multiplied, divided, added or subtracted before being
subjected to various logical tests to create a criterion. Up to 8 of these criteria are linked
200
together by AND and OR relationships to produce the Buy alert and Sell alert sets which
constitute the overall system.
Syntax of the Criteria
Each criterion is presented in an easily understandable way in the form of an expression such
as:
RSI(14,D) :>: 70
This means that if the 14 day RSI is above 70 then this criterion will be satisfied.
Multiplication, division, addition and subtraction can also be used:
H(W) :<=: 1.05 * MC(15,W)
This criterion will be satisfied for any security where the weekly high is equal to or below the
5% envelope above the 15 week moving average of the close.
Each expression contains the following three elements:
(i)
A logical (or relational) operator enclosed between colons such as :>=: (1 only)
(ii) Functions such as RSI(14,D) or constants such as 70
(iii) Arithmetic operators + - * / between functions
There can be up to 2 functions on either side of each expression.
Where there are 2 functions on any side they are joined by */+ or -.
In addition each function can have up to 4 parameters with the final parameter specifying
whether daily D, weekly W or monthly M.
(For the interest only of those users who are familiar with the normal computer nomenclature
is shown below the general structure of each expression:
Func() [ArithOp Func()] :RelOp: [Func() [ArithOp Func()]]
The minimum allowed is:
Func() :RelOp:
)
201
Functions
The following is a list of available functions. The parameters required are given in brackets
after the function where n values represent numbers that, for the indicator functions, are input
in the same order as they are for charting purposes. The final parameter that is indicated by
D, which is sometimes the only parameter, is set at D for daily, W for weekly or M for
monthly. For example the weekly default MACD is expressed as:
MACD(26,12,9,W)
just as you would input the parameters for charting purposes.
An "ago" facility is available to calculate previous values eg MC(10, D-7).
This function will return the 10 day moving average of the closing price, seven days before
the target date. Just place minus the number of periods after the D, W or M parameter in the
relevant function eg MACD(26,12,9,M-3).
The Basic Functions
These functions reflect the basic price and volume quantities and only require the time period
parameter
Basic Functions
Function
Name
O(D)
Opening price
H(D)
High price
L(D)
Low price
C(D)
Closing price
V(D)
Volume
Candle Functions
These functions provide the sizes of various basic components of candles
202
Candle Functions
Function
Name
BODY(D)
Candle Body Size
ABODY(D)
Absolute Value of Candle Body Size
RANGE(D)
Range
TSHAD(D)
Top Shadow
BSHAD(D)
Bottom Shadow
HMO(D)
High Minus Open
HMC(D)
High Minus Close
OML(D)
Open Minus Low
CML(D)
Close Minus Low
(Close - Open)
(High - Low)
Main Chart Indicator-based Functions
These functions are based on the indicators that are displayed in the main chart and described
in the chapter on Indicators and the n1, n2 and n3 parameters represent the same parameters in
the same order as described in Chapter 3 for charting purposes.
Main Chart Indicator-based Functions
Function
Name
MO(n1,D)
Moving Average of the open
MH(n1,D)
Moving Average of the high
ML(n1,D)
Moving Average of the low
MC(n1,D)
Moving Average of the close
MV(n1,D)
Moving Average of the Volume
PAR(n1,n2,n3,D)
Parabolic Stop and Reverse
BOLL(n1,n2,D)
Bollinger band size
LLR(n1,n2,n3,D)
Line of Linear Regression
The Line of Linear Regression needs the following explanation
n1 = period
n2 = is the % or no of ATRs displacement for any lower band
n3 = is the % or no of ATRs displacement for any upper band
If n2=0 and n3 = 0 the return value is the central "cord"
203
If n2<>0 and n3 = 0 the return value is the lower band
If n2 = 0 and n3<>0 the return value is the upper band
Specify n2 or n3 as negative to get an ATR rather than % band
Sub Chart Indicator-based Functions
Function
Name
MAOS(n1,n2,D)
Moving Average Oscillator
RSI(n1,D)
Relative Strength Index
STO(n1,D)
Stochastic
SSTO(n1,D)
Slow stochastic
MACD(n1,n2,n3,D)
Moving Average Convergence Divergence
MOM(n1,D)
Momentum
DETR(n1,D)
Detrend
ADX(n1,D)
Directional Movement Indicator ADX
ADXR(n1,D)
Directional Movement Indicator ADXR
PDI(n1,D)
Directional Movement Indicator +DI
MDI(n1,D)
Directional Movement Indicator –DI
ATR(n1,n2,D)
Average True Range
ROR(n1,n2,D)
Rate of Return
MFLOW(n1,D)
Money Flow
MFI(n1,D)
Money Flow Index
BULLP(n1,D)
Bull Power
BEARP(n1,D)Bear Power
FORCE(n1,D)
Force Index
WILLR(n1,D)
Williams %R
PCBOLL(n1,n2,D)
Bollinger %b
TREND(n1,n2,D)
Trend
LRGR(n1,D)
LRGR
SROC(n1,n2,D)
Smoothed Rate of Change
VELOCY(D)
Velocity
BEHAVR(D)
Behaviour
204
All the above are directly analogous to their indicators and the reader is referred to Chapter 3
on indicators. For example, RSI(7,D) is the 7 day RSI where n1 = 7.
Special Functions
A number of functions have been designed especially for the systems tester to provide
measures for market behaviour not available otherwise.
Special Functions
Function
Name
MAX(n1,D)
Maximum
MIN(n1,D)
Minimum
RUNS(D)
Runs
BHG(n1,D)
Breakhigh
BLW(n1,D)
Breaklow
ACTVTY(n1,D)
Activity
Constants
Constants
The Maximum function returns the maximum price that occurred in the previous number of
periods. For example MAX(7, D) is the maximum price seen in the last 7 days. If the history
available in the file is less than the number of days specified the test will be considered to
have failed. However, if the number of days is entered as a negative value, eg MAX(-260,
D), and if the total number of days in the file is less the specified figure, the function will
return the maximum value in the data available ie the all time maximum up to that point.
The Minimum function is analogous so that MIN(15,W) would be the minimum price seen
in the last 15 weeks. However, if the number of weeks is entered as a negative value,
eg MAX(-52, W), and if the total number of weeks in the file is less the specified figure, the
function will return the minimum value in the data available ie the all time minimum up to
that point.
Activity function returns a value between 0 and 1 depending on the proportion of trading
days that have seen a trade. The argument n is the number of four week blocks over which to
calculate the value of the function. If there are no trades in the period then ACTVTY = 0
If there has been a trade for every weekday ACTVTY = 1.
If there have been trades on half the days ACTVTY = 0.5
Holidays are counted as a missed trade and the value returned will be less than 1. Only use a
compression of D
205
In order to determine when a significant peak has been broken we have introduced the
Breakhigh function. It is based on the concept that if we had said yesterday that we had not
seen prices so high for three months (t1) but today we can say that we have not seen prices so
high for a year (t2 ) the probability is that today we have just broken a peak that occurred
three months ago. The Breakhigh function will return the value of t1 (ie three months) so
long as there has been a significant increase between yesterday and today in the time for
which we have not seen prices so high. Otherwise it returns zero.
The first parameter required by this function is a threshold parameter which sets a limit to the
significance of the breakout. If t2/t1 is greater than this threshold then Breakhigh will return t1
otherwise it returns zero. By default this parameter is set to 1.5 so that we need to see at least
a 50% increase.
If a non zero value is returned by Breakhigh then we need to check that we are not just
breaking a recent temporary high of say two days ago so we check our value of Breakhigh
against some other limit in our system criterion. We might for example require that the high
that is broken is at least one month ago and would therefore set our criterion as:
BHG(1.5,D):>:30
To define this function more rigorously BHG(1.5,D) returns the number of calendar days
from today that the previous trade's high price was last equalled or exceeded (provided the
value of the ratio defined below equalled or exceeded the value of the threshold 1.5 given by
the first parameter in the function otherwise it returns zero). This ratio is:
number of calendar days since today’s high was last equalled or exceeded
_________________________________________________________________________
no of calendar days from today since the previous trade’s high was equalled or exceeded
The significance of a threshold of 1.5 means that we can now see over the top of the last peak
a "distance" of 50% more than we could before. The value returned by the function is
approximately the number of calendar days ago of the position of the peak that has just been
broken.
Breaklow BLW() is defined in an analogous way to Breakhigh except that we are dealing
with troughs instead of peaks.
The Runs function returns the current number of consecutive rises (or falls), in an unbroken
run of rises (or falls), that a security has experienced. If RUNS(D) is positive it gives the
current number of consecutive daily ups or if negative the number of consecutive daily
downs.
Fundamental Functions
It is possible to insert into the F2 notepad of your security files the latest fundamental
information of DPS, EPS, NAB and Franking. This is done regularly and automatically for
subscribers to the Database Manager service but can also be performed manually.
Corresponding fundamental functions providing this information are also available in the
system tester. The last five are available if your data provider supplies the raw information or
206
if you are importing data inthe form of CSV files as described in the section on “User
Supplied Fundamental Data”.
Fundamental Functions
Function
Name
DIVYD(D)
-
Dividend Yield
EYLD(D)
-
Earnings Yield
NTAYLD(D) -
NTA Yield (NTA/Price)
PER(D)
-
Price Earnings Ratio
PNAB(D)
-
Price to Net Asset Backing ratio
FRNK(D)
-
Franking (0 - none, 50 partial, 100 full)
TMSC(D)
-
Times covered
PRFI(D)
-
Composite performance index
MKCAP(D)
-
Market Capitalisation
DER(D)
-
Debt to Equity ratio
DAR(D)
-
Debt to Assets ratio
PSR(D)
-
Profit to Sales ratio (Operating Margin)
ROE(D)
-
Return on Equity
ROA(D)
-
Return on Assets
BTA(D)
-
Beta
All of the above functions are self explanatory except for the composite performance index
which is calculated according to the following ratio
PRFI(D)
=
DIVYD
______________
PER x PNAB
Note that % values for Dividend yield, Earnings yield and NTA yield values are entered as
decimals.
eg DIVYD(D):>:0.05 will allow you to filter out of your directory those securities with a
Dividend Yield greater than 5%.
207
NB These fundamental functions should be used on recent data only
as the values for the underlying fundamental information are for the
most recent reports. Therefore they should be used for filtering on
recent dates rather than for profitability testing.
Filter Reports and printed highlight lists contain values for selected fundamental functions
from the list for each security where this is available provided the Database Manager is
installed or the requisite information has been entered via CSV files as explained elsewhere
under “User Supplied Fundamental Data”.
Arithmetic Operators
One arithmetic operator joining two functions can appear on each side of the logical
expression for a single criterion. The following is a list of the arithmetic operators that can be
used.
Arithmetic Operators
+
plus
-
minus
*
multiplication
/
division
Logical Operators
You can have one logical operator separating the two sides of any expression. These logical
operators must be delimited by a colon at the beginning and end. These colons must not be
omitted.
208
LOGICAL OPERATORS
:=:
equals
:>:
greater than
:<:
less than
:>=:
greater than or equals
:<=:
less than or equals
:^:
penetrate up
:Y:
penetrate down
:X^:
crosses up
:XY:
crosses down
In addition to the greater than, less than, equals operators which are self explanatory we have
four other operators that let us know if one value is greater than another but only if it has just
happened.
The penetration operators :^: and :Y: indicate penetration of one value by another. These
specify whether one function has just penetrated another up or down respectively.
For indicators that have trigger lines . (ie MACD, STO, SSTO and ADX) the crossover
operators :X^: and :XY: test whether the indicators have just crossed up or down over their
trigger lines.
The Total System
We have examined the functions that are available, the arithmetic operators that we can use,
the logical operators that separate each side of the expressions that constitute the criteria that
we set using the necessary syntax. Having constructed each of these criteria we now need to
assemble them into a system that we can use to run a filter or profitability test.
A system constitutes two sets of criteria - the Buy Alert and the Sell Alert. Each set can
consist of up to 8 expressions (representing 8 criteria) which are joined by a logical AND or
OR. An example of what you might see on one side of a system is as follows:
209
RSI(7,D):Y:70
OR
MACD(26,12,9,D):XY:
OR
MC(30,D):>:MC(60,D)
AND
C(D):<:M(60,D)
The 7 day RSI penetrated 70 down
or
The daily MACD has crossed down
or
The 30 d MA is above the 60 d MA
and
The price closed below 60 day MA
In constructing your sets of criteria remember that logically the AND's are calculated before
the OR's. (ie we say AND has greater precedence than OR.)
Because you need to specify two sets of such criteria - The BUY ALERT set and the SELL
ALERT set - in total you may specify up to 16 expressions for any one system. For certain
filtering operations you may only be interested in one side of the system, say the Buy Alert
side and you can therefore leave the other side empty and it will never be satisfied. For
profitability testing it is essential that both sides of the system contain triggerable criteria.
Using a System
Before we can use our system we need to set it up on the computer as we have designed it.
There are three ways we can do this:
By creating a new system from scratch
By loading an existing system
By editing an existing system
Setting up the System
Fortunately Insight Trader comes with an existing library of about 80 systems already
configured and it is most likely that you will be able to use one of these directly for most
purposes. If not there is every likelihood that you will be able to modify an existing one
without difficulty. Otherwise you can construct a system from the ground up as it is not at all
difficult to do. We will first learn how to create a new system.
Create New System
From the Systems menu choose the New system option and you will be presented with the
following dialog box.
210
Fig 9.1
On the left hand side you will see provision to enter up to 8 expressions defining your
Conditions for Buy Alert. On the left of 7 of these eight edit boxes are buttons which, if
pressed when there is a valid expression in the previous edit box, will cycle between AND
and OR. So you can enter the first expression in the first edit box and then press the button on
the left of edit box 2 until it shows either AND or OR depending on what you require.
There is a corresponding set of boxes and buttons for defining your Conditions for Sell
Alert.
The three dropdown list boxes at the top of the dialog box can allow you to automatically
place into the active expression any functions and operators displayed in the lists there. This
saves you remembering the exact tokens for these components. After dropping these tokens
into the expressions simply fill in the required parameters in the empty parentheses. Using
these drop down list boxes facilitates the building of system criteria and reduces the
probability of error.
Keep entering expressions until you have all the criteria for your Buy Alert. Do the same for
the Sell Alert side and when you have finished and checked that the expressions are correct
then type a descriptive name for your system in the System description title edit box below.
Then click the Save as new system button to save your system to disk and click Cancel to
exit.
211
You can save up to 1000 systems in this way for later recall and use at any time. These saved
systems may be accessed from the system menu and can be selected from a list in a similar
way to saved charts. We will now try to recall our system from disk.
Load System
Fig 9.2
Choose Load system from the Systems menu or click button 14 Load system from the main
toolbar or use the speedkey Alt Y to load an existing system from disk. The following dialog
box will appear displaying a number of predefined systems and any that you may have saved
yourself. The buttons and boxes on this dialog box operate in an analogous way to those on
the dialog box for loading chart arrangements from disk. This dialog has fewer buttons
because we only have one category for saved systems rather than 10 as for charts.
Select and Load the system of your choice. This dialog box will now be replaced by the
Systems filter specifications dialog box that we used above to create our system but it will
contain all the criteria of the chosen system. This will now be discussed.
Edit System
If a system is already currently loaded into memory then it may be edited by choosing Edit
system from the Systems menu. Otherwise it is accessed indirectly as described under Load
System above. The Systems filter specifications dialog box appears and the system may be
edited to your requirements and saved to replace the original (Save system) or we can save it
as a totally new system (Save as new system) leaving the original one intact.
From this dialog box we can also directly filter our directory (with the Filter Dbase button)
or perform a profitability test (Profit test ).
212
Filtering your Database
To filter your database you will need to :
1. Select an existing (or create a new) Reference List of securities to filter. To create
such a list manually, or automatically according to the standard ASX GICS
subsectors, refer to Manually Generated Reference Lists or Generate Highlight
List from ASX Subsectors in the Autorun Reference or Highlight Lists in
Chapter 5. The structure required for reference lists used for both filtering and for
autorunning are identical.
2. Select an existing (or create a new) System of filter criteria that need to be satisfied.
3. Decide on a Target date for the test to be applied
4. Decide on how many days back you wish to examine each security (ie the Notrades
Limit) to ascertain the last trade. If the security has not traded within the Notrades
Limit then it is ignored during the filtering process.
5. Filter the directory
Set the Reference List
By selecting Reference list set from the Systems menu a dialog box will allow you to type
in a reference list name or search your directories for a suitable reference list from which the
security codes to be searched will be taken. If you wish to save this as the default list to
appear each time you access your systems filter then choose Configuration save from the
Systems menu to save it.
Filter the Directory
If you already have a system loaded then you can go straight to Filter directory from the
Systems menu. Alternatively, if you have chosen the Load system, Edit system or New
system options you will eventually enter the Systems filter specifications dialog box, shown
in Fig 9.1 which has a button Filter Dbase allowing you to directly enter the Systems filter
dialog box which appears below. You will have to enter information into three boxes.
Browse buttons are provided for the first two.
Fig 9.3
213
The first entry is for the target date ie the date for which you wish the tests to be carried out
The For date is the date for which you wish to perform the filtering. The default is TODAY.
If a security has not traded on that date then the analysis will be performed for the last date
traded before that date so long as it is within the Notrades limit. Therefore in the third box
enter the number of calendar days that you wish the filter to look back for the last trade
before the analysis for that security is abandoned.
You also need to enter a file specification (ie filename and path) to Listfile Specs for an
ASCII file containing a list of securities for which you wish to perform the filtering. This can
be:
(a) a reference list constructed as described in Chapter 5 using the Generate Ref
List from Sectors option from the File menu. Such lists may consist of all
companies in particular ASX subsector or the whole market itself. For example you
would use this method if you wished to run a filter just on all the gold companies on
the board.
(b) the output highlight list of a previous filtering run
(c) a daily ASCII download file such as the \DIALCHRT\ASCII\25DEC15.D for
Vestdata users
(d) any ASCII file that the user may wish to construct, which contains a list of the
required ASX codes. For example, you could have several watch lists or a list of all
the codes making up the All Ordinaries Index etc. The files should be structured in
the same way as are lists created for autorunning (refer to the relevant section for
details). These are structured so that the codes occur one under the other after an
initial header line:
“300614”, “My Watch List”
ANZ
BHP
RIO
... etc
There can be other information on each line provided it is separated from the code
by either a space or a comma as in the Vestdata daily ASCII download files
mentioned above. Such list files can be constructed using a text editor or
wordprocessor and saving the file as an ASCII or text file.
While the filtering process is underway a window will display an upper line showing the
code of the security currently being analysed and a lower line displaying the last code which
satisfied the set of criteria together with a string of numbers indicating which of the criteria
1-8 of the set has been satisfied. A plus refers to the Buy Alert criteria and a minus to the Sell
Alert criteria eg.:
+12 4 7
indicates buy conditions 1,2,4 and 7 have been satisfied.
- 345
indicates sell conditions 3,4 and 5 have been satisfied.
If both Buy and Sell Alert criteria have been activated then only the Buy Alert signal will be
considered valid.
214
View the Report
When the filtering is complete, a report will appear presenting the securities highlighted
including their rank, their codes, their names, their main activities together with the number
strings specifying the criteria met. Also shown are the momentum, the percentage by which
the volume is above the 10 day moving average of the volume and the percentage by which
the price is above the 10 day moving average of the price. Then come the two global
indicators of Velocity (on which the list is ordered) and Behaviour. In addition to these
technical quantities there will also be shown (where the information is available) the
MarketCap, MoneyFlow, Debt to Equity, PE ratio, Earnings Yield, Dividend yield, Franking,
Gross Dividend Yield and P/NTA.
In the case where you have imported User Supplied Fundamentals in the form of CSV files
there will be the additional columns for Return on Equity, Return on Assets, Return on
Capital, Earnings per share Growth, Earnings Stability, PEG Ratio and a spare column. After
this there are two columns for display only for items of your choice.
Fig 9.4a
Fig 9.4b
215
Double clicking any security on the list will chart it. Selecting any security, range of
securities or several individual securities and pressing the Chart button will create a chart of
each one selected. Pressing the Chart all button will throw up a chart of every security on
the list on the screen at the same time.
You can sort the filter list on any column as described below by clicking the column header.
The report can be printed by clicking the Print button on the dialog box. Pressing the Resave
list button will resave it to disk as sorted in its current order.
The Close dialog on acceptance check box is ticked by default so it will close after charting
any selection. If you wish it to stay open to add more charts until you specifically close it
then untick the checkbox.
At any time the last filter report generated can be viewed by choosing View last reports
from the Systems menu or by holding the Ctrl key down while clicking the yellow Lightbulb
button on the main toolbar.
Sorting the Filter List
You can sort the list on any column by clicking the column header and then resort it in
reverse order by clicking again.
The first column contain sequential integers so that this column can be used for ranking
according to the default column on which the list is first ordered. If the list is reordered by
clicking on one of the column headings as just described the ranking column will also be
reordered and will no longer be sequential. If it is desired to re-rank the new list sequentially
then resave the list using the "Resave" button and reload the HILITE list when the ranking
numbers will be reassigned sequentially according to the new order.
Exporting Selected Columns from Filter HILITE list Summary and Accounts to Excel
You can export to Excel selected columns from the Filter HILITE listing (or any other
suitable LST file). You can choose any number of columns in any order that you wish and
you can choose to include or exclude the column headings. The default is to export all
columns in order together with headings.
The Print button on the dialog box performs the export function and you can back out of the
next printer dialog box that appears if you do not also require a printed copy. The file will
appear in the "WORKING\EXPORT" folder as HiliteLV.CSV that can be directly imported
into Excel.
If you wish to customise the columns to be exported select "Edit/Configure Hilite CSV
export" from the main Insight Trader menu and follow the prompts.
216
Autorun Highlights or Generate Chart Arrangement
The list of securities produced by filtering - the scratch file HILITE.LST - can be used in the
same way as other list files for Autorunning a template chart or Generating a Chart
Arrangement to view all securities that have been identified and may even be used as a
reference file for further filter tests.
After setting up a chart arrangement in the required format the highlight list can be Autorun
or used to Generate a Chart Arrangement as described in Chapter 5 elsewhere in this manual.
Displaying charts of the filter highlight list, using either one of these two methods, is perhaps
one of the most important activities to undertake after a filtering.
Multiday Filter
In addition to being able to filter the directory for a single day you can also set it up to
perform the filtering for many days in succession producing a filter highlight list for each of
those days. These filter lists are given a filename in the format HLddmmyy.LST where
ddmmyy is the six character target date for the filter.
Choose Multiday filter from the Systems menu and you will get the usual dialog box as for
a single day filter. When you have completed this, as for the single day, a second dialog will
appear asking for the final date after which you wish the filtering to cease.
These lists can be viewed from the File/Highlight list menu item or Alt J or the fifth button
on the main toolbar.
Profitability Testing
Before a profitability test is run on a single security over time you need to specify various
important aspects controlling the trading environment in which you will be operating. You
first need to set the amount of your initial equity and also the minimum number of units you
will be transacting in any one trade.
You also need to decide whether you will be trading long, short or both, whether it is the
closing price or another price that you will be basing your trades on. You will also need to
specify whether the signals will be acted on immediately or whether you allow a number of
days delay after a signal has been given before you enter the trade. Finally there is the entry
and exit commissions you will be paying.
In addition to this information you may wish to set various stops to get you out of trades on
particular signals other than those given by your basic trading system.
217
One important consideration to bear in mind is that the accounting procedure in the
profitability tester allows you to buy from your equity the maximum number of units that are
possible under the minimum parcel size limitation. This means that when you are in a trade
you will be holding a certain quantity of cash which is less than the amount necessary to
purchase an additional minimum number of securities. At any one time therefore, the value
of your equity is the total value of your security holdings plus this residual cash.
The buy and hold strategy calculation which is used as a comparison with the results of your
system, is based on an identical process. However, here you will be making only one
purchase, on the day your trading system starts operating, of the maximum number of
securities that your equity and minimum parcel size will allow. The total equity at any time
in the future is the sum of the value of your security holdings at that time plus the residual
cash from the original transaction.
You can also run multiple systems against multiple securities in a single batch operation as
described later if you need to test many systems on many securities.
Setup Profit Tester
To set up the profitability tester to reflect the trading environment that you wish to simulate
select setup Profit tester from the Systems menu. The following dialog box will appear:
Fig 9.5
218
You need to specify:
What position you are trading - Long Short or Both
What price you are trading
- Open High Low or Close
Delay in days between the signal and the trade
Entry commission in either % or points
Exit commission in either % or points
Your initial equity
The minimum parcel you can trade
Whether security prices are in $ or in cents
If you wish to use stops then tick the appropriate box and when you click OK to accept,
another dialog will appear to allow you to enter details on the stops you will employ.
Fig 9.6
219
Choose up to five stops:
Specify for each whether they apply to Longs Shorts Both or None
Trailing stop
The trailing stop is adjusted every time the price moves to a new extreme and is raised (or
lowered on the short side) to be below (or above) the new extreme by a certain % or a
number of points.
Enter profit risk in % or points
Enter the number of periods before the present for which you wish to ignore the extreme
values.
Profit Target stop
This stop is triggered when a preset profit level has been achieved - expressed in either % or
points.
Maximum Acceptable Loss stop
Enter the value in % or points that you wish to limit your maximum loss to.
Inactivity stop
If the price has not reached a certain specified level (% or points) within a certain number of
periods then this stop will be triggered.
Breakeven stop
Set a floor level in % or points which the price must reach before this stop will be activated.
If the price then penetrates back through the entry price the stop will be triggered at the
breakeven level.
Click OK to accept and the Profit test dialog box below will appear
Profitability Test
You can initiate the test from Profitability test on the Systems menu or it can be arrived at
indirectly through the setup dialogs as described above. Enter the start date, end date and
code of the security required for the profitability run.
220
View Profitability Test Report
The output report displays the Date of the trade, the Position held, the Action taken, the Price
at which the trade occurred, your remaining Equity, the Profit and Commissions accumulated
to that date and the profit a simple Buy&Hold strategy would have produced for comparison.
The most recent profitability test can be viewed at any time by choosing View last reports
from the Systems menu and then selecting Test report.
Viewing Trades on your Chart
Once you have finished a profitability run you can load and chart the security that you have
just tested. Then press 09 to overlay the BUYS on the chart, 10 to overlay the SELLS and 11
to overlay the STOPS as described previously for event files. These event files have been
reserved for the profitability runs so do not use them for other purposes otherwise they will
be overwritten. It is convenient to do this on a saved chart set up for the purpose when you
are testing systems. Whenever the chart is recalled the buys, sells and stops lines will be
automatically updated to reflect those for the last system test run.
Batch Run Multiple Systems against Multiple Securities
An additional Systems procedure enables you to run profitability tests in a batch for a
number of systems for a range of securities as a single operation. The systems to be tested
should be forced to the top of the list of systems by adding spaces to the front of their titles.
The list of securities to be tested should be available in either a standard LST file eg
'ASX200db.lst' or one created for the purpose.
You first need to set up your trading conditions which will be the same for each of the
systems to be tested by selecting 'Systems/Setup profit tester' from the main menu. Then also
from the main menu select 'Systems/Run profitability batch' and specify the reference file
containing the securities to be tested, the number of systems (from the top of the list) to be
run for each security, the start date and end date for the test period required. If the security
history for any security commences after the start date then it will be tested over its full
historical time span.
The results of the test are tabulated with the various systems running horizontally across
each row and the different securities running vertically down the columns. The results are
expressed in percentage profit achieved at the end of the period for each combination and the
system with the maximum profit for each security highlighted. If the the 'Buy and Hold'
return exceeds the maximum profit for the systems for a particular security the Buy and Hold
figure is also highlighted. An average value over all securities for each system is provided at
the end of the table together with a count for each system indicating for how many securities
it provided the maximum profit.
As an example the 500 stocks in the All Ordinaries index were each tested for profitability
using 20 systems in one operation that took a total of 12 minutes to perform. This represents
10,000 individual profitability tests.
221
Chapter 10
Portfolio Manager
Important Notice
This portfolio manager provided in Insight Trader is not intended as a replacement for your
accountant, tax advisor or financial advisor. It is intended primarily to assist your record
keeping and to give you some indication of the current state of your portfolio. In particular,
you must realise that the valuation and taxation treatment of share holdings is very complex
and subject to constant legislative and interpretative changes and therefore cannot be reliably
assessed by any static piece of software.
Moreover, some situations will require individual rulings by the Tax Office to determine
your precise tax liabilities and even these can be subject to appeal. Therefore, in the light of
these limitations, the various calculations and reports generated by this portfolio manager
should be considered indicative only. The basis for any valuation or tax calculation is the
original transactions themselves and these should be provided to your accountant or licensed
tax advisor for their attention - to determine professionally assessed valuations and tax
liabilities for your specific situation.
In particular the alarms provided in the software should not be relied upon as your source of
alerts as computer software and hardware systems can fail for many reasons.
Also please note that the Database Manager service (discussed in Chapter 8) does not have
sufficient detailed information about your specific situation to enable it to adjust your
portfolios automatically for events such as company reconstructions, dividends etc. Therefore
you must enter this detail yourself into the portfolio manager from the documentation
provided by the companies in question for your individual requirements.
Hardware requirements
Please note that this portfolio manager is designed to be run using a resolution of at least
1280x1024 with normal font sizes. The main portfolio window provides extensive summary
data of your whole portfolio on the screen at the one time and your display must therefore
have sufficient resolution and a small enough font size to enable this to be achieved. If you
need to use large font sizes in your Windows Desktop Settings there is a provision under the
Format submenu to Use small font to compensate otherwise it might not be possible for all
the summary information to fit on screen.
Overview
The Insight Trader Portfolio Manager provides you with a sophisticated facility to enter and
manage all your share and managed fund transactions. It has its own main window with
222
menu and toolbar and although intimately integrated into the charting functions of the main
Insight Trader software this facility can, if desired, be utilised almost as a standalone
application.
The main window of the application presents you with a global overview summary of the
currently loaded portfolio providing you with a listing of your holdings, their current value
and the capital profits, dividends and interest you have received to date. Total Portfolio
Growth over the period and the calculated Annualised Growth Rate are shown at the top of
the display. Capital profits are apportioned between realised and unrealised gains and
between discountable and non-discountable gains. These net paper profits are calculated
assuming selling costs that would be incurred if they were disposed of through your default
broker. Also shown are your stop price and net stop losses for each security – ie the amount
you would lose if your stop was activated and you exited your position at your stop price
through your default broker. You should be aware that slippage may increase the actual loss
above the amount shown.
You can link one or more bank accounts to any portfolio and the relevant deposits and
withdrawals are automatically inserted as you enter the various share transactions. In
addition, by recording other normal bank transactions such as capital deposits, withdrawals,
bank fees, interest etc you can track and reconcile these accounts. Your portfolio is
considered to consist of the sum of your security holdings as well as the cash in all linked
accounts and is displayed as apportioned between these two categories.
Unlike almost all other portfolio managers you can, by specifying a start date and an end
date, limit the calculation of profits, income and valuations to the period specified. This is
possible because the portfolio is built up from a set of historical transactions that are
accumulated in memory to construct the portfolio up to the date specified. Since none of
these transactions performs irreversible changes in the portfolio you can, by specifying a
particular date in the past or present, show the state and valuation of your portfolio as it was
at that date.
To do this it is necessary to use a database that still retains files that may have been delisted
or had their names changed and the files that are to be used for this purpose must be the
unadjusted files rather than the adjusted files that are used for charting and analysis purposes.
The normal Insight Trader database consists of both adjusted and unadjusted files and so is
suitable for valuation of portfolios for past dates. The BodhiOne database format also
provides both adjusted and unadjusted values for all securities. In contrast, Metastock
databases when adjusted to be useful for charting purposes lose the unadjusted information
totally and so normal Metastock databases cannot be used for valuations for past dates
although they are quite suitable for current valuations.
Each security, income or account transaction is given a unique identity number or ID. Each
individual parcel of securities is therefore able to be uniquely identified and tracked through
the portfolio over time from acquisition to disposal. Moreover, such transactions are
sometimes linked to previous transactions and if so are given a link identity number or LID
that is the ID of the transaction to which they are linked. For example a sale transaction is
linked to its initial purchase transaction and the sale LID is the ID of the initial purchase.
A set of global tax rates is specified that will be inherited by default by all portfolios created
in that data directory. However, each portfolio’s inherited set of tax rates can be customised
where they differ from the global default set.
223
You can benchmark the cumulative growth of your own portfolio against a fixed target
growth rate and against a suitable benchmark index. You can automatically display on charts
flags to indicate your portfolio buy and sell transactions and mark the average buy price level
for all currently open positions. On the F12 databox for any security you can show your
current holdings, profit and the additional amount you can purchase without violating your
risk management criteria as set in the Risk Calculator.
Fig 10.1
Transactions are entered under three categories:
1.
Security transaction such as buy, sell, exercise, calls, merge etc
2.
Income transactions for share dividends, trust and fund distributions etc
3.
Account transactions such as capital deposits and withdrawals, interest etc
A printed report can be produced for the Portfolio Summary. Amongst the other reports
available statements can be generated for each Account, and Dividend Statements and
Security Transaction Statements for single securities or all securities can be produced.
Reports are also available for Capital Gains, Profitability of Trades, Traders Closing Stock,
Traders Sales and Costs, Miscellaneous Income and Expenses, Portfolio Statistics. These
reports can also be printed as a batch of reports in the one operation. CSV files of each of
these reports are automatically generated and can be exported to spreadsheets programs such
as Excel.
Several individual portfolios may be “wrapped” into a single combined portfolio to provide
an overall view of your total holdings.
A Risk Calculator is included as a tool for money management calculations.
It is also possible to generate “equity curves” as well as charts of other key performance
indicators of your portfolios over time.
224
For security of information each portfolio can be assigned a unique password to keep its
contents private.
Provision has been made to convert files created from the portfolio manager provided in
previous versions of Insight Trader. However, because of the much larger number of fields
for the various categories of data that are now available the diversity of categorisation in the
converted files will be correspondingly limited. Rather than converting your previous
portfolio you may prefer to enter it again from scratch to take advantage of this diversity.
If preferred the previous portfolio manager can be used in place of the new one by ticking the
appropriate box under Format/Preferences from the main menu of the Insight Trader main
window.
To enter the portfolio manager you can access it by selecting Portfolio from the main Insight
Trader menu or by clicking button no 12 on the toolbar or via the speedkey Ctrl+Alt+P. The
Portfolio Manager window will appear with its menu and toolbar as shown in Fig 10.1.
Creating a Portfolio
Setting up Your Global Defaults
Fig 10.2
Before you create your first portfolio in any given data directory it is necessary to check your
default tax rates under Format/Set global default tax rates and change them where
necessary. These values will be automatically inherited by each new portfolio you create in
that data directory but can be modified in each specific portfolio. Just select the menu item
Format/Set portfolio tax rates when that portfolio is currently loaded and edit the values to
what you require.
225
Registering a New Broker
You should register at least one broker that you can use to provide automatic calculation and
entering of brokerage when the security transaction forms are subsequently presented for
completion. There is provision for three separate brackets of rate structure for each broker.
Choose the menu item Edit/Brokers registered or button no 11 on the toolbar and enter the
details for the broker(s) as requested below. Then press the Add Broker button to register
the broker’s details. It is suggested that you remove the information from the positions for the
fictitious brokers provided as examples with the program and reuse these positions for your
own real information.
Please note that an existing broker position in the list cannot actually be deleted because one
or more of your existing portfolios might refer to it. However, you can reuse any particular
position by selecting the broker position to be reused and pressing the Delete key. This will
clear the information currently stored against that position number and you can then edit it to
replace it with new broker information.
Fig 10.3
226
Registering a New Account
From Edit/Accounts registered, or button no 12 on the toolbar, enter the required
information as requested for at least one account. (Number of Account does not have to be the
actual account number if you are worried about security. It can be any identifying text such
as “ANZ CMT Super Acc”) Then press the Add Account button to register the account
details.
Please note that an existing account position in the list cannot actually be deleted because one
or more of your existing portfolios might refer to it. However, you can reuse any particular
position by selecting the account position to be reused and pressing the Delete key. This will
clear the information currently stored against that position number and you can then edit it to
replace it with new account information. It is suggested that you remove the information
from the positions for the fictitious accounts provided as examples with the program and
reuse these positions for your own real information.
Fig 10.4
The Three System Accounts
There are three inbuilt system accounts designated <no account> <cash drawer> and
<suspense account> that are numbered 0, -1 and -2 respectively. The use of these accounts
will be discussed below.
Use of the Account <no account>
Account number zero designated <no account> appearing in the transaction dialogs (but not
displayed in in this listing) is used as a slush account to pass through transactions such as
dividend reinvestment and demutualisations that require a notional purchase at a given unit
price but which do not actually result in a transaction in any physical account. The use of this
account will be discussed as we come to the relevant sections. The account <no account> is
considered external to the portfolio and its balance is not included in valuations. Security
227
transaction deposits and withdrawals from this account are instead treated as capital transfers
to and from the portfolio.
Use of the Account <cash drawer>
A very useful additional system account is known as a “Cash Drawer” account. <cash
drawer> can be used to accept payments and “park” them until they are finally transferred to
a formal account. One obvious example would be if you received a dividend cheque from a
company, put it in a “drawer”, and did not deposit it into your bank account until sometime
after the payment date.
To handle this you would enter details of the dividend on the payment date and attribute the
proceeds to <cash drawer> account. When you finally deposited the cheque in your bank
account you would record an Account Transaction on this date transferring the funds from
<cash drawer> to your bank account.
This way you receive your funds on the payment date for tax purposes but they do not appear
in your account statement until the date you actually deposit them. This account can be used
for many other similar purposes – for both deposit and withdrawal transactions.
Use of the Account <suspense account>
The purpose of the <suspense account> is to accommodate, notionally, any funds during the
transition between the transaction date (ie when funds are committed to a purchase, sale,
dividend etc) and the payment date or settlement date (ie when the entry for the funds
transfer actually appears in the physical bank account). In contrast to the two previous system
accounts the <suspense account> is not available for use by the user directly.
For example a share purchase transaction is considered to be effective on the transaction date
and the value of those equities are immediately assigned to the portfolio on that date.
However, with the T+3 rule, settlement does not take place until usually three working days
after the purchase. So between the purchase date and the payment date the equities would be
counted as part of the value of the equity component of the portfolio while the funds would
still remain within the bank account and hence this amount would be double counted on
valuation of the portfolio.
To overcome this difficulty a notional system account, the <suspense account>, has been
created to debit or credit funds that are in transit. The suspense account is considered part of
the total portfolio for valuation purposes and its balance is added to the value of the equities
plus all linked bank accounts, including the <cash drawer> to get the total portfolio
valuation.
The suspense account can therefore be considered as a repository for all entitlements and
liabilities of the portfolio that are not reflected in the value of securities or physical bank
accounts.
The suspense account cannot be utilised directly by the user but instead is automatically
invoked whenever a date is entered into the “Pay date” field on the Security Transactions
dialog, the Income Transactions dialog or the Accounts Transaction dialog.
Although it is not necessary to utilise the Pay date field (leaving it blank it will assume that
the payment date is the same as the transaction date) if you do then it will provide two major
advantages:
228
1) The dates shown on your portfolio account reports will correspond with the dates shown
in your actual bank statement.
2) Portfolio valuations will correctly include dividends and capital returns and will avoid
the apparent loss in value in your portfolio between the Ex-date and the Payment date
where your shares lose value but the dividend or capital return has not yet appeared in
your accounts.
The transaction date for dividends, capital returns and call payments is the exdate on which
the securities change value because of the transaction. For taxation purposes the changes in
your holdings (purchases, sales, capital returns, calls) are considered to have taken place on
the transaction date (or ex-date). In contrast your dividends are taken to have been received
on the payment date rather than on the date you became entitled to them - the ex-date.
Payment dates are when the payments are deposited or paid out from the accounts. Between
the transaction date and the payment date the funds are assumed to have been deposited into
or paid out from the <Suspense account> on the transaction date. After the payment date has
passed (ie after the portfolio End date is later than the payment date) the funds are assumed to
be paid into or out of the physical account on the payment date. During portfolio valuation
the <Suspense account> is counted as an integral part of the portfolio value unlike the
<No account>.
You can continue to use a single date for transactions if you wish in which case, if left blank,
the payment date will assumed to be the same as the transaction date.
Entering the transactions
Creating the New Portfolio File
Select File/New portfolio from the main menu or the first button on the toolbar and type in
the name of the portfolio you wish to create. If it already exists then it will load the existing
portfolio otherwise it will create a new one.
Go to Format/Set portfolio tax rates and change any values you need for this portfolio.
Then choose Edit/Brokers registered or button no 11 on the toolbar and select the default
broker you require for this portfolio and press the button Set as default broker for this pfo.
Similarly under Edit/Accounts registered select the default account you require for this
portfolio and press the button Set as default account for this pfo.
You are now ready to begin entering transaction information for your new portfolio.
Entering Dates on Transaction Dialogs
The three transaction dialogs to be discussed have two or three date fields that you can use.
Please refer to the previous section on <suspense account> for a description of the use of the
Transaction date and the Payment date. The Expiry date on the Security Transaction dialog is
informational only and is not used in any calculations.
There are three ways you can enter your dates into these date fields. You can pick a date off
the calendar that appears when you click the button with the three dots just to the right of the
box. The next method is to type in the complete date in any of the following forms:
229
080915, 08/9/15, 8/9/15, 08.09.15, 8.9.15
There is a third method that is very fast if you are keying in a series of related dates where it
is necessary to enter only part of the date. If the last entered date was say 25/12/14 then
entering the following will produce the dates indicated when the cursor leaves the box - eg by
tabbing or clicking in another box:
Enter
Date recorded
8
08/12/14
8/6 or 8.6
08/06/14
t
today’s date
Warnings are in place to alert you to the possibility that you may have entered an incorrect
date on a transaction form. You will be alerted if the date that you have entered is prior to the
'Start Date' of the portfolio or after the 'End Date'. These dates are set on the main portfolio
summary dialog. If you want a tight alert you can set them temporarily to a narrow date range
while entering a lot of data and then change them back to a more convenient setting later.
You might find however that a financial year gives both sufficient protection while also
providing a convenient date range to work in normally.
Account Transaction – Initial Capital Deposit
Fig 10.5
Before you begin purchase of any securities it is normal to deposit an amount of capital in an
account that is linked to your portfolio. Click button number 7 on the toolbar and check that
230
the account number shown is the default account for the portfolio and then click button 7 and
enter the Date and the Amount of the deposit. Also select the Transaction Type as Capital
deposit and then choose the appropriate Pay method. Press the Add Transaction button to
record the transaction and this will appear in the list below. You are now ready to start
entering purchase and other security transactions.
Security Transaction - Purchase
If you are entering a transaction for a security not already in your portfolio you need to select
from the main menu Edit/Add a new security or click the third toolbar button to bring up
the Security Transaction dialog box. The first transaction will normally be a
Purchase/acquire transaction which should be selected from the Transaction Type drop
down list
Fig 10.6
Next check that the broker and account number shown are appropriate for this transaction
and, if necessary, alter to your requirements. Then enter the Transaction date of the
purchase in the box provided or select the date from the dropdown calendar accessed via the
small button adjacent to the date box. If you then enter the Ticker symbol for the security its
Parent code, Company name and Last price will be filled in automatically by the system
when the cursor is moved to these boxes. They can be edited if the information needs to be
modified. After entering the Number of units and Price per unit the Amount, Brokerage,
GST, Stamp Duty and Total paid fields will be automatically filled in when that box
receives the cursor by either clicking in it or by tabbing across. Alternatively, if you have
values in the Number of units field and the Amount field then when you click in the Price
per unit field it will automatically calculate this value from the values in the other two fields.
Any boxes not activated in this way will be left blank and hence receive a zero value. As
previously, these amounts so calculated can be edited if the values need to be altered.
231
Automatic calculation is done on the basis of brokerage rates associated with those set for the
selected broker shown above and tax rates that have been set for that portfolio as described
previously. From Share type box you should select from the drop down list the type of
security being purchased. The Notes, Expiry date and Contract no fields are purely
informational and therefore optional. (The Currency and Conversion rate fields are
informational only and used for foreign transactions.)
When entering data on the Portfolio Transaction Dialog you can set the program to autofill
the Transaction Date box as well as the Payment Date box. The transaction date will be set
to today's date if no other transactions have been entered during the session but otherwise
will be set to the last transaction date used. The Payment Date box will be filled with the T+3
date that is three business days after the transaction date. This will ensure that the
corresponding entries automatically appearing in your portfolio bank accounts will bear the
correct date to those on your actual bank statement. If there are intervening holidays (apart
from weekends) you will have to manually edit the Payment Date accordingly. To turn on the
Payment Date autofill from the main menu click:
"Format/Autofill trans/paydates for T+3"
When all necessary information has been entered click the Add Transaction button to record
the first purchase. This action has now registered this particular security as being in your
portfolio and you will see the details of the transaction just entered in the list below. Further
security transactions can be entered for this security without leaving the dialog box but you
will see that the ticker code and parent code have been greyed out preventing you from
changing it to another code.
Close the dialog box and you will see details of your security appear in the list of the main
portfolio summary window.
(Now that this security has been registered in this portfolio any further transactions on it must
be entered by first clicking on the security required in the list of the main window to
highlight it and then clicking toolbar button number 5 - Security transactions. Alternatively,
simply double clicking on the security in the list will perform an identical function. The same
dialog box as before will appear with the relevant security code appearing in the greyed out
Ticker symbol box and details for the next transaction can be entered and accepted. If you
instead attempt to input further transactions of an already registered security code through the
Add a new security option you will be informed that that security is already registered in
your portfolio.)
Fractions of a unit for Unlisted Trusts
Ordinary shares in listed companies are traded in whole numbers of shares while Unlisted
Unit Trusts can trade in fractions of a unit. To accommodate this requirement the portfolio
manager allows you to enter fractions of a unit with up to four decimal places of precision.
When entering numbers of units for an unlisted unit trust you should always enter a decimal
point in the number - even if there are no digits after the decimal point - to indicate to the
program that you are generally wishing to work in fractions of a unit for that particular
security.
232
Fig 10.7
Income Transaction – Dividend
To access the Income Transaction dialog first highlight the required security in the list of the
main window and then click on toolbar button number 6 – Income Transactions.
(Alternatively simply Right Click on the desired security in the security list and this will
invoke the Income Transactions dialog for that security.)
Enter the Date for the dividend payment date if you are using a single date system or the
exdate for a dual date entry when the payment date is put in the Pay date field below. and
check that the Broker and Account are correct. The number of units of that security that you
currently hold should appear automatically but can be edited as required. Enter the rate per
unit for the dividend and the total dividend will automatically appear in its box but this can
also be edited if it needs to be modified.
If the dividend is totally Franked or totally Unfranked click the T button next to the
appropriate box and the total will be transferred to this location. If it is partially franked then
type the partial amount into one of the boxes and then simply click in the other box to
automatically insert the difference between the total and this value. Similarly, clicking in the
Imp tax credit box will automatically calculate the imputed tax credit using the Franking
rate shown. Click the Add button to append the dividend transaction to the list below.
Close the Income transaction dialog and you will see that this income information is
transferred to the summary for the main portfolio window.
233
Security Transaction – Sale
Fig 10.8
To sell a security you must access the Security Transaction dialog box again. Double click on
the security required in the list of the main portfolio window and the Security Transaction
dialog will appear. The parcel you attempt to sell must have a number of available units in
the Avail Units column of the list indicating that there are available units to sell. (If you have
checked Format/Colour profit/loss on the main menu then any parcels you have held for
over a year will be coloured blue.)
(This should not be confused with the figure in the No Units column which is the number of
units that were originally bought at the unit price in the Unit Price column. These numbers
can be different as a result of units having been sold or bonus units of the same security
having been allocated or capital reconstructions such as splits and issues adding or
subtracting units.)
Select the parcel you wish to sell from the list and then click the Sell Parcel(s) button. The
total number of available units in the parcel will be automatically displayed in the No of
units box. If you do not wish to sell the whole parcel then you may edit this to be less than
the number shown. Fill in the remainder of the information relevant to the sale in a similar
way to what you did for the initial purchase and click the Sell Parcel(s). The sale transaction
S will appear in the list below and both the Avail units in the column and the Total
available units box at the bottom will show zero.
If you had only sold part of the parcel then the available units in this parcel would have been
reduced to that remaining after the sale.
234
The other columns in the Security transactions list are fairly self explanatory. However, it is
necessary to explain that the Amount is simply the number of units times the unit price, the
+Capital is the net amount of extra capital contributed towards or returned from the parcel
subsequent to its initial purchase through either Calls for additional instalment payments or
Capital Returns or costs of options exercised in acquiring the parcel. The Gross profit shown
for sold parcels is actually the net profit and includes both buy and sell fees as these are
known. For unsold parcels the Gross profit assumes a sale of the parcel at the Last price and
includes the buy fees but not the sell fees. Sell fees for a single parcel cannot be reliably
estimated as the parcel in question might be sold together with many other parcels in a single
transaction and the apportioned sell fees for that parcel would be considerably less than if it
were sold separately.
Other fields displayed in the list are the number of days held and unique ID and Linked IDs
as well as the Annualised Growth Rate for that parcel calculated according to the procedure
discussed elsewhere in this chapter.
Fig 10.9
When you now exit the Security Transactions dialog box you will have completed a cycle of
the most common operations of the Portfolio Manager. If you now look in your Account
transactions form by clicking button number 5 on the toolbar you will see entries for the
purchase and sale that you have made in addition to the initial deposit of capital.
There will also be a figure in the Balance column that should correspond to the balance
actually in the account. If it does not then it is possible that there are one or more normal
bank transactions, unrelated to direct security transactions, that need to be entered. These
might include bank fees, interest, tax, capital deposits or withdrawals and so on.
235
Security Transactions – Short Sale
To short sell a security that you do not own then you should enter a purchase transaction of a
negative number of units. To cover your short sale you should select that negative parcel and
then click the appropriate sell button.
The Halt Button
In the portfolio manager the "Halt" toolbar button allows you to suppress automatic
recalculation of the portfolio following every entry. This is useful for portfolios with a very
large number of transactions where recalculation can take a long time. If you depress this
button it will cause recalculation to suspend while you are entering a lot of data. After you
have finished then toggle the button off again and recalculation will occur once rather than
after every new entry.
Reconciling Portfolio Accounts with your Bank Statements
It is easy to reconcile your bank accounts using the system of checkboxes. In the account
transaction dialog you will find checkboxes against the entry for each transaction. To
reconcile an account click on the row (but not the checkbox) corresponding to the date for the
final balance on the bank statement for your account (or the last entry before this date). Then
uncheck any boxes above this line for transactions that have not been processed yet as
indicated in your bank statement and of course also ensure that all processed items are
checked. Unchecking a box will prevent the associated amount being added to the running
balance. When you have done this for all outstanding transactions if the Balance shown on
the dialog at the cursor bar corresponds with the Balance shown in your bank statement then
your account reconciles to that date.
All transactions prior to the first in the list ("Format/Hide Transactions closed before date
range") are assumed to be reconciled (ie checked).
The balance shown in the Balance column at any date is obtained by adding all prior
transaction amounts that have been checked. However, the balance shown in the Balance edit
box at top right is the total sum of all transaction amounts up to the final entry irrespective of
their check state.
The position of the cursor (corresponding to the date you have last reconciled) is saved along
with any transactions that have been unchecked and therefore outstanding. However if you
move the cursor bar from the reconciliation row before exiting the dialog then it will reappear
at this new position when you re-enter the dialog.
Please note that the list will move bodily in the window space available so that the
reference cursor default position displays at the bottom of the window so that you can
see earlier transactions above that may need to be unchecked. The list may appear to
jump suddenly. Make sure therefore that you have first clicked the required cursor
default position by highlighting the row (not the checkbox) that you wish to appear at
the bottom of the window.
236
These cursor bar positions and outstanding transactions are saved for all your accounts and
will reappear whenever you access the Account Transactions dialog for that particular
account at a later stage.
By clicking the Date column header button you can toggle all displayed checkboxes to be
either all checked or all unchecked as follows: Positioning the cursor bar on a particular row
in the list and clicking the "Ck/Uck Date" column heading will check or uncheck all rows
below the cursor bar. Control clicking this heading will toggle checks for all entries at and
above the cursor bar.
Any new transactions or edited transactions will appear unticked.
If your Portfolio End Date is not set at today's date you will still be able to check and
uncheck boxes as above but these checks will not be saved. There is a warning message to
this effect that appears in this case when you access the Account Transactions Dialog.
There is a limit of 100 for the maximum number of unreconciled transactions that can be
saved for any one account. Later transactions above the 100 limit will be saved as checked.
When you back up a portfolio using "File/Backup a portfolio" the check and reconciliation
status is backed up at the same time.
Displaying the Calculated Portfolio
Portfolio Summary
On returning to the main Portfolio window you will see a summary of your Portfolio giving
1.
Total number of securities apportioned between sold and current
2.
Profits and income for the period specified by the start date and the end date. These
are apportioned between realised capital gains, dividends including imputed tax
credits, and net interest and cash management trust income for your accounts.
3.
Total portfolio value apportioned between the value of Equities and Cash balance of
all linked accounts.
The capital values and costs are displayed in several ways as shown in Fig 10.1. Holding
cost for the whole portfolio is the sum of the costs of the units, additional capital payment
less capital returns and all buy costs including brokerage and taxes. The Current value of
the units is the sum of the various numbers of each security times the current price of its
units.
The Net Paper profit is the sum of unrealised net capital gains for all securities currently
held at the End date and includes the estimated costs of disposal of all remaining parcels of
each security as a single transaction. The Net Realised Profit is the net profit that has
actually been received over the specified date range and includes all costs of acquisition and
disposal. The Total CG is the sum of these and represents the total capital gain income that
237
would have to be reported over the date range if all remaining securities were sold. All three
values are also expressed as percentages of the original holding costs of the units involved.
Capital gains in both cases are apportioned into discountable and non-discountable gains ie
those held for more than 12 months where the capital gains discount can be applied and those
held for less than 12 months.
There is also an item CG period that displays the increase in capital gains, both realised and
paper, that have accumulated over the period of the date range.
Finally, in the section Realised Profits & Income for the Period, dividends (including
imputation credits) are apportioned into assessable, ie taxable, those that are non-assessable
or not taxableand those that are tax deferred. Imputed Tax Credit for the whole portfolio is
specified separately at the lower right.
The securities you hold or have held are listed below in the table of the main window. The
columns from left to right record for each security the Date you acquired your first parcel,
security code, number of units/number of tranches, average cost, holding cost, last price, %
(or $) change in last price from previous close, current value, net paper profit, % net paper
profit, net realized profit, % net realized profit, total income for period including any
imputation credits, stop price, stop loss (amount you would lose if you sold at your stop
price) or stop float (amount you would lose from current value if you sold at your stop price),
the % this represents of total portfolio value, % that the value of this security holding
represents of your total security holdings or alternatively of your total portfolio, company
name and industry sector.
The listing can be sorted on any of the various columns by clicking on its heading. The last
column on which the main portfolio window has been sorted and its ascending/descending
ordering will be retained within and between sessions and portfolios. This sorting will also be
maintained in the printed report.
Final Four Columns in the Portfolio Summary
The final four columns in the main Portfolio Summary screen consist of two performance
indicators and two risk measures. The first two are the performance indicators Velocity and
Behaviour that have been discussed elsewhere and provide current values of these for each of
the securities you are holding. The next two columns are the risk based values of “%t” and “+
$K” (or “+ $”)
The column "%t" provides a measure of what the value of each of your current holdings
represents as a percentage of the average daily turnover in that particular stock. For liquidity
reasons you might wish to limit your exposure to no more than say 10% or 20% of average
daily turnover. We use as a proxy for average daily turnover the same 20 day average daily
moneyflow figure that appears on the F12 data box. The liquidity criterion is set (as a % of
average daily turnover) from the main menu under "Format/Set liquidity risk limit" where the
default is 10%. It can also be altered from the Risk Calculator. If the turnover limit is set to
zero then this criterion is ignored in the calculation.
The column "+ $K" on the other hand displays the additional value that can be added to your
existing holdings without violating any of your risk management limits. The figure is the
extra amount (expressed in $1000's) by which you can increase your holdings of any one
stock. It takes account of the four risk criteria for that stock viz: (i) Max % risk allowed on
238
total capital for each holding (ii) Limit on maximum holding size (iii) The liquidity risk limit
(as a % of average daily turnover) (iv) The limit imposed by the remaining cash available.
For smaller portfolios < $500,000 this column is headed "+ $" and gives the figure in single
dollars rather than thousands of dollars.
Make sure that your risk calculator settings are adjusted to values appropriate for your
circumstances. The +$K values for each stock should be regarded as a guide only and the risk
calculator itself should be consulted for each purchase. This is particularly important since
the former figure is based on the last traded price in your database which could be quite
different from the actual current price or the price you intend to pay. The limit imposed by
the cash available to purchase is taken automatically from your portfolio. If your cash
balance is below zero it is assumed that you are not using the account facility and this limit is
ignored. When your cash balance is getting low each successive additional purchase will alter
the +$K values for all other stocks.
Whenever there is a negative “+ $” value this indicates that one of your criteria has caused
the value of your holding to exceed the maximum allowed by your limits for that stock.
(Negative values can occur naturally when the price of a holding grows significantly
following initial purchase) Variables which affect this figure are:
maximum % of total capital allowed for any one holding:
total portfolio value
maximum % risk to total capital from any one stock (or all stocks if using Method
3):
buy price
stop price
current price
number of shares
current value of holdings
total portfolio value
maximum percent of average daily turnover allowed:
20 day average money flow
available cash balance
Criteria (iii) and (iv) are similarly also ignored in the Risk Calculator itself if the daily
turnover limit is set to zero or the available cash is negative respectively.
Values of the respective variables are automatically sourced from the risk calculator settings
as well as figures from elsewhere on the portfolio summary screen and several of these will
change from day to day.
Display Preferences
The column widths for the Portfolio Manager main summary screen can be adjusted and will
be maintained within and between sessions. To return the column widths to their default
values just click "Format/Reset column widths to default" from the main portfolio menu.
The following options for filtering and formatting the information to be displayed are
available by checking the appropriate items from the Format submenu.
239
Display all Sold securities will display all sold securities
Display all Unsold securities will display all unsold securities
Display all securities active in date range will display all those securities for which there
has been some activity within the specified date range. If you select only this option then
only those securities, where at least one transaction has occurred within the date range
specified, will be displayed. The transaction can be a
purchase/sale/dividend/renaming/merging etc.
Display tranches will display the number of remaining tranches (or parcels) for each
security under the No of Units column - eg 10,000/4 means that a total of 10,000 units are
held in four tranches.
Hide transactions closed before date range will allow you to suppress security, income and
trade transactions, as displayed in their respective dialogs, that have been closed out before
the start of the date range selected. This enables you to concentrate attention on the more
recent ones.
Display Alarm securities Only will show only those securities where the alarms are
currently activated.
Use Small font will compensate for large desktop fonts that prevent all information being
seen on screen
Use Wide ListViews will increase the size of the fields by 25% in the portfolio ListView
displays. This is useful if you have selected "Large fonts" on your desktop property options
and the listview columns are not wide enough to display the data.
Reset Column Widths to Default restores the width of the columns of the table to the
factory defaults
Colour Alarms enables you to colour the background of the rows of any alarmed securities
bright red or green depending on whether the alarm below or alarm above has been hit.
Colour profit/loss foreground will colour the font in any row black if security is in profit or
red if in loss. Parcels held for more than one year will be coloured blue in the Security
Transaction dialog.
Colour profit/loss background will colour the background of the row in pale green if in
profit or pale pink if in loss. Parcels held for more than one year will be coloured blue in the
Security Transaction dialog.
Audible alarm status will enable or disable the audible alarm
Choose Risk Calculator method to use of the three methods available
Display stock changes as $ not % on the seventh column of the table
Display %p as % of total portfolio inc cash displays the percentage of each security in the
securities list as a function of the total portfolio value including cash rather than as a function
of the equities value alone.
Display %r as % of security value/holding cost calculates the $risk as a percentage of the
individual security value rather than as a % of the total portfolio holding cost. If the “Stop
Loss/Float” toggle button is set to Stop Loss then the $risk is the Stop Loss and the security
value is the holding cost. If instead the “Stop Loss/Float” toggle button is set to Stop Float
then the $risk is the Stop Float and the security value is the security current value. If this
option is ticked then the status of the previous option above is irrelevant.
Suppress growth calculation speeds up the refreshing of the portfolio valuation by omitting
repeated calculation of growth values.
Suppress portfolio rebuild is also activated by the Halt toolbar button and allows you to
enter many transactions without recalculating between each entry.
Autofill trans/paydates for T+3 automatically sets Payment date 3 business days after the
transaction date.
240
Display profits & income after marginal tax will show the various portfolio values as
including the effects of taxation. The values displayed under this option should be regarded
as only an indication as the calculation is carried out using a simplified calculation involving
marginal tax rates and discount factors for capital gains.
You can chart directly from the Portfolio Manager by ticking the menu item Format/
Chart current ticker in charting window causes the portfolio window to be reduced in size
and positioned to the left allowing you to chart directly from the Portfolio Manager by
clicking the row for a particular security.
Encrypt sensitive documents allows you to encrypt any documents that you drag on to the
portfolio manager dialogs for storage. It requires Winzip to have been previously installed.
Checking Display all Sold securities and Display all Unsold securities together will display
all securities. Combining Display all Unsold securities with Display all securities active in
date range is very useful in that it displays all securities for which there has been activity
during the period plus any other securities which are still held at the end of the period even
though they may not have had any activity within the period.
Where a data file is not available for valuation of a security in the Portfolio Manager, the
relevant row will be highlighted in yellow on the main summary screen. In this case the latest
price will be taken as zero. If the data file is present and its latest price is actually zero then it
will also be highlighted in yellow.
The Chart securities or the X in the top right hand corner of the main portfolio window will
hide the portfolio manager and take you back to the charting functions of the program. The
Exit button on the main portfolio toolbar will exit the program entirely.
Setting the Date range
By default the date range displays from the first record in your portfolio to the current date.
You can change the date range for the portfolio summary and the three transaction forms to
limit it to say the previous financial year. The date range you set also determines the date
ranges for the printed reports.
If you wish to set it for a particular financial year then you can very quickly select the
appropriate dates from the drop down listbox to cover the financial year of interest.
Otherwise set the Start date and End date, independently, to what you require and then do
not forget to press Accept dates or hit the ENTER key otherwise the changes will not be
applied. These will remain in place until you alter them again. Pressing Reset dates will reset
the date range to the default covering the entire portfolio.
It is important to understand that you must not add any transactions or edit any transactions
with dates outside the current date range. This is important because if the date of the
transaction is out of the current date range it will not be visible in the listings. Consequently
you may not think that it has been accepted and you could enter it again leading to the
transaction being duplicated. If you attempt to do this you will be warned by the program.
The start date for each individual portfolio is saved within the portfolio file so the next time
that the portfolio is loaded it will display with that starting date. However, the end date is not
saved but it will revert to the current date to avoid problems where additional current
241
transactions might be added which would otherwise not be visible. You can, at any time,
reset the date range to be the full date range from the date of the earliest record to the current
date by pressing the Reset button on the main portfolio window.
Stop Loss
In the listing of all securities there is a column for the Stop price and the Stop loss. The stop
price is the price you have decided that if the security price drops to this level then you will
exit that position. The stop loss for each security is the amount you would lose if your stop
was hit and you exited the position at that price through your default broker. (Slippage may
increase the actual loss incurred.) Negative values indicate that you have moved your stop up
since purchase and that if stopped out you would exit with a profit. In this case you might
now consider it to be a “protect profit” stop. The Total stop loss is the sum of the stop losses
for all individual securities and is displayed, in both dollars and as a percentage, above under
the Total portfolio value. This is the amount you would lose (or if negative would be your
profit) if you were to exit all your positions at their stop prices through your default broker.
Stop loss levels are entered in the Alarm below box in the F2 Notepad discussed in greater
detail under Risk Calculator later in the chapter. Alarms are activated either on the last (or
close) price or on high and low depending on whether, in the F2 Notepad, the Alarm on
close check box has been ticked or not.
Stop Loss - Stop Float
"Stop Loss" we take to mean the difference in value between what you paid for a stock (or
portfolio of stocks), including transaction costs, and what you would receive, after
transaction costs, if you sold out the securities at their stop price levels.
"Stop Float" on the other hand we have defined to be the difference in value between what
your securities are currently worth, after any notional disposal costs, and what you would
receive, less any disposal costs if you sold out the securities at their stop price levels. It can
be thought of as the amount by which the current value of the portfolio "floats" above its stop
value and continuously changes with time.
At any time Stop Loss may be greater or less than Stop Float depending on whether prices
have declined or risen since the purchases were made. The Stop Loss value changes only
infrequently with time when the stop price changes while the Stop Float changes
continuously as current prices fluctuate.
The main Portfolio Summary window shows the portfolio Total Stop Float value underneath
that for the Total Stop Loss. In addition the Stop Loss values for individual securities listed
in the table underneath can be toggled to Stop Float values instead by clicking the button on
the Portfolio Summary screen "Show Stop Loss/Float".
Total Portfolio Stop Loss / Stop Float
The percentage risk for all securities combined - as a percentage of the securities value alone
- is shown in brackets in the panel above against the Total Stop Loss and Total Stop Float.
242
The % figure for Total Stop Loss is based on the % of the total holding cost value for the
portfolio. The % figure for Total Stop Float is based on the % of the total current securities
value.
However, if "Format/Display %p %r as % of Total Portfolio inc cash" has been ticked then
% Total Stop Loss is based on (total holding cost + cash) and % Total Stop Float is based on
(total current securities value + cash).
Stop Loss / Stop Float for Individual Securities
The main Portfolio Summary screen has an additional column - %r (percent risk) - following
the Stop Loss (/Stop Float) column that displays these dollar values for each security as
percentages of either the total current portfolio value (excluding or including cash) or the
value of the individual security itself.
That is the percent risk column (%r) following the Stop Loss ( / Stop Float) column can
display the Stop Loss or the Stop Float dollar values for each company holding expressed as
a percentage of the holding cost or the current value respectively of each individual security
rather than those of the total portfolio itself. To do this you need to tick the option:
"Format/Display %r as % of security value/holding cost".
That is it will show either (Stop Loss/Holding Cost) or (Stop Float/Current Value).
If "Format/Display %r as % of security value/holding cost" is unticked while
"Format/Display %p %r as % of Total Portfolio inc cash" has been ticked then % Stop Loss
is based on (total holding cost + cash) and % Stop Float is based on (total current securities
value + cash) as in the section above.
Printing Reports
There are nine basic reports that can be generated from within the Portfolio Manager. Some
of these have the option to display both by individual security or by all securities.
243
Portfolio Summary Report
Fig 10.10
The main portfolio summary can be printed from Reports/Portfolio summary on the main
menu or by clicking toolbar button no 8 Print Security Summary. A preview screen will
appear that can be perused by pressing the PgUp and PgDn keys, the up and down arrow
buttons 1 and 2 on the toolbar of the preview screen or by rolling the mousewheel. Pressing
the third toolbar button Print report will send the report to the printer. A tab delimited file of
this summary - pfolio.rpt - is created in the WORKING\PFL folder. This file is suitable for
importation into a spreadsheet program like Excel.
This report provides the information displayed on the main portfolio summary window.
Security Transaction Reports
You can get a report on security transactions for the currently selected security by choosing
Reports/Trans selected security. If you want similar reports that include dividends or all
transactions, but for all securities, then choose Reports/Transactions all.
There is also a Print button on the Security transaction form that will print this same report
for the currently selected security.
Dividend and Income Reports
You can get a report on dividend and income transactions for the currently selected security
by choosing Reports/Div selected security. If you want similar reports that include
dividends and income for all securities, then choose Reports/Dividends all – date order.
244
For a date ordered report or Reports/Dividends all – alpha order for an alphabetically
ordered report.
There is also a Print button on the Income transactions form that will print this same report
for the currently selected security.
Account Transaction Reports
An Accounts statement is available from the Reports submenu for any of your accounts.
Selecting this option will bring up the Accounts transaction form that we saw above and by
selecting the account you require from the drop down list and pressing the Print button on
the form the preview window will appear with the report for the chosen account. This report
can be printed by clicking the third toolbar button Print.
Capital Gains Report
For each parcel of each security this report lists the disposal transaction and its disposal
proceeds amount together with the disposal costs. Directly below is shown the original
number of units in the first transaction that resulted in the acquisition of the parcel - portion
(or all) of which has been disposed of in the line above. The acquisition costs, adjusted
according to the historical events affecting the whole parcel, have been apportioned
depending on the disposed proportion of the complete parcel. The first transaction referred to
above could have been the purchase or acquisition of options that were later exercised but
more usually it will just be a simple purchase.
Days held and Capital Gain or Loss are indicated in the last two columns. The summary at
the end accumulates Capital Gains which are discountable (held more than 1 year) and nondiscountable (held less than 1 year) and Capital Losses.
This report can be done by security (Capital gains by security) or accumulated into a single
report for all securities (Capital gains report all).
Traders Closing Stock Report
This report gives valuations of stock at the beginning and end of a specified period based on:
1) Current value
or on
2) Original cost of the units (excludes tax and charges)
Accessed from Traders closing stock.
245
Traders Sales and Costs Report
This option provides a summary of Sales and Costs of Sales that have occurred in a given
period (eg a financial year) and includes capital contributions in and out. The report can be
done by security or accumulated into a single report for all securities.
Accessed from Sales and costs by security or Traders sales and costs respectively.
Miscellaneous Income and Expenses Report
This report summarises other income and expenditure including interest, cash management
trust income and expenses, GST, bank fees, other tax and income.
Accessed from Miscell income and expenses.
Profitability of Trades Report
Profitability of Trades lists all individual trades - either closed within the specified period or
still held open at the end of the period. Measures given include Net Profit (after buy and sell
fees), % net profit; days held and % Annualised Growth Rate.
The definition of Annualised Growth Rate is similar to that given for the total portfolio (as
explained at the end of this chapter) but is simpler in that only the net capital growth for a
single security needs to be calculated. The % Annualised Growth Rate is also shown withing
the listing for individual trades in the Security Transactions Dialog.
Accessed from Profitability of Trades.
Portfolio Statistics
This report provides important performance statistics on your portfolio for both investors and
traders alike:
Total numbers of trades, average trades per month, average days held, number of securities,
average additional securities per month,
Number of wins, number of losses, percentage wins, average win, average loss, average net
gain, win/loss ratio, total win/total losses ratio, Expectancy,
Portfolio growth rate (% pa compounding), current % drawdown, average % drawdown,
maximum % drawdown, MAR ratio, VAR ratio, average % exposure.
For the final group you must have a current portfolio equity curve file already generated.
Values are shown for two separate cases. The first includes trades that have been closed
within the date range currently set for the portfolio as well as those still open at the end. The
second case includes only the trades closed within this period and ignores those still open.
List of Registered Brokers
The list of details for the registered brokers can be printed from the Print button on the form
for the registered brokers.
246
List of Registered Accounts
The list of details for all the registered accounts can be printed from the Print button on the
form for the registered accounts.
Printing Batches of Reports
It is usual for users to print out only a selection of the available reports and this selection
may not change much over time. From the main menu, clicking Reports/Print report batch
will allow you to select those reports that you wish to print without having to manually
process each one individually. Your selection is saved and will appear again next time you
choose this option. Either click Close to exit the dialog after making your selection or Print
to print all reports requested. Make sure that you have chosen a suitable Start date and End
date on the main portfolio summary before commencing printing a large number of reports.
Selecting Accounts from this dialog will print out reports only for those accounts that have
had transactions in that portfolio.
Exporting Reports to Other Programs
Whenever a report is displayed on screen an appropriately named CSV file of that report is
generated and stored in the EXPORT sub folder of the WORKING folder off the main
WINIT program folder. This file is in a suitable format for importing into spreadsheet
programs such as Excel.
Exporting Selected Columns from Portfolio Summary and Accounts to Excel
Portfolio Summary
You can export to Excel selected columns from the Portfolio Summary listing. You can
choose any number of columns in any order that you wish and you can choose to include or
exclude the column headings. The default is to export all columns in order together with
headings.
If you wish to customise the columns to be exported select "Edit/Configure Summary CSV
export" from the main portfolio menu and follow the prompts.
To generate this file you just need to press the Print button on the main toolbar to create it. If
you do not want a printed report as well then just back out of the print preview screen that
appears. The file will appear in the "WORKING\EXPORT" folder as
PfolioSummaryLV.CSV that can be directly imported into Excel.
Account Summaries
The account transactions corresponding to your bank statements can similarly be exported
using the print button on that dialog box with the file name AccountLV.csv. Any transactions
247
that are checked will be indicated by a "#" character preceding the first column. These checks
are used to assist in reconciling your portfolio accounts with your bank statements.
If you wish to customise the columns to be exported select "Edit/Configure Account CSV
export" from the main portfolio menu and follow the prompts.
Automatically Importing Transaction Lists from Brokers
You can import, into your portfolio, transactions listed in a CSV file that you can download
from your broker. Specifically you can automatically import BUY transactions from such a
CSV file into a new or existing portfolio. This can be achieved under "File/Import
transactions" from the main Portfolio menu.
This facility is particularly useful when starting from scratch to enter into the Portfolio
Manager a portfolio that may have been in existence for many years. For example, decades of
transactions can be imported within a few seconds, without typographical errors, that would
have otherwise taken many hours to enter manually.
Unfortunately there is a conceptual problem with SELL transactions in that any one Sell
transaction needs to be linked specifically to one or more individual BUY transaction parcels.
This is a matter of arbitrary choice for the user and cannot really be done automatically.
Furthermore a list of BUY and SELL transactions from your broker only provides part of the
total holdings for any one security. Therefore the list of transactions for any one security may
include SELL orders for more units than the total units available from the BUY orders in the
list. This situation can arise as a result of there being more units actually held than would be
indicated just by the sum of the number of bought units listed in the broker file. Examples of
such additional unlisted acquisition transactions that will never appear on your broker's list
include the following:
IPOs
Exercising of rights entitlements
Exercising of options/warrants
Dividend reinvestment
Splits
Reconstructions
Merging Code changes
Final payments on Calls (leading to code change from say TLSCA to TLS)
The CSV file must have the same format as the transactions CSV file "contractnote.csv"
downloadable from the Commsec site:
Contract Number, Trade Date, Buy / Sell, Stock Code, Units, Average Price, Brokerage, Net
Proceeds, Settlement Date, Contract Status
eg:
48120000 ,21/12/2014 ,B ,XYZ ,16000 ,4.920000 ,78.720000 ,78798.720000 , 24/12/2014
,Confirmed
248
If you are using a file from another broker with a different format then you can massage the
data in the columns of that file to conform to the Commsec format above. Also note that the
Commsec format consists of two header lines that are ignored during the import process so if
you are using a file other than one from the Commsec site then ensure that two dummy lines
exist at the top of the file before the actual transactions start. Furthermore the Commsec
generated files have the most recent transactions at the top ie in descending date order.
However, this does not need to be changed if the records are listed instead in ascending date
order as the program will allow you to specify the actual order during the import process.
To import transactions from a CSV file the process is as follows:
1) Back up an existing portfolio if this is the one you wish to import into. (This safeguards
against any unforeseen problems arising)
2) If necessary massage the file to conform to the Commsec standard outlined above if the
file is not directly from the Commsec site.
3) Delete any transactions from the file that may have already been entered into the portfolio
to avoid duplications. Sale transactions can remain in the file as they are ignored.
4) Place the file into the WINIT folder.
5) Select "File/Import transactions" from the main menu
6) Enter the File name eg "contractnote.csv"
7) Enter the number of the relevant Broker from the portfolio file
8) Enter the number of the relevant Account from the portfolio file
9) Click OK
10) Then specify whether the dates of the transactions listed in the file are in ascending or
descending order.
After the BUY transactions have been imported then other transactions such as the SELL
transactions and any of the non-listed acquisition transactions specified above should be
entered manually in the date order in which they occurred.
Finally non-security account based transactions like interest received, bank fees, expenses,
inter-account transfers etc should be entered into the Account Transactions dialog.
249
How to Enter Some Common Transactions
The following are a number of common transactions together with a list of step by step
instructions on how to enter them. For this purpose you will need to access either the
Security Transaction form (toolbar button number 3 for a security not yet registered in the
portfolio or toolbar button number 5 otherwise) or the Income Transaction form (toolbar
button number 6) or both. Alternatively, double Left Click on the security required in the
listing to invoke the Security Transaction form or a single Right Click to bring up the
Income Transaction form.
IMPORTANT
The instructions below are intended as a general guide only. The
precise method by which each of your transactions should be entered
could depend on your individual circumstances and whether there
have been any changes in tax regulations. We recommend that you
consult your accountant or licensed tax advisor for definitive guidance
in this process.
Entering dates for the transactions listed below
As discussed in the previous section Use of the Account <suspense account> you can either
use a single date system by completing only the transaction date field and leaving the
payment date field blank or you can utilise both fields. If you are using the dual date system
the transaction date for dividends, capital returns and call payments is the exdate on which
the securities change value. The payment date is the date on which the transfer of funds is
recorded in your bank account. For purchases and sales the payment date “T+3” is usually
three working days after the transaction date.
1. Purchasing the first parcel of a new security
As we have seen in the example above you should invoke the Security Transaction form by
pressing toolbar button number 3 and enter the required information. Then press the Add
Transaction button and this security code will be registered in the current portfolio and the
purchase transaction will be recorded in the list box at the bottom of the form.
2. Purchasing a subsequent parcel of a security
As this security will already be registered in your portfolio you should first select the relevant
security in the listing below and then invoke the Security Transaction form by pressing
toolbar button number 5. Simply double clicking on the security achieves the same result.
Then enter the required information. Press the Add Transaction button and the purchase
transaction will be recorded in the list below.
3. Receiving shares from a demutualised company
Where a company demutualises you can receive shares for no payment. However, for
taxation purposes you are deemed to have purchased them at a price set by the Taxation
250
Office. You must therefore enter them into your portfolio as a purchase at the deemed price.
Since the security has only just come into existence you will need to enter the information as
described in 1. above. However, choose the Account as <no account> since there is no
physical transfer of funds and the Trans date as the deemed date of acquisition.
4. Bonus issues of shares of the same security
From the Security Transaction form choose Bonus share issue from the Transaction Type
drop down box. Enter the Trans date and the No of units received.
When the portfolio is accumulated these bonus shares will be apportioned amongst those
parcels entitled to participate to increase their available units because the acquisition dates of
the new bonus shares are assumed to be the same as the original share parcels that generated
them.
5. Bonus issues of shares in another company (in specie)
These are handled as a purchase of new securities and they are therefore entered as in 1. or 2.
above. The purchase price will be either zero or as deemed and the acquisition date is as
deemed. This information can usually be obtained from the company or sometimes from the
Taxation Office
6. Bonus issues of rights or options
Where rights or options are given for no payment they are deemed to have the same date of
acquisition of the original shares that generated them. They are entered as purchases as in 1.
or 2. above at no cost.
You should enter a transaction date that is the same as the date of acquisition of the original
parcel of shares that generated the options. Since several original parcels may be involved
with different acquisition dates then the acquisition transaction of the options might have to
be entered as a number of separate transactions corresponding to the number of original
parcels each with a different transaction date.
7. Purchased rights or options
Where rights or options are purchased their date of acquisition is taken as the purchase date.
They are entered as normal security purchases as in 1. or 2. above at the price paid.
8. Dividend reinvestment
A dividend reinvestment is considered as a receipt of a dividend followed by a purchase of
the securities at the specified dividend reinvestment price.
251
Dividend reinvestment is entered via the Income Transaction dialog by putting a tick in the
Divd Reinv checkbox. You will note that the account automatically changes to <no
account> and is greyed. Fill in the appropriate information for the dividend and then click
OK.
The Securities Transaction dialog will then be thrown up with much of the relevant data
already entered. Complete the information including the number of shares allotted and the
price per unit before accepting with Add transaction.
The resulting share purchase is linked back to the income transaction which is automatically
deleted if the securities purchase transaction is deleted.
9. Making a call or instalment payment on contributing shares
In the Security Transaction form choose Call/additional payment from the Transaction
Type drop down list. The number of available units will appear in the No of units box. If
necessary change this to the number of units to which the call will apply and enter the call
payment per share in the Price per unit box. Fill the Trans date, and Total paid and any
other boxes you wish. Then press Add Transaction to record the transaction.
When the portfolio is accumulated the additional payment will be apportioned amongst those
parcels required to participate and will increase the amount listed in the +Capital column at
the bottom of the form. The acquisition date of the shares is taken to be the date of their
original purchase but the call payments are indexed from the date of the call payment if
indexation is chosen as the method for calculating the cost base.
When the final call payment is made the shares become fully paid and change their codes and
names to reflect this fact. Both TLSCA and TLSCB became TLS. Their names and codes
must be changed to reflect this and should be carried out as a Merger as described in 13.
below.
10. Receiving a capital return
In the Security Transaction form choose Return of capital from the Transaction Type drop
down list. The number of available units will appear in the No of units box. If necessary
change this to the number of units to which the capital return will apply and enter the capital
return payment per share in the Price per unit box. Fill the Trans date, and Total paid and
any other boxes you wish. Then press Add Transaction to record the transaction.
When the portfolio is accumulated the return of capital will be apportioned amongst those
parcels required to participate and will decrease the amount listed in the +Capital column at
the bottom of the form. The acquisition date of the shares is taken to be the date of their
original purchase but the return of capital is indexed from the date of the capital repayment if
indexation is chosen as the method for calculating the cost base.
252
11. Short Selling
To short sell a security that you do not own then you should enter a purchase transaction of a
negative number of units. To cover your short sale you should select that negative parcel and
then click the appropriate sell button.
12. Receiving Dividends
In the Income Transaction form enter the Date for the dividend and check that the Broker
and Account are correct. The number of available units presented in the units box can be
edited if required. Enter the rate per unit for the dividend and the total dividend will
automatically appear in its box but this can also be edited if it needs to be modified.
If the dividend is totally Franked or totally Unfranked click the T button next to the
appropriate box and the total will be transferred to this location. If it is partially franked then
type the partial amount into one of the boxes and then simply click in the other box to
automatically insert the difference between the total and this value. Similarly, clicking in the
Imp tax credit box will automatically calculate the imputed tax credit using the Franking
rate shown. If any Withholding tax has been taken from the dividends received this amount
can be entered in the appropriate box. Click the Add button to append the dividend
transaction to the list at the bottom of the form.
A similar procedure is used for entering distributions from trusts and funds and foreign
income in the boxes corresponding to them.
13. Adjusting for a reconstruction – split or consolidation
From the Security Transaction form choose the Reconstruction button at the base of the
form. A box will appear in which you will enter the last date for the reconstruction and the
total number of shares before reconstruction and the total number of shares you hold after the
reconstruction. These numbers should only be from the parcels that are participating in the
reconstruction.
Fig 10.11
Adj by reconstruction will appear automatically in the Transaction Type dropdown list and
the Transaction date will be completed and the extra units or deficit of units will appear
under No of units. Then press Add Transaction to record the transaction.
253
When the portfolio is accumulated these additional shares or deficit of shares will be
apportioned amongst those parcels participating in the reconstruction to change the number
of their available units. The acquisition dates of any new shares are assumed to be the same
as those of the original share parcels that participated in the reconstruction.
14. Merging companies by scrip for scrip rollover
From the Security Transaction form choose the Merge button at the base of the form. A box
will appear in which you will enter the date for the merger, the ASX code of the parent
company and the total number of shares you have been issued in the parent company as a
result of the merger. This form should only be used for mergers that are entitled to scrip for
scrip rollovers.
Upon acceptance an Exchanged by rollover – E transaction will appear in the list at the
bottom of the Security Transaction form and if you did not have the parent company
previously registered in your portfolio a new record for the parent company will appear in the
list of the Portfolio main window. Accessing its security transaction form will reveal a
Merger R/O acquisition – M transaction has been generated by the system.
The acquisition dates for the new units are assumed to be the same as those of the original
share parcels that participated in the rollover.
Fig 10.12
254
15. Demerging of securities
Demerging of companies involves the splitting of one company into two or more entities.
The spinoff or offspring company takes a certain percentage of the value of the original
company leaving the parent company with the remainder. The demerger procedure followed
from using this form assumes that the demerger has been granted rollover relief allowing you
Fig 10.13
to defer your CGT obligation until a later CGT event happens to your original or your new
shares or units.
Enter in the boxes provided the code of the offspring company, the total number of units you
have received in it, the percentage of the cost base of the parent company that will be
assigned to the offspring company and the date of the demerger.
Pressing Change will cause the system to generate in the original company an Unwind R/O
demerge transaction U and an Offspring demerge acquisition transaction O in the new
company.
16. Change of Name
A change of company code and name is performed from the SecurityTransaction form. There
are two ways of doing this. In the first method click the Change name button at the bottom
of the form and the name change will be performed as though it was a separate transaction
involving a merging or rollover of the old company code into the new company code as in 12
above. The advantage of this method is that it will not involve any irreversible changes in
your security file by avoiding modifications to any of the previous transactions. This
maintains the integrity of the portfolio as an accumulation of independent historical
transactions. However, any completed transactions prior to the name change will be retained
255
under the old name and code. Any remaining parcels will have their names and codes
changed to the new ones. To enable valuations of the portfolio for past dates you must retain
Fig 10.14
the appropriate old files in your database under the old codes. Enter the new code and date of
the change and press the Change button and the system will generate a Ticker change
disposal transaction T under the original code and a Name change acquisition transaction N
under the new code.
The alternative way to change the name and code is to access the button to the right of
Ticker symbol in the Security Transaction form. Just type in the new code and any previous
security transactions in the portfolio involving the old code will have their code changed to
the new ticker. This is the only operation in the Portfolio Manager that may be irreversible. It
is not recommended that you use this method except for very specialised applications such as
when the ASX reuses a code and you have to rename the original to something different in
all previous transactions
17. Selling a single parcel
From the Security Transaction form select the parcel you wish to sell from the list and then
click the Sell Parcel(s) button. The total number of available units in the parcel will be
automatically displayed in the No of units box. (If you have checked Format/Colour
profit/loss on the main menu then any parcels you have held for over a year will be coloured
blue.) If you do not wish to sell the whole parcel then you may edit this to be less than the
number shown. Fill in the remainder of the information relevant to the sale and click the Sell
Parcel(s) button. The sale transaction S will appear in the list at the bottom of the form.
If you had only sold part of the parcel then the available units for that parcel would have been
reduced to the number remaining after the sale..
18. Selling several parcels of the same security
If you wish to sell more than one parcel in the one transaction then in the Security
Transaction form select all the parcels you wish to sell by holding the Ctrl key down while
clicking on each of the parcels in the list that you wish to sell. (If you have checked
Format/Colour profit/loss on the main menu then any parcels you have held for over a year
will be coloured blue.) Then click the Sell Parcel(s) button and enter the information relevant
to the sale in the form. The number of units shown will be the total available units in all the
parcels selected and if you wish to sell fewer units than shown there then edit the number to
reflect this.
256
When you press the Sell Parcel(s) button again to register the sale you will be asked, if you
have selected fewer than the total number available, whether you wish to sell on a first in first
out basis (FIFO) rather than a last in first out basis (LIFO) or whether you wish to sell a
prorate number of units from each parcel.
The appropriate number of sale transactions will appear in the list below and if fewer than the
total available have been sold the available units after the sale will be reduced to the number
remaining after the sale. The total sale costs will be apportioned over all parcels sold.
19. Selling all parcels of the same security
If you wish to sell all available parcels in the one transaction then in the Security Transaction
form click the Sell All Parcels button before entering the remaining information relevant to
the sale in the form. The number of units shown will be the total available units in the
portfolio and this is greyed and cannot be edited.
After pressing the Sell All Parcels button again to register the sale you will see the
appropriate number of sale transactions appear in the list below. The total available units for
all parcels sold will be displayed as zero. The total sale costs will be apportioned over all
parcels sold.
20. Exercising a single parcel of rights or options
To exercise options or rights open the Security Transaction form and select Xercise Options
from the Transaction Type drop down list. This action will cause buttons to display Exs
Parcel(s) and Excs All Parcels.
From the Security Transaction form select the parcel you wish to exercise from the list and
then click the Excs Parcel(s) button. The total number of available units in the parcel will be
automatically displayed in the No of units box. If you do not wish to exercise the whole
parcel then you may edit this to be less than the number shown. Fill in the remainder of the
information relevant to the transaction and click the Excs Parcel(s) button again. The
exercise transaction X will appear in the list at the bottom of the form.
If you exercise only part of the parcel then the available units for this parcel will be reduced
to the number remaining after the exercising.
21. Exercising several parcels of rights or options
To exercise options or rights open the Security Transaction form and select Xercise Options
from the Transaction Type drop down list. This action will cause buttons to display Exs
Parcel(s) and Excs All Parcels.
To exercise more than one parcel in the one transaction then in the Security Transaction form
select all the parcels you wish to sell by holding the Ctrl key down while clicking on each of
the parcels in the list that you wish to exercise. Then click the Excs Parcel(s) button and
enter into the form the information relevant to the transaction. The number of units shown
257
will be the total available units in the parcels selected and if you wish to exercise fewer units
than shown then edit the number to reflect this.
When you press the Excs Parcel(s) button again to register the transaction you will be asked,
if you have selected fewer than the total number available, whether you wish to exercise on a
first in first out basis (FIFO) rather than a last in first out basis (LIFO) or whether you wish
to exercise a prorate number of units from each parcel.
The appropriate number of exercise transactions X will appear in the list below and if fewer
than the total available have been exercised the available units for the final parcel will be
reduced to the number remaining after the exercising. A further transaction From exercised
options - F is generated by the system for the shares acquired as a result of the exercise. This
can be viewed in the Security Transaction form after selecting the code for that security.
The total exercise costs will be apportioned over all parcels exercised.
22. Exercising all parcels of rights or options
To exercise options or rights open the Security Transaction form and select Xercise Options
from the Transaction Type drop down list. This action will cause buttons to display Exs
Parcel(s) and Excs All Parcels.
If you wish to exercise all available parcels in the one transaction then in the Security
Transaction form click the Excs All Parcels button before entering the remaining
information relevant to the transaction in the form. The number of units shown will be the
total available units in the portfolio and this is greyed and cannot be edited.
After pressing the Excs All Parcels button again to register the transaction you will see the
appropriate number of exercise transactions X appear in the list below. The total available
units for all parcels exercised will be displayed as zero. A further transaction From exercised
options - F is generated by the system for the shares acquired as a result of the exercise. This
can be viewed in the Security Transaction form after selecting the code for that security.
The total exercise costs will be apportioned over all parcels exercised.
23. Stapling of Securities
Because of the complex nature of stapled securities you should seek advice from a
professional appropriately licensed to provide any accounting and taxation guidance you may
require. The notes under this section are provided only as a very general indication as to the
manner in which certain transactions might be handled in the Portfolio Manager if specific
circumstances apply.
In recent years it has become popular to “staple” together securities of different types eg
ordinary shares, trusts and other security types. Although each component still retains its
identity there is no explicit valuation that is easily obtainable for these individual components
as only the combined entity trades as a listed unit.
258
However, it is necessary to continually track each component security into the future as far as
its cost base is concerned and on sale consider it as a sale of separate component securities.
Because ongoing valuations for the individual component securities will not be available the
combined total for the stapled entity will need to be tracked in addition to the cost bases of
the components.
Although it is not possible to give a general indication for all stapled securities for all
investors it is possible that under some circumstances it might be possible to handle the
portfolio transactions for the process of stapling as follows:
Since there can be no valuations available for the individual components, all valuation would
be attributed to the combined stapled entity S and all costs and capital changes attributed to
the individual components say A, B and C. The capital profits would be calculated from
combining the value of the stapled entity S with the costs and capital changes of the
components A, B and C.
Information might be entered into the portfolio manager as follows:
a)
Appropriate transactions would be entered for the acquisition of the stapled entity S from
one or more of the component entities A, B and C if any of these were held at the time of
stapling. If instead the securities S were bought as already stapled units on the market
then all acquisition costs would have to be apportioned between the individual
components A, B and C only - according to the guidelines provided by the tax office.
(For example, the apportionment might be done on the basis of their respective net
tangible assets) In neither case are acquisition costs to be attributed to the stapled
securities S. Purchase or acquisition transactions for A, B and C where required would
need to be entered.
b) The required number of stapled entity units would then be purchased at zero cost from
<no account>.
c)
If data files exist in the database for A, B and C they would need to be edited to enter a
value of zero price on the exdate for stapling so that no value will be attached to them
during any subsequent portfolio valuations.
This would allow all costs to be attributed to the components A, B and C and all value
attributed to the stapled entity S for any portfolio valuations that may be done.
On sale the appropriate number of stapled securities S would be sold at zero price (making
zero gain on the combined entity S) and the same number of each of the component securities
A, B and C would be sold - apportioning the proceeds amongst these components according
to the guidelines from the tax office.
259
Tips on entering a long term portfolio
If you are entering from scratch many transactions for a portfolio that you may have held for
a long period of time then the tax rates and brokerage rates may have varied at least once
over that period. It is therefore more efficient to modify the tax rates in the portfolio from the
Format/Set Portfolio tax rates as explained above whenever they change while inputting a
long historical sequence of transactions rather than continually modifying the number that
automatically appears on the transaction form.
You should also save a rotating set of backups of the portfolio file at frequent stages in its
construction in the manner discussed later under Backing up your portfolio.
Editing and Deleting Transactions
Transactions may be edited or deleted. However, care must be taken when changing
information within a security transaction in the Security Transaction form so that internal
inconsistencies are not introduced into the portfolio. Therefore there are checks on editing or
deletion of transactions that determine whether there are other transactions that depend on the
ones you are attempting to edit or delete However, it is usually quite safe to edit purely
informational fields such as Company name, Notes, Contract no or Expiry Date. Other fields
such as Broker and Account can usually be altered quite safely. In other cases it is safer to
delete security transactions you wish to modify and then re-enter the information to ensure
that any internally generated transactions are regenerated to be internally consistent with the
new information.
Transactions within the Account Transaction and Income Transaction forms on the other
hand can usually be edited quite safely.
To edit any particular transaction, access the relevant transaction form and highlight the
particular transaction to edit. Then press the Edit button. (Alternatively, simply double
clicking on the transaction required will take you straight to edit mode) When you have
finished modifying the transaction press the same button again (that has now been renamed
Accept) to accept the changes.
You can also delete all records for a particular security from the main portfolio window by
pressing toolbar button number 4. This should only be done for securities that are not linked
in any way to other securities within the portfolio.
It is possible to turn off the internal checking of editing and deletion by accessing the option
from the main menu under Edit/Allow unrestricted editing. This will enable you to do
almost anything with any record. However, before you make any such changes to your
portfolio under these conditions you should back it up using File/Backup portfolio from the
main menu or preferably by making a backup of it on a removable disk or CD. You should
also switch this option back immediately you have completed the unrestricted editing.
It is important to remember that you must not add any transactions or edit any transactions
while the date range is set to other than the default covering the entire portfolio.
260
Other Features
General Formating
Under the Format submenu you can enable or disable the Audible alarm status,
Risk Calculator
The Risk Calculator is a utility to facilitate your money management requirements and is
accessed from the main portfolio menu under Utilities/Risk calculator or by clicking toolbar
button no 13. It is also accessible from the toolbar on the main charting window. This utility
calculates the maximum number of shares of a particular security you can buy in order to
limit your risk for that parcel to a specified percentage of the total value of the investable
funds in a given account as well as several other criteria. It is based on the methods described
by Colin Nicholson in his book Building Wealth in the Stock Market to be found in the
Reading list at the end of this manual as well as in his previous writings.
The risk calculator takes account of up to four risk criteria that will limit the maximum size
of the holding of any single stock viz:
1.
Maximum % risk allowed on total capital arising from each holding
2.
Limit on the maximum size of each holding as % of total capital
3.
The liquidity risk holding limit (as a % of average daily turnover for that security)
4.
The limit imposed by the remaining cash available
Maximum % Risk allowed on Total Capital from any Security
Three Schemes are available:
Three risk management schemes are provided as options in the Risk Calculator. The first
method is based on the scheme published by Colin Nicholson in his books "The Aggressive
Investor and "Building Wealth in the Stock market" while the second method was his
original version which he published some years prior to the release of these books. The third
method is in some senses an amalgamation of these two previous methods. The differences
between the three options are in the price increment representing the risk per share arising
from any existing units already purchased prior to the new units. This figure is necessary to
enable calculation of the contribution to the total risk posed by any existing units.
In each method this price increment representing risk in existing units is given by:
For method 1:
currentprice - sellstopprice
For method 2:
MAXIMUM(averagepricepaid - sellstopprice,0)
For the method 3:
MAXIMUM(currentprice,averagepricepaid) – sellstopprice
261
In addition, for method 3, we need to specify the maximum allowable risk on the TOTAL
portfolio rather than on each individual position as with the previous methods. If this is say
16% then for each parcel to be purchased the Calculator multiplies the maximum total
allowable portfolio risk, say 16%, by the percentage position size say 2%, 4% or 6%. For
example for a maximum position size of 6% we would have a total risk of 16% x 6% =
0.96%. An average position size of 6% would allow ~16 stocks to be purchased.
If it is desired to have say 32 stocks instead of 16 with the same total portfolio risk then the
average position size will be ~3% which gives a total risk per position of 16% x 3% = 0.48%.
That is, it adjusts automatically for different numbers of stocks and different position sizes.
To set the Risk Calculator Method you wish to use you can select from the main portfolio
menu "Format/Choose Risk Calculator method to use".
If choosing method 3 you will need to specify the TOTAL portfolio percentage risk, say 8%,
16%, or whatever that you wish to employ against "Maximum % Risk to total capital from
ALL positions" on the Risk Calculator dialog box. For the other methods it is the "Maximum
% Risk to total capital from any SINGLE position". You will also have to set the parcel sizes
eg say 2%, 4% and 6% or 1%, 2% and 3% or whatever to reflect the maximum number of
stocks you anticipate will comprise the whole portfolio. Method 3 is now the default as it
addresses certain issues arising from use of the other two methods.
Limit on Maximum size of any Holding
The maximum size of any holding is determined by the total portfolio value times the
percentage limit that you have set for the particular parcel in question.
Liquidity Limit
The risk calculator enables you to include the risk posed by stocks with low average daily
turnover and also by the actual cash balance available in your accounts that are used for
purchases. You can set globally for all stocks the percentage of daily turnover that you do not
wish to exceed for the total position in each stock. The default is 10% but if you set it to zero
then the test for this limit is ignored.
Limit from the Remaining Cash available
The limit imposed by the cash available to purchase is taken automatically from your
portfolio. If your cash balance is below zero it is assumed that you are not using the account
facility and the test for this limit is ignored.
262
IMPORTANT:
This calculation excludes the additional costs associated with
brokerage, charges, tax and slippage. These will have the effect of
increasing the risk levels above the nominal values calculated. Note that
this calculator is only applicable to long trades.
First select the security of interest from the list on the main window of the Portfolio
Manager. If it is not there already just select any one that is in the list and we can change the
security code later.
Before the Risk Calculator can be used for any security we need to have entered a stop loss
price for the security in question in the Alarm below box of the F2 notepad – button 9 of the
toolbar. If you have not done so you will be prompted later when you attempt to access the
calculator. If your database is in cents rather than dollars you will have to enter this value in
cents ie 835 rather than 8.35. The F2 notepad manages the alarms on your charts which
display in either cents or dollars depending on how your database is kept. The portfolio
manager itself operates entirely in dollars.
You should now access the Risk Calculator through the main portfolio menu Utilities/Risk
Calculator or click the button on the main toolbar. On the dialog that appears, the Account
size will already be filled in with the total value of the portfolio in question.
You should next specify a value for Maximum % risk of total capital per trade or leave it
at the default of 1%. If you are using Method 3 it is you will need to specify a value for
Maximum % risk of total capital from all positions or leave it at the default of 16%.
263
Fig 10.15
To further limit your risk you cap the size of any one position to a given percentage of your
total portfolio then enter this percentage value in the Posn size % boxes. Colin Nicholson
suggests building a position in three stages and the maximum size of your total position in
any one security at these stages for the 1st, 2nd and 3rd parcels are suggested as 2%, 4% and
6% of your total portfolio value. Leave these at their default values or change as required.
Clicking on any one of these parcels will place the respective dollar figure limit in the Max
posn size box. This figure can be overridden by directly typing a different dollar figure in
this box. Leaving this box blank will cause this additional limitation to be bypassed.
If the ticker code shown is not the one you require then enter it in the box provided and press
the button Change security code. Finally a value for the applicable Buy price needs to be
specified in the box indicated.
If you already hold parcels of this security the Risk Calculator summarises these in the
Existing positions box and takes these previous parcels into account in the calculation of the
maximum number of additional shares that can be purchased while maintaining the total risk
for each security to be kept below the specified level.
264
Click the Calculate button (or hit the ENTER key) to obtain a display of Maximum
number of units, Maximum value of parcel, Risk per unit
Under Total position at the bottom of the dialog a tick will appear against the option that has
been responsible for limiting the trade either (i) risk on total capital shown as a % or $ value
(ii) risk from maximum position size (iii) risk from average daily turnover (iv) the remaining
cash. In the options that are not limiting relevant values will be shown and the limiting option
will display its maximum.
If you wish to use, as a possible rough indication of the buy price, the last (close) price
recorded in your database, then click Last (or press Alt L) to perform the calculation. To
change the stop loss price at any time you can press the Change stop price button.
For those holdings that increase in price it is common to raise your stop price when this
becomes appropriate. This will reduce the value of the stop loss for the security in question in
the Stop loss column of the list in the portfolio summary main window. In fact the stop loss
can be reduced to such a degree that it becomes negative. The implication of this is that if
your stop is activated and you exit the trade at the stop price using your default broker then
you will receive a profit on that trade. As stops are raised progressively on each security the
Total stop loss value for the whole portfolio, displayed in dollars and as a percentage on the
main window, will decrease.
Company fundamentals, ratios and notepad
You can get a listing of the basic fundamental values for a company by selecting its security
in the list on the main portfolio window and clicking toolbar button number 9. This will bring
up the F2 notepad that you are familiar with from charting. You can also edit your notes from
this box.
The common fundamental ratios on the other hand can be accessed from toolbar button
number 10.
Backing up your portfolio
It is sensible to maintain backups of your portfolio at regular intervals during the entry of its
transactions as entry of a portfolio can involve you in many hours of work. Like any backup
you should retain on external media such as floppy disks or CD’s a grandfather, father, son
rotational sequence of backups so at any time you have at least three backups to fall back on.
It is sensible to retain frequent backups at least of your whole WORKING folder and its
subfolders, one of which includes your portfolio manager files.
For a much more limited but very quick “back up” you can create a backup copy of the
portfolio on which you are currently working by selecting from the File submenu the option
Backup portfolio. If you have a portfolio currently loaded with a file name such as “My
Portfolio.pfl” a backup with a name somewhere in the range “My Portfolio_BAK_1.PFL” to
“My Portfolio_BAK_9.PFL” will be created in the same folder as “My Portfolio.pfl”
depending on the name of the last one saved. A maximum of a total of 9 saved backups for
each portfolio can be stored at any one time. Further backups will cycle to overwrite and
reuse these names.
265
Wrapping Two or More Portfolios into One
Sometimes it is convenient to be able to monitor a single combined portfolio rather than
trying to keep track of several individual ones simultaneously. To do this you can accumulate
several portfolios by “wrapping” two or more into a single portfolio without affecting the
individual components.
First load the component portfolio that you wish to be the master portfolio in the sense that it
will determine the default broker, default account and tax rates. Then from the main portfolio
menu choose File/Wrap portfolios and select the individual portfolios that you want in the
wrap including the one that is currently loaded. Then give it a name like Jim&Jean to
indicate its components and click the Wrap button. A wrap file (.wrp) will be created listing
the portfolios to be included.
To load the Portfolio Wrap go to File/Open portfolio wrap and select the wrap file you
require from the list. It will take a little time to load as each of its components is merged into
the master. The combined portfolio will then be saved to disk as Jim&Jean_wrap.pfl and
loaded into memory.
When next you want to load the wrapped portfolio you can directly load Jim&Jean_wrap
from File/Open Portfolio as for any normal portfolio. This will be faster than loading the
wrap Jim&Jean from File/Open portfolio wrap because all individual components would
have to be merged again in the latter process. However, the wrap will not have been updated
if you have changed any of the individual portfolio components in the meantime and
therefore you should open the wrap from File/Open Portfolio only if you have not changed
any of the components since it was created.
You should only add and edit transactions from the individual component portfolios rather
than from the merged wrap portfolio. Although it is possible to successfully add and edit
transactions from the latter, this combined portfolio is only a temporary file and will be
overwritten next time the wrap is reconstructed by merging its components.
Creating a reference file for charting and systems testing
You can create a reference file of your portfolio stocks that can be used for automatically
generating arrangements of charts or used as a reference file for generating chart
arrangements, autorunning or systems filtering in the other parts of the Insight Trader
program. From the main menu choose File/Create reference file and a list file will be
generated containing the codes for all the securities in your portfolio.
Passwording Portfolios
Each portfolio can be individually passworded by accessing File/Password portfolio. If you
do decide to password a portfolio you must not forget the password otherwise you will not be
able to open it again. When setting or providing the password remember to ensure that CAPS
LOCK is off because the password is case sensitive. To remove password protection at any
time for a particular portfolio simply set the password again to be empty.
266
Calculation of Portfolio Growth and Annualised Growth Rate
Portfolio Growth over the specified time range is given in dollars at the top of the main
portfolio summary screen. This is the difference in value between the notionally liquified
portfolio at the end of the period and its notionally liquified value at the start of the period
less the net capital injection over the period. The liquefied values take into account expected
selling costs. Portfolio values are total and include cash in accounts so the growth includes
realised and paper capital gains (net of charges) as well as dividends and interest. Imputed
and other tax credits are included in the liquified value for the portfolio at the end of the
period but not for its starting value.
Annualised Portfolio Growth Rate over the specified time range is given as a percentage
also at the top of the main portfolio summary screen. A daily compounding fixed interest
model is used and a daily compounding rate is first calculated that would provide the same
total growth over the same period for the same time pattern of capital injection as the
portfolio itself has experienced. The first capital injection is the notional liquified value of
the portfolio at the start of the period and there are four other account transactions - Capital
Deposit, Capital Withdrawal, Other Income and Income Tax that are always taken as
providing the only capital transactions in and out of the portfolio. The only exception is that
all transactions into and out of the <no account> account are considered capital transactions
as this account is not included as part of the portfolio. All other account transactions are
assumed internal in that they are used only for income and expenses and transfers that relate
to the investment. Once the daily compounding rate is calculated the Annualised Growth
Rate for a year is calculated as the cumulative percentage by which a single deposit would
grow over a full year if compounded at this daily rate.
Portfolio and securities growth rates are, by necessity, calculated via an iterative procedure.
Occasionally the solution will not converge and in such cases the figures for these growth
rates will not be available and will be displayed as n/a.
Securities Growth is calculated similarly to the Portfolio Growth but is restricted to growth
generated by the securities alone. It is the net liquified value of the securities at the end of the
period less the net liquified value at the start less the net capital injected into securities
including fees. It also includes the total dividends including imputation and other tax credits.
Securities Growth Rate is calculated in the same way as for the total Portfolio except that
only capital entering and leaving the body of securities eg purchases, sales etc is considered
to generate the Securities Growth.
Charting Directly from Portfolio Manager
You can chart directly from the Portfolio Manager by ticking the menu item Format/Chart
current ticker in charting window (or clicking the corresponding button on the toolbar)
when the portfolio window will be reduced in size and positioned to the left. Whenever you
single click one of the securities in the main portfolio summary list that security will be
charted unadjusted in the main charting window. In this mode it is possible to fully access the
charting module functions while you still have the portfolio open. You can if you wish resize
the portfolio and charting windows to arrange them side by side.
To return to normal portfolio mode just untick the menu item above or click the cross in the
upper righthand corner of the Portfolio Manager main window.
267
Charting Key Performance Indicators of your own Portfolio
Generating Equity Curves and other Key Performance Indicators
You can chart on a daily basis 19 key performance measures (including equity curves) for
your own portfolio to continuously monitor its performance and compare it with that of the
overall market. You can chart:
Total portfolio value
Total value of equities
Cash Balance
Holding Cost
Total Capital Gains realised + realisable in date range specified.
Interest
Income from Dividends etc
Total profit for the period (for tax purposes)
Growth in total portfolio
Growth from securities alone
Annualised Growth Rate for total portfolio from period start date
Annualised Growth Rate for securities alone from period start date
Capital flow into the whole portfolio
Capital flow into securities alone
Month on Month Annualised Growth Rate for total portfolio
Month on Month Annualised Growth Rate for securities alone
Percentage of the total portfolio value in the market
Percentage cumulative portfolio growth
Total capital gain accumulated over the date range specified
The first step is to set the date range over which you wish to calculate the performance of
your portfolio. Choose carefully as the calculation may take up to an hour or so to complete.
Make sure that the end date is no later than the last date for which your database was updated
so that you are not calculating for days for which there is no data.
After this click on the button Accept dates.
Then click on the menu item Reports/Chart portfolio performance.
If you have previously performed a calculation for this portfolio from the same starting date
there will already be a file in existence and you will be asked whether you wish to append to
it rather than starting the whole process from scratch. If you answer yes you will be able to
refresh from a date that you specify or if you leave the date field blank then the last seven
trading days in the file will be removed and calculation continued from there. This is very
much faster than recalculating the whole curve again from scratch.
268
After indicating your choices the calculation will proceed and a file will be produced with a
name of the following form:
“Equity for [portfolioname] from 010714”
Return to the charting module by clicking the second last toolbar button.
Dealing with Old and Reused Codes
Before you can create meaningful charts of the various performance indicators above you
need to ensure that all security data files relevant to your portfolio are in your database
including any files that may have changed their codes or have become delisted since you first
owned them. You will be alerted to any missing files as soon as you attempt to create the
data files for the portfolio itself and you will be given the opportunity to restore them to your
database before calculation begins.
You may find that these files have been moved to the OLDFILES folder from where you can
restore them to their original locations. Make sure, however, that if you subscribe to
Database Manager that you have also unticked the options 1) Delete old codes from database
after merging and 2) Remove delisted companies from the Database Manager configuration
dialog otherwise these files will be removed again to the OLDFILES folder the next time that
Database Manager is run.
Where the ASX sometimes reuses a previously delisted code, say XYZ, we employ a
convention of renaming the old file to Z1-XYZ. If your portfolio contains such a security
with a code that has subsequently been reused, then you should ensure the old file Z1-XYZ is
installed in the database and that any references to this security in your portfolio are renamed.
To change the name and code you should access the button to the right of Ticker symbol in
the Security Transaction form. Just type in the new code Z1-XYZ and any previous security
transactions in the portfolio involving the old code will have their code changed to the new
ticker.
Charting the Equity Curve
If you simply load and chart the above file then you will see the total portfolio value, your
equity curve, as a function of time.
To load and chart this file you could press the +/= key or click the second toolbar button,
click the Pfolio equity button and this will bring up all files relating to portfolio performance
charts. Double click the one you need and this will chart the default performance indicator TotalVal - which is the equity curve for your portfolio.
The file for your portfolio performance indicators utilises the ability of Insight Trader to
provide up to 20 fields in each file rather than just the usual 6 or 7 of Date,O,H,L,C,V,I. To
access these additional data fields you will need to specifically tell the program which
indicator it is that you wish to chart in any particular window.
269
TotalVal - for Pfo <Gold> from 08/10/12
D @ D 221012-280314
GrowthPfo - for Pfo <Gold> from 08/10/12
D @ D 081012-280314
180,000
80,000
70,000
$ Growth in portfolio
170,000
Total portfolio value $
60,000
160,000
50,000
150,000
40,000
140,000
30,000
130,000
20,000
120,000
10,000
110,000
0
-10,000
100,000
O
N
D
2012
J
F
M
A
M
J
J
A
S
O
N
D
2013
J
F
M
O
A
N
2014
D
2012
J
F
M
A
M
J
J
A
S
O
N
D
2013
J
D @ D 081012-280314
M
A
2014
SecGRate - for Pfo <Gold> from 08/10/12
PfoGRate - for Pfo <Gold> from 08/10/12
F
D @ D 010413-280314
70
80
70
60
60
50
50
40
40
30
30
20
20
Pfolio compounding Growth Rate
Securities compounding Growth Rate
10
10
0
0
-10
O
N
D
2012
J
F
M
A
M
J
J
A
S
O
N
D
2013
J
F
M
APR
A
MAY
JUN
JUL
AUG
SEP
OCT
NOV
DEC
2013
2014
%Equities - for Pfo <Gold> from 08/10/12
D @ D 081012-280314
JAN
FEB
APR
2014
CashBal - for Pfo <Gold> from 08/10/12
100
MAR
D @ D 081012-280314
90
80,000
70,000
Cash Balance $
80
60,000
70
50,000
60
40,000
50
40
30,000
30
20,000
% portfolio in Equities
20
10,000
10
0
0
O
N
D
2012
J
F
M
A
M
J
J
A
S
O
N
D
2013
J
F
M
O
A
N
2014
Dividends - for Pfo <Gold> from 08/10/12
D @ D 081012-280314
D
2012
J
F
M
A
M
J
J
A
S
O
N
D
2013
J
M
A
2014
Interest - for Pfo <Gold> from 08/10/12
7,000
F
D @ D 081012-280314
6,000
600
500
Dividends
Interest
5,000
400
4,000
300
3,000
200
2,000
100
1,000
0
O
N
D
2012
J
F
M
A
M
J
J
A
S
O
N
D
2013
J
F
M
0
A
O
N
2014
Fig 10.16
D
2012
J
F
M
A
M
J
J
A
S
O
N
D
2013
J
F
M
A
2014
270
To chart any of the other 18 indicators you will need to go to the main menu and click
View/Chart specs (or Ctrl Alt F). The dialog box will display a total of twenty numbered
fields with number 2 – TotalVal, or total value, being the default. Choose another indicator
such as 6 – TotalCG, or total capital gain, by replacing the number 2 with number 6 in the
second box then click OK and OK again to accept the second dialog box.
Fig 10.17
To make a chart arrangement of all the indicators on screen at the same time you can, by
repeated use of the +/= key, first create 19 identical charts with the default TotalVal field
displayed. Then click on each chart in turn to make it active and replace the field value 2 with
field values 3 to 20 as described above. When you have created this chart arrangement save it
for future reference by pressing Ctrl S or the Save arrangement of charts button on the main
toolbar.
Monitoring the Performance of your Portfolio against Benchmarks
The top line of the Portfolio Manager Summary screen allows you to monitor the overall
performance of your portfolio covering the period of the date range as specified by the Start
date and End date.
You have two display options for this top line either (i) Growth Rates or (ii) Cumulative
Growth compared with Targets and Benchmarks. These options are toggled by clicking the
GrowthRates/Benchmarks button on the Summary screen. All figures have been adjusted for
any capital inflows and outflows and all growth rates are expressed as compounding values.
Toggle between
Growth Rates
271
and Cumulative Growth Benchmarks
Portfolio growth
Securities Growth
Portfolio Growth Rate
Cumulative percent
period growth for:
Portfolio
Securities Growth Rate
Securities
Target
Benchmark Index eg All Ords Accum
103
Fig 10.18
Growth Rates
With this first option you are shown the Period $ Growth in the total Portfolio [Portfolio =]
and its corresponding average annualised compounding Growth Rate [PG Rate =]. Further
along is the Period Growth in Securities alone [Securities =] and its corresponding average
annualised compounding Growth Rate [SG Rate =].
The difference between the Securities figures and the Portfolio figures is that the Securities
values are calculated excluding consideration of any cash while the Portfolio values include
any cash as an integral part of the total portfolio.
Cumulative Growth Performance monitored against Benchmarks
The menu item "Format/Set Performance Benchmarks" in the Portfolio Manager allows you
to set a Benchmark Index such as the All Ordinaries Index (or the All Ordinaries
Accumulation Index) or whatever security code that you wish to compare your portfolio's
performance against as well as a Target Growth Rate (compounding) against which you can
compare your portfolio's performance. The default Benchmark Index is "XAO" and the
default Target Growth Rate is 12% pa compounding.
This option allows you to compare the cumulative performances over the current date range
of both your total Portfolio and the Securities alone against the cumulative growth that would
be expected from the Target growth rate you have specified and also what your Benchmark
index has achieved over the same period.
The figures for cumulative growth shown from left to right are the portfolio $ period growth
[Period Growth =] and the portfolio percentage cumulative growth performance compared
with the Target cumulative growth [Portfolio = (Target = )]. Then comes the percentage
cumulative growth for the securities alone compared with that of the Benchmark Index
[Secur = (B’Mark Index = )]
272
The figures for the securities alone is particularly useful if you wish to compare the
cumulative percentage growth of the particular securities you have chosen with the
cumulative percentage growth of the broad market index that you are using as a benchmark.
For example, if the cumulative percentage growth of your securities is say 40% and that for
your benchmark index is 20% then you know that you have picked stocks that on average are
outperforming the index by a factor of 2.
This information is particularly valuable at the start of a bull market when there is a large
percentage of the portfolio in cash and you wish to know how well the stocks that you have
chosen are performing relative to the average for the broader market.
%CumPfGrth XAOA
D @ D 081012-280314
Cumulative Percentage Growth of Portfolio
compared with Benchmark Index
80
70
60
50
Portfolio
40
30
20
All Ords Accumulation Index
10
0
O
N
D
2012
J
F
M
A
M
J
J
A
S
O
N
D
2013
J
F
M
Fig 10.18
Daily Change in Portfolio Value
At the end of the top line of the Portfolio Summary screen showing Portfolio Totals in both
of the above options is displayed the change in the total value of the portfolio holdings at the
portfolio end date from the total value of the same holdings the day before the end date
expressed as both $ values as well as the same total change expressed as a % of total
portfolio value.
In the case where stocks are bought or sold on the portfolio end date the change is calculated
as though those transactions had been carried out at a price equivalent to that of the close of
the day before. Since the change is calculated on the change in values of the holdings rather
than their liquefied values then any change in the notional selling costs resulting from
changes in value are not included. If required the liquefied value change from the day before
can be obtained from the equity curve chart for that portfolio.
A
2014
273
The Significance of Annualised Growth Rate
One of the most important of the key performance indicators of your portfolio is the
Annualised Growth Rate figure. It is essential that you are aware of why it is so important
and how you can make use of it.
The advantage of measuring Annualised Growth Rate is that it allows us to compare
rigorously the performances of different investments over different periods of time in
situations where there may be radically different patterns of dynamic flow of capital into and
out of those individual investments.
People sometimes wonder what an Annualised Growth Rate of R% pa for our portfolio
actually means. The answer is that we simply compare the performance of our own portfolio
at the end of a given period of time, say three months, against that of a notional fixed interest
investment (over the same period) that compounds daily and that would, if allowed to
continue for one whole year, have given us at the end of that year a final return of R% on a
fixed sum invested at the start.
The Annualised Growth Rate for your portfolio is calculated to be the Annualised Growth
Rate that would be required in a daily compounding fixed interest investment - subjected to
the same regime of capital inflow and outflow as that experienced by your own portfolio - to
provide the same return as your portfolio has done over the same period of time.
Transaction Codes used for Acquisition and Disposal
ACQUISITION
DISPOSAL
P
Purchase
D
Dividend Reinvestment
F
From exercised options
X
Exercised options
N
Name change acquisition
T
Ticker change disposal
M
Merger acquisition
E
Exchanged for merger securities
O
Offspring from demerger
U
Unwind from parent in demerger
S
Sale
Exiting the Portfolio Manager
The last button on the toolbar will exit completely from Insight Trader. The second last
button on the other hand will hide the Portfolio Manager and return you to the main charting
window. The third last button will allow you to change to another database in a new
directory.
275
Chapter 11
Documents Management System
Overview
Insight Trader has its own integrated, comprehensive documents management system for
storage and retrieval of electronic documents related to your investment activities. You can
easily store and automatically access files such as Word Processing and PDF documents,
spreadsheet files, emails, shortcuts, links to webpages and image files of scanned paper
documents. In fact you can store any type of file that you require.
This facility provides you with a convenient, single repository for such things as Holding
statements and Buy and Sell contracts notes that have been emailed to you by your broker,
downloaded by you or scanned in from paper documents in your possession. Your bank
statements can also be placed in their own specific storage area for each bank account. You
can even include such things as links to relevant websites, broker recommendations and
newsletters. Another example might be legal documentation relevant to a Superannuation
Fund that can be scanned in and the file dropped on to the portfolio manager window for
storage and easy access. In this way you can organize all documentation relating to your
investment activities in the one convenient and easily accessible location.
Storage and Retrieval
To store one or more document files you can simply drag and drop them on to the F2
notepad, appropriate areas of the Main Portfolio Manager window, or on to the Accounts
Transaction dialog for instant storage in relevant categories. The documents so stored are
easily accessed by clicking the Docs button on any of these three windows and the files are
instantly available for viewing or editing.
It may be convenient to first copy the files you wish to store on to the Desktop (rather than
from Windows Explorer or My Computer), then reduce the size of the Insight Trader
windows to expose the desktop, before dragging them on to the appropriate Insight Trader
dialog box. If you hold the Ctrl key down while dragging then you will copy the file rather
than move it.
Alternatively, you can also click any of the Docs buttons to open the relevant folder and then
drag or copy and paste these files directly into the storage area. This second method should
be used if you wish to drag emails, or attachments to emails, directly from your email
program (rather than first copying them to the desktop) or if you wish to drag with the right
mouse button to create shortcuts to the file rather than moving or copying the file itself.
Moreover, whenever you first access a particular storage area by dropping a file on to a
window, a Word document file will also be automatically generated and appropriately named
ready for you to enter notes etc. If you have not yet stored any documents in this location and
you press the Docs button you will be asked if you want to create such a Word document file
for that security, portfolio or bank account. These Word documents can be used, for example,
276
as a trading diary or to enter notes on a particular stock and can be illustrated with screen
grabs or emf charts that you generate from within Insight Trader. The possibilities are
limitless.
Where are the files actually stored
Although the actual storage areas on the hard drive are transparent to the user these are in fact
maintained in a system of subfolders off the DOCUMENTS folder under the WORKING
subfolder of the main WINIT program folder.
There are separate storage areas for any security such as say BHP (i) in the charting section
of the program that is accessed through the F2 notepad and (ii) in each of your portfolios that
might contain BHP as a code and that are accessed through the main Portfolio Summary
window. In addition each portfolio itself has a separate general storage area.
Also each bank account has its own separate repository that is accessed through the Account
Transactions dialog.
Schemes for Further Organisation
If you wish you can further organize your work by pressing the Docs button and then create
new subfolders for specific purposes within the area revealed. You can then rearrange your
files by dragging and dropping into these custom subfolders. You might for example wish to
create subfolders, within the area for a specific bank account, into which you can drop files
relating to statements from previous financial years for archiving purposes.
One scheme might be to place general stock information such as broker reports etc into the
F2 storage area. The portfolio storage area for specific securities that you actually hold would
be used for contract notes, dividend statements, notes on reasons for entry and exit, portfolio
reports and so on. General information on a particular portfolio would go in the general area
for each particular portfolio. Bank statements would be stored under the accounts storage
area. If you are a very active trader then in the relevant portfolio section for any particular
security you could create subfolders for different financial years (or whatever other form of
categorisation you wish to use) into which documents could be archived.
This provides a comprehensive yet very simple, flexible and convenient documents
management system that is easily maintained and accessed.
Storage and Retrieval of Documents
On the Main Charting Window
The first document repository within the program is accessed with the DOCS button on the main
toolbar. It is for general investment documents not necessarily associated with either specific
codes or specific portfolios or specific bank accounts. Just drop any file on to the main Insight
Trader program window to store it. The DOCS button on the toolbar will allow you to retrieve it.
277
On the F2 Notepad
This is the storage area for individual securities within the charting module of the program
and is applicable to any security whether you already own it or not. For example if a stock is
on your watch list you might wish to keep notes on it and store reference material prior to
purchase. This is the place to do so.
Drag and drop one or more files, from the desktop or Windows Explorer, anywhere on to the
F2 Notepad and retrieve and open these files from the Docs button on the F2 Notepad. A
Word doc file will also be created automatically for that security on the first drop. If the Docs
button is clicked before any files have yet been dropped for that security then you will be
asked if you want to create a Word doc file for that security.
The F2 Notepad itself can also still be used for entering notes for specific purposes as it has
the advantage of speed in that it is instantly available and does not require any additional
Word application software to load.
On the Main Portfolio Summary Window
Drag and drop files, from the desktop or Windows Explorer, on to the individual rows for
each security on the main portfolio summary list and they will be saved in the current
portfolio area for that security. Drag and drop files on to the grey display section above and
they will be saved under the "general portfolio" area for that portfolio.
To retrieve and open these files for any security highlight the row for the particular security
and click the "Doc" toolbar button on the main portfolio toolbar. If no files are currently
available it will ask if you wish to create a Word doc file for that security. To access the
general portfolio folder, click in a blank row at the bottom of the list (to remove the highlight
from the rows) and click the Doc toolbar button.
Note that for any particular security, say ABC, there are separate ABC document folders for
each individual portfolio and these are in turn separate from the ABC document folder for the
F2 Notepad.
On the Accounts Transactions Dialog
You should first open the Accounts Transaction dialog and then select the specific account of
interest (from the drop down list box) into whose area you wish to store your document.
Drag and drop the selected files, from the desktop or Windows Explorer, anywhere on to the
Accounts Transactions dialog and they will be saved in the current storage area for that bank
account. These documents can be retrieved at a later time for any bank account by selecting
that account in the dropdown list on the dialog and clicking the Docs button.
278
Customising the Word Document Templates
Each time a Word document file is created for your use in the particular storage areas it
copies across one of four template files that are stored in your main WINIT folder. You can
customise each of these templates so that each time it is copied to a new document you will
already have available some standard text that you might always wish to have in such a
document to prompt you for input. For example for stocks that you have purchased you
might wish to have preset fields such as 1) Date purchased 2) Quantity bought 3) Reason for
purchase 4) Target price 5) Date sold 6)Reason for sale 7) General notes etc. Alternatively
you might like all templates to be blank containing no preset information at all.
The template files that should be customised can be loaded into Word from the WINIT folder
and are named as follows:
Template – security.doc
Template – pfl security.doc
Template – pfl general.doc
Template – account.doc
Encrypting Sensitive Portfolio Document Files
For security of sensitive portfolio document files such as scanned bank statements you can
easily encrypt these as they are being dropped on to the Account Transaction dialog. It is
necessary that WinZip be installed in the 'Program Files' folder along with its "commandline
addon". These applications can be downloaded from 'www.winzip.com' for about $40. Tick
the relevant checkbox in the Format/Preferences dialog of Insight Trader to enable this
feature and configure it as on. It may also be temporarily enabled and disabled for the
duration of a session from the Format menu of the portfolio manager window.
Drag and drop files directly on to the Account Transaction dialog itself when you will be
asked for the name of an existing or a new WinZip file to which to add it. You will be
prompted to supply a password for the encryption for each file dropped.
The other dialog for which documents can be encrypted is the main portfolio dialog when
files can be dropped on to individual securities. This allows you to encrypt contract notes and
other documents relevant to your trading of those individual securities.
Should you wish to encrypt many files at the same time using the same password then click
the Docs button and then select all files required from the source folder and drag and drop
them all together on to the appropriate Zip file.
To retrieve an encrypted document click the docs button on the Account Transaction dialog
or the main portfolio dialog and double click the zip file that contains the required document.
Then double click the document and enter your password when requested.
It can be a useful form of organisation to create a separate zip file for each financial year.
279
281
READING LIST
The following books provide information on the subject of technical analysis and trading
strategy.
1.
John J. Murphy, Technical Analysis of the Futures Markets. A comprehensive guide to
trading methods and applications. New York Institute of Finance, New York, 1986.
2.
Robert D. Edwards and John Magee, Technical Analysis of Stock Trends, 5th Ed, John
Magee Inc., Boston, 1966.
3.
Perry J. Kaufman, Commodity Trading Systems and Methods, John Wiley and Sons,
New York, 1978.
4.
Jacob Bernstein, The Handbook of Commodity Cycles - a window on time, John Wiley
and Sons, New York, 1982.
5.
Richard J. Teweles, Charles V. Harlow and Herbert L. Stone, The Commodity Futures
Games - who wins? who loses? why?, McGraw-Hill, New York, 1977.
6.
Jacob Bernstein, The Investors Quotient - the psychology of successful investing in
commodities and stocks, John Wiley and Sons, New York, 1980.
7.
Ivan Krastins, Listen to the Market - Your Personal Guide to Technical Analysis,
McGraw-Hill, Sydney, 1992.
8.
R W Colby and T A Meyers, Encyclopaedia of Technical Market Indicators, Dow
Jones-Irwin, Homewood Illinois, 1988.
9.
Stan Weinstein, Secrets for Profiting in Bull and Bear Markets, Irwin, Chicago, 1998
10. James A. Hyerczyk, Pattern Price and Time, John Wiley and Sons, New York, 1998
11. Alan Hull, Active Investing – a Complete Answer, Wrightbooks, Sydney, 2001
12. Alexander Elder, Trading for a Living, John Wiley & Sons, New York,1993
13. Alexander Elder, Come into my Trading Room, John Wiley & Sons, New York, 2002
14. Colin Nicholson, Building Wealth in the Stockmarket, Wiley, Melbourne, 2009
15. Colin Nicholson, Think like the Great Investors, Wiley, Melbourne, 2013
16. Colin Nicholson, Hot Stocks, Wilkinson Publishing Pty Ltd, Melbourne, 2007
282
Speed Keys
CONTROL SPEEDKEYS
FUNCTION SPEEDKEYS
Ctrl A
Ctrl+Shft+A
Ctrl B
Ctrl C
Ctrl D
Ctrl E
Ctrl F
Ctrl G
Ctrl H
Ctrl+Shft+H
Ctrl I
Ctrl J
Ctrl K
Ctrl L
Ctrl M
Ctrl N
Ctrl O
Ctrl P
Ctrl+Shft P
Ctrl Q
Ctrl R
Ctrl S
Ctrl T
Ctrl U
Ctrl V
Ctrl W
Ctrl X
Ctrl Y
Ctrl Z
F1
F2
F3
Ctrl+Shft+?
Multple Moving Averages
Generate chart arrangement
Bollinger Bands
CYCLES mode
Divergence
Envelope of MAs
Fans
ReGression toggle
Hide main chart lines
Hide Alarms
Line Linear Regression
Moving data box
LocK display DWM
LINES mode
Chandelier Exit
Substitute New security
ParabOlic SAR
Print charts
Generate metafiles
Quit chart edit mode
Retracements
Save chart(s)
TEXT mode
Scaffold Exit
Reserved
Zoom bracketed time
X Projections
Y Projections
Remove MA Boll Para
- Remove Regress Ratio
- Remove Rebase
Toggle alarm to be last price
on the chart/in the file
F4
F5
F6
F7
F8
F9
F10
F11
F12
PgUp
PgDn
Home
End
00 - 99
R arrow
L arrow
Up arrow
Dn arrow
Context Help menus
Notes on security
Zoom out central
+Ctrl - Zoom out total
Zoom in central
Zoom out from right
Zoom in to right
+ - Zoom in total
Scroll Left 1 d
+Shft - Scroll Left 7 d
+Ctrl - Scroll Left 30 d
Scroll Right 1 d
+Shft - Scroll Right 7 d
+Ctrl - Scroll Right 30 d
Resume slideshow
+Ctrl - Resume autorun
reserved by Windows
Indicator menu
Last data
+Ctrl - Extnded Last data
Page Left
Page Right
Page to beginning
Page to end
Event grid
Activate next chart
Activate previous chart
Maximise chart
Restore chart
283
ALPHA SPEEDKEYS
ALT SPEEDKEYS
A
B
C
D
Alt A
Alt B
Alt C
Alt D
Alt E
Alt F
Ctrl+Alt F
Alt G
Alt H
Alt I
Alt J
Alt K
Alt L
Alt M
Alt N
Alt O
Alt P
Ctrl+Alt P
Alt Q
Alt R
Alt S
Alt T
Alt U
Alt V
Alt W
Alt X
Alt Y
Alt Z
Alt 1-0
Ctrl+Alt 1-0
E
F
G
H
I
J
K
L
M
N
O
P
Q
R
S
T
U
V
W
X
Y
Z
~
1 Moving Average
bar chart
candlesticks
daily
+Shift Compress Daily
equivolume
log/linear toggle
grid toggle
hide/show splits
Indicators
Pivot points
compress status
line chart
monthly
+Shift compress Monthly
New File
overlay
point && figure
equicandles
Reversals
volume log toggle
Time constants
Gann swing charts
volume chart toggle
weekly
+Shift compress Weekly
set date axis
set vertical axis
lock Y scales
extend alarm lines
Save file
Blank screen
KwickChart
Change Directory
MENU Edit
MENU File
Chart specs (First Form)
Enter Chart edit mode
MENU Help
Edit vIew records
Highlight list
Data file management
Load security to chart
MENU ForMat
MENU RuNslides
Preferences
MENU Portfolio
Load Portfolio
Show default template
Replay saved charts
MENU Systems
Time constants
MENU Utilities
MENU View
MENU Windows
Exit program
Load system
reserved
Zoom years 1-10
Zoom months 1-10
284
Specialized Mouse Operations
Front Screen
Left Click chart
Right Click chart
Ctrl Left Click chart
Shft Left Click chart
Ctrl+Shft Left Click chart
–
–
–
–
–
Invoke Chart Edit Screen
Invoke Floating Toolbar
Add code to WATCHLIST
Remove code from WATCHLIST
Reset WATCHLIST
–
–
–
Commence drawing trendline
Invoke Floating Toolbar
Add code to WATCHLIST (other keys as above)
Chart Edit Screen
On main chart
Left Click
Right Click
Ctrl Left Click
Just to left of vertical axis
Ctrl Left Click
Shft Left Click
Ctrl Right Click
Drag alarm with no key
Drag alarm with Shft key
Drag alarm with Ctrl key
Drag alarm with Shft+Ctrl
–
–
–
–
–
–
–
Set Alarm Below rounded to ASX rules
Set Alarm Above rounded to ASX rules
Delete Alarm
Move alarm and round to 0.01
Move alarm and round to 0.1
Move alarm and round to 1
Move alarm and round to 0.5
Just to right of vertical axis
Left Click or drag
Right Click
–
–
Reposition top of subcharts
Remove adjacent indicator
Text (on top left corner) or Lines, Fans, Circles etc (on handles)
Right Click
Shft Right Click
Ctrl Right Click
Drag
–
–
–
–
Edit
Spawn (a line)
Delete
Move
–
–
Toggle fast/slow data scroll within a chart
Toggle scrolling within chart/rotating active chart
Mousewheel Button
Click
Double Click
285
INDEX
% Franking, 66
% sign, 70
@ character, 131
^ character, 163
+/-DI ADX, 129
+Capital, 234
+Capital column, 251
+DI, 113
+DM/-DM ADX, 127
45 degree lines, 81
5 or 7 Day Calendar Axes, 73, 78
7 day week, 73
acceleration factor, 101
account
<cash drawer>, 227
<no account>, 226
<suspense account>, 227
account transactions
exporting to Excel, 246
accountant, 221
accounts
linked, 236
registering, 226
accumulation index, 104
accumulator, 123, 157, 161
acquisition date, 251, 253
activating charts, 37, 58
next chart, 37, 58
active chart, 37, 58
active window, 54, 56
Activity function, 204
Add new chart, 35, 55
additional value
+ $K, 237
Adjusted files, 70
adjusting shares for issues, 167, 170
adjustments, 162
advance/decline, 157, 161
ADX, 114, 127, 129
ADXR, 114, 127, 129
ago function, 201
alarm, 53, 65, 69, 184, 221, 241
deleting all, 180
levels, 137
list of alarms hit, 138
list of alarms set, 138
list of set alarms, 180
on close, 241
sound, 151
status, 69, 154
Alarm
soft, 68
alarms
deleting, 70
dragging, 70
rounding, 70
setting, 70
Alarms
extending lines, 68
ALARMSET.LST, 69, 138, 180
Allow multiple instances, 153
Almax, 194
altering existing records, 162
Amount, 234
AND, 200, 208, 210
annualised growth rate, 80, 273
apostrophe, 55
Archelis
Michael, 117
arithmetic operators, 200, 207
arrange charts alphabetically, 35
arrangement of charts, 36, 133
Arranging Charts on Screen, 58
arrow keys, 59
ASCII file, 137, 181
convert, 175
date naming convention, 189
export, 173
Astronomical Events, 87
ASX
codes, 195, 213
Database Manager, 138, 195
subsector, 138, 195, 196
ATR, 115
on stops, 67
auto box size, 136
autodate status, 164
automatic box size, 43, 133
automatic scaling, 51, 73
autorun slideshow, 135, 137, 139, 140, 142, 216
commencing, 136
halting, 136
manual, 137
Autoscaling, 130
Autoswitching, 86
available units, 233
Average Directional Movement Index, 114
Average Directional Movement Index Rating, 114
Average True Range, 115
Backing up
portfolio, 264
Backing up data, 177
bad ticks, 178
filter, 178
balance
account, 234
bank accounts, 222
bank fees, 222, 234
bank statements
reconciling, 247
bar chart, 40, 87
coloured, 71
Bars, 131
Bear Power, 117
Behaviour, 64, 95, 119, 129, 214, 237
blank form, 163
Blank screen, 36, 57
Blank space, 131
BodhiOne, 175, 222
Bodhi Viewer, 176
BodhiOne Format Databases, 23
Bollinger %b, 118
Bollinger Band Width, 118
Bollinger Bands, 99
286
bonus issues
options, 250
rights, 250
shares, 195, 250
shares in specie, 250
Breakhigh function, 205
Breaklow function, 205
brokerage, 225
Browse Buttons, 150
Browsing Data File, 166
BULK manual update utility, 70, 137, 158, 159, 162,
168, 192
Bull Power, 117
buy alert, 200, 208, 210, 213
buy and hold strategy, 199
Buy and Sell flags, 90
calculations, 127
on main chart, 127
on subchart, 128
Calculator, 28
calendar axes, 130, 131
calls, 223, 228, 251
additional payments, 234
candlesticks, 42, 126
chart, 42
coloured shadows, 71
functions, 201
capital deposit, 222, 230, 234
capital profits, 222
capital reconstructions, 233
capital return, 167, 169, 228, 234, 251
Cardfile, 28
cascade charts, 35, 58
Cascading and Tiling, 35
Cash balance, 236
Cash Drawer Account, 227
category
changing, 61
chart, 53, 59, 61, 133, 143
Chandelier Exit, 102
change in trend, 120
change to new directory, 150
Changing active chart, 37
Character "%", 70
Character "@", 70
chart
arrangement, 52, 61, 136, 142
charting, 27, 39
formats, 134
specifications, 123
template, 39
type, 40, 71, 125
Chart Edit Window, 74, 78
charting
from Portfolio Manager, 240, 266
check data file, 166, 178
check data integrity, 178
choose colour dialog box, 80, 82
Clear screen, 57
close, 40, 84, 157, 161
Code, 160, 161
code change, 251, 254
codes
acquisition and disposal, 273
changed, 173, 255
delisted, 173, 255
reused, 173, 255, 268
colour, 35, 79
colour number, 147
colour printing, 152
Command Line for Data Vendor, 152
COMMAND prompt, 28
Commence, 134
commodity futures markets, 40
CommSec Today File, 144
company code, 133
company name, 133, 195
compound indices, 125
Compress
daily, 76
monthly, 76
weekly, 76
Compressed files, 70
compression, 50, 70
status, 76, 78
Configuration, 147
Configure Preferences, 149
congestion, 81
consolidation, 169
in portfolio, 252
Constructing a System, 199
contributing shares, 251
Conversion rate, 231
Converting Files
foreign formats, 176
Coppock indicator, 115, 127
Coppock Indicator, 129
Copying Charts, 62
Copyright, 7
corrupt files, 178
removing, 179
create new data file, 158
Create New System, 209
Crosses, 131
crossover operators, 208
CSV files, 64
Ctrl X, 103
Currency, 231
Current value, 236
cursor
crosshairs, 84
horizontal line, 84
vertical line, 84
Custom Configuring Datacapture, 188
cycle grids, 82, 131
cycles, 108
Cycling Saved Charts, 63
D W M lock, 78
daily, 76, 86, 200
daily bar chart, 40
Daily, Weekly and Monthly Displays, 50
data
corruption, 177
directory, 159
fields, 157
files, 155
formats supported, 175
resident file, 164
types, 160
data provider, 137, 152, 155, 158, 168, 182
Data service download, 152, 196
DATA subdirectory, 192
Data Window, 54
moving, 65, 84
287
Database Manager, 26, 65, 138, 139, 178, 192, 195, 205,
207
updating via web, 196
Datacapture, 67, 69, 70, 159, 168, 175, 181, 194
Command Line Mode, 191
custom configuration, 186
Distributing Many Daily Files, 189
Running for a Single Day, 189
date, 124, 130, 157, 161, 163
check in portfolio manager, 229
convention, 25
entering, 228
payment, 227
range, 78, 125, 130
transaction, 227
date range portfolio
display, 240
setting, 240
day of the week, 84, 163
default field, 161, 162
default security file, 150
Default starting date, 125, 150
deferred delivery shares, 195
Define Chart Specifications, 129
Define file, 163
Delay, 134
deleting
block of data, 180
charts, 57
records, 162, 164
saved chart arrangements, 61
trendlines, 83
demutualisation, 226
company shares, 249
dependent files, 70, 168, 184
deposits, 222
Detrend, 108, 127, 129
-DI, 113
Dial-in data service, 181
DIF file export, 173
Dilution, 162, 169
Direct, 127
Directional Movement Indicator, 113
directories, 22, 150, 157
split, 192
unsplit, 192
Disk file, export to, 174
disk space, 133
Display info on chart, 153
Display Preferences
portfolio, 238
Distributing Single Daily ASCII Files, 182
distributions
funds, 252
trusts, 252
divergences, 109, 110, 112, 120
dividend, 66, 222, 232, 236, 252
exdate, 66, 195, 228
forthcoming, 66
franked, 252
per share, 195
reinvestment, 226, 250
transaction date, 228
unfranked, 252
yield, 53, 64, 195, 199, 214
DMI, 113
documents, 66
customise, 278
encrypting sensitive, 278
storage and retrieval, 275, 277
template, 278
documents management system, 275
double precision, 155, 160, 164, 184, 187
downloading, 158
dragging, 34
drawing tools, 78, 79
dummy trades, 184
Duplicate previously typed entry, 194
DW or M display status, 78
Earnings Per Share, 195
earnings yield, 64, 206
eclipses, 87
edit data records, 162
Edit System, 211
editing
trendlines, 83
unrestricted, 259
when date range set, 259
Editing Saved Chart Titles, 61
Elder
Alexander, 105, 117
Elder-Ray index, 117
EMF files, 63
Encrypt docs, 154
EPS, 66
equicandles, 45, 126
Equities
value, 236
equity curves
charting, 267
equivolume, 44, 126
Erasing Data File, 166
events, 87, 199
Excel, 223, 246
exceptionally performing securities, 137
exercise, 223
Exit edit, 164
exit Insight Trader, 38
Expectancy, 245
Exponential Moving Averages, 96
Exporting data, 173
Express Configuration
Datacapture, 182
Extending Trendlines, 83
F12 / Ctrl F12 interchange, 65
F2 notepad, 64, 69, 195, 205, 241
risk calculator, 262
factors
price and volume, 152
Fans, 34, 82
features, 20
Fibonacci, 34, 82, 85
price projections, 82
time projections, 82
field, 157
combinations, 124
name, 160
product, ratio, spread, 127
rearrange, 172
reduce number, 173
replace, 172
FIFO, 256
file structure, 188
File, creating a new -, 159
288
Filename, 159
filter, 137, 139, 184, 199
database, 212
directory, 212
HILITE list export to Excel, 215
list, 140
report, 215
reports, 207
filter list
reorder, 215
Financial Times website, 66
First Form, 129
First user file, 28
flexible file, 123
Floating Toolbar, 30
focus, 37, 58
folder, 22
font, 148
fixed, 148
nonscaleable, 148
printer, 149
proportional, 148
scaleable, 148
Force Index, 105
foreign
files, 178
formats
converting files from, 176
income, 252
transactions, 231
foreign databases
generate list of all codes, 177
generate reference list, 59
formats supported
BodhiOne, 175
Metastock, 175
Quotes Plus, 175
franking, 53, 64, 195, 214, 232
rate, 232, 252
Functions, 200, 201
basic, 201
fundamental, 205
Indicator-based, 202
special, 204
fundamental
criteria, 199
information, 53, 197, 205, 264
ratios, 264
User Supplied, 196
Fundamental Information from the Internet, 66
Fundamentals, 64
futures, 27
gains
discountable, 222, 237
non-discountable, 222, 237
Gann, 34, 73, 82
Gann Lines, 80
generate
chart arrangement, 142
saved charts, 52, 142
Generate Ref List from Sectors, 138, 213
Get data button, 141
Getting Started, 19
Graphics colours, 147
grids, 50, 153
Growth
Portfolio, 266
securities, 266
total portfolio, 222
Growth Rate
annualised, 222, 266
securities annualised, 266
Halt toolbar button, 235
handles
trendlines, 79
hard disk crash, 177
hardware requirements, 21
header lines in ASCII file, 189
help, 24
hide
chart details, 77
price chart, 77, 131
high, 40, 84, 157
highlight list, 52, 133, 137, 140, 185, 196, 199, 207, 213,
216
highlighter, 69, 184
foreign databases, 177
high-low-close, 161
bar chart daily, 126
bar chart monthly, 126
bar chart weekly, 126
hindsight, 120
histogram, 47
historical data, 192
historical information, 155
Holding cost, 236
horizontal axis, 47, 72
horizontal line, 84
Hull
Alan, 100, 116
icons, 22
Importing files
ASCII, 175
imputed tax credit, 232, 236, 237, 252
income, 236
transaction, 232, 252
transactions, 223
indicators, 50, 76, 87, 93, 199, 202
global, 95
moving average based, 94
parameters, 93
range, 94
industry subsector, 133
Init/Save Tagfile, 140
Initialising files, 159, 181, 188
INSERT option, 184
Insight Trader
Special Edition, 25
Insight Trader Group, 22
Insight Trading Pty Ltd, 17
Installing Insight Trader, 22
instalment payment, 251
Instant Configure, 182
Integers, 162, 187
integrity check, 178
interest, 222, 234
net, 236
internal database, 133
internet, 20, 21, 24, 26, 70, 137, 144, 158, 181, 183
intraday
data, 143
issues, 70, 162, 167, 168, 184
289
IT for DOS directory, 150
Items Displayed in the Caption Bar, 77
ITSE, 25
J - Pivot Points, 89
key components, 21
key performance indicators, 267
Kwickchart, 54
landscape orientation, 37, 63
large amounts of information, 52, 133
last close, 43
licence agreement, 22
LIFO, 256
line chart, 41, 48, 49, 50, 72
Line of Linear Regression, 100
line or scatter, 126, 127, 131
line thickness on printing, 152
Linear, 49, 72, 130
linear regression, 99, 123, 131
Linear Regression Growth Rate, 117, 129
lines, 34, 79
cursor, 84
liquidity risk, 260
LIST.DAT, 193
Load System, 211
Loading data file, 164
Lock daily weekly monthly display, 75
Lock Y scales, 87
logarithmic scaling, 49, 72, 130, 153
Logical Operators, 207
logical tests, 199
long date, 25
long term charts, 50
low, 40, 84, 157
MACD, 112, 127, 129
MACD Histogram, 113, 127, 129
main activity, 195
Main Chart Indicator, 127
managed funds, 221, 231
Management of Data, 155
Manually entering data, 159
Manually Generated Reference Lists, 137
manually updating files, 158
Market Trading, 27
master file, 70, 167, 170
maximise
button, 37, 58
new charts, 153
maximised chart, 58
Maximum Additional Purchase, 91
Maximum function, 204
maximum value, 160, 162, 184, 187
menus, 30
merging
company shares, 223, 253
data files, 170
metafiles, 53, 63
Metastock, 175, 222
format databases, 23
Minimum function, 204
mobile trendline, 79, 81
modem, 159
Momentum, 105, 127, 129
Money Flow, 117
Money Flow Index, 117
money management, 27, 260
Moneyflow, 64
monthly, 31, 50, 70, 76, 86, 200
moons, 87
mousewheel, 65, 75, 134, 135, 137
moving average, 96, 108
indicators, removing, 103
multiple, 94
printing, 152
triple, 94
type indicators, 93
Moving Average Convergence Divergence, 112
moving average envelopes
Autoenvelope, 98
Moving Average Envelopes, 98
Moving Average Oscillator, 109, 127, 129
Moving charts, 62
Multiday Filter, 216
multiple chart
arrangement, 51
arrangment, 58
multiple instances, 153
Multiple Moving Averages, 97
NAB, 66
name change, 251, 254
Net Asset Backing, 195
Net Paper profit, 236
Net Realised Profit, 236
new directory, 150
new security, 55, 56
Next chart activate, 37
nn, Alt n - Astronomical and other Events, 87
no account, 226
non calendar axes, 72
Notepad, 28, 53, 65
F2, 53
Notes for security, 65
notrades limit, 157, 184, 213
NTA yield, 64, 206
number keys, 80
O - Overlay, 87
old files, 178
On Balance Volume, 104, 129
open, 40, 157, 161
open interest, 40, 157, 161
operating system, 157
options exercising
all parcels, 257
costs, 234
several parcels, 256
single parcel, 256
OR, 200, 208, 210
orphaned and corrupt files, 178
oscillators, 93
overbought, 93, 110, 111
overlay
charts, 52, 78
status, 78
oversold, 93, 110, 111
P/E Ratio, 64
P/NTA, 214
page the chart, 75
paper profits, 222
Parabolic Stop and Reverse, 101
parallel line, 80
parameters, 93, 201
Partial bars to period end, 76
password
portfolio, 224
Path for Configuration and Data Files, 150
290
Pay method, 230
Payment Date
autofill, 231
penetration operators, 208
PER, 214
Percentage retracement, 85
Percentage sign, 70
Pfolio equity button, 268
Pivot points, 89
point and figure, 42, 48, 49, 72, 87, 126, 133, 136
box size, 43, 133
price targets, 81
trendlines, 81
portfolio, 224
account reconciliation, 235
benchmarks, 270
charting, 267
create, 224, 228
cumulative growth, 270
daily change in value, 272
equity curves, 267
export summary to Excel, 215
export Summary to Excel, 246
growth rates, 270
import broker transaction lists, 247
information displayed on chart, 90
key performance indicators, 267
monitoring performance, 270
passwording, 265
total value, 236
valuation, 228
portfolio equity curve, 57
Portfolio Equity Curves, 166
Portfolio Manager, 26, 196, 221
Portfolio trades on chart, 64
portrait, 63
portrait orientation, 37
precedence, 209
Precision, 162, 187
Preferences, 125
Premium return, 169
price action, 42
Price and Volume Factors, 152
Price Earnings Ratio, 53, 195
price increment, 80
price number, 80
Price to Net Asset Backing, 53, 64
printer, 53
export to, 174
font, 149
printing
arrangement of charts, 63
chart arrangements, 37
charts, 53, 63
charts, configuring, 152
data files, 173
reports, 242
profitability tester, 26, 199, 216, 219
accounting procedure, 217
report, 220
setup, 217
Profits, 236
projecting trendlines, 51, 74
psychology, 27
purchase, 230
first parcel, 249
payment date, 228
subsequent parcel, 249
transaction date, 228
QP2, 175
Quick chart current file, 54
quick template, 60
Quick Template, 38
Quotes Plus, 175
Quotes Plus Inc QP2® Databases, 23
R - Reversals, 89
range indicators, 94, 100
ranking, 215
rate of change, 106
smoothed, 119
Rate of Return, 116, 119
ratio, 124
READING LIST, 281
realised capital gains, 236
rebased, 72
chart, 49, 124
relative strength chart, 49, 124
reconciling accounts, 222
reconstructions, 162, 167, 168, 169, 195
in portfolio, 252
record, 157
append, 162, 164, 170, 172
inserting, 162, 164
number, 163
structure, 188
reference list, 52, 133, 137, 139, 140, 141, 144, 199, 216
accessing, 141
from chart arrangement, 138
from portfolio, 138, 265
securities, 135
setting, 212
viewing, 141
reference points, 82
Refreshing Charts, 37, 53
registration
final, 197
initial, 22
number, 22
regression line
ordering on slope, 142
relational operator, 200
relative strength chart, 48, 72, 124, 125, 136
Relative Strength Index, 110, 127, 129
Replace fields, 170
Replay charts, 87
Replay saved charts, 36, 59
report
accounts statement, 244
batch printing, 223, 246
capital gains, 244
CSV file, 246
CSV files, 223
dividend transactions, 243
exporting, 246
filter, 214
miscellaneous expenses, 245
portfolio, 223
Portfolio Statistics, 245
profitability of trades, 245
registered accounts, 246
registered brokers, 245
291
traders closing stock, 244
traders sales and costs, 245
transactions, 243
Resave button, 215
Reset downloads, 197
resident data file, 70, 162
restore button, 58
restore maximised chart, 37
Retrace Window, 85
Retracements, 82
reused codes, 173, 255, 268
Reversals, 89
rights, 195
rights exercising
all parcels, 257
several parcels, 256
single parcel, 256
rights or options
purchased, 250
Risk Calculator, 64, 91, 223, 237, 260
rollovers, 253, 254
scrip for scrip, 253
RSI, 110
running time window, 51, 74, 131
Runs function, 205
Runslides, 134
sale
all parcels, 256
of securities, 233
partial, 233
payment date, 228
several parcels, 255
single parcel, 255
transaction date, 228
save configuration, 69
save file, 162, 164
saved chart arrangement, 36, 53, 59, 133
saved chart category, 143
saved charts, 39, 52, 59, 143
saving and retrieving charts, 53
saving data file, 164
Scaffold Exit, 103
Scales, 49
scaling, 130
fixed, 51, 73
scatter diagrams, 47, 50, 123
screen arrangement, 39
Screen Font, 148
Screen Layout, 27
screen output, 184
Scroll Anchor, 75, 154
Scroll Lock, 134
scroll the chart, 74
Second Form, 129
Second user file, 28
Securities, 128
security
code, 136
name, 160
title, 195
Security Transaction dialog box, 230
SELECTED file, 139
Self discipline, 27
sell alert, 200, 208, 210, 213
set scales, 125, 130
share dividends, 223
Shares, 161, 162
short selling, 235, 252
short shortlist, 140
Simple Moving Averages, 96
Simulated Trading, 75
single box reversal, 43
Single Charts, 51
Single moving average, 97
single precision, 155, 187
siren, 69, 184
slideshow, 39, 52, 63, 133, 140, 142, 196
autorun, 52, 135
chart arrangement, 52, 135
replay, 52
saved chart, 133
slippage, 222, 241
Slow Stochastic, 111, 127, 129
Smoothed Rate of Change, 119
snapshots, 144
software requirements, 21
Sorting the Filter List, 215
spawning trendlines, 80, 83
speedkeys, 24, 30, 133, 282
SPI, 40
Spiderweb toolbar button, 197
Spiderweb Toolbar Button, 198
Splat, 30
Split Directories, 191
splits, 162, 167, 168, 184, 195
in portfolio, 233, 252
Spreadsheet programs, 174
SROC, 119
stacked indicators, 121
adding, 30
removing, 31, 121
standard deviations, 99
Stapling of Securities, 257
Start at, 134
status bar, 32, 78
Stepping through Saved Charts, 63
Stochastic, 111, 127, 129
Stop Float, 241
stop loss, 222, 241
alarm, 69
levels, 241
price, 222, 241
risk calculator, 262, 264
stops, 69
trailing, 67
Stops
soft, 68
Structure of a System, 199
Structure of IT data file, 157
Structures, 34
subchart, 31, 128
indicator, 128
size, 76, 150
size quick change, 76, 121
subsector index, 48
Substituting new security, 57
Suppress Line, 131
swing charts, 46, 126
Symbols, 131
Syntax of system criteria, 200
SYSTEM date, 131
system files, 150
292
systems, 199
analysis, 26
complete, 208
filter, 140
filter specifications, 211
multiple tests in a batch, 220
tester, 139, 199
using, 209
systems stops, 219
breakeven stop, 219
inactivity stop, 219
maximum acceptable loss stop, 219
profit target stop, 219
trailing stop, 219
tag list, 52, 140
target date, 213
tax, 234
effects of taxation, 240
rates, 222
Tax Office, 221
taxation, 221
technical analysis, 26, 27, 39
technical criteria, 199
template
quick, 60, 143
Template
Quick, 38
templates, 39, 52, 136, 137, 158, 159, 188
text, 86
deleting, 86
dragging, 87
editing, 86
fixed, 86
moving, 86
Third user file, 28
tick data, 156, 163, 168
Tiled Charts
viewing many, 142
tiling
horizontal, 35, 58
time, 163
time constants, 93, 129
time delay, 52
time number, 80
Title, 160
title bar, 54, 58
Today file, 133, 143
ASX, 144
Commsec, 144
Today File
Kill all, 145
toolbar, 24
buttons, 30
Total Security Profit, 236
Total stop loss, 241
risk calculator, 264
trading range, 93
transactions, 222
deleting and editing, 259
trend channel, 80
trend following indicators, 93
Trend indicator, 119
trendline
deleting, 83
editing, 83
slope, 80
spawning, 83
trendlines, 79, 131, 134
Triple moving averages, 97
trusts, 231
turnover
average daily %t, 237
Turnover, 64
Tutorial, 29
Typos, 194
unadjusted files, 222
uncompleted bar, 76, 153
undo, 54, 89
Unfranked, 232
unit price, 233
unrestricted field, 157, 161
Update from web, 197
Updating data, 155
automatically, 155
manually, 155
updating Insight Trader, 24, 197
User Supplied Extended Fundamental, 64
User Supplied Fundamentals, 196, 214
Utilities, 28
value of money, 50
valuing portfolios, 168
Velocity, 64, 95, 119, 129, 214, 237
Verify disk writes, 184
vertical axis, 74
Vertical line, 84
Vertical tile, 35, 58
view data records, 162, 164
View last reports, 215, 220
Viewing Charts, 52
Viewing latest data, 53
Viewing Trades on your Chart, 220
volatility, 41
volume, 40, 84, 104, 126, 128, 129, 157, 161, 187
logarithmic, 76, 153
moving average, 97
Volume Accumulation, 105, 129
Volume based indicators, 93
volume field, 161
Volume Price Trend Accumulator, 105, 129
Warranty, 7
Watch List, 141
wave files, 69, 152, 184
Web Updater, 196, 197
weeklength, 154
weekly, 31, 50, 70, 76, 86, 200
Welles Wilder, 101, 110, 113
white space, 51, 74, 151
whole of the market, 195
wick, 42
Williams
%R, 111, 117
Larry, 117
window
latest data, 53, 64
moving data, 32
Retrace, 85
Y-value, 85
Windows, 37, 58
Windows 95, 57
withdrawals, 222, 234
Withholding tax, 252
wordprocessor documents, 53
working area, 36, 54, 59
293
WORKING folder
transferring, 151
X-axis, 73, 124, 130
X-projections, 82
Y scale lock, 78
Y-axis, 74, 124, 131
Year 2000 compliance, 25
Y-Projections, 82
Y-value Window, 85
zooming, 31, 51, 74, 86, 134
using Lines Mode, 85
using Zoom submenu, 74
294