1
EPICenter™ Software
Installation and User
Guide
Version 4.0
Extreme Networks, Inc.
3585 Monroe Street
Santa Clara, California 95051
(888) 257-3000
http://www.extremenetworks.com
Published: June, 2002
Part number: 100081-00 Rev. 03
©2002 Extreme Networks, Inc. All rights reserved. Extreme Networks and BlackDiamond are
registered trademarks of Extreme Networks, Inc. in the United States and certain other jurisdictions.
EPICenter, ExtremeWare, ExtremeWare Vista, ExtremeWorks, ExtremeAssist, ExtremeAssist1,
ExtremeAssist2, PartnerAssist, Extreme Standby Router Protocol, ESRP, SmartTraps, Alpine, Summit,
Summit1, Summit4, Summit4/FX, Summit7i, Summit24, Summit48, Summit Virtual Chassis,
SummitLink, SummitGbX, SummitRPS and the Extreme Networks logo are trademarks of Extreme
Networks, Inc., which may be registered or pending registration in certain jurisdictions. The Extreme
Turbodrive logo is a service mark of Extreme Networks, which may be registered or pending
registration in certain jurisdictions. Specifications are subject to change without notice.
Solaris is a trademark of Sun Microsystems, Inc.
All other registered trademarks, trademarks and service marks are property of their respective owners.
2
Contents
Preface
Chapter 1
Introduction
Terminology
17
18
Conventions
18
Related Publications
19
EPICenter Overview
Introduction
21
Summary of Features
Simple Inventory Management
The Alarm System
The Configuration Manager
The Grouping Manager
The IP/MAC Address Finder
Interactive Telnet Applet
ExtremeView Configuration and Status Monitoring
Real-Time Statistics
Topology Views
Enterprise-wide VLAN Management
The ESRP Manager
The STP Monitor
Dynamic Reports
Distributed Server Mode
22
23
23
24
24
25
25
25
25
26
27
27
27
27
28
EPICenter Software Installation and User Guide
3
Security Management
EPICenter Stand-alone Utilities
Chapter 2
4 - Contents
28
29
EPICenter Components
Extreme Networks Switch Management
29
30
Extreme Networks Device Support
31
Third-Party Device Support
31
Installing the EPICenter Software
Installation Overview
33
Server Requirements
Windows NT or Windows 2000
Solaris
34
34
35
Client Requirements
35
Browser Requirements for Reports
36
EPICenter Software Licensing
Obtaining an Evaluation License
Obtaining a Permanent License
Upgrading an Evaluation License
Adding a License for an Optional Product
37
37
38
38
38
Upgrading from a Previous Release
39
Installing on a Windows NT or Windows 2000 System
Adding or Updating the License Key
39
44
Installing on a Solaris System
Required Patches
Local Name Resolution
Installing the EPICenter Server
Adding or Updating a License Key
44
45
45
45
52
Installing the EPICenter Client
Installing the Stand-Alone Client Application in Windows NT
or Windows 2000
Installing the Stand-Alone Client Application in the Solaris
Operating Environment
52
54
55
EPICenter Software Installation and User Guide
Uninstalling the EPICenter Software
Uninstalling the EPICenter Server in Windows NT or
Windows 2000
Uninstalling the EPICenter Stand-Alone Client Application
in Windows NT or Windows 2000
Uninstalling the EPICenter Server in Solaris
Uninstalling the EPICenter Stand-Alone Client Application
in Solaris
Chapter 3
58
58
59
60
61
Starting EPICenter
Running the EPICenter Server Software under Windows
Starting the EPICenter Server
Shutting Down the EPICenter Server Components
Restarting the EPICenter Server Components as Services
63
64
64
65
Running the EPICenter Server Software under Solaris
Starting or Restarting the EPICenter Server
Shutting Down the EPICenter Server Components
66
66
66
The EPICenter Client
67
Running the EPICenter Stand-alone Client
Viewing Reports from the Stand-Alone Client
67
69
Running the EPICenter Client in a Browser
69
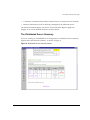
The Network Summary Report Page
The Distributed Server Summary
The “About EPICenter” Page
73
75
76
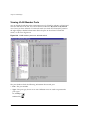
Navigating the EPICenter Applications
The Navigation Toolbar
Main Applet Frame
The Component Tree
The Status/Detail Information Panel
Moving the Component Tree Boundary
Resizing Columns
Sorting Columns
Applet Function Buttons
Printing from EPICenter
77
78
80
82
83
84
84
84
84
86
EPICenter Software Installation and User Guide
Contents - 5
Chapter 4
Chapter 5
6 - Contents
Using the Inventory Manager
Overview of the EPICenter Device Inventory
Gathering Device Status Information
87
88
Displaying the Network Device Inventory
89
Viewing Device Status Information
Viewing Device Information from Pop-up Menus
91
94
Discovering Network Devices
98
Adding Devices and Device Groups
Adding a Device
Creating a Device Group
105
105
107
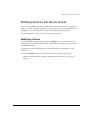
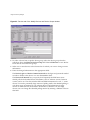
Modifying Devices and Device Groups
Modifying a Device
Modifying a Device Group
109
109
111
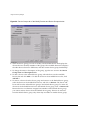
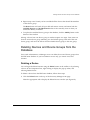
Deleting Devices and Device Groups from the Database
Deleting a Device
Deleting a Device Group
113
113
115
Updating Device Information
116
Configuring Default Access Parameters
117
Finding Devices
119
Displaying Properties
All Device Group Properties
Device Properties
121
121
124
The EPICenter Alarm System
Overview of the EPICenter Alarm System
127
The Alarm Log Browser
Acknowledging an Alarm
Deleting Alarm Log Entries
Deleting Groups of Log Entries
Viewing Alarm Details
Filtering the Alarm Display
Deleting Alarm Log Filters
Pausing All Alarms
129
130
131
131
133
134
137
137
EPICenter Software Installation and User Guide
Chapter 6
Defining Alarms
Creating a New Alarm Definition
Modifying Alarm Definitions
Deleting Alarm Definitions
138
140
151
152
Alarm Categories
Creating a New Alarm Category
Modifying an Alarm Category
Deleting an Alarm Category
152
152
152
153
Threshold Configuration
Creating an Event Rule
Modifying a Rule
Deleting a Rule
Resynchronizing the RMON Rules
Configuring Other SNMP Trap Events
153
158
169
170
171
172
Configuring EPICenter as a Syslog Receiver
172
Setting EPICenter as a Trap Receiver
173
Writing Tcl Scripts for Alarm Actions
The Tcl Scripting Environment
174
174
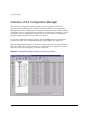
Configuration Manager
Overview of the Configuration Manager
Viewing Device Information from Pop-up Menus
180
182
Uploading Configurations from Devices
187
Archiving Configuration Settings
Device Schedules
Global Schedules
190
190
192
Downloading Configuration Information to a Device
194
Downloading an Incremental Configuration to Devices
Creating an Incremental Configuration File
196
198
Upgrading Software Images
Upgrading Images on Devices
Upgrading Slot Images on Modular Devices
199
199
202
Selecting Software Images
206
EPICenter Software Installation and User Guide
Contents - 7
Chapter 7
Chapter 8
8 - Contents
Specifying the Current Software Versions
207
Performing a Live Software Update
Obtaining New Software Images
208
209
Configuring the TFTP Server
211
Finding Devices
212
Displaying Properties
Device Group Properties
Device Properties
213
213
214
Using the Interactive Telnet Application
Overview of the Interactive Telnet Applet
217
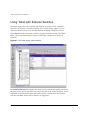
Using Telnet with Extreme Switches
Running ExtremeWare Command Macros
Running a Telnet Session on an Individual Switch
218
219
224
Using Interactive Telnet with Third-Party Devices
227
Viewing Device Information from Pop-up Menus
Properties
Alarms
Browse
EView
Statistics
VLANs
228
228
229
229
229
230
230
Finding Devices
230
Displaying Properties
Device Group Properties
Device Properties
231
231
232
The Grouping Manager
Overview of the Grouping Manager
235
Displaying EPICenter Groups and Resources
Resource Details
Grouping Manager Functions
238
240
242
EPICenter Software Installation and User Guide
Chapter 9
Chapter 10
Creating a New Resource
243
Deleting Resources
245
Adding a Resource as a Child of a Group
246
Removing A Child Resource from a Group
250
Adding Relationships to a Resource
Removing Relationships from a Resource
250
254
Adding and Removing Attributes
255
Searching for a Resource
Setting up a Resource Search
Searching from the Main Toolbar
Searching from the Add Resources or Add Relationship Window
258
258
262
262
Importing Resources
Importing from an LDAP Directory
Importing from a File
Importing from an NT Domain Controller or NIS Server
263
266
268
272
Using the IP/MAC Address Finder
Overview of the IP/MAC Finder Applet
ExtremeWare Software Requirements
273
274
Tasks List Summary Window
275
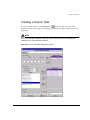
Creating a Search Task
277
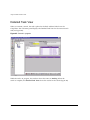
Detailed Task View
Exporting Task Results to a Text File
280
282
Using ExtremeView
Overview of the ExtremeView Application
285
Viewing Device Status Information
287
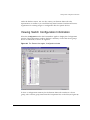
Viewing Switch Configuration Information
293
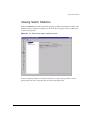
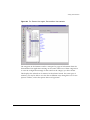
Viewing Switch Statistics
297
Finding Devices
300
EPICenter Software Installation and User Guide
Contents - 9
Chapter 11
10 - Contents
Viewing Device Information from Pop-up Menus
Properties
Alarms
Browse
Statistics
Telnet
VLANs
301
301
303
303
303
304
304
Displaying Properties
Device Group Properties
Device Properties
Slot Properties
Port Properties
304
304
305
306
309
Real-Time Statistics
Overview of Real-Time Statistics
311
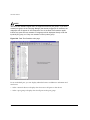
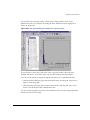
Displaying Multi-port Statistics
313
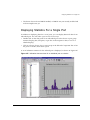
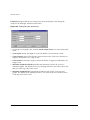
Displaying Statistics For a Single Port
317
Changing the Display Mode
319
Setting Graph Preferences
321
Taking Graph Snapshots
325
Viewing Device Information from Pop-up Menus
Properties
Alarms
Browse
EView
Telnet
VLANs
326
326
327
328
328
328
329
Displaying Properties
Device Group Properties
Device Properties
Slot Properties
Port Properties
329
329
330
330
331
EPICenter Software Installation and User Guide
Chapter 12
Chapter 13
Network Topology Views
Overview of EPICenter Topology Views
333
Displaying a Network Topology View
Map Elements
Map Element Description Panel
334
336
342
Manipulating Topology Views and Maps
Creating a New View or a New Map
Node Placement Criteria in an Auto Populate View
Adding Elements to the Map
Editing the Map
Setting View Properties
Map Viewing Functions
343
344
346
350
355
359
361
Displaying VLAN Information
371
Device Information Views
Device Alarms
Device Browse
Device Statistics
Device Telnet
Device View
Device VLANs
Device Properties
373
373
374
374
375
375
375
376
Using the VLAN Manager
Overview of Virtual LANs
377
Displaying a VLAN
Viewing VLANs on a Switch
Viewing Switches in a VLAN
Viewing VLAN Member Ports
Viewing Device Information from Pop-up Menus
378
381
383
384
385
Adding a VLAN
388
Deleting a VLAN
392
EPICenter Software Installation and User Guide
Contents - 11
Chapter 14
Chapter 15
Chapter 16
12 - Contents
Modifying a VLAN
Modifying a VLAN from the Toolbar
Modifying a VLAN from the Component Tree Menu
393
394
397
Adding and Deleting Protocol Filters
399
The Spanning Tree Monitor
Overview of the Spanning Tree Monitor
403
Displaying STP Domain Information
Displaying STP VLAN Configurations
Displaying STP Device Configurations
Displaying STP Port Information
405
407
408
410
Viewing STP Domain Properties from Pop-Up Menus
STP Properties
VLAN Properties
The Device Pop-Up Menu
411
411
412
412
The ESRP Manager
Overview of the ESRP Manager
417
Viewing ESRP Detail Information
419
Administering EPICenter
Overview of User Administration
Controlling EPICenter Access
The EPICenter RADIUS Server
Setting EPICenter Server Properties
423
424
425
425
Starting the EPICenter Client for the First Time
Changing the Admin Password
425
427
Adding or Modifying User Accounts
428
Deleting Users
429
Changing Your Own User Password
430
EPICenter Software Installation and User Guide
Chapter 17
RADIUS Administration
RADIUS Server Configuration
RADIUS Client Configuration
Disabling RADIUS for EPICenter
432
432
434
434
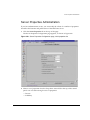
Server Properties Administration
Devices Properties
Scalability Properties
SNMP Properties
Topology Properties
Other Properties
435
436
438
439
441
441
Distributed Server Administration
Configuring a Server Group Member
Configuring a Server Group Manager
442
444
445
Dynamic Reports
Overview of EPICenter Reports
447
Network Summary Report
Devices Managed by the Server
Devices Not Responding
Critical Alarms Defined
Critical Alarms for Last 24 Hours
Unacknowledged Critical Alarms
SNMP Unreachable Alarms
Invalid Login Alarms
Authentication Failure Alarms
VLANs Report
448
451
452
453
453
454
455
455
456
456
Dynamic Reports
457
Viewing Predefined EPICenter Reports
Report Filtering
Server State Summary Report
Device Inventory Report
Slot Inventory Report
Device Status Report
VLAN Summary Report
Interface Report
458
458
460
462
464
465
466
467
EPICenter Software Installation and User Guide
Contents - 13
Resource to Attribute Mapping Report
User to Host Mapping Report
Alarm Log Report
Event Log Report
System Log Report
Configuration Management Log Report
Appendix A
14 - Contents
468
469
470
471
472
473
Printing EPICenter Reports
474
Creating New Reports
Creating or Modifying a Report
Adding a User-Defined Report to the Reports Menu
Debugging
474
475
477
478
Troubleshooting
Troubleshooting Aids
Using the Stand-alone Client Application
Using the Browser-based Client (Windows Only)
481
481
482
EPICenter Client
483
EPICenter Database
485
EPICenter Server Issues
487
VLAN Manager
489
Alarm System
490
ESRP Manager
493
Inventory Manager
494
ExtremeView
495
Grouping Manager
496
Printing
496
Topology
496
STP Monitor
497
Reports
498
EPICenter Software Installation and User Guide
Appendix B
Appendix C
EPICenter Utilities
The DevCLI Utility
Using the DevCLI Commands
DevCLI Examples
500
500
503
Inventory Export Scripts
Using the Inventory Export Scripts
Inventory Export Examples
504
505
507
The SNMPCLI Utility
Using the SNMPCLI Utility
SNMPCLI Examples
508
508
509
Port Configuration Utility
510
The AlarmMgr Utility
Using the AlarmMgr Command
AlarmMgr Output
AlarmMgr Examples
512
512
515
515
The FindAddr Utility
Using the FindAddr Command
FindAddr Output
FindAddr Examples
516
516
519
519
The TransferMgr Utility
Using the TransferMgr Command
TransferMgr Examples
520
520
523
The VlanMgr Utility
Using the VlanMgr Command
VlanMgr Output
VlanMgr Examples
524
524
527
527
The ImportResources Utility
Using the ImportResources Command
ImportResources Examples
529
529
531
EPICenter Database Views
Device Report View
533
Interface Report View
536
EPICenter Software Installation and User Guide
Contents - 15
Appendix D
Appendix E
Database Event Log View
537
Database Alarm Log View
539
Event Types for Alarms
SNMP Trap Events
541
RMON Rising Trap Events
548
RMON Falling Trap Events
548
EPICenter Events
548
EPICenter Backup
EPICenter Log Backups
551
Database Utilities
552
The Validation Utility
Using the DBVALID Command-line Utility
Database Connection Parameters
553
553
554
The Backup Utility
The DBBACKUP Command-line Utility
Database Connection Parameters
Installing a Backup Database
554
554
555
556
Index
16 - Contents
EPICenter Software Installation and User Guide
Preface
This preface provides an overview of this guide, describes guide conventions, and lists
other useful publications.
Introduction
This guide provides the required information to use the EPICenter software. It is
intended for use by network managers who are responsible for monitoring and
managing Local Area Networks, and assumes a basic working knowledge of:
• Local Area Networks (LANs)
• Ethernet concepts
• Ethernet switching and bridging concepts
• Routing concepts
• The Simple Network Management Protocol (SNMP)
NOTE
If the information in the EPICenter Release Note and Quick Start Guide shipped with
your software differs from the information in this guide, follow the Release Note.
EPICenter Software Installation and User Guide
17
Terminology
When features, functionality, or operation is specific to the Summit, Alpine, or
BlackDiamond switch family, the family name is used. Explanations about features and
operations that are the same across all Extreme switch product families simply refer to
the product as the “Extreme device” or “Extreme switch.” Explanations about features
that are the same for all devices managed by EPICenter (both Extreme devices and
others) are simply refer to “devices.”
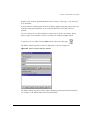
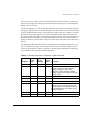
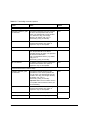
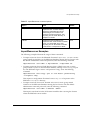
Conventions
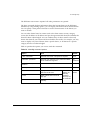
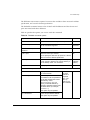
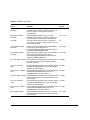
Table 1 and Table 2 list conventions that are used throughout this guide.
Table 1: Notice Icons
Icon
Notice Type
Alerts you to...
Note
Important features or instructions.
Caution
Risk of unintended consequences or
recoverable loss of data.
Warning
Risk of permanent loss of data.
.
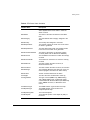
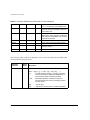
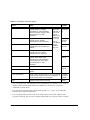
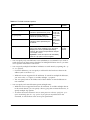
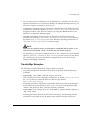
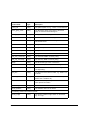
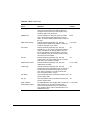
Table 2: Text Conventions
Convention
Description
Screen displays
This typeface represents information as it appears on the screen.
Screen displays
bold
This typeface indicates how you would type a particular command.
The words “enter”
and “type”
When you see the word “enter” in this guide, you must type
something, and then press the Return or Enter key. Do not press the
Return or Enter key when an instruction simply says “type.”
18
EPICenter Software Installation and User Guide
Related Publications
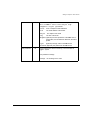
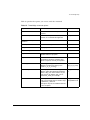
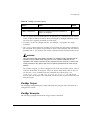
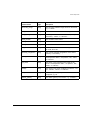
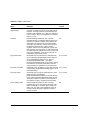
Table 2: Text Conventions (continued)
Convention
Description
[Key] names
Key names appear in text in one of two ways. They may be
•
referred to by their labels, such as “the Return key” or “the Escape
key.”
•
written with brackets, such as [Return] or [Esc].
If you must press two or more keys simultaneously, the key names
are linked with a plus sign (+). For example:
Press [Ctrl]+[Alt]+[Del].
Words in bold type
Bold text indicates a button or field name.
Words in italicized type
Italics emphasize a point or denote new terms at the place where
they are defined in the text.
Related Publications
The EPICenter documentation set includes the following:
• The EPICenter Software Installation and User Guide (the manual you are reading)
• EPICenter SE Release Note and Quick Start Guide
• EPICenter License Agreement
The two manuals and the Release Note can be found online in Adobe Acrobat PDF
format, in the docs subdirectory of the EPICenter installation directory. You must have
Adobe Acrobat Reader version 3.0 or later (available from http://www.adobe.com free of
charge).
Other manuals that you will find useful are:
• ExtremeWare Software User Guide
• ExtremeWare Quick Reference Guide
For documentation on Extreme Networks products, and for general information about
Extreme Networks, see the Extreme Networks home page:
• http://www.extremenetworks.com
Customers with a support contract can access the Technical Support pages at:
• http://www.extremenetworks.com/support/database.htm
EPICenter Software Installation and User Guide
19
The technical support pages provide the latest information on Extreme Networks
software products, including the latest Release Notes, information on known
problems, downloadable updates or patches as appropriate, and other useful
information and resources.
Customers without contracts can access manuals and patches at:
• http://www.extremenetworks.com/support/documentation.asp
20
EPICenter Software Installation and User Guide
1
EPICenter Overview
This chapter describes:
• Features of the EPICenter™ software
• EPICenter software components
Introduction
Today’s corporate networks commonly encompass hundreds or thousands of systems,
including individual end user systems, servers, network devices such as printers, and
internetworking systems. Extreme Networks™ recognizes that network managers have
different needs, and delivers a suite of ExtremeWare™ management tools to meet those
needs.
EPICenter is a powerful yet easy-to-use application suite that facilitates the
management of a network of Summit™, BlackDiamond™, and Alpine™ switches, as well
as selected third-party switches. EPICenter makes it easier to perform configuration and
status monitoring, create virtual LANs (VLANs), and implement policy-based
networking in enterprise LANs with Extreme Networks switches. EPICenter offers a
comprehensive set of network management tools that are easy to use from a client
workstation running EPICenter client software, or from a workstation configured with a
web browser and the Java plug-in.
EPICenter leverages the three-tier client/server architecture framework represented by
Java applets, and can be accessed using Microsoft Internet Explorer or Netscape
Navigator with Sun’s Java Plug-in. The EPICenter application and database support two
EPICenter Software Installation and User Guide
21
EPICenter Overview
of the most popular operating environments in the marketplace, Microsoft Windows
NT/2000 and Sun Microsystems’ Solaris. Integration with HP OpenView and other
third-party network management software products provides additional flexibility.
Summary of Features
In large corporate networks, network managers need to manage systems “end to end.”
The EPICenter software is a powerful, flexible and easy-to-use application for
centralizing the management of a network of Extreme switches and selected third-party
devices, regardless of the network size. The EPICenter software provides the vital
SNMP, HTML, and CLI-based tools you need for network-wide management of
Extreme Networks Summit, Black Diamond, and Alpine switches.
• Network Control. The EPICenter software provides configuration and monitoring of
Extreme Networks’ switches and selected third-party devices anywhere on the
network simultaneously.
• Intelligent Management. Extreme SmartTraps™ (patent pending) automatically
gather switch configuration changes and forward them to the EPICenter server,
thereby minimizing network management traffic. EPICenter separates its “heartbeat”
polling, used to asses a device’s connectivity, from its less frequent and more
data-intensive status polling.
• Hierarchical Displays. Most information, including that found in EPICenter
topology maps, VLAN management, configuration management, and real-time
statistics, is dynamically presented in an easy-to-navigate hierarchical tree.
• Multi-platform capability. The EPICenter server supports both Sun SPARC/Solaris
and Intel/Windows NT 4.0 or Windows 2000. Client applications on either of these
platforms can connect to servers on either platform.
• Support for multiple users with security. Users must log in to the application, and
can be granted different levels of access to the application features.
• Web-based or installed clients. The EPICenter software gives you a choice of
installing client software, or connecting to the EPICenter server through a
web-browser-based client, available on Windows client machines.
• Manage large numbers of devices. The EPICenter server can manage up to 2000
devices with a single installation of the EPICenter software. For even larger
networks you can split the management task among several EPICenter servers in a
distributed server mode that lets you monitor the status of those servers from a
single client.
22
EPICenter Software Installation and User Guide
Summary of Features
Extreme Networks switches and many other MIB-2 compatible devices can be
monitored and controlled from a central interface, without exiting EPICenter to run a
separate program or telnet session. Features such as SmartTraps and the EPICenter
alarm system further maximize network monitoring capability while maintaining
network usage efficiency.
You can organize your network resources into groups (including groups made up of
selected ports from multiple switches) that you can manage as a single entity. You can
set VLAN configurations across the network without having to log into switches
individually. You can search for individual IP addresses and identify their connections
into the network. You can monitor the status of your network devices either visually,
through the ExtremeView applet, or by setting alarms that will notify you about
conditions or events on your network devices. You can get a high-level overview of the
status of your network devices displayed as a hierarchical topology map.
These features and more are described in more detail in the following sections, and in
the remaining chapters of this manual.
Simple Inventory Management
EPICenter’s Inventory Manager applet keeps a database of all the devices managed by
the EPICenter software. Any EPICenter user can view status information about the
switches currently known to the EPICenter database.
The EPICenter Inventory Management applet provides an automatic discovery function.
Users with the appropriate access can use this feature to discover Extreme and other
MIB-2 devices by specific IP address or within a range of IP addresses.
Network devices can also be added to the EPICenter database manually, using the
Inventory Manager Add function. Once a network device is known to the EPICenter
database, you can assign it to a specific device group, and configure it using the VLAN
Manager, the Configuration Manager, or the ExtremeView tool.
EPICenter also provides a command-line utility that lets you create device groups and
import large numbers of devices into the inventory database through scripts, to
streamline the process of adding and organizing devices for management purposes.
The Alarm System
The EPICenter Alarm System provides fault detection and alarm handling for the
network devices monitored by the EPICenter software. This includes Extreme devices
EPICenter Software Installation and User Guide
23
EPICenter Overview
and some third-party devices—those that the EPICenter software can include in its
Inventory database. The Alarm System also lets you define your own alarms that will
report errors under conditions you specify, such as repeated occurrences or exceeding
threshold values. You can specify the actions that should be taken when an alarm
occurs, and you can enable and disable individual alarms.
Fault detection is based on SNMP traps, RMON traps, Syslog messages, and some
limited polling. The Alarm System supports SNMP MIB-2 and the Extreme Networks
private MIB. You can also configure alarms based on certain event thresholds, or on the
content of Syslog messages. When an alarm occurs you can specify actions such as
sending e-mail, forwarding a trap, running a program, running a script, or sounding an
audible alert.
The Configuration Manager
The EPICenter Configuration Manager applet provides a mechanism and a graphical
interface for uploading and downloading configuration files to and from managed
devices. It can also download ExtremeWare software images and BootROM images to
Extreme Networks devices, or to Extreme modules that include software .
The Configuration Manager provides a framework for storing the configuration files, to
allow tracking of multiple versions. Configuration file uploads can be performed on
demand, or can be scheduled to occur at regular times—once a day, once a week, or at
whatever interval is appropriate.
The Grouping Manager
One of the powerful features of the EPICenter software is its ability to take actions on
multiple devices or resources with a single user action. The Grouping Manager
facilitates this by letting you organize various resources into hierarchical groups, which
can then be referenced in other applets. You can then take actions on a group, rather
than having to specify the individual devices or ports that you want to affect.
You can also create or import named resources such as users and workstations, which
can be mapped through the Grouping Manager to IP addresses and ports. This
capability is especially important in relationship to the optional Policy Manager applet,
which takes advantage of these types of resources to simplify the creation of QoS and
Access List policies.
24
EPICenter Software Installation and User Guide
Summary of Features
The IP/MAC Address Finder
The IP/MAC Address Finder applet lets you search for specific network addresses
(MAC or IP addresses) and identify the Extreme Networks switch and port on which
the address resides. You can also use the IP/MAC Finder applet to find all addresses on
a specific port or set of ports. You can export the results of your search to a file , either
on the server or on your local (client) system.
Interactive Telnet Applet
The ExtremeView Telnet feature includes a macro capability that lets you create and
execute scripts of CLI commands repeatedly on multiple devices in one operation. You
can save your macros for reuse at other times. Results of the most recent macro run on
each device are saved into log files, and can be viewed from within the Telnet applet.
You can also use the interactive Telnet capability to view and modify configuration
information for some Cisco and 3COM devices as well as for Extreme Networks
devices.
ExtremeView Configuration and Status Monitoring
With the ExtremeView applet, any Extreme Networks switch can be monitored through
a front panel image that provides a visual device representation, and can be configured
without leaving the EPICenter client to invoke another program or Telnet session.
The ExtremeView applet displays detailed information about the status of Extreme
switches in a number of categories. Any EPICenter user can view status information
about the network devices known to the EPICenter database. Users with the
appropriate access permissions can also view and modify configuration information for
those switches through the ExtremeWare Vista graphical user interface, accessed
through the ExtremeView applet.
Real-Time Statistics
The Real-Time Statistics feature of the EPICenter software provides a graphical
presentation of utilization and error statistics for Extreme switches in real time. The data
is taken from Management Information Base (MIB) objects in the etherHistory table of
the Remote Monitoring (RMON) MIB. You can choose from a variety of styles of charts
and graphs as well as a tabular display.
EPICenter Software Installation and User Guide
25
EPICenter Overview
You can view data for multiple ports on a device, device slot, or within a port group,
optionally limiting the display to the “top N” ports (where N is a number you can
configure). You can also view historical statistics for an individual port. If you choose to
view a single port, the display shows the value of the selected variable(s) over time, and
can show utilization history, total errors history, or a breakdown of individual errors.
In addition, the Real-Time Statistics applet lets you “snapshot” a graph or table as a
separate browser page. You can then save, print, or e-mail the page.
Topology Views
The EPICenter software’s Topology applet allows you to view your network
(EPICenter-managed devices and the links between Extreme Networks devices) as a set
of maps. These maps can be organized as a tree of submaps that allow you to represent
your network as a hierarchical system of campuses, buildings, floors, closets, or
whatever logical groupings you want.
The Topology applet can automatically add device nodes to your map as devices are
added to EPICenter software’s device inventory. The EPICenter software automatically
detects and adds links that exist between Extreme Networks devices, and organizes the
device nodes into submaps as appropriate. The links between devices provide
information about the configuration and status of the links.
You can customize the resulting maps by creating submaps, moving map elements
within or between supmaps, adding new elements, such as links, “decorative”
(non-managed) nodes, and text, and customizing the look and labeling of the
discovered nodes themselves. In addition, options are available to organize and
optimize the map layout to display very large numbers of devices with the minimum of
device and link overlap.
The Topology applet also provides information about the VLANs configured on devices
in a topology view. Using the Display VLANs feature, you can visually see which links
and devices are configured for a selected VLAN, or select a specific device or link to see
what VLANs are configured on that device.
Finally, from a managed device node on the map, you can invoke other EPICenter
functions such as the alarm browser, telnet, real-time statistics, a front panel view, the
VLAN Manager, or ExtremeWare Vista for the selected device.
26
EPICenter Software Installation and User Guide
Summary of Features
Enterprise-wide VLAN Management
A virtual LAN (VLAN) is a group of location- and topology-independent devices that
communicate as if they were on the same physical local area network (LAN).
The EPICenter VLAN Manager is an enterprise-wide application that manages many
aspects of VLANs on Extreme Network’s Summit, BlackDiamond, and Alpine switches.
Any EPICenter user can view status information about the VLANs known to EPICenter
across the network. Users with the appropriate access can create and delete VLANs,
add and remove ports from existing VLANs, and create and modify the protocol filters
used to filter VLAN traffic. When creating or modifying a VLAN, you can get
EPICenter to determine whether there is connectivity between the devices you have
included in the VLAN, and if not, it can recommend what ports and devices you should
add to achieve connectivity.
The ESRP Manager
The Extreme Standby Router Protocol (ESRP) is a feature of ExtremeWare that allows
multiple switches to provide redundant layer 3 routing services, as well as layer 2
redundancy, to users. The ESRP Manager displays the status of ESRP-enabled VLANs
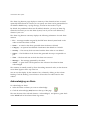
and the ESRP-enabled switches in those VLANs. You can view a summary status for all
the ESRP-enabled VLANs being monitored by the EPICenter software. You can also
view detailed information for an individual ESRP-enabled VLAN and the switches in
those VLANs.
The STP Monitor
The EPICenter Spanning Tree Protocol (STP) Monitor module displays information
about STP domains network-wide at the domain, VLAN, device, and port levels. The
STP Monitor can monitor STP domains configured on devices running ExtremeWare
6.2.2 or later. Earlier versions of ExtremeWare supported the Spanning Tree protocol,
but STP information via SNMP was not available until version 6.2.2.
Dynamic Reports
EPICenter Reports are HTML pages that can be accessed separately from the main
EPICenter user interface, without logging in to the Java user interface. The Reports
module can also be accessed from the EPICenter Navigation toolbar. A Summary
Report is also displayed on the main EPICenter “home” page that provides basic
information on the status of EPICenter devices and alarms. From this report you can
access other more detailed reports.
EPICenter Software Installation and User Guide
27
EPICenter Overview
The EPICenter reports are HTML pages that do not require Java capability, and thus can
be accessed from browsers that do not have the ability to run the full EPICenter user
interface. This means reports can be loaded quickly, even over a dial-up connection, and
it also provides the ability to print the reports.
The Reports capability provides a number of predefined HTML reports that present
information from the EPICenter database. You can also create your own reports by
writing Tcl scripts.
Distributed Server Mode
To manage very large numbers of network devices, or devices that are geographically
distributed, the management task can be divided up betweeen multiple EPICenter
servers. Each server in the server group is updated at regular intervals with network
summary and status information from the other servers in the group. From the
EPICenter home page, a client attached to any one of the servers in the server group
can view summary status information from the other servers in the group in addition to
the standard Network Summary report. The EPICenter client also lets the user easily
navigate between the different servers in the group to see detailed management
information about the devices managed by thosse servers.
Security Management
In order to access EPICenter features, a user must log in with a user name and a
password.
EPICenter provides three access levels:
• Monitor—users who can view status information only.
• Manager—users who can modify device parameters as well as view status
information.
• Administrator—users who can create, modify and delete EPICenter user accounts as
well as perform all the functions of a user with Manager access.
The EPICenter Admin applet enables configuration of EPICenter as a Remote
Authentication Dial In User Service (RADIUS) server. As an alternative, it can be
configured as a RADIUS client, or RADIUS authentication functionality can be disabled.
When EPICenter acts as a RADIUS server, it can be contacted by RADIUS clients (such
as Extreme Networks switches) to configure access permissions for Extreme switches,
and to authenticate user names and passwords. The use of the RADIUS server avoids
28
EPICenter Software Installation and User Guide
EPICenter Components
the need to maintain user names, passwords, and access permissions in each switch,
and instead centralizes the configuration in one location in EPICenter.
EPICenter Stand-alone Utilities
The EPICenter software provides several stand-alone utilities or scripts that streamline
the process of getting information into and out of the EPICenter database, or facilitate
certain device troubleshooting functions. These are the following:
• The DevCLI utility lets you add devices to and remove devices from the EPICenter
inventory database via command, and supports batch additions and deletions
specified via a file.
• A set of Inventory Export scripts that enable you to export information from the
EPICenter database about the devices that are being managed. The information is
provided in a format suitable for import into other applications, such as a
spreadsheet.
• The SNMPCLI utility provides SNMP Get, GetNext, and SNMP walk features that
may be needed to obtain device MIB information for troubleshooting.
• A set of utilities that provide a command line interface to several EPICenter software
functions. These include the AlarmMgr utility, FindAddr utility, TransferMgr utility,
and VlanMgr utility. These utilities enable you to perform certain EPICenter
functions from the command line (or through a script) rather than through the
EPICenter graphical user interface. Results from the Alarm Manager utility and the
Find Address utility can be output to a file.
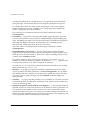
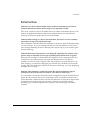
EPICenter Components
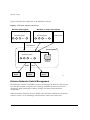
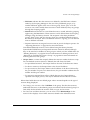
The EPICenter software is made up of three major functional components:
• The EPICenter Server, which is based on the Tomcat Java server. The server is
responsible for downloading applets, running servlets, managing security, and
communicating with the database.
• A Relational Database Management System (RDBMS), Sybase Adaptive Server
Anywhere, which is used as both a persistent data store and a data cache.
• EPICenter client applications. This can be an installed client application that runs on
a Windows NT/2000 or Solaris system. For Windows systems only, the client can
also be a set of Java applets downloaded from the server to the client on demand
into a Java-enabled browser running the Java plug-in ( Java 1.3.1_03 ).
EPICenter Software Installation and User Guide
29
EPICenter Overview
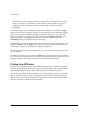
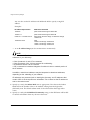
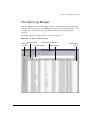
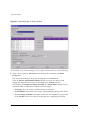
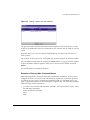
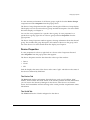
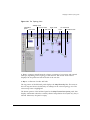
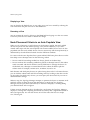
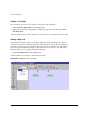
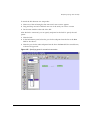
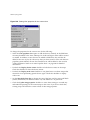
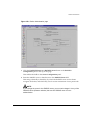
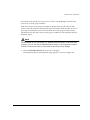
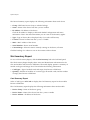
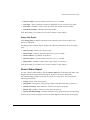
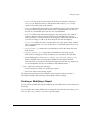
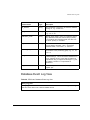
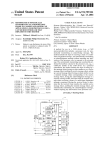
Figure 1 illustrates the architecture of the EPICenter software.
Figure 1: EPICenter software architecture
Windows client system
Windows or Solaris client system
Browser with Java plug-in
Installed client
EPICenter applets
Browser
EPICenter applets
HTML reports
TCP sockets
Server system
EPICenter server
Application objects
Relational
database
SNMP
Extreme
device
Telnet
Extreme
device
Third-party
device
XM_021
Extreme Networks Switch Management
The EPICenter software uses SNMP to monitor and manage the devices in the network.
To avoid the overhead of frequent device polling, the EPICenter software also uses a
mechanism called SmartTraps to identify changes in Extreme Networks device
configuration.
When an Extreme Networks switch is added to the EPICenter database, the EPICenter
software creates a set of SmartTraps rules that define what events (status and
30
EPICenter Software Installation and User Guide
Extreme Networks Device Support
configuration changes) the EPICenter server needs to know about. These rules are
downloaded into the Extreme Networks switch, and the EPICenter server is
automatically registered as a trap receiver. Subsequently, whenever a status or
configuration change takes place, the ExtremeWare software in the switch uses the
SmartTraps rules to determine if the EPICenter server should be notified. These changes
can be changes in device status, such as fan failure or overheating, or configuration
changes made on the switch through the ExtremeWare CLI or ExtremeWare Vista.
The EPICenter server does a “heartbeat” check, by default every five minutes, of all the
devices it is managing to determine if the devices are still accessible. It also does a full
poll of each device at longer intervals. This interval for this less frequent status polling
can be adjusted on each individual device. The EPICenter software also gives you the
ability to gather device status at any time using the Sync feature in the Inventory
Manager applet.
Extreme Networks Device Support
Extreme Networks devices running the ExtremeWare software version 2.0 or later, are
supported by most features in the EPICenter system, including the VLAN Manager and
the graphical display features of the ExtremeView applet. Some features, such as ESRP,
or the Policy Manager, require more recent versions of the ExtremeWare software.
NOTE
See the EPICenter Release Note and Quick Start Guide or the Extreme Networks web
site for the most current information on device support in the EPICenter software.
Third-Party Device Support
Any device running a MIB-2 compatible SNMP agent can be discovered by the
EPICenter Inventory manager, and saved in the Inventory database. All devices in the
database can also appear on a topology map. The EPICenter alarm system can handle
SNMP traps from any device in the inventory database, including RMON traps from
devices with RMON enabled. The Real-Time Statistics module can display statistics for
any device with RMON enabled, the IP/MAC Finder applet supports all devices
running MIB-2 and the Bridge MIB, with the exception of user mapping, which is
specific to Extreme devices.
EPICenter Software Installation and User Guide
31
EPICenter Overview
In the Telnet applet, you can use the Telnet feature with any device that supports a
Telnet interface. In the ExtremeView applet, all Extreme devices and selected third-party
devices (including certain Cisco and 3COM devices) can display a device-specific front
panel view in the Summary view. In addition, vendor-specific generic images are
available for additional devices, such as Sun and Nortel, and a standard generic image
can be displayed for all other “unknown” devices. New device images and
configuration description files may be added over time—check the Extreme Networks
web site for information on new device support.
32
EPICenter Software Installation and User Guide
2
Installing the EPICenter Software
This chapter describes:
• Hardware and software requirements for the EPICenter server and client
• Procedure for obtaining an evaluation or permanent license key for the software
• Installing the EPICenter server software under either Windows NT or Windows 2000
• Installing the EPICenter client software under either Windows NT or Windows 2000
• Setting up Internet Explorer for use with the EPICenter client on a Windows system
• Installing the EPICenter server software under the Solaris Operating Environment
• Installing the EPICenter client software under the Solaris Operating Environment
Installation Overview
The EPICenter software includes a set of Java applications, a Web Server, database
software, and a client application. The installation process installs all of these
components on a Windows NT 4.0 or Windows 2000 system, or under Solaris 2.6,
Solaris 7, or Solaris 8.
The EPICenter software offers two different clients. One is an installed client that runs
as a stand-alone application on the client workstation. The other client runs within a
web browser (Microsoft Internet Explorer under Windows) with the Java Plug-in
version 1.3.1 or later. The browser-based client does not require installation, you just
point your browser to the EPICenter server. The installed client is installed along with
the EPICenter server, and can be installed separately on a client workstation.
EPICenter Software Installation and User Guide
33
Installing the EPICenter Software
NOTE
See the EPICenter Release Note and Quick Start Guide for the most current
information on installation requirements.
The EPICenter server installation process installs two components:
• The EPICenter Database Engine
• The EPICenter Web Server
Under Windows NT/2000 you can run these as services, or just as an application.
Running them as services is recommended.
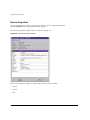
Server Requirements
The EPICenter server can run under Microsoft Windows NT 4.0, Microsoft Windows
2000, or Sun Microsystems’ Solaris Operating Environment, SPARC Platform Edition.
Windows NT or Windows 2000
For installation under Windows NT or Windows 2000, the requirements are:
• Microsoft Windows NT 4.0 or Windows 2000 running on an Intel platform.
• 128 MB RAM (256 MB recommended, especially if you plan to run an EPICenter
client on the same system).
• Disk space depends on the file system used on the disk as well as the number of
items (devices, ports, alarms etc.) that the system must handle:
— 130 MB of disk space for the server installation.
— Up to 150-200 MB for runtime usage (log files, database, user-defined scripts,
reports, and so on).
— If the disk is using the FAT file system, the EPICenter server could use 20% of the
disk (i.e 300MB on a 1 GB disk, 600 MB on a 2GB disk and so on). Installing on a
FAT file system is not recommended.
You can tell the type of file system by looking at the disk properties. Right-click
on the drive letter in the Windows Explorer or My Computer windows.
• 300 Mhz Pentium-compatible processor.
34
EPICenter Software Installation and User Guide
Client Requirements
• CDROM drive (for installation).
• A network connection.
Solaris
For installation under Solaris, the requirements are:
• Solaris Operating Environment 2.6, Solaris 7, or Solaris 8 with required patches
already installed.
• 128 MB RAM (256 MB recommended, especially if you plan to run an EPICenter
client on the same system).
• As much as 300 MB disk space:
— 130 MB of disk space for the server installation
— Up to 150-200 MB for runtime usage (log files, database, user-defined scripts,
reports and so on)
• CDROM drive (for installation)
• A network connection
Both the Solaris 2.6 and Solaris 7 operating environments may require patches for
EPICenter to function properly. Make certain these patches have been installed before
you install the EPICenter server software. See “Required Patches” on page 45 for more
information on obtaining any needed patches.
For the most current information on required patches, see the EPICenter Release Note and
Quick Start Guide that accompanies your EPICenter software, or check the Extreme
Networks web site at www.extremenetworks.com.
Client Requirements
The EPICenter software provides two options for connecting to an EPICenter server
from a client system: a stand-alone client application, or a browser-based client you can
run from a web browser such as Microsoft Internet Explorer.
On Solaris-based systems, only the stand-alone client is supported.
EPICenter Software Installation and User Guide
35
Installing the EPICenter Software
NOTE
The browser-based client is supported on Windows-based systems only.
The EPICenter client requires a monitor that supports 1024 x 768 resolution, and at least
16-bit color. Your system Display Settings must be set for 65536 colors.
The client can also use large amounts of memory. 128 MB of RAM is recommended for
best performance (256 MB is recommended if you plan to run the client on the same
system as the EPICenter server).
The browser-based client is a Java-based application that runs within a web browser
such as Microsoft Internet Explorer. Under Windows NT 4.0 or Windows 2000, install
Internet Explorer 5.0, or Internet Explorer 5.5 with Service Pack 1, and the Java 1.3.1
plug-in.
NOTE
See the EPICenter Release Note and Quick Start Guide shipped with the software for
the latest information about configuration requirements.
Browser Requirements for Reports
Even if you are running the stand-alone client application, a browser is required to run
the EPICenter HTML reports. The EPICenter dynamic reports are HTML pages that do
not require Java capability, and thus can be accessed from browsers that do not have the
ability to run the full EPICenter user interface. The following browser clients are
supported for displaying reports:
• Under Windows NT 4.0 or Windows 2000, install Internet Explorer 5.0, or Internet
Explorer 5.5 with Service Pack 1
• On a Solaris system, install Netscape Navigator/Communicator 4.7 or later
To launch the browser and view the EPICenter HTML reports on a Solaris system, you
need to include Netscape on the search path. If you do not want to add Netscape to the
search path, edit the launchURL.sh script from either the EPICenter server install
directory (by default, /opt/epc4_0) or the EPICenter client install directory (by
default, /opt/epc4_0_client). In the launchURL.sh script, replace the word
“netscape” with the full path to the Netscape program installed on your system.
36
EPICenter Software Installation and User Guide
EPICenter Software Licensing
EPICenter Software Licensing
In order to log in to the EPICenter server from an EPICenter client, the product must be
configured with a valid license. Optional products such as the Policy Manager also
require their own license keys.
An evaluation license allows you to run the product for 30 days. A permanent license
has no time limit. You can install the software without a license key, but you will not be
able to connect to it from an EPICenter client. (If you need to install the product
without a license key, you can add the key at a later time using a license key upgrade
utility.)
You must obtain both evaluation and permanent license keys from the Extreme
Networks licensing web site. The license key should be sent to you as e-mail within
minutes of submitting your request.
Both evaluation and permanent license keys are 14-character keys that start with EP and
are followed by 12 additional characters that are a combination of upper- and
lower-case case alphabetic characters, numbers, and special characters such as “+”
If you have purchased the product, you should have received an activation key, found
on the License Agreement included in your software package. This key starts with
“AC,” and can be used to obtain a permanent license key. You do not need an activation
key to obtain an evaluation license key.
NOTE
See the EPICenter Release Note and Quick Start Guide shipped with the software for
the latest information about obtaining a license key.
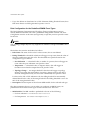
Obtaining an Evaluation License
To obtain an evaluation license key, use your browser to connect to the license page at
http://www.extremenetworks.com/go/epickey.htm.
Select the option to obtain an evaluation license key. You will be asked to enter your
name, company information, and other similar information, and an e-mail address to
which your license key should be sent.
You license key will be sent to you by return e-mail.
EPICenter Software Installation and User Guide
37
Installing the EPICenter Software
Obtaining a Permanent License
To obtain a permanent license key, use your browser to connect to the license page at
http://www.extremenetworks.com/go/epickey.htm.
Select the option to obtain a permanent license key.
Fill in the requested information, and enter your activation key. The activation key is a
14-character key that starts with “AC” and is found on the License Agreement included
with your software package.
Your permanent license key will be sent to you by return e-mail.
Upgrading an Evaluation License
To update an evaluation license of EPICenter to a permanent license, use the instlic
utility.
In Windows, run the instlic command using the Run command from the Windows
Start menu, or from an MS-DOS command window. From Solaris, run the command
from a command shell. The instlic utility is found in the EPICenter install directory,
by default epc4_0 in Windows, or /opt/epc4_0 on a Solaris system.
Enter the command followed by the 14-character license key, as follows:
instlic <license_key>
See “Adding or Updating the License Key” on page 44 (for Windows) or “Adding or
Updating a License Key” on page 52 (for Solaris) for further instructions.
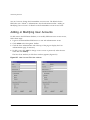
Adding a License for an Optional Product
When you purchase a product option such as the EPICenter Policy Manager, you
receive a separate key to enable the optional module. If you purchase the optional
module at the same time as the main EPICenter software, you can use the use the
optional module key when you do the EPICenter installation, and it will enable both
the EPICenter software and the additional module.
However, if you purchase the additional module at a later time, you must update your
license key to enable the new module.
To add a license key for an optional EPICenter product module, use the instlic utility.
38
EPICenter Software Installation and User Guide
Upgrading from a Previous Release
In Windows, run the instlic command using the Run command from the Windows
Start menu, or from an MS-DOS command window. From Solaris, run the command
from a command shell. The instlic utility is found in the EPICenter install directory,
by default epc4_0 in Windows, or /opt/epc4_0 on a Solaris system.
Enter the command followed by the 14-character license key, as follows:
instlic <license_key>
See “Adding or Updating the License Key” on page 44 (for Windows) or “Adding or
Updating a License Key” on page 52 (for Solaris) for further instructions.
Upgrading from a Previous Release
If you have the previous software release installed, the installation script can also
migrate your database information to the new EPICenter software version. The
installation process will upgrade only the previous release of the software—for the
EPICenter SE release 4.0, you can upgrade from EPICenter 3.0 or 3.1, but not from any
earlier versions of the ExtremeWare Enterprise Manager software. If you are running
one of the older versions (ExtremeWare Enterprise Manager 1.0, 1.1, 2.0, or 2.1) you
must do a new install of the EPICenter 4.0 software.
Installing on a Windows NT or Windows 2000
System
The following sections assume that Microsoft Windows NT 4.0 or Windows 2000 is
already running.
NOTE
For information on installing and running Windows NT or WIndows 2000, refer to the
documentation supplied with your Microsoft Windows software.
To install the EPICenter software components under Windows NT you must have
Windows NT administrator privileges on that system.
EPICenter Software Installation and User Guide
39
Installing the EPICenter Software
If you have the previous software release installed, the installation script will also
migrate your database information to the new EPICenter software version.
CAUTION
If you are running an evaluation version of the EPICenter software, DO NOT
REINSTALL the EPICenter software to upgrade to a permanent license if you want to
retain the information in your EPICenter database. Using the license installation utility
will preserve the contents of the database.
To update an evaluation copy of the EPICenter server to a licensed copy without
reinitializing the database, follow the update procedure described in “Adding or
Updating the License Key” on page 44.
NOTE
If you already installed the EPICenter client software, you need to UNINSTALL the client
software before you begin the EPICenter server installation.
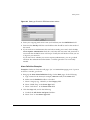
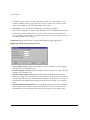
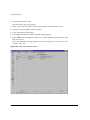
To install the EPICenter server, follow these steps:
1 Close any open applications.
2 Insert the CDROM into the CDROM drive.
3 In most cases, the Extreme Networks EPICenter Welcome screen appears
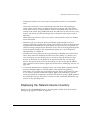
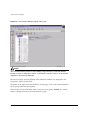
automatically. If it does not:
a Open My Computer or Windows Explorer, and go to your CDROM drive.
b Go to the nt directory, open the server sub-directory, and start setup.exe.
The EPICenter Welcome screen appears.
4 Follow the on-screen instructions to progress through the Welcome screen.
5 If you have a previous version of EPICenter installed, you are notified that the
services will be stopped in order to install the new EPICenter software. If this is
acceptable, click Yes.
6 Click Yes to accept the license agreement.
7 Enter your company information.
8 Enter your license key and click Next to continue.
40
EPICenter Software Installation and User Guide
Installing on a Windows NT or Windows 2000 System
The license key is a case-sensitive string starting with “EP” and followed by 12
characters (a mixture of uppercase and lowercase letters, numbers, and special
characters) that you obtained from the Extreme Networks web site.
The license key is NOT the same as the activation key, which starts with “AC,” and
found on the License Agreement shipped with your purchased product. You use the
activation key to obtain a permanent license key from the Extreme Networks web
site at http://www.extremenetworks.com/go/epickey.htm
See “EPICenter Software Licensing” on page 37, or the EPICenter Release Notes and
Quick Start Guide for details on obtaining an evaluation or permanent license key.
If you have purchased the EPICenter software and an additional module such as the
Policy Manager, you can use the key you received for the optional module here. It
will enable both the EPICenter software and the additional module.
If you do not yet have a key, you can still install the product, and then update the
key later using the instlic.exe utility. See “Adding or Updating the License Key”
on page 44.
— To skip entering a key, leave the field blank and click Next.
— A warning box pops up; click OK to continue.
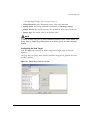
9 In the Destination dialog box, choose one of two options:
— Accept the default target drive and folder displayed in the Destination Directory
box.
— Click Browse and select or enter a new folder, a new drive, or both.
NOTE
Make sure there are no spaces in the directory name.
If you are installing on a disk that uses the FAT file system rather than the NTFS file
system, a warning message pops up when you click Next. This is because under the
FAT file system, the EPICenter software can take up as much as 20% of your
partition, regardless of the size of the partition.
10 Accept the default program folder, EPICenter 4.0, or enter a different program folder
name, and click Next.
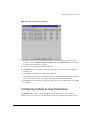
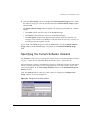
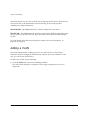
In the Database Server Information dialog box, enter a number into the Port field for
the TCP port that the EPICenter Web Server will use to communicate with the
database, or accept the default (10551). You can use any port number (a number
between 1024 and 65535 is recommended) except a port number already in use by
another process.
EPICenter Software Installation and User Guide
41
Installing the EPICenter Software
NOTE
Extreme Networks recommends that you choose a port number that is not currently
registered at Internet Assigned Numbers Authority (IANA). To check if a port number
is registered, go to http://www.iana.org/assignments/port-numbers.
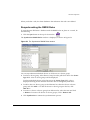
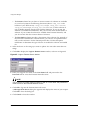
11 In the Get HTTP Port dialog box, you are asked for two ports that the EPICenter
Web Server will use:
— The HTTP Port for communication with clients (default 80).
— The Admin Port used by the EPICenter web server (default 8007).
Accept any or all of the default port numbers, or enter different port numbers.
You can use any port number (a number between 1024 and 9999 is recommended)
except:
— The port number you just entered for the database TCP port.
— Any port number already in use by another process.
12 If there is an EPICenter 3.0 or 3.1 server running as a service, a notice appears
advising you that the services are being shut down.
The installation software then copies the EPICenter program files from the CD to
your system.
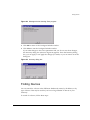
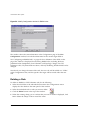
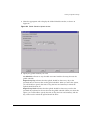
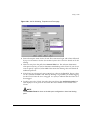
13 When the files have been copied, the Install as a Service dialog box asks if you want
to install the EPICenter database and web server components as Windows NT
services.
— Click Yes to install the EPICenter components as services. This is strongly
recommended. If the EPICenter components run as services, they will be started
automatically on system boot, and will persist across user logins and logouts.
NOTE
You must have NT Administrator privileges to install the EPICenter components as
services.
In addition, if you want to be able to import user and host information from a
Windows NT Domain Controller, the EPICenter server must run with permissions
that allow it to get user information from a Domain Controller.
— Click No if you do not want to install the components as services.
42
EPICenter Software Installation and User Guide
Installing on a Windows NT or Windows 2000 System
14 If you are upgrading from the previous release of the EPICenter software, you are
asked whether you want to copy the database and other persistent data to the new
installation. Click Yes to copy the data, or No to continue without doing so.
If you answer Yes, an MS-DOS window will appear briefly while the database
contents are dumped from the old database and loaded into the new database.
NOTE
This installation utility will upgrade the database from EPICenter 3.0 or 3.1 to
EPICenter 4.0. Database upgrades from earlier versions are not supported.
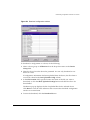
15 If you elect to copy your previous data, the EPICenter installation process also
notifies you that you must copy from the old installation any switch software image
files or report files you may have modified or added. The installation process does
not copy these files. You can do this after the installation has finished.
16 The installation procedure now installs the license key. An MS-DOS window will
appear briefly while this occurs.
If the license key you entered is invalid, an error window pops up. If you did not
enter a license key, a warning pops up. In either case, you can use the instlic
utility to enter a valid license key after you have completed your installation.
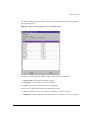
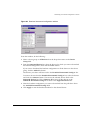
17 In the final dialog box, EPICenter Setup Complete, you can do the following.
— Click the checkbox to indicate you want to view the Readme file
— If you have installed the EPICenter components as services, click the second
checkbox to indicate you want your system to be restarted. If you choose not to
restart your system at this time, you must either restart the server or start the
services manually before you can log in to the EPICenter server from a client.
— Click Finish to complete the installation process.
18 If you added or modified any reports, or added new switch software images to the
previous EPICenter installation, you should copy these files to the new installation.
You must manually copy the following files:
• Image files you have placed in the subdirectories under the
<EPICenter_install_dir>\user\tftp directory
• Reports you have modified or added in the
<EPICenter_install_dir>\user\reports\html or
<EPICenter_install_dir>\user\reports\tcl directories
Copy these to the corresponding directories in the new installation.
EPICenter Software Installation and User Guide
43
Installing the EPICenter Software
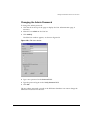
Adding or Updating the License Key
To update an evaluation license of EPICenter to a permanent license, or to install a
license key after the original installation is complete, use the instlic utility provided.
CAUTION
DO NOT reinstall the software if you have any data or configurations of value in the
EPICenter database. Re-installation will re-initialize the database.
To update your license key, follow these steps:
1 Select Run... from the Start menu, or start an MS-DOS command window.
NOTE
Because you must enter the license key on the command line, you cannot run this
utility from a Windows Explorer or My Computer window.
2 Enter the command <EPICenter_install_dir>\instlic <key>
<EPICenter_install_dir> is the directory (path) where you installed the
EPICenter components. If you installed in the default directory, the path is
c:\EPC4_0\
<key> is the 14-character license key, starting with “EP,” that you obtained from
Extreme Networks. Type the key exactly as it is shown in the e-mail you received
from Extreme Networks. The key is case sensitive.
For example: c:\EPC4_0\instlic EP1a2B3c4D5+eF
If the license update is successful, the message “License Installed” is displayed.
If the update is not successful, the message “Invalid argument key : <key>” is
displayed. <key> is the license key you entered with the instlic command. Verify that
you typed the key exactly as shown in the e-mail you received from Extreme Networks.
Installing on a Solaris System
The EPICenter server software, version 4.0, is supported under Solaris 2.6, Solaris 7, and
Solaris 8. See “Server Requirements” on page 34 for the hardware requirements. Also,
check the EPICenter Release Notes and Quick Start Guide for any additional issues.
44
EPICenter Software Installation and User Guide
Installing on a Solaris System
Required Patches
Both the Solaris 2.6 and Solaris 7 operating environments require patches for the
EPICenter software to function properly. Make certain these patches have been installed
before you install the EPICenter server software.
For the most current information on required patches, see the EPICenter Release Note and
Quick Start Guide that accompanies your EPICenter software, or the Extreme Networks
web site at www.extremenetworks.com.
Sun Microsystems makes these patches available on the Java download site in the form
of tar files. They can be found at:
http://www.sun.com/software/solaris/jre/download.html
On this page, select Java 2 Standard Edition (J2SE) 1.3.0_03 Production Release for
Solaris, English, SPARC Edition. The patches listed for this release apply to the 1.3.1
Plug-in as well.
You must register or log in, and then you will be presented with the download page
that includes Solaris patch bundles.
Local Name Resolution
The Solaris system on which EPICenter is installed must be able to resolve both its own
local name and its domain name. For example if you install EPICenter on a system
named system1, then it must be able to resolve both system1 and its domain name,
such as system1.company.com. You can test for this by attempting to ping the system
using both the local name and the domain name. If there are problems resolving either
of these names, make sure the etc/hosts file contains the correct information.
Installing the EPICenter Server
The instructions that follow assume that you are running in a command shell or Xterm
window.
You can install the EPICenter components without being logged in as root, as long as
you do not use port numbers less than 1024 (for example, port 80 for the EPICenter web
server, which is the default).
EPICenter Software Installation and User Guide
45
Installing the EPICenter Software
CAUTION
When you install the EPICenter Server, it initializes the database. If you attempt to
re-install the server once you have installed it, the installation process reinitializes the
database, and your existing data and configurations will be lost.
To update an evaluation copy of the EPICenter software to a licensed copy without
reinitializing the database, follow the update procedure described in the section “Adding
or Updating a License Key” on page 52.
NOTE
If you already installed the EPICenter client software, you need to UNINSTALL the client
software before you begin the EPICenter server installation.
To install the EPICenter server software, follow these steps:
1 Insert the CDROM into the CDROM drive.
2 If you are running CDE, the contents of the CDROM are displayed in the File
Manager. Go to the sol directory.
To run from an Xterm window:
cd /cdrom<x>/sol
where <x> is your CDROM drive number (e.g. cdrom0). The volume label of the
installation CD is epc40b<xx>, where <xx> is the build number, for example
epc40b34.
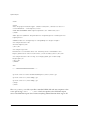
3 Run the installation script:
./install.sh
The EPICenter Welcome message appears as follows:
******************************************************************
Welcome to the Extreme Networks EPICenter
install program. This program will install:
EPICenter version 4.0.0 on this system.
******************************************************************
46
EPICenter Software Installation and User Guide
Installing on a Solaris System
Please review the following software license terms
and conditions. You will need to accept this license
to continue the installation. Press space to page
through the license.
Press <enter> to view the license:
4 When you press [Enter], the text of the license is displayed. You can use the space
bar to page through it. When you reach the end, you are asked:
Do you agree to the above conditions? (Y/N):
5 Enter Y if you agree and want to proceed. Enter N to terminate the installation
process. This question does not have a default, you must enter Y or N.
6 Next, you are prompted for the directory where the EPICenter server software
should be installed:
Please enter the directory in which the software will be installed.
The default directory is /opt/epc4_0, but the product may be installed
anywhere.
Install Directory [/opt/epc4_0]:
Enter the directory or accept the default (/opt/epc4_0).
NOTE
Make sure there are no spaces in the directory names.
If you specify a directory that does not exist, you are asked whether it should be
created:
/opt/epc4_0: No such directory.
Do you wish to create it? (y/n)[y]
Assuming you want to create the directory, accept Y as the default. If you answer N,
the script will assume the directory already exists.
7 The installation script now copies and installs the EPICenter files:
Installing EPICenter files...
After copying a number of files, the following message appears:
File copy complete.
Configuring Installation.
At this point additional files are copied and the EPICenter installation tree is created,
and filled out. This will take several minutes.
When the files are complete, you are asked for a set of configuration information.
EPICenter Software Installation and User Guide
47
Installing the EPICenter Software
To configure EPICenter, we will need to ask you for some information.
In most case the default answers will work correctly.
8 First you are asked whether you want to upgrade from a previous installation of
EPICenter. You can upgrade from EPICenter 3.1.
*** Upgrade Parameters
If there is a previous installation of EPICenter installed,
you may import the database from the previous
installation. If there is no previous install, or you would
like to start from scratch, select new installation.
Would you like to upgrade from a previous install? (Y/N) [N]:
Answer Y to upgrade.
If you answer Yes, the install script asks for the location of the previous version of
EPICenter.
Old install directory [/opt/epc3_1]:
Accept the default or enter the actual location (full path name).
9 Next, you are asked for a license key.
*** License Key
Please enter the license key for the product.
This will be a string starting with EP followed by 12 characters.
To obtain a license (evaluation or permanent) visit the web site
http://extremenetworks.com/go/epickey.htm
Refer to the product release notes for more information on obtaining
a license key. Enter s to skip and install the license later.
Please enter the license key:
The license key is NOT the same as the activation key, which starts with “AC,” and
is found on the License Agreement shipped with your purchased product. You use
the activation key to obtain a permanent license key from the Extreme Networks
web site at http://www.extremenetworks.com/go/epickey.htm
See “EPICenter Software Licensing” on page 37, or the EPICenter Release Notes and
Quick Start Guide for details on obtaining an evaluation or permanent license key.
48
EPICenter Software Installation and User Guide
Installing on a Solaris System
If you do not yet have a key, you can still install the product, and then update the
key later using the instlic utility. See “Adding or Updating a License Key” on
page 52.
If you have purchased the EPICenter software and an additional module such as the
Policy Manager, you can use the key you received for the optional module here. It
will enable both the EPICenter software and the additional module.
10 Next, you are asked to enter a port for communication between the Web server and
the database server:
*** Database Parameters
EPICenter will run an SQL database server on this machine. The database
needs the name of this machine and an unused port to listen on.
Please enter the port for the database: [10551]
Accept the default (10551) for the TCP port that the EPICenter Web Server will use
to communicate with the database, or enter a different port number. You can use any
port number (a number between 1024 and 65535 is recommended) except a port
number already in use by another process.
NOTE
Extreme Networks recommends that you choose a port number that is not currently
registered at Internet Assigned Numbers Authority (IANA). To check if a port number
is registered, go to http://www.iana.org/assignments/port-numbers.
11 You are now asked for three ports that the EPICenter Web Server will use.
*** Web Server Parameters
EPICenter runs as a web server and by default accepts HTTP requests
on port 80. You may specify an alternative. Additionally EPICenter needs
another unused port for server administration.
If you are not sure what to enter, the defaults
should be acceptable.
Please enter the http port for the web server: [80]
Please enter the http port for the admin web server: [8007]
EPICenter Software Installation and User Guide
49
Installing the EPICenter Software
Accept any or all of the default port numbers, or enter different port numbers.
You can use any port number (a number between 1024 and 9999 is recommended)
except:
— The port number you just entered for the database TCP port.
— Any port number already in use by another process.
12 Finally, you are asked to confirm the configuration parameters:
*** Configuration
Please review the following items.
Upgrade
License
Database Port
HTTP Port
HTTP Admin Port
=
=
=
=
=
NO
<the
<the
<the
<the
key you entered or “s”>
port you entered or 10551>
port you entered or 80>
port you entered or 8007>
Are these correct? (Y to accept / N to re-enter) [N]:
13 If you accept the parameters by entering Y, the installation script will finish with the
following messages:
Installing License...
License properties = Type: License, Version: 4
License installed.
Done.
Updating ./extreme/WEB-INF/web.xml
Updating ./tomcat/conf/server.xml
If you are upgrading from an earlier version of EPICenter, you will also see the
following:
*** Database Upgrade
Upgrading Database...
Upgrading from EPICenter 3.1
Generating sql files...
Dumping data from tables in old database ...
Loading data into tables in new database ...
50
EPICenter Software Installation and User Guide
Installing on a Solaris System
Database Upgrade Complete.
Next, you are asked to move or copy any previous switch software images or
uploaded switch configuration files.
from: /export/home/epc3_1/user/tftp
to: /export/home/epc4_0/user/tftp
If you modified any reports or created custom reports, you are asked to move or
copy these files from:
/export/home/epc3_1/user/reports/html
and /export/home/epc3_1/user/reports/tcl
to /export/home/epc4_0/user/reports/html
and /export/home/epc4_0/user/reports/tcl
Next, the installation process creates a script and some symbolic links.
Adding EPICenter to /etc/init.d
Adding link from rc3.d to /etc/init.d/
Adding link from rc2.d to /etc/init.d/
14 Finally, you are given the opportunity to have the EPICenter server started for you.
Would you like to start the server now? (Y/N): n
Answer Yes to start the server immediately, or No if you want to start it at a later
time.
The final messages are:
The EPICenter software installation is complete.
Once the server is running, you can run the client in
a supported web browser with the following URL:
http://<host>:<port>/
INSTALL COMPLETE
<host> is the name of the system you’ve just installed on, and <port> is the HTTP
port you entered (or 80 if you accepted the default).
EPICenter Software Installation and User Guide
51
Installing the EPICenter Software
Adding or Updating a License Key
To update an EPICenter evaluation license to a permanent license, or to install a license
key after the original software installation is complete, use the instlic utility provided.
CAUTION
DO NOT reinstall the software if you have any data or configurations of value in the
EPICenter database. Re-installation will re-initialize the database.
Run the installation script found in the EPICenter installation directory:
<install_dir>/instlic <key>
<install_dir> is the directory (path) where you installed the EPICenter
components.
<key> is the 14-character license key, starting with “EP,” that you obtained from
Extreme Networks. Type the key exactly as it is shown in the e-mail you received
from Extreme Networks. The key is case sensitive.
For example, if you installed in the default directory, enter:
/opt/epc4_0/instlic EP1a2B3c4D5+eF
You must have write permission for the EPICenter install directory.
If the license update is successful, the message “License Installed” is displayed in
the xterm or command window.
If the update is not successful, the message “Invalid argument key : <key>” is
displayed. <key> is the license key you entered with the instlic command. Verify that
you typed the key exactly as shown in the e-mail you received from Extreme Networks.
Installing the EPICenter Client
The EPICenter software provides two options for connecting to an EPICenter server
from a client system: a stand-alone client application, or a browser-based client you can
run from a web browser such as Microsoft Internet Explorer.
On Solaris-based systems, only the stand-alone client is supported.
52
EPICenter Software Installation and User Guide
Installing the EPICenter Client
NOTE
The browser-based client is supported on Windows-based systems only.
When you run the EPICenter stand-alone client on Solaris-based systems, unset the
following localization environment variables:
• LANG
• LC_MONETARY
• LC_NUMERIC
• LC_COLLATE
• LC_TIME
• LC_CTYPE
• LC_MESSAGES
In order to run the EPICenter web browser client, web browser software must be
installed. An EPICenter client can run on a system with a different operating system
than the EPICenter server.
Under Windows NT, or Windows 2000, install Microsoft Internet Explorer 5.0 with the
Java Plug-in version 1.3.1, or Internet Explorer 5.5 with Service Pack 1 and the Java
Plug-in.
To download the latest version of Internet Explorer, go to
http://www.microsoft.com/ie/
If you do not have the required Java plug-in installed when you start the EPICenter
client, you will be prompted to download it, and will be led through the brief
installation process. This obtains the plug-in from the Sun Microsystems web site, and
requires Internet access.
You can also install the Java Plug-in directly from the EPICenter browser-based client
Start-up page. See Chapter 3 for details on starting the client and obtaining the plug-in,
if needed.
EPICenter Software Installation and User Guide
53
Installing the EPICenter Software
Installing the Stand-Alone Client Application in Windows
NT or Windows 2000
The following instructions assume that Microsoft Windows NT or Windows 2000 is
already running.
NOTE
If you installed the EPICenter server software, the client has already been installed as
part of the server installation. Do not re-install the client.
To install the stand-alone client application on a client-only workstation, do the
following:
1 Close any open applications.
2 Insert the CDROM into the CDROM drive.
3 If the CD starts up automatically, click cancel to exit the server installation process,
the do the following steps. If the CD does not start up automatically, follow these
steps:
a Open My Computer or Windows Explorer, and go to your CDROM drive.
b Go to the nt directory, open the client sub-directory, and start setup.exe.
The EPICenter Client Welcome screen appears.
4 Follow the on-screen instruction to progress through the Welcome screen.
5 Click Yes to accept the license agreement.
6 Enter your company information and click Next to continue.
7 In the Choose Destination Location dialog box, choose one of two options:
• Accept the default target drive and folder displayed in the Destination Folder
box.
• Click Browse and select or enter a new folder, a new drive, or both.
NOTE
Make sure there are no spaces in the directory names.
8 Accept the default program folder, EPICenter 4.0 Client Application, or enter a
different program folder name and click Next.
54
EPICenter Software Installation and User Guide
Installing the EPICenter Client
9 In the Server Information dialog box, enter the name or IP address of the server to
which you want to connect into the Server field. Enter the HTTP port to use to
connect to the server in the HTTP Port field. The port must match the HTTP port
configured for the EPICenter server that you entered into the Server field. The
default is port 80.
Click Next to continue the client installation process.
NOTE
You must enter both the Server and HTTP port information, or leave both fields
empty. If you leave the fields empty, you can enter the server and port information
each time you run the client.
10 The installation software then copies the EPICenter Client files from the CD to your
system.
11 In the final dialog box, Setup Complete, you can do the following:
• Click the checkbox to indicate you want to view the Read Me file and start the
EPICenter client application.
• Click Finish to complete the installation process.
Installing the Stand-Alone Client Application in the Solaris
Operating Environment
The instructions that follow assume that you are running in a command shell or Xterm
window.
NOTE
If you installed the EPICenter server software, the client has already been installed as
part of the server installation. Do not re-install the client.
To install the stand-alone client application on a client-only workstation, do the
following:
1 Insert the CDROM into the CDROM drive.
2 If you are running CDE, the contents of the CDROM are displayed in the File
Manager. Go to the sol directory, then to the client sub-directory.
To run an Xterm window:
EPICenter Software Installation and User Guide
55
Installing the EPICenter Software
cd /cdrom<x>/sol/client
where <x> is your CDROM drive number (e.g. cdrom0). The volume label of the
installation CD is epc40b<xx>, where <xx> is the build number, for example
epc40b34.
3 Run the installation script:
./client.sh
The EPICenter Client Welcome message appears as follows:
******************************************************************
Welcome to the Extreme Networks EPICenter Client
install program. This program will install:
EPICenter Client version 4.0.0 on this system.
******************************************************************
Please review the following software license terms
and conditions. You will need to accept this license
to continue the installation. Press space to page
through the license.
Press <enter> to view the license:
4 When you press [Enter], the text of the license is displayed. You can use the space
bar to page through it. When you reach the end, you are asked:
Do you agree to the above conditions? (Y/N):
5 Enter Y if you agree and want to proceed. Enter N to terminate the installation
process. This question does not have a default, you must enter Y or N.
6 Next, you are prompted for the directory where the EPICenter Client software
should be installed.
Please enter the directory in which the software will be installed.
The default directory is /opt/epc4_0_client, but the product may be
installed
anywhere.
Install Directory [/opt/epc4_0_client]:
Enter the directory or accept the default (/opt/epc4_0_client).
56
EPICenter Software Installation and User Guide
Installing the EPICenter Client
NOTE
Make sure there are no spaces in the directory names.
If you specify a directory that does not exist, you are asked whether it should be
created:
/opt/epc4_0_client: No such directory. Do you wish to create it? (y/n)
[y]
Assuming you want to create the directory, accept Y as the default. If you answer N,
the script will assume the directory already exists.
7 The installation script now copies and installs the EPICenter Client files:
Installing EPICenter Client files...
After copying a number of files, the following message appears:
File copy complete.
Configuring Installation.
At this point, additional files are copied and the EPICenter Client installation tree is
created and filled out. This will take several minutes.
When the files are complete, you are asked for a set of configuration information.
To configure the EPICenter client, we will need to ask you for some
information. In most case the default answers will work correctly.
Please enter the host name for the EPICenter server: [] localhost
Please enter the http port for the EPICenter server: [80]
The Server Name is the server name or IP address of the EPICenter server to which
the client should connect.
The Server Port is the HTTP port that the client will use to communicate with the
server (default is 80).
8 You are asked to confirm the configuration parameters:
*** Configuration
Please review the following items.
Server Name
Server Port
= localhost
= 80
Are these correct? (Y to accept / N to re-enter) [N]:
EPICenter Software Installation and User Guide
57
Installing the EPICenter Software
9 If you accept the parameters by entering Y, the installation script will finish with the
following message:
Would you like to start the client now? (Y/N):
Enter Y to start the EPICenter client now, or N to start it at a later time.
The final messages are:
The EPICenter Client software installation is complete.
INSTALL COMPLETE
When you run the EPICenter stand-alone client on Solaris-based systems, unset the
following localization environment variables:
• LANG
• LC_MONETARY
• LC_NUMERIC
• LC_COLLATE
• LC_TIME
• LC_CTYPE
• LC_MESSAGES
Uninstalling the EPICenter Software
To uninstall the EPICenter software, you must first shut down the server components
(database and web server). Then you can remove the program components from your
system.
Uninstalling the EPICenter Server in Windows NT or
Windows 2000
Under either of these Windows Operating Systems versions, you can run the EPICenter
server components as services, or as regular applications. The uninstall procedure is
slightly different for these two situations.
To uninstall the EPICenter server software and all of the EPICenter components,
including the stand-alone client, do the following:
58
EPICenter Software Installation and User Guide
Uninstalling the EPICenter Software
1 Shut down the EPICenter components if they are still running.
If they are running as services:
a From the Start menu, highlight Settings, then select the Control Panel.
b Double-click Services to display the Services Properties window.
c
Highlight EPICenter 4.0 Server and click Stop to stop the EPICenter 4.0 Server
d Stop the EPICenter 4.0 Database Engine in the same manner.
If they are running as applications:
a From the Start menu, highlight Programs, then EPICenter 4.0, then select Stop
EPICenter 4.0 Server. This opens an MS-DOS command window and shuts down
the EPICenter server and database.
2 From the Control Panel folder, double-click Add/Remove Programs. This displays
the Add/Remove Program Properties window (Add/Remove Programs window
under Windows 2000).
3 From the list of installed programs, select EPICenter 4.0 and click Add/Remove (or
Change/Remove in Windows 2000). Follow the instructions to remove the
component.
4 If the Add/Remove utility is not able to remove all the files, it will inform you of
that fact. You must then delete the remaining files manually.
Uninstalling the EPICenter Stand-Alone Client Application
in Windows NT or Windows 2000
To uninstall the stand-alone client on a client-only workstation, do the following:
1 From the Control Panel folder, double-click Add/Remove Programs. This displays
the Add/Remove Program Properties window (Add/Remove Programs window
under Windows 2000).
2 From the list of installed programs, select EPICenter 4.0 Client Application and
click Add/Remove (or Change/Remove in Windows 2000). Follow the instructions
to remove the application.
3 If the Add/Remove utility is not able to remove all the files, it will inform you of
that fact. You must then delete the remaining files manually.
EPICenter Software Installation and User Guide
59
Installing the EPICenter Software
Uninstalling the EPICenter Server in Solaris
To remove the EPICenter server software from a Solaris host, stop the server using the
stopserv command, then remove the all the files in the installation directory.
To remove the EPICenter server software, including the stand-alone client, follow these
steps:
1 Run the stopserv command found in the root installation directory.
The installation directory is the directory (path) where you installed the EPICenter
components.
For example, if you installed in the default directory, enter:
/opt/epc4_0/stopserv
This shuts down the EPICenter server if it is running.
2 Make the parent of the installation directory the current directory, and remove all
files from the directory and its sub-directories.
For example, if you installed using the default directory path, /opt/epc4_0, enter:
cd opt
3 Remove all files from the installation directory tree.
For example, if you installed using the default directory path, enter:
rm -rf epc4_0
This removes all the EPICenter components, including the database and the
stand-alone client, from the system.
4 The EPICenter installation created a script, EPICenter, in the /etc/init.d directory,
and links to /etc/init.d in the /etc/rc2.d and etc/rc3.d directories. You should
remove these as well:
cd /etc/init.d
rm EPICenter
cd /etc/rc2.d
rm K10EPICenter
cd /etc/rc3.d
rm S90EPICenter
The EPICenter software is now completely uninstalled.
60
EPICenter Software Installation and User Guide
Uninstalling the EPICenter Software
Uninstalling the EPICenter Stand-Alone Client Application
in Solaris
To uninstall the stand-alone client on a client-only workstation, do the following:
1 Make the parent of the installation directory the current directory, and remove all
files from the directory and its sub-directories.
For example, if you installed using the default directory path, /opt/epc4_0_client,
enter:
cd opt
2 Remove all files from the installation directory tree.
For example, if you installed using the default directory path, enter:
rm -rf epc4_0_client
This removes the EPICenter stand-alone client from the system.
EPICenter Software Installation and User Guide
61
Installing the EPICenter Software
62
EPICenter Software Installation and User Guide
3
Starting EPICenter
This chapter describes:
• Starting the EPICenter Server.
• Launching an EPICenter Client.
• Navigating the EPICenter pages.
When you log in for the first time after installing the EPICenter server software, there
are only two user accounts enabled—an Administrator account “admin,” and a user
account “user” with Monitor access privileges. Neither account has a password. Follow
the instructions in Chapter 16 to change the admin password and to create additional
EPICenter user accounts.
Running the EPICenter Server Software under
Windows
The following instructions assume that the Windows NT operating system is already
running, and that the EPICenter server software is already installed.
If you have installed the EPICenter components as services under Windows NT, the
EPICenter Server and database component will start automatically when you boot the
server. This is the recommended method of installing EPICenter.
EPICenter Software Installation and User Guide
63
Starting EPICenter
Starting the EPICenter Server
If you have not installed the EPICenter server components as a service, you must start
the server manually after you boot your server system. You can do this from the
Windows NT Start menu.
The EPICenter Server consists of two components:
• The EPICenter Database Engine
• The EPICenter Web Server
Both components must be running in order to run the EPICenter client applets.
To start the EPICenter Server and database components, follow these steps:
1 From the Start menu, highlight Programs, then EPICenter 4.0 to display the
EPICenter menu.
2 Click Start EPICenter 4.0 Server. This runs runserv.exe, a program that starts the
two components in the required order.
Two windows are displayed briefly as the EPICenter Server starts up:
• Sybase Adaptive Server Anywhere. An icon representing this window is placed on
the right side of the Windows task bar.
• An MS-DOS window that shows the processes being started.
If you need to start the server manually, you can use the runserv command in an
MSDOS command window to start the server:
1 Change to the EPICenter install directory, cd <EPICenter_install_directory>
2 Enter the command runserv
You can also select Run from the Start menu and enter the command
<EPICenter_install_directory>\runserv
Shutting Down the EPICenter Server Components
There may be occasions when you need to shut down the EPICenter server, such as to
upgrade a license key from an evaluation to a permanent license, or to add an optional
module license.
64
EPICenter Software Installation and User Guide
Running the EPICenter Server Software under Windows
Components Running as Services
If the EPICenter server components are running as services, follow these steps to shut
them down:
1 Open the Control Panel folder.
2 From the Control Panel, double-click Services. This displays the Services Properties
window. You must have NT Administrator privileges to access this function.
3 From the list of installed programs select EPICenter 4.0 Server and click Stop.
4 Repeat the same actions for the EPICenter 4.0 Database Engine.
The EPICenter 4.0 server should be stopped before the database to avoid error
messages.
Components Running as Applications
If the EPICenter server components are running as applications, you can shut it down
directly from the EPICenterprograms menu.
1 From the Start menu, highlight Programs, then EPICenter 4.0 to display the
EPICenter menu.
2 Click Stop EPICenter 4.0 Server. This runs stopserv.exe, a program that starts the
two components in the required order.
Restarting the EPICenter Server Components as Services
If you have installed the EPICenter server components as services, follow these steps to
restart them:
1 From the Start menu, open the Control Panel folder.
2 From the Control Panel folder, double-click Services. This displays the Services
Properties window. You must have NT Administrator privileges to access this
function.
3 From the list of installed programs select EPICenter 4.0 Database Engine and click
Start.
4 Repeat the same action for the EPICenter 4.0 Server
5 If you want to change the start-up parameters, click Startup... instead of Start.
For example, if you plan to import users from an NT Domain Controller through the
Grouping Manager, the EPICenter 4.0 server must be running with permissions that
enable it to get user information from the Domain Controller. If you do not have
EPICenter Software Installation and User Guide
65
Starting EPICenter
those permissions as you are currently logged on, you can specify a different log on
account for the EPICenter web server as a start-up parameter:
— In the Log On As: section of the Startup... pop up window, enter the account
name and password for a user that has the appropriate permissions to access the
Domain Controller.
Running the EPICenter Server Software under
Solaris
The following instructions assume that you are using a command or Xterm window
running the C shell.
Starting or Restarting the EPICenter Server
To run the EPICenter Server:
1 Set the current directory:
cd <install_dir>
<install_dir> is the directory (path) where you installed the EPICenter
components. If you installed in the default directory, the path is /opt/epc4_0.
2 Execute runserv to start the two EPICenter components in the required order.
runserv &
Shutting Down the EPICenter Server Components
To shut down the EPICenter Server:
1 Set the current directory:
cd <install_dir>
<install_dir> is the directory (path) where you installed the EPICenter
components. If you installed in the default directory, the path is /opt/epc4_0.
2 Execute stopserv to shut down the EPICenter components in the required order.
stopserv &
66
EPICenter Software Installation and User Guide
The EPICenter Client
The EPICenter Client
On Windows NT or Windows 2000 systems, the EPICenter software provides two
options for connecting to an EPICenter server from a client system:
• A stand-alone client application. This is the recommended client option.
• A browser-based client you can run from Microsoft Internet Explorer.
On Solaris-based systems, only the stand-alone client is supported.
The stand-alone client is installed along with the EPICenter server on the system where
the server resides. The stand-alone client can also be installed by itself on any system
you want to use as an EPICenter client. See Chapter 2 for instructions on installing the
client on a system without the EPICenter server.
For Windows NT 4.0 or Windows 2000, the browser-based client is a Java applet that is
downloaded from the EPICenter server whenever you run it, and requires the following
software on the client:
• Internet Explorer 5.0, or Internet Explorer 5.5 with Service Pack 1, and the Java
1.3.1_03 plug-in.
Running the EPICenter Stand-alone Client
To start the EPICenter stand-alone client interface on a system different from where the
EPICenter server is installed:
1 From the Start menu, highlight Programs, then EPICenter 4.0 Client to display the
EPICenter Client menu.
2 Select Client Application to start the EPICenter client.
An MS-DOS window appears briefly before the EPICenter Client Login window
opens, as shown in Figure 2.
To run the stand-alone client on the same system as the EPICenter server:
1 From the Start menu, highlight Programs, then EPICenter 4.0 to display the
EPICenter menu.
2 Select EPICenter 4.0 Client to start the EPICenter client.
EPICenter Software Installation and User Guide
67
Starting EPICenter
If you need to start the client manually, you can use the runclient command in an
MSDOS command window to start the server:
1 Change to the EPICenter install directory, cd <EPICenter_install_directory>
2 Enter the command runclient
You can also select Run from the Start menu and enter the command
<EPICenter_install_directory>\runclient
Figure 2: EPICenter installed client Login window
3 In the Server Hostname field, type the name or IP address of the server you want to
connect to. If you are running the client on a system where an EPICenter server is
installed, that server name will appear by default in the Server Hostname field.
4 Type the HTTP port to use to connect to the server in the HTTP Port field. The
default is port 80. The port must match the HTTP port configured for the EPICenter
server.
5 If you already have an EPICenter user account, type your EPICenter user name in
the User field.
68
EPICenter Software Installation and User Guide
Running the EPICenter Client in a Browser
• If you are the network administrator logging in to the EPICenter server for the
first time since it has been installed, log in as “admin.”
You will be able to change the administrator password (strongly recommended) and
to create additional user accounts.
• If you are a new user without your own account on the EPICenter server, type
“user” as the User Name. You will be able to view information in the various
modules, but will not be able to change any configurations.
6 Type your password in the Password field.
Both default names (“user” and “admin”) initially have no password, so you can
leave the field blank.
7 Click Login.
If you are using an evaluation copy of the EPICenter, a dialog box appears notifying
you how much longer the copy is valid.
Click OK.
The Network Summary Report page appears, as shown in Figure 5 on page 74.
For information on the Network Summary Report, see “The Network Summary
Report Page” on page 73.
When you disconnect from an EPICenter server, the Login page appears again, allowing
you to log in again, to the same server or to a different EPICenter server.
To exit the EPICenter client, click Quit.
Viewing Reports from the Stand-Alone Client
EPICenter’s HTML reports are always displayed in a browser window, even if you are
running the stand-alone client. See “Browser Requirements for Reports” on page 36 in
Chapter 2 for supported browsers.
Running the EPICenter Client in a Browser
NOTE
The browser-based client is supported on Windows-based systems only.
EPICenter Software Installation and User Guide
69
Starting EPICenter
To start the EPICenter client in a browser window:
1 Launch your web browser.
2 Enter the following URL:
http://<host>:<port>/
In the URL, replace <host> with the name of the system where the EPICenter server
is running. Replace <port> with the TCP port number that you assigned to the
EPICenter Web Server during installation.
NOTE
If the EPICenter server uses the default web server port, 80, you do not need to
include the port number.
The EPICenter Start-up page opens. Figure 3 shows the Start-up page in Internet
Explorer under Windows NT.
70
EPICenter Software Installation and User Guide
Running the EPICenter Client in a Browser
Figure 3: The EPICenter browser client start-up page
From the Start-up page you can run the EPICenter client interface, view the online
documentation, or log into the EPICenter reports module.
• To launch the EPICenter client interface, click the Launch EPICenter link. This
requires that the Java Plug-in version 1.3.1_03 be installed in your browser.
If the required version of the plug-in is not installed, you will be prompted to
download it, and will be led through the brief installation process. This obtains the
plug-in from the Sun Microsystems web site, and requires Internet access.
You can also install the Java Plug-in directly, if you know you do not have the
correct version installed, or if you encountered problems downloading it. Click the
Get Java PlugIn link, which will install the required version from the EPICenter
server installation. This requires access to the system where the EPICenter server is
installed, and does not require Internet access.
EPICenter Software Installation and User Guide
71
Starting EPICenter
The EPICenter Login page appears, as shown in Figure 4.
• From the start-up page you can view a variety of reports about EPICenter devices
and functions, without requiring the Java Plug-in. Click the View Reports link to log
into the EPICenter Reports applet, which provides a number of HTML-based
reports. See Chapter Chapter 17 for more information on using these reports.
• Click the View Documentation link to display the online EPICenter Software
Installation and User Guide. This requires that you have a copy of Adobe’s Acrobat
Reader (version 4.0 or later) installed.
If you do not have the Acrobat Reader installed, you can download it free of charge
from Adobe’s web site, at http://www.adobe.com.
Figure 4: The EPICenter browser client login page
72
EPICenter Software Installation and User Guide
The Network Summary Report Page
To log into EPICenter:
1 If you already have an EPICenter user account, type your EPICenter user name in
the User Name field.
• If you are the network administrator logging in to the EPICenter server for the
first time since it has been installed, log in as “admin.”
You will be able to change the admin password (strongly recommended) and to
create additional user accounts.
• If you are a new user without your own account on the EPICenter server, type
“user” as the User Name. You will be able to view information in the various
modules, but will not be able to change any configurations.
2 Type your password in the Password field.
Both default names (“user” and “admin”) initially have no password, so you can
leave the field blank.
3 Click Login.
If you are using an evaluation copy of the EPICenter, a dialog box appears notifying
you how much longer the copy is valid.
Click OK.
The Network Summary Report page appears, as shown in Figure 5 on page 74.
NOTE
If you have problems with the client display the first time you try to run EPICenter
after installing it, try clearing all browser cache (both memory and disk), then closing
and re-opening the browser.
The Network Summary Report Page
The Network Summary Report page displays a simple HTML report with some basic
statistics on the status of your network. Click on the values in the right-hand column
(Number Of) to display a detail report about a specific status item.
EPICenter Software Installation and User Guide
73
Starting EPICenter
Figure 5: The Network Summary Report page
From this summary report you can view the following reports:
• Summary status of all the devices known to the EPICenter server.
• Summary status of the devices known to the EPICenter server that are not
responding to EPICenter queries.
• A summary of the state of alarm definitions that have severity levels of Critical or
Major. By default there are three such definitions.
• A summary of critical alarms that have occurred in the last 24 hours.
• A summary of critical alarms in the last 24 hours that have not been acknowledged.
• A summary of SNMP Unreachable alarms that have occurred in the last 24 hours.
• A summary of Invalid Login alarms that have occurred in the last 24 hours.
74
EPICenter Software Installation and User Guide
The Network Summary Report Page
• A summary of Authentication Failure alarms that have occurred in the last 24 hours.
• Summary information on all VLANs being managed by the EPICenter server.
The Network Summary Report can also be accessed from the Reports applet. See
Chapter 17 for a more detailed discussion of these reports.
The Distributed Server Summary
If you are running in a Distributed server configuration, a Distributed Server summary
appears below the Network Summary, as shown in Figure 6.
Figure 6: Distributed Server Summary Report
EPICenter Software Installation and User Guide
75
Starting EPICenter
Each row in the summary provides the status of one of the EPICenter server group
members. It provides the following information about each server:
• The server name. Clicking on the server name initiates the Dynamic Reports module
for that server.You can then run any of the available HTML reports.
• A link that can launch a client connection to the server. Clicking on the Client link
launches a client that attempts to connect to that server.
• The number of devices managed by the server that are up or down
• The number of critical alarms that have occurred on devices managed by the server
• The date and time of the last update of the server summary information for this
server
• The status of the server (whether it is responding to the periodic poll)
The “About EPICenter” Page
From the bottom of the Summary Report panel you can navigate to the About
EPICenter page.
The About EPICenter page, shown in Figure 7, provides information about the version
of EPICenter that you are running. This information may be needed if it becomes
necessary for you to contact Extreme Networks’ Technical Support.
76
EPICenter Software Installation and User Guide
Navigating the EPICenter Applications
Figure 7: The About EPICenter page
From this page you can do the following:
• Access the online EPICenter Software Installation and User Guide.
• Send e-mail to Extreme Networks’ technical support organization.
• Return to the Network Summary Report page.
Navigating the EPICenter Applications
The EPICenter client consists of two frames, as shown in Figure 8:
• The Navigation Toolbar, from which you can access the EPICenter applets
• The Main Applet frame, where the currently active applet runs.
EPICenter Software Installation and User Guide
77
Starting EPICenter
Figure 8: The EPICenter Home page
Navigation Toolbar
Main applet frame
The Navigation Toolbar
The Navigation Toolbar, on the left, displays a set of buttons you can use to access
various EPICenter modules. The buttons that appear in this Toolbar may include
additional modules, such as the EPICenter Policy Manager, if you have a license for
those modules.
• Home returns you to the Network Summary Report display shown in Figure 8.
From this page, you can access the About EPICenter page.
78
EPICenter Software Installation and User Guide
Navigating the EPICenter Applications
• Inventory runs the Inventory Manager, where you can discover devices on your
network, and set up device groups and port groups so you can manage network
elements in sets rather than individually.
• Alarm runs the Alarm Manager, where you can view and browse alarms that have
occurred on your network devices, as well as define alarms and the actions that
should occur when an alarm happens. This button also indicates that a new alarm
has been received by displaying its label in red text instead of black text.
• Config runs the Configuration Manager, where you can upload and download
switch configuration files, and download ExtremeWare software to your switches.
• Find IP/MAC runs the IP/MAC Address Finder applet, where you can search for
the ports associated with one or more MAC or IP addresses, or identify the IP or
MAC addresses connected to a set of ports.
• Groups runs the Grouping applet.
• Telnet runs an interactive Telnet application where you can create and run
command-line macros on multiple devices in one operation. You can also establish
telnet sessions with individual switches, both Extreme Networks and third-party
devices.
• EView runs the ExtremeView applet, where you can view status and statistics about
your managed devices, and do Extreme device configuration through Extreme
Networks’ interactive web-based device interface, ExtremeView Vista.
• RT Stats runs the Real Time statistics applet, that provides graphs of various device
and port statistics.
• Topology runs the Topology applet, which gives you a hierarchical, logical
map-based view of your network topology.
• VLAN runs the VLAN Manager, where you can set up and manage VLANs.
• ESRP runs the ESRP Manager, which lets your view the status of your ESRP-enabled
switches and VLANs.
• Admin runs the Administration module, where a user with Administrator access can
administer EPICenter user accounts and the RADIUS server. Other users can change
their own password using this applet.
• STP runs the STP Monitor, which lets you view the status of devices and VLANs
configured for STP. The devices must be running ExtremeWare 6.2.2 or later in order
to be monitored by EPICenter.
• Reports runs the Dynamic Reports module, where you can run a number of
pre-defined HTML-based reports from data in EPICenter’s inventory database. You
can also define your own reports.
EPICenter Software Installation and User Guide
79
Starting EPICenter
• Logoff ends your session and returns you to the Login display.
NOTE
Note that you must have Administrator or Manager access in order to use most of the
functions of these applets. Users with Monitor access will be able to view status,
statistics etc., but will not be able to set up or change EPICenter or device
configurations.
In addition to the applets described above, the Navigation Toolbar may include icons
for other optional applications that have been integrated into the EPICenter server.
These modules or products are typically purchased separately, and enabled via special
license keys. Documentation for these modules is provided separately from the main
EPICenter documentation. These include:
• Policy runs the EPICenter Policy Manager, where you can define QoS policies and
access list rules for implementation on Extreme Networks and Cisco devices. This
applet is an optional module that is licensed separately. It requires the installation of
a separate license key. This applet is not available in scalability mode.
• ServiceWatch runs the EPICenter ServiceWatch software within the EPICenter client
browser. ServiceWatch is not an EPICenter module, but a separate product. You can
enable the integration into the EPICenter Navigation Toolbar through the Server
Properties pages in the EPICenter Administration applet.
Main Applet Frame
The main applet frame is used to display the active EPICenter applet. For example, in
Figure 9, the VLAN Manager is displayed in the main applet frame.
80
EPICenter Software Installation and User Guide
Navigating the EPICenter Applications
Figure 9: VLAN Manager applet
Applet
function
buttons
Component Tree
Component status/detail
EPICenter applets use a two-panel display within the main applet frame. The two
panels are:
• The Component Tree.
• A component status/detail information panel.
In addition, some applets provide an applet-specific set of buttons at the top of the
main applet frame. These provide access to specific applet functions, such as adding,
deleting, or configuring components managed by the applet. Other applets provide
tabbed pages for different functions within the applet.
EPICenter Software Installation and User Guide
81
Starting EPICenter
The Component Tree
The left side panel shows the Component Tree. The Component Tree is a nested tree
that displays the components known to the EPICenter database that are relevant to the
active module. The Component Tree may display different types of components
depending on which EPICenter module you are viewing. For example, in the Inventory
Manager, the Component Tree shows all the Extreme and third-party devices known to
the EPICenter. In the VLAN Manager, the Component Tree displays VLANs, as shown
in Figure 9. In the Topology view, the Component Tree shows the maps nested within a
topology view.
The Component Tree often includes both folders and individual objects. If a component
in the tree has a plus sign to its left, that means there are subcomponents nested below
it. For example, if the component is a VLAN, then it typically has Extreme switches as
subcomponents. A switch may have ports as subcomponents, or slots which in turn
have ports.
• Click on the plus sign to display the nested subcomponents.
The plus sign changes to a minus sign.
• Click on the minus sign to hide the subcomponents.
Most objects in the Component Tree are represented both by a text identifier and by a
small icon that represents the type of object. Following are some examples of icons used
in the Component Tree:
indicates a device group.
,
,
, and
are examples of device icons.
indicates an untagged VLAN, and
,
,
, and
is a tagged VLAN.
are examples of folder icons.
indicates a general-purpose group in the Grouping module.
indicates a host resource in the Grouping module.
indicates a user resource in the Grouping module.
Devices are identified in the tree by their device name (as defined in the SysName MIB
variable) and IP address. A user with administrator access can change this to reverse
the order of the IP address and device name, or to display the device name only. This is
done through a server property set in the Administration module. See “Other
Properties” in Chapter 16 for details on how to do this.
82
EPICenter Software Installation and User Guide
Navigating the EPICenter Applications
The Status/Detail Information Panel
The right side panel displays information about the component selected in the tree on
the left. For example, Figure 10 shows the Inventory Manager applet, with basic
information about the devices known to the EPICenter.
Figure 10: Inventory Manager applet
Column
heading
separators
• Click on a component in the Component Tree to display information about that
component.
In Figure 10, the selected component is the Default device group. The component
status/detail panel displays summary status information about each device in this
device group.
A red circle with the white “S” next to a device indicates that the device is not reachable
through SNMP. This indicator may appear in any of the applets where a list of switches
is displayed.
The buttons and frame contents change depending on which applet you are viewing,
and also on the permissions associated with your user account.
EPICenter Software Installation and User Guide
83
Starting EPICenter
Moving the Component Tree Boundary
You can move the boundary between the Component Tree panel and the main applet
panel by following these steps:
1 Place the cursor over the line separating the panels.
2 Click and hold the left mouse button to “grab” the panel separator.
3 Drag the separator until the panels are the desired widths.
Resizing Columns
In a wide columnar display such as shown in Figure 10, you can resize the widths of
each column. To do this, follow these steps:
1 Place the cursor over the line separating the column you want to resize from the
column to its right.
2 Click and hold the left mouse button to “grab” the column separator.
3 Drag the separator until the column is are the desired width.
Sorting Columns
You can sort the rows of a columnar display according to the contents of any individual
column.
• To sort the rows, click on the column heading you want to use as the sort criteria.
Click once to sort in ascending order; click a second time to reverse the sort order.
In most applets, the column that is currently being used as the sort criteria is indicated
with a small triangle in the the column heading cell. The direction of the triangle (facing
up or facing down) indicates whether the sort is ascending or descending.
Applet Function Buttons
For most EPICenter applets, stand-alone buttons at the top of the applet frame provide
access to the functions provided by the current applet. Each button invokes a pop-up
dialog box for the function, as shown in Figure 11.
NOTE
If you have Monitor access, some or all of the buttons in a given applet are not available
to you. For example, in the VLAN Manager, a user with Monitor access can view
84
EPICenter Software Installation and User Guide
Navigating the EPICenter Applications
information about the components in the Component Tree, but cannot Add, Delete, or
Modify VLANs, or perform any port configurations.
Figure 11: Pop-up dialog box for adding a VLAN in the VLAN Manager
A dialog box can contain the following types of fields:
• Page tabs, such as the Properties & Port and IP Forwarding tabs in Figure 11. These
are used when there are multiple pages of settings for a specific function. Clicking a
tab displays its page.
• Text fields, such as the VLAN Name field in Figure 11. Enter text or numbers by
clicking in the field and then typing.
To clear a value from a text field, highlight the value with the cursor and press the
Del or Backspace key on the keyboard. You can also highlight the value and just
type a new value over the old one.
• Drop-down menu fields, such as the Protocol Filter field in Figure 11. Click in the field
to drop down a menu of choices, then click on your selection to enter the value into
the field.
• List box fields, such as the Available Switches field in Figure 11. Click to highlight a
value in the field. Click again to unselect a value.
If there are more entries in the list than can be displayed in the box, a scrollbar is
provided at the right side of the field.
EPICenter Software Installation and User Guide
85
Starting EPICenter
Some list boxes allow multiple selections. Simply click on multiple items to select
them. You can also use [Shift]-click to select the first and last items in a group of
contiguous items; all the items between your first and last selection will be
highlighted.
To have the settings you’ve entered take effect, many dialog boxes provide an Apply
button. This saves the settings on the page you are viewing, but the dialog box remains
open so you can make additional changes or change the settings on one of the other
pages. For example, you can specify a new VLAN on the Properties & Ports page as
shown in Figure 11, click Apply to commit those settings, then display the IP
Forwarding settings and make changes on that page.
Other dialog boxes may provide a button that executes the function of the dialog, such
as Add, or Delete. Like the Apply button, these often perform the function but leave
the dialog box open so you can perform additional operations.
Most dialog boxes also provide a Close button you can use to exit the dialog box when
you are finished.
In addition, most dialog boxes provide a Reset button. This typically restores the dialog
box to the state it was in when it was invoked, clearing any selections on the screen and
resetting the data to the current information from the EPICenter database.
Printing from EPICenter
Printing is not supported in most of the EPICenter applets. The exceptions are the RT
Stats and Topology applets, which each provide a print function, and the HTML-based
reports (the Network Summary report and the Reports described in Chapter 17.
You can print the HTML reports using the browser print button. However, you should
click in the panel where the report is displayed to ensure that only that panel will be
printed. If you print without doing this, the Navigation Toolbar may not be refreshed,
and you will need to refresh the client manually.
86
EPICenter Software Installation and User Guide
4
Using the Inventory Manager
This chapter describes how to use the EPICenter Inventory Manager applet for:
• Viewing the EPICenter device inventory
• Discovering network devices
• Adding network devices to the EPICenter database
• Modifying device contact parameters
• Deleting a device from the EPICenter database
• Updating device information in the database
• Creating default access parameters for network devices
• Finding specific network devices in the database
• Displaying device and device group parameters
Overview of the EPICenter Device Inventory
The Inventory Manager applet keeps a database of all the network devices managed by
EPICenter. EPICenter can discover any devices running MIB-2 compatible agents. It can
manage Extreme switches, and a number of third-party devices.
The EPICenter software provides an automatic discovery function. This feature can
discover Extreme and MIB-2 compatible devices by specific IP address or within a range
of IP addresses.
EPICenter Software Installation and User Guide
87
Using the Inventory Manager
You can also add network devices to the EPICenter database manually, using the
Inventory Manager Add function. Once a network device is known to the EPICenter
database, you can assign it to a specific device group, and configure it using the
Inventory Manager, VLAN Manager, Configuration Manager, Interactive Telnet,
ExtremeView, or the optional Policy Manager. You can receive alarms about faults on
the device, and you can view a hierarchical topology layout of the devices known to the
Inventory Manager.
Any EPICenter user can view status information about the network devices currently
known to EPICenter. Users with Administrator or Manager access can run Discovery,
and add devices to or delete devices from the list of managed devices in the database.
These users can also explicitly refresh the information in the database related to the
devices that the EPICenter is managing.
Device Groups
Devices in the EPICenter are organized into one or more device groups. A device group
is a set of network devices that have something in common, and that can be managed
as a group. For example, devices might be grouped by physical location (Building 1,
Building 2, first floor, second floor) or by functional grouping (engineering, marketing,
finance) or by any other criteria that makes sense within the managed network
environment.
An individual device must belong to one, and only one, device group. All devices
become members of a device group when they are added to the EPICenter database,
either through Add Devices or as a part of the Discovery process. By default, devices
are added to the device group “Default,” if you do not specify otherwise. A device may
then be moved to another device group as appropriate.
Gathering Device Status Information
The EPICenter retrieves information about the devices it manages in several ways:
• EPICenter uses SNMP polling for the IP addresses specified in a Discovery request
to retrieve the status information needed by the various EPICenter applets.
• When a switch is added manually to the EPICenter database, EPICenter uses SNMP
to retrieve status information needed by the various EPICenter applets.
• Extreme switches send SmartTraps to EPICenter whenever a change occurs in a
switch status variable in which the EPICenter has registered interest. These include
changes to operating variables as well as configuration changes made through other
88
EPICenter Software Installation and User Guide
Displaying the Network Device Inventory
management entities such as the switch command line interface or ExtremeWare
Vista.
These traps are based on a set of SmartTraps rules that the Inventory Manager
creates on the switch when it is added to the switch inventory. The rules tell the
switch what events or changes EPICenter wants to be notified about. The rules are
created on the switch using SNMP. EPICenter also adds itself on the switch as a trap
receiver. The switch uses the SmartTraps rules to determine what traps to send to
EPICenter.
When EPICenter receives a trap from a switch, it then polls the switch for detailed
status information.
• EPICenter polls every network device periodically (approximately every five
minutes by default) to update basic switch status, which is a subset of the status and
configuration information kept in the database. This poll interval is set globally for
all devices being managed by the EPICenter server, and can be changed through the
Server Properties settings in the Administration applet. See “Server Properties
Administration” in Chapter 16.
• The EPICenter server polls each device periodically for detailed status information.
This is done much less frequently than the basic status polling—by default, once
every 30 minutes for core (chassis) devices, and once every 90 minutes for edge
devices. In EPICenter 4.0, the default is 90 minutes for both the core and edge
devices. This poll interval can be set individually for devices through the Modify
Device interface in the Inventory applet (see the discussion “Modifying a Device” on
page 109).
• A user with Administrator or Manager access can use the Sync command from the
Inventory Manager. Sync is a manual update of the regular data gathering
mechanisms, for use when the users believes that the device configuration or status
is not correctly reported in EPICenter applets. Sync causes EPICenter to poll the
switch and update all configuration and status information. During a Sync operation
the SmartTraps rules are also reset in case the user has accidentally deleted the trap
receiver or any SmartTrap rules.
Displaying the Network Device Inventory
When you click the Inventory button in the Navigation Toolbar, the main Inventory
Manager page appears as shown in Figure 12.
EPICenter Software Installation and User Guide
89
Using the Inventory Manager
Figure 12: The Inventory Manager applet, main page
NOTE
You must add network devices to the database using Discovery or the Add Devices
function in order to make them “known” to EPICenter. Until this is done, no devices are
displayed in the Inventory Manager.
The Device Groups currently defined in the EPICenter database are displayed in the
Component Tree in the left panel.
The panel on the right shows the All Device Groups page, a list of the currently defined
device groups with their descriptions.
The first time you run EPICenter, there is only one device group, Default. You cannot
delete or change the name of the Default device group.
90
EPICenter Software Installation and User Guide
Viewing Device Status Information
Click on the plus sign to the left of a Device Group name to display the list of switches
that are members of that group.
A red circle with a white “S” next to a device indicates that the device is not reachable
through SNMP.
The buttons at the top of the page provide the following functions:
• Discover lets you find network devices by IP address or range of addresses.
• Add lets you add individual devices and device groups to the database.
• Delete removes a device or device group from the database.
• Modify lets you change the members of a device group, or update a device’s contact
parameters in the database.
• Sync updates the EPICenter database with current device configuration and status
information.
• Default lets you create default access parameters for network devices.
• Find searches for devices by name, IP address, or device type, and returns
information such as the device group to which the device belongs.
• Help displays an on-line help page for the Inventory Manager.
Viewing Device Status Information
When you select a device group in the Component Tree, the panel on the right displays
a summary status of the devices in the selected device group (see Figure 13).
EPICenter Software Installation and User Guide
91
Using the Inventory Manager
Figure 13: Inventory Manager device group summary status
• The status “lights” show the status of each device as detected by EPICenter.
Table 3: Inventory Manager Device Status Indicators
Status Light
Green
Yellow
Red
Device Status
Device is up and OK
Device is responding, but reports an error condition such as a fan or
power supply failure, or excessive temperature
Device is not responding to EPICenter status queries. This may mean
that the device is down, that it is unreachable on the network, or that
the SNMP community strings have changed and EPICenter can no
longer contact the switch.
• The name and type of the device are detected by EPICenter.
92
EPICenter Software Installation and User Guide
Viewing Device Status Information
• The IP address and read/write community strings are also detected by the
EPICenter discovery, or are those entered into the EPICenter database manually if
the switch was added using the Add command.
Select a switch in the Component Tree on the left to display detailed configuration and
status information, as shown in Figure 14. This display shows additional information
that EPICenter has gathered from the switch agent.
Figure 14: Inventory Manager device status information
The information displayed in Figure 14 is for an Extreme switch. The ExtremeWare
software running in the switch provides comprehensive status information through the
Extreme MIB. Figure 15 show the information displayed for a Cisco device—a subset of
the information available for an Extreme device.
EPICenter Software Installation and User Guide
93
Using the Inventory Manager
Figure 15: Inventory Manager information for a 3Com device
Viewing Device Information from Pop-up Menus
You can select a device group or a device in the Component Tree, then right-click to
display a pop-up menu that contains the Modify, Delete, Sync, and Properties
commands. All of the commands—with the exception of the Properties
command—perform the same functions as the buttons at the top of the page, but with
the appropriate device or device group displayed. The Properties command displays the
attributes for a specific device group or device. The device pop-up menu also contains
the Alarms, Browse, Statistics, Telnet, EView, and VLANs commands. All of these
commands perform the same functions as the applets in the Navigation Toolbar to the
left of the page, but with the appropriate device displayed.
94
EPICenter Software Installation and User Guide
Viewing Device Status Information
Modify
The Modify function lets you change the members of a device group, or update a
device’s contact parameters in the EPICenter database.
To view the Modify Device display for a selected device group or device:
• Right-click on the device group or device, then select Modify from the pop-up menu
that appears
This opens the Modify Devices and Device Group window. If you selected a device, the
Modify Devices page is displayed. If you selected a device group, the Modify Device
Group page is displayed.
See “Modifying Devices and Device Groups” on page 109 for details on using this
feature.
Delete
The Delete function lets you delete devices and device groups from the EPICenter
database.
To view the Delete display for a selected device group:
• Right-click on the device group, then select Delete from the pop-up menu that
appears
This opens the Delete Devices and Device Group window. The Delete Device Group
window displays the device group name and a description of the device, if available.
To view the Delete display for a selected device:
• Right-click on the device, then select Delete from the pop-up menu that appears
The Inventory dialog box appears and prompts you to delete the selected device.
See “Deleting Devices and Device Groups from the Database” on page 113 for details on
using this feature.
Sync
The Sync function lets you manually update device configuration and status
information.
EPICenter Software Installation and User Guide
95
Using the Inventory Manager
To view the Sync display for a selected device group or device:
• Right-click on the device group, then select Sync from the pop-up menu that
appears
This opens the Synchronize Devices window and displays statistics for devices that are
members of a device group.
See “Updating Device Information” on page 116 for details on using this feature.
Properties
The Properties function lets you view the attributes for a device group or a device.
To view the Properties display for all device groups:
• Right-click on the Device Groups component, then select Properties from the pop-up
menu that appears
The Device Groups Properties window appears and displays the number of device
groups and the names of the device groups that are known to EPICenter.
To view the Properties display for a selected device group:
• Right-click on the device group, then select Properties from the pop-up menu that
appears
The Device Group Properties window appears and displays the attributes for the
selected device group.
To view the Properties display for a selected device:
• Right-click on the device, then select Properties from the pop-up menu that appears
The Device Properties window appears and displays the attributes for the selected
device.
See “Displaying Properties” on page 121 for details on using this feature.
Alarms
The Alarms function runs the EPICenter Alarm System and displays the Alarm Browser
function to show the alarms for the selected device.
96
EPICenter Software Installation and User Guide
Viewing Device Status Information
To view the Alarms display for a selected device:
• Right-click on the device, then select Alarms from the pop-up menu that appears
This starts the Alarm System applet in a new window. The Alarm System displays the
Alarm Log Browser and displays the alarms for the selected device.
See Chapter 5 for details on using this feature.
Browse
The Browse function runs the ExtremeWare Vista switch management interface for the
selected device.
To run ExtremeWare Vista for a selected device:
• Right-click on the device, then select Browse from the pop-up menu that appears
This starts the ExtremeWare Vista login page in a new web browser window.
Refer to the ExtremeWare Software User Guide for details on using ExtremeWare Vista.
Statistics
The Statistics function runs the EPICenter Real-Time Statistics applet and displays port
statistics for the selected device.
To view the Device Statistics display for a selected device:
• Right-click on the device, then select Device from the pop-up menu that appears
This starts the Real-Time Statistics applet in a new window and displays port statistics
for the selected device.
See Chapter 11 for details on using this feature.
Telnet
The Telnet function opens an EPICenter telnet window that is connected to the selected
device.
To open a telnet session for a selected device:
EPICenter Software Installation and User Guide
97
Using the Inventory Manager
• Right-click on the device, then select Telnet from the pop-up menu that appears
This starts a telnet session for the device in a new window.
See Chapter 7 for details on using this feature.
EView
The EView function runs the EPICenter ExtremeView applet and displays the device
front-panel image and device information for the selected device.
To view the EView for a selected device:
• Right-click on the device, then select EView from the pop-up menu that appears
This starts the ExtremeView applet in a new window and displays the front-panel
image and information for the selected device.
See Chapter 10 for details on using this feature.
VLANs
The VLANs function runs the EPICenter VLANs applet and displays the VLANs
currently known to the EPICenter database.
To view the VLANs for a selected device:
• Right-click on the device, then select VLANs from the pop-up menu that appears
This starts the VLAN applet in a new window and displays the VLANs currently know
to the EPICenter database.
See Chapter 13 for details on using this feature.
Discovering Network Devices
EPICenter provides an automatic Discovery function that lets you discover network
devices by IP address.
To discover network devices, do the following:
98
EPICenter Software Installation and User Guide
Discovering Network Devices
1 Click the Discovery button at the top of the Inventory Manager main window.
The Discover Devices window, shown in Figure 16, is displayed.
Figure 16: Inventory Manager Device Discovery set up window
2 Click the appropriate boxes to select the types of devices you want to include in the
discovery. You can discover Extreme devices only, or all devices with MIB-2
compatible agents.
3 Specify the device address range you want to discover. You may specify the range in
one of two ways:
— As an IP Address with Wildcards (such as 10.203.10.* or 10.203.?.??)
Valid wildcard characters are *, ?, and
- (dash):
* acts as a wildcard for the entire octet (0-255).
? is a wildcard for a single digit (0-9).
- lets you specify a range for any octet. You can use this in more than one octet.
NOTE
You cannot combine the dash with another wildcard in the same octet.
EPICenter Software Installation and User Guide
99
Using the Inventory Manager
You can also use the IP Address with Wildcards field to specify a single IP
address.
Examples:
IP Address Specification
Addresses Generated
10.203.0.*
polls 10.203.0.0 through 10.203.0.255
10.203.?.??
polls 10.203.0.0 through 10.203.9.99
0.203.0.1? or 10.203.0.10-19
both specify the same range: 10.203.0.10 through
10.203.0.19
10.203.0-2.10-30
polls
10.203.0.10 through 10.203.0.30
10.203.1.10 through 10.203.1.30
10.203.2.10 through 10.203.2.30
— As an IP address Range (such as 10.203.10.20 to 10.203.10.45)
NOTE
There are certain IP addresses that are reserved. You should not include these
addresses in your discovery.
• Class A networks: 0 and 127 are reserved.
• Class D networks: 224 - 239 are reserved for multicasting.
• All addresses above 239 are reserved.
• 255 is reserved for broadcast datagrams for either the host or network portion of
the IP address.
In addition, certain host addresses may be interpreted as broadcast addresses,
depending on the subnetting of your network.
IP addresses are processed prior to starting the discovery, and IP addresses that
contain 255's in the host portion are eliminated. This is based on the IP address as
well as the subnet mask.
4 Specify (or verify) the Subnet Mask size as appropriate. The value in the Subnet
Mask field is the number of bits to be masked, starting from the high-order
(left-hand) octet. The default subnet mask of 24 will mask the three high-order
octets.
5 Specify (or verify) the SNMP Read Community string so that EPICenter will be able
to retrieve information from any devices it discovers.
100
EPICenter Software Installation and User Guide
Discovering Network Devices
6 Click the New button to add the range into the Device Discovery Criteria list.
7 Repeat steps 3 through 6 to specify any additional device addresses or ranges for the
discovery.
8 If necessary, you can remove an address range from the Device Discovery Criteria
list at any time before you initiate the discovery by selecting the range and clicking
the Remove button.
You can remove all address ranges using the Reset button at the bottom of the page.
9 Click the Discover button at the bottom of the window to initiate the discovery.
NOTE
If a discovery request is too large, your browser may not have sufficient memory
resources available to handle it. It is recommended that you break a large discovery
task into multiple separate tasks.
A Discovery Results window is displayed as soon as the discovery process begins, as
shown in Figure 17. The panel at the bottom of the window shows the progress of
the discovery and displays status messages for each device it finds as it works
through the set of IP addresses you have specified.
Figure 17: Results of a discovery, with details visible
EPICenter Software Installation and User Guide
101
Using the Inventory Manager
— Click the Hide Details button at the bottom of this window to hide the detail
display.
— Click View Details to re-display the discovery details.
When the discovery has completed, the set of discovered devices is listed in the top
panel of the Discovery Results window.
NOTE
These devices are NOT automatically entered into the EPICenter database. You
must explicitly select and add devices to the database.
10 To add devices to the EPICenter database, select individual devices or a range of
devices in the Results list, and click the Add button at the bottom of the window.
NOTE
If you select multiple devices, make sure the devices you select are similarly
configured. As part of the Add process, you will be asked for a single password that
will apply to all the selected devices. If the password is specified incorrectly for any
of these devices, the add will fail for those devices.
11 A window appears where you must set additional device options such as a write
community string, the device group to which the devices should be added, and a
default device login and password (see Figure 18). If there are Cisco devices among
the set being added, you must also enter a Cisco enable password.
Enter or make changes to any of these fields. These options will apply to the entire
set of devices you are adding.
NOTE
Make sure the device passwords are correct for the selected devices. If you are
adding multiple devices in one operation, make sure the passwords you specify are
correct for each device. A device cannot be added if the password is not correct.
102
EPICenter Software Installation and User Guide
Discovering Network Devices
Figure 18: Setting default device options for discovered devices
12 Click OK to proceed with the Add process.
A message window (shown in Figure 19) appears to show you the progress of the
Add command.
Figure 19: Message window showing Add Device progress
Devices are listed followed by a small purple rotating clock icon
function is in progress.
while the add
• When a device has been successfully added, the clock turns into a green checkbox
.
EPICenter Software Installation and User Guide
103
Using the Inventory Manager
• If the device cannot be added, the clock turns into a red X in the checkbox
the device name is displayed in red.
and
The indicators just below the tree area of the window show the number of devices
currently in each state.
To see the messages related to an Add function (either successful or unsuccessful), select
a device in the list. The messages related to the device are displayed as lines under the
device node, as shown in Figure 20.
• Click the plus sign at the left of the device name to display server messages related
to adding the device.
• Click the minus sign at the left of the device to hide the server messages.
• The up and down arrow buttons let you move up and down the device tree,
displaying the server messages associated with each device.
• If you check the Errors Only box, the up and down arrow buttons will expand only
devices that had errors.
• The Collapse All button collapses all the device nodes, hiding all the server
messages.
Figure 20: Message window showing errors from the Add Device process
104
EPICenter Software Installation and User Guide
Adding Devices and Device Groups
CAUTION
If you close the Discovery Results window without adding devices, the results for
devices not already in the EPICenter database are lost. You must perform a discovery
again to regenerate information on those devices.
After the Add has finished, the Discovery Results window is re-displayed. You can
select more devices and specify a different set of Inventory Device Options, and add
those devices to the Inventory Manager.
Adding Devices and Device Groups
Users with Administrator or Manager access can add devices to the EPICenter database,
and create Device Groups. If you have Monitor access only, you may not use this
function.
Adding a Device
1 Click the Add button at the top of the Inventory Manager main window.
Select the appropriate tab to display the Add Device window, as shown in Figure 21.
EPICenter Software Installation and User Guide
105
Using the Inventory Manager
Figure 21: Add Device window in the Inventory Manager
2 Enter the device IP address, community strings, device login and password into the
appropriate fields. These are the parameters that EPICenter uses to access the switch.
You may also enter a DNS-resolvable host name in place of the Switch IP address.
3 Select the device group to which this device should belong. It can belong to only one
device group. Default is the default group for managed devices.
4 To clear the contents of the fields and reset them to their default values, click Reset.
5 To add the new device into the database, click Add.
When you click Add, the Inventory Manager adds the devices to the database. It makes
a set of SNMP requests to retrieve data that is needed from the devices by EPICenter
applets. If the device is an Extreme switch, it also creates a set of SmartTraps rules that
tell the switch what status and configuration changes are of interest to EPICenter.
106
EPICenter Software Installation and User Guide
Adding Devices and Device Groups
Creating a Device Group
Device groups are sets of managed network devices that have something in common,
and that can be managed as a group. For example, devices might be grouped by
physical location (Building 1, Building 2, first floor, second floor), by department
(engineering, marketing, finance), or by any other criteria that makes sense within the
managed network environment.
Every device belongs to one, and only one, device group. All devices become members
of a device group when they are added to the EPICenter database, either through Add
Devices or as a part of the Discovery process. A device may then be moved to another
device group as appropriate.
One device group may contain a maximum of 100 devices.
To create a new device group, follow these steps:
1 Click the Add button at the top of the Inventory Manager main window.
Select the appropriate tab to display the Device Groups window, as shown in
Figure 22.
EPICenter Software Installation and User Guide
107
Using the Inventory Manager
Figure 22: Add Device Group window in the Inventory Manager
2 Type a name for the device group into the Device Group Name field, and a
description (optional) into the Device Group Description field.
3 To add a device to the selected device group, select one or more devices in the
Available Devices list and click Add ->. To add all devices in the Available Devices
list, click Add All ->.
4 To remove a device from the device group, select one or more devices in the
Included Devices list, and click <- Remove. The device(s) will be moved from the
selected device group to the Default device group. To return all devices in the
Included Devices list to the Default device group, click <- Remove All.
5 Repeat steps 3 and 4 until you have included all the devices that should be members
of this device group.
6 To add the newly created device group to the database, click the Add button at the
bottom of the window.
108
EPICenter Software Installation and User Guide
Modifying Devices and Device Groups
Modifying Devices and Device Groups
You can use the Modify function to modify the access parameters for an individual
device, or to add and delete members of a device group. Users with Administrator or
Manager access can modify device contact information and device groups.
If you have Monitor access only, you cannot use this function.
Modifying a Device
You can begin the modify function using the Modify button on the toolbar, or by
selecting a device in the Component Tree, right-clicking to display the pop-up menu,
and selecting Modify.
To modify the contact information for a managed device in the database, do the
following:
1 Click the Modify button at the top of the Inventory Manager main page.
Select the appropriate tab to display the Modify Device window, as shown in
Figure 23.
EPICenter Software Installation and User Guide
109
Using the Inventory Manager
Figure 23: Devices tab of the Modify Devices and Device Groups window
2 To select a device from a specific device group, select the device group from the
pull-down list in the Filter by Device Group field. Select All Devices to view the list
of all devices from all device groups.
3 Select one or more devices in the Devices list for which you want to change contact
information.
4 Enter the changed information in the appropriate fields.
The Device Login and Device Contact Password are the login and password needed
in order to Telnet to the device or to use ExtremeWare Vista.
The Device Poll Interval lets you specify how frequently the EPICenter server
should poll the for detailed device information, such as software version, bootrom
version, and so on. This also includes EDP and ESRP information for non-”i” series
devices. To avoid a potentially large amount of polling traffic, this detailed polling is
only done every 30 minutes for core (chassis) devices and 90 minutes for edge
devices. In EPICenter 4.0, the default is 90 minutes for both the core and edge
devices. You can change this detailed polling interval by entering a different value in
this field.
110
EPICenter Software Installation and User Guide
Modifying Devices and Device Groups
NOTE
Note that the Device Poll Interval set here is different from the global Poll Interval
you can set in the Administration applet. The global poll interval controls the basic
status polling needed to ensure SNMP reachability, and is typically done much more
frequently than detailed device polling.
5 Click Modify to add the changed information to the EPICenter database.
6 Click Cancel to cancel the Modify process.
WARNING!
If you change the community string for a device so that it no longer matches the string
configured in the device, EPICenter will no longer be able to communicate with the
device. For Extreme devices, EPICenter will display an error message, but it will not
necessarily do so for third-party devices. To avoid this problem, change the community
string on the device first, then change it in EPICenter.
Modifying a Device Group
Devices are always a member of a device group; devices not explicitly assigned to
another device group are members of the Default device group. This has two effects
related to modifying device groups:
• When devices are removed from a device group, they are automatically added to the
Default device group
• Devices cannot be removed from the Default device group using the Remove button
in the Modify dialog. To remove a device from the default device group, you must
add it to another device group.
You can begin the modify function using the Modify button on the toolbar, or by
selecting a device group in the Component Tree, right-clicking to display the pop-up
menu, and selecting Modify Device Group.
To add or remove devices in a device group, do the following:
1 Click the Modify button at the top of the Inventory Manager main page.
Select the appropriate tab to display the Modify Device Group window, as shown in
Figure 24.
EPICenter Software Installation and User Guide
111
Using the Inventory Manager
Figure 24: Device Groups tab of the Modify Devices and Device Groups window
2 Select the device group you want to modify. The Included Devices list displays the
devices that are currently members of this group. The Available Devices list displays
the other devices known to EPICenter, and their current device group membership.
3 To change the name or description of the group, type the new text into the Device
Group Name and Description fields.
4 To add a device to the selected device group, select the device in the Available
Devices list and click Add ->. To add all devices in the Available Devices list, click
Add All ->.
5 To remove a device from the device group and return it to the Default device group,
select the device in the Included Devices list, and click <- Remove. The device will
be moved from the selected device group to the Default device group. To return all
devices in the Included Devices list to the Default device group, click <- Remove All.
Because devices not otherwise assigned are members of the Default device group,
you cannot remove devices from the Default device group. Devices are removed
from the Default device group only when they are added to another device group.
112
EPICenter Software Installation and User Guide
Deleting Devices and Device Groups from the Database
6 Repeat steps 4 and 5 until you have included all the devices that should be members
of this device group.
The Reset button will undo all your add and remove actions, and return both the
Available Devices and Included Devices lists to the state they were in when you
started the Modify command.
7 To replace the modified device group in the database, click the Modify button at the
bottom of the window.
Moving a device from one device group to another requires two steps. First, remove it
from its current device group (returning it to the Default group). Then select the new
device group, and move the device from the Default device group to the new group.
Deleting Devices and Device Groups from the
Database
Users with Administrator or Manager access can delete devices and device groups from
the EPICenter database. If you have Monitor access only, you cannot access this
function.
Deleting a Device
You can begin the delete function using the Delete button on the toolbar, or by selecting
a device in the Component Tree, right-clicking to display the pop-up menu, and
selecting Delete Device.
To delete a device from the EPICenter database, follow these steps:
1 Click the Delete button at the top of the Inventory Manager main page.
Select the appropriate tab to display the Delete Devices window (see Figure 25).
EPICenter Software Installation and User Guide
113
Using the Inventory Manager
Figure 25: Devices tab of the Delete Devices and Device Groups window
2 To select a device from a specific device group, select the device group from the
pull-down list in the Filter by Device Group field. Select All Devices to view the list
of all devices from all device groups.
3 Select one or more devices in the Devices list, and click Delete.
4 Click OK to confirm that you want to delete the device information from the
database.
Deleting a device removes the information about the device from the EPICenter
database. This means that the device can no longer be monitored and managed from the
EPICenter application. If the device is an Extreme switch, deleting it removes any
SmartTraps rules, both from the database and the switch change table. It also removes
all information about VLANs, QoS Policy, and Virtual Chassis connections associated
with this switch from the EPICenter database.
NOTE
Deleting a device from EPICenter has no effect on the configuration of the device itself.
114
EPICenter Software Installation and User Guide
Deleting Devices and Device Groups from the Database
Deleting a Device Group
You can begin the delete function using the Delete button on the toolbar, or by selecting
a device in the Component Tree, right-clicking to display the pop-up menu, and
selecting Delete Device Group.
To delete a device group from the EPICenter database, follow these steps:
1 Click the Delete button at the top of the Inventory Manager main page.
Select the appropriate tab to display the Delete Device Groups window (see
Figure 26).
Figure 26: Device Groups tab of the Delete Devices and Device Groups window
2 Select one or more device groups in the Device Groups list, and click Delete.
3 Click OK to confirm that you want to delete the device group information from the
database.
The devices in the deleted device group automatically become members of the Default
device group.
EPICenter Software Installation and User Guide
115
Using the Inventory Manager
Updating Device Information
Occasionally, you may want to update the configuration and status information for one
or more devices in the EPICenter database. The Sync operation is a manual update you
can use if you believe that the device configuration is not correctly represented in
EPICenter applets. It updates all information for a selected set of devices, except for the
contact information.
If you have Administrator or Manager access to EPICenter, you can perform a Sync. If
you have Monitor access only, you can not use this function.
You can begin the synchronize function using the Sync button on the toolbar, or by
selecting a device or device group in the Component Tree, right-clicking to display the
pop-up menu, and selecting the Sync command.
To refresh the configuration and status information, follow these steps:
1 Click Sync at the top of the Inventory Manager page.
The Synchronize Devices dialog, shown in Figure 27, is displayed, listing the devices
in the EPICenter database.
116
EPICenter Software Installation and User Guide
Configuring Default Access Parameters
Figure 27: Synchronize Devices dialog
2 To select a device from a specific device group, select the device group from the
pull-down list in the Filter by Device Group field. Select All Devices to view the list
of all devices from all device groups.
3 Select one or more devices in the Device list.
4 Click Reset at any time prior to initiating the Sync to deselect all device selections
and start over.
5 Click Sync to initiate the synchronization process.
The Inventory Manager uses SNMP to retrieve configuration and status information
from each selected switch, and updates the database with that information.
6 The Sync function displays a dialog box with status or error information. Click OK
to continue.
Configuring Default Access Parameters
The Default button allows you to configure a set of default access parameters for
network devices you have not yet discovered. After you configure the default access
EPICenter Software Installation and User Guide
117
Using the Inventory Manager
parameters, the network devices you discover and add to the EPICenter database will
have these default parameters.
1 Click the Default button at the top of the Inventory Manager main window.
The Configure Defaults window, shown in Figure 28, is displayed.
Figure 28: Configure Defaults window
2 Enter or make changes to any of the fields. These options will apply to future
network devices that you add to the EPICenter database.
The SNMP Read Community String and the SNMP Write Community String are
necessary so EPICenter can communicate with the devices.
The Device Login and Device Contact Password are the login and password needed
in order to Telnet to the device or to use ExtremeWare Vista.
3 Click Reset to clear the contents of the fields and reset them to their default values.
4 Click Save to save your changes to the EPICenter database.
A message window (shown in Figure 29) appears to show you the progress of the
Save command.
118
EPICenter Software Installation and User Guide
Finding Devices
Figure 29: Message window showing Save progress
5 Click OK to return to the Configure Defaults window.
6 Click Close to exit the Configure Defaults window.
If you make changes to the access parameters and you do not save those changes,
the Inventory dialog box (shown in Figure 30) appears. From the Inventory dialog
box, you can apply or not apply the changes you made, or you can cancel out of the
dialog box.
Figure 30: Inventory dialog box
Finding Devices
You can search for a device in the EPICenter database by name, by IP address, or by
type of device. This may be useful if you have a large number of devices in your
inventory.
To search for a device, follow these steps:
EPICenter Software Installation and User Guide
119
Using the Inventory Manager
1 Click Find at the top of the Inventory Manager page.
The Find Devices dialog, shown in Figure 31, is displayed.
Figure 31: Find Devices dialog
2 Enter your search criteria:
You can search for devices by name or by IP address. You can limit the search to a
specific device group, or to a specific type of Extreme device. Search criteria can
include:
— A device name. Click the Device Name button, and enter a complete or partial
name in the Search: field.
— An IP address. Click the IP Address button and enter a complete or partial IP
address in the Search: field. You can use the wild card characters * or ? in your
search criteria.
* acts as a wildcard for an entire octet (0-255)
? is a wildcard for a single digit (0-9)
— A device group. Select the device group from the drop-down menu in the device
group field. If you do not specify a name or IP address in the Search field, all
devices in the device group you select will be found.
120
EPICenter Software Installation and User Guide
Displaying Properties
— A device type. Select the device type from the drop-down menu in the type field.
If you do not specify a name or IP address in the Search field, all devices of the
type you select will be found.
3 Click Find to search for devices that meet the criteria you have specified. All devices
found are listed in the center panel. Information includes the device group in which
the device can be found, its name, IP address, and the type of device.
4 Double-click on a device in the results table to highlight the device in the
Component Tree, or select a device in the results table and click OK, to display the
associated status information for that device (see “Viewing Device Status
Information” on page 91). If you click OK, the search window will close.
5 Click New Search to clear all search criteria.
6 Click Cancel to close the search window.
Displaying Properties
You can view the properties of a device group or a device in the EPICenter database.
This section describes how to view the device group properties and the device
properties.
All Device Group Properties
You can view summary information for all device groups, or view information about
individual device groups.
To view summary information for all device groups, right-click on the Device Groups
component and select Properties from the pop-up menu.
The Device Groups Properties window appears, showing the All Device Groups display
(see Figure 32).
EPICenter Software Installation and User Guide
121
Using the Inventory Manager
Figure 32: Device Groups Properties for all Device Groups
The Device Groups Properties window displays the following information:
• Count—The number of device groups known to EPICenter
There is also a table which contains the following columns:
• Device Group—The name(s) of the device group(s) known to EPICenter
• Description—A description of each device group known to EPICenter
You can also view properties for a specific device group. To view properties for a
specific device group, right-click on a device group in the Component Tree and select
Properties from the pop-up menu.
122
EPICenter Software Installation and User Guide
Displaying Properties
The Device Group Properties window appears, showing information about the selected
group (see Figure 33).
Figure 33: Device Group Properties for an individual device
The Device Group Properties window displays the following information:
• Device Group—The name of the device group
• Description—A description of the device group
• Count—The number of devices in the device group
There is also a table which contains the following columns:
• Device—The name of the devices that are members of this device group
• IP Address—The IP addresses of the devices that are members of this device group
EPICenter Software Installation and User Guide
123
Using the Inventory Manager
Device Properties
To view properties for a device, right-click on a device in the Component Tree and
select Properties from the pop-up menu that appears.
The Device Properties window opens, as shown in Figure 34.
Figure 34: Device Properties window
The Device Properties window has three tabs at the top of the window:
• Device
• VLAN
• STP
124
EPICenter Software Installation and User Guide
Displaying Properties
Each tab displays the name of the device and a status “light” which shows the status of
the device as detected by EPICenter.
The Device Tab
The Device tab displays information about the device such as its IP address, MAC
address, and boot time. The main section of the window presents the same information
you can view in the Inventory Manager for the device. If the device is an Extreme
device, the ExtremeWare software running in the switch provides comprehensive status
information.
The VLAN Tab
The VLAN tab lists the VLANs configured on the device. This window shows the
following information about the VLANs on the device:
VLAN
VLAN name
Tag
VLAN tag
Protocol
Protocol filter for the VLAN
IP Address
IP address of the VLAN
Subnet Mask
Subnet Mask for the VLAN
QoS Profile
The QoS profile configured for this VLAN
ESRP
Whether ESRP is configured for this device.
The STP Tab
The STP tab lists the Spanning Tree domains (STPDs) configured on the device. There
may be more than one entry per STPD if the domain includes multiple VLANs.
STP
The STP Domain name
State
The domain state (Enabled or Disabled)
VLAN
The name of the VLAN participating in this domain
Tag
The 802.1Q tag of one of the wholly-contained VLANs in the
domain.
Root
Indicates whether this device is currently the STP root bridge
for this domain (Yes or No).
EPICenter Software Installation and User Guide
125
Using the Inventory Manager
No. of Ports
The number of ports on this bridge participating in this
VLAN in this domain. Will be N/A if the STP domain is
disabled on this VLAN.
NOTE
A device must be running ExtremeWare 6.2.2 or later in order for EPICenter to access
STP information for the device. Devices running earlier versions of ExtremeWare may
have STP configured, but EPICenter will not be able to provide information about the
configuration.
126
EPICenter Software Installation and User Guide
5
The EPICenter Alarm System
This chapter describes how to use the EPICenter Alarm System applet for:
• Viewing the alarms that have occurred
• Defining new alarms and modifying current alarm definitions
• Configuring threshold-based alarms
• Configuring EPICenter as a trap receiver
• Configuring EPICenter as a syslog receiver
Overview of the EPICenter Alarm System
The EPICenter Alarm System provides fault detection and alarm handling for the
network devices monitored by EPICenter. This includes Extreme Networks devices and
some third-party devices—those that EPICenter can include in its Inventory database.
The Alarm System provides a set of predefined, enabled alarms that will immediately
report conditions such as authentication or login failures, device problems such as
power supply or fan failures, reachability problems, or device reboots.
The Alarm System also lets you define your own alarms that will report errors under
conditions you specify, such as repeated occurrences or exceeding threshold values. You
can specify the actions that should be taken when an alarm occurs, and you can enable
and disable individual alarms.
Fault detection is based on Simple Network Management Protocol (SNMP) traps, syslog
messages, and some limited polling. The Alarm System supports SNMP Management
EPICenter Software Installation and User Guide
127
The EPICenter Alarm System
Information Base-2 (MIB-2), the Extreme Networks private MIB, Remote Monitoring
(RMON) traps, and selected traps from other MIBs. When an alarm occurs you can
specify actions such as sending e-mail, running a program, running a script, or
sounding an audible alert.
For convenience, the EPICenter Alarm System provides a number of predefined alarms.
These alarms are enabled by default and are active as soon as the EPICenter server
starts up. These include the following alarms:
• Authentication failure (SNMP MIB-2 trap)
• Invalid login (Extreme proprietary trap)
• Redundant Power Supply (RPS) alarm condition (Extreme proprietary trap)
• ESRP state change (Extreme proprietary trap)
• SNMP unreachable (EPICenter event)
• Configuration upload failure for an upload attempted from the EPICenter system
(EPICenter event)
• Overheat (EPICenter event)
• Fan failure (EPICenter event)
• Device reboot (EPICenter event)
• Health Check Failed (Extreme proprietary trap)
• Device Warning from EPICenter (EPICenter event)
NOTE
When Extreme Networks devices are added to the EPICenter Inventory database, they
are automatically configured to send traps to the EPICenter server. To receive traps
from non-Extreme Networks devices, you must manually configured the devices send
traps to the EPICenter server.
To receive syslog messages from an Extreme Networks device, EPICenter must be
configured as a syslog receiver on the device. See “Configuring EPICenter as a Syslog
Receiver” on page 172 for more information.
Not all trap events are supported in older versions of the ExtremeWare software. Please
refer to Appendix D for information on the switch software required for specific traps.
128
EPICenter Software Installation and User Guide
Overview of the EPICenter Alarm System
The Alarm Log Browser
Click the Alarm button in the Navigation Toolbar to run the Alarm System applet and
view the Alarm Log Browser. The Alarm button (icon) acts as an alarm indicator — if it
is displayed in red instead of black, it indicates that at least one new alarm has
occurred.
The Alarm Log Browser page appears, as shown in Figure 35.
Figure 35: The Alarm Log Browser page
Predefined filters
Alarm System module tabs
New alarm
Alarm summary
Current filter definition
indicator
EPICenter Software Installation and User Guide
Acknowledged
alarms
129
The EPICenter Alarm System
The Alarm Log Browser page displays a summary of the alarms that have occurred,
optionally filtered based on criteria you can specify. An alarm can be generated due to
an SNMP or RMON trap, a syslog message, or based on the results of a poll.
By default, the predefined alarms are all enabled; therefore, you may see alarm log
entries the first time you run the Alarm System, even if you have not defined any
alarms of your own.
The Alarm Log Browser summary displays the following information for each alarm
instance:
• ID — An integer number assigned by the EPICenter Alarm System based on the
order in which the alarm occurred
• Name — A name for the alarm, provided when the alarm is defined
• Category— An optional user-defined classification that defaults to “Default”
• Severity — The severity level associated with the alarm when it was defined
• Source — The IP address of the device that generated the trap or responded to a
poll
• Time — The date and time at which the alarm was received
• Message — The message generated by the alarm
• Acked — A green check will be present in this column if the alarm has been
acknowledged
The summary is initially sorted by ID in descending numerical order, so that the most
recent alarm appears at the top of the list.
You can sort the display by the contents of any column by clicking on the column
heading. Click the heading a second time to reverse the sort order based on that
column.
Acknowledging an Alarm
To acknowledge an alarm:
1 Select the alarm or alarms you want to acknowledge.
2 Click the Acknowledge (Ack) button at the top of the page.
This sets the state of the selected alarms to “acknowledged,” and places a green check
in the Acked field of the selected alarm log entries.
130
EPICenter Software Installation and User Guide
Overview of the EPICenter Alarm System
When you acknowledge the most recent alarm, the state of the Alarm button in the
EPICenter Navigation Toolbar also returns to black.
You can “unacknowledge” alarms, if needed,
by selecting the alarms and clicking the Unack button.
The Ack or Unack operation may take a few seconds to update the database. When the
update is complete, the rows are deselected.
Deleting Alarm Log Entries
To delete an alarm log entry:
1 Select the alarm entry or entries you want to delete.
2 Click the Delete button at the top of the page.
This removes the selected alarm log entries entirely from the EPICenter database.
Deleting Groups of Log Entries
You can also delete groups of alarm log entries based on specific filtering criteria that
you set, such as all entries in a certain timeframe, all entries for selected devices, and so
on.
To delete a group of alarm entries, click the Delete
alarms with specified conditions button at the top of the page.
The Delete alarm records with specified conditions window opens, as shown in
Figure 36.
EPICenter Software Installation and User Guide
131
The EPICenter Alarm System
Figure 36: Delete alarm records filter definition window
In this window you can define a filter — a set of conditions — to use to evaluate
whether an alarm record should be deleted. See “Deleting Groups of Log Entries” on
page 131 for more detailed information.
To create a delete filter, do the following:
1 If the “View last 300 alarms” check box is checked, the remaining fields will be
greyed-out. Uncheck the check box to enable the other fields.
2 Select the parameter you want to use as a filter criterion from the pull-down menu
in the Field field.
3 Select an operator using the pull-down menu in the Operator field.
4 Enter the value (or values) against which the parameter should be tested. If you
have chosen the Between operator (available for Log ID, Source IP, and Port IfIndex)
you will be asked to enter two values. For some parameters you can select values
from a drop-down list.
For a more detailed explanation of defining a filter condition. see “Filtering the
Alarm Display” on page 134.
132
EPICenter Software Installation and User Guide
Overview of the EPICenter Alarm System
5 Click the Add/Modify Condition button to add this specification to the filter
definition.
You can create a multi-criteria specification using more than one parameter, as
shown in Figure 36, as long as each parameter is different. You cannot filter using
multiple specifications of the same parameter.
For example, in order to delete alarms for IP addresses 10.205.0.55 and 10.205.0.61,
you must do this in two operations.
6 To remove an individual criteria, select it in the current filter list and click the
Remove Condition(s) button. You can select and remove multiple filter criteria.
7 When your filter definition is complete, click Delete.
The alarm records that meet the conditions are deleted.
If you simply want to delete that last 300 alarms, leave the “View last 300 alarms” box
checked, and click Delete.
Viewing Alarm Details
To view the details of an individual alarm:
1 Select the alarm you want to view.
2 Click the Detail button at the top of the page,
entry in the log.
or double-click on the alarm
The Alarm Log Detailed View is displayed, as shown in Figure 36.
EPICenter Software Installation and User Guide
133
The EPICenter Alarm System
Figure 37: Detailed view of an Alarm Log entry
This displays detailed information for the selected alarm.
From this window you can view details for other alarms:
• Enter or select an Alarm ID in the Go to alarm field.
• Click the Next button to view the next alarm down in the list (the next earlier alarm
based on the default sorting order).
• Click the Previous button to view the next alarm higher in the list (the next later
alarm based on the default sorting order).
Filtering the Alarm Display
The alarms you see in the Alarm Log browser are displayed based on a filtering criteria.
The default criteria is to display the last 300 alarms from the EPICenter database
(assuming you invoked the Alarm browser from EPICenter’s Navigation Toolbar). You
can select other filters from the pull-down field at the top of the alarm summary
134
EPICenter Software Installation and User Guide
Overview of the EPICenter Alarm System
display. There are three predefined filters based on time: “7 days ago,”, Last 24 hours,”
and “Yesterday.”
If you invoke the Alarm Browser from the Topology applet (using the pop-up menu for
a specific node) the default filter is set to filter on the Source IP of the node you
selected.
You can create your own filters based on criteria such as Source IP, Severity, Alarm
Name, LogID, and a number of others. You filter can combine multiple criteria.
To specify your own filter, click the Filter button at the top of the page.
The Define Alarm Log Filter window is displayed, as shown in Figure 36.
Figure 38: Alarm Log filter definition window
The Define Alarm Log Filter window opens displaying either the last filter definition
you created, or the default filter (View last 300 alarms).
EPICenter Software Installation and User Guide
135
The EPICenter Alarm System
To create your own filter, do the following:
1 Click the New button to clear the previous filter definition. If, the View last 300
alarms check box is checked, this will uncheck it and enable the other fields in the
window.
2 Select the parameter you want to use as a filter criterion from the pull-down menu
in the Field field.
3 Select an operator using the pull-down menu in the Operator field.
4 Enter the value (or values) against which the parameter should be tested.
The criteria you can specify are as follows:
• Log ID: An integer. You can test equality relationships (equal, not equal, greater
than. less than, greater than or equal, less than or equal) or for a range (Between).
If you choose Between you are asked to enter two values.
• Alarm Name: Text string. You can select an alarm name from the drop-down list
in the Value field, or enter a text string. You can test for an exact match or
non-match, or a substring (Contains). The Contains operator lets you match
against a substring (portion of text) that should be contained in the parameter
value.
• Category: Text string. You can select a category from the drop-down list in the
Value field, or enter a text string. You can test for an exact match or non-match,
or a substring (Contains).
• Severity: An alarm severity level. You must select a severity level from the
drop-down list in the Value field. You can test for an exact match or non-match.
• Source IP: IP address. Can test for exact match or non-match, or for a range
(Between). If you choose Between you are asked to enter two values. You cannot
match on a subnet.
• PortIfIndex: An integer. Can test equality relationships (equal, not equal, greater
than. less than, greater than or equal, less than or equal) or for a range (Between).
If you choose Between you are asked to enter two values.
• Time: You must select a time period from the drop down list in the Value field.
Criteria include periods such as Last 1 Hour, Yesterday, 2 Days Ago, etc. The
filter will match all alarms within the time period.
• Acked: Tests for Yes (matches all Acknowledged alarms) or No (matches all
unacknowledged alarms).
5 Click the Add/Modify Condition button to add this specification to the filter
definition.
136
EPICenter Software Installation and User Guide
Overview of the EPICenter Alarm System
You can create a multi-criteria specification using more than one parameter, as
shown in Figure 36, as long as each parameter is different. You cannot filter using
multiple specifications of the same parameter.
For example, in order to find and view alarms for IP addresses 10.205.0.55 and
10.205.0.61, you must use the Between operator to test for all Source IP addresses
between these two IP addresses. You cannot create a filter that includes both Source
IP = 10.205.0.55 and Source IP = 10.205.0.61.
6 To remove an individual criteria, select it in the current filter list and click the
Remove Condition(s) button. You can select and remove multiple filter criteria.
7 When your filter definition is complete, you can save it as a named filter, or you can
just apply it to the Alarm Log without saving it. To save it, click Save, and enter a
name into the dialog box that appears.
8 To apply the filter to the Alarm Log summary, click OK. This filters the display
based on the criteria you defined. You do not need to save the filter before you do
this.
If you do not save the filter definition before you apply it to the Alarm Log, you can
re-open the Define Alarm Log Filter window and save it then. The filter definition
will be retained in the Define Alarm Log Filter window until you either crete
another filter definition, or exit the Alarm System applet.
To restore the default filter definition, click the View last 300 alarms check box and click
OK.
Deleting Alarm Log Filters
You can delete any saved alarm log filters except for the default filter. To delete a filter,
do the following:
1 Click the Delete saved alarm log filters button.
This opens the Delete Filters window.
2 Select the filter you want to delete, and click OK.
Pausing All Alarms
You can temporarily stop the processing of all enabled alarms using the Pause/Resume
feature.
Click Pause
to stop processing enabled alarms. EPICenter ignores all traps when
its alarms are paused.
EPICenter Software Installation and User Guide
137
The EPICenter Alarm System
To resume processing traps, click Resume
.
Defining Alarms
For convenience, the EPICenter Alarm System provides a number of predefined alarms.
These alarms are all enabled by default and are active as soon as the EPICenter server
starts up. The predefined alarms generate alarm log entries upon occurrence, but no
other actions are specified.
You can modify the predefined alarms, or define additional alarms based on a fairly
large number of events.
To view the current alarm definitions, to create new definitions, or to modify existing
definitions, click the Alarm Definition tab at the top of the page. The Alarm System:
Alarm Definition page is displayed, as shown in Figure 39.
138
EPICenter Software Installation and User Guide
Defining Alarms
Figure 39: Alarm System: Alarm Definition page
To view the settings for an individual alarm, select the alarm. Its definition appears in
the fields below the alarm list. For a definition of the fields in the top portion of the
alarm definition, see the section “The Basic Alarm Properties” on page 141.
Alarm Actions — An alarm action is a function that the alarm system executes when an
alarm occurs, in addition to logging the occurrence of the alarm. By default the
predefined alarms have no actions defined for them (other than logging). Alarm actions
can include sending e-mail, sounding an audible alert, running a program or executing
a script. For the predefined alarms, an alarm event will create an entry in the Alarm
Log, but no other actions will occur. You can define additional actions for any of these
alarms.
Alarm Scope — Alarm scope defines which devices can trigger an alarm. The predefined
alarms are scoped by default for all devices and ports. Thus, a trap received from any
EPICenter Software Installation and User Guide
139
The EPICenter Alarm System
port or any device will trigger the corresponding alarm. You can modify the scope of
any of these alarms.
Creating a New Alarm Definition
To create a new alarm, click the Add button at the top of the page.
The New Alarm Definition window appears, as shown in Figure 40, and displays the
Basic page of the three-page alarm definition.
Figure 40: The New Alarm Definition window, Basic definition
There are three parts to an alarm definition: the Basic definition, the Scope definition,
and the Action definition. Each is represented on its own page in the New Alarm
Definition window.
Use the tabs at the top of the window to move between the three pages. When you are
finished with your alarm definition, click OK, and the alarm will be entered into the
Alarm Definition List.
140
EPICenter Software Installation and User Guide
Defining Alarms
The Basic Alarm Properties
On the Basic page, you define the event-related parameters of the alarm: its name,
severity, the event that will trigger it, and so on. The fields in this window are defined
as follows:
• Name — The name of the alarm as it will appear in the alarm log and (optionally)
elsewhere. This defines the variable alarmName
• Enabled — Indicates whether the alarm is “turned on” or not. If you uncheck this
box, the alarm will remain defined but will not be operational
• Category — The category assigned to this alarm. Select the category using the
pull-down menu at the end of the field (see the section “Creating a New Alarm
Category” on page 152 for more information). This defines the variable
alarmCategory.
• Severity — The severity of the alarm. Select one of the five severity levels from the
pull-down menu (normal, warning, minor, major, critical). This defines the variable
alarmSeverity. The severity level also determines the sound that will be played as an
audible alert.
• Event Type — The type of event (SNMP trap, RMON Trap Rising Alarm, RMON
Trap Falling Alarm, EPICenter, or Syslog message). This determines the list of events
you can select in the Event Name field.
An EPICenter event is generated by EPICenter based on the results of its periodic
polling. In some cases, a condition that causes an EPICenter event may also generate
an SNMP or other trap. Creating an alarm triggered by an EPICenter event
guarantees that the condition will eventually be detected by polling even if the
corresponding trap is missed.
See Appendix Dfor a description of the EPICenter and SNMP events supported by
the EPICenter Alarm System.
Certain SNMP events require configuration on the switch in order to enable specific
trap conditions.
RMON events (including Port utilization, temperature, or STP topology change
events) and events based on CPU utilization, are defined through the Threshold
Configuration page of the EPICenter Alarm System. RMON event rules can be
configured only on switches running ExtremeWare 6.1 or later. CPU Utilization rules
can only be configured on switches running ExtremeWare 6.2 or later.
To receive Syslog messages, the Syslog receiver function of EPICenter must be
enabled, and remote logging must be enabled with EPICenter configured as a Syslog
receiver on the devices from which you want to receive Syslog messages. See
EPICenter Software Installation and User Guide
141
The EPICenter Alarm System
“Configuring EPICenter as a Syslog Receiver” on page 172 for more information.
Syslog messages received from devices not managed by EPICenter are ignored.
For certain other events, you must do the configuration on the switch using an
SNMP configuration tool such as SNMPc. See “Configuring Other SNMP Trap
Events” on page 172 for more information.
The event type is concatenated with the event name to define the variable
eventTypeName.
• Event Name — The specific event (trap) that should trigger this alarm. Select the
event from the pull-down list provided. For RMON Rising or RMON Falling trap
types, the RMON rule name is used as the event name. The full-down list includes
the configured RMON rule names. See Appendix D for a description of the
EPICenter and SNMP events from which you can choose.
The event name is concatenated with the event type to define the variable
eventTypeName.
• Pattern Matching on Event Data — You can specify that the alarm should be
triggered only if the data provided with the event matches a specific pattern. If you
leave this unchecked, the default is “Don’t Care.” Pattern matching is done on the
contents of the eventData variable.
The pattern matching syntax uses regular expressions. You can use “*” or “%”
(asterisk or percent) to match any sequence of characters. “?” or “_” (question mark
or underscore) can be used to match a sequence of characters.
To match one of a set of characters, enclose the characters in brackets. For example,
[abcd] will match one of a, b, c, or d.
• Message — A message you specify that will be transmitted whenever the alarm
occurs. By default, this field contains the variable eventTypeName. You can delete
this variable, add other variables as provided in the variable pop-up list, and add
your own text. For Syslog messages, use the eventData variable to display the
Syslog message.
• Variables... — A pop-up list that provides a list of variables you can select to include
in the Message field. See Table 4 for a definition of the Alarm System variables you
can use in the message field.
• Repetitive occurrence specification (If event happens... ) — The required number of
repeated occurrences of the event that must occur before an alarm is generated. You
can specify both the number of times the event must occur, and the time frame
within which these events must occur. This lets you define alarms that will filter out
short-lived or non-repeatable events, and will only take action if the triggering event
occurs repeatedly within a sufficiently short time frame.
142
EPICenter Software Installation and User Guide
Defining Alarms
Table 4: EPICenter Alarm Variables
Variable Name
Description
alarmID
An integer number assigned by the EPICenter
Alarm System based on the order in which the
alarm occurred
alarmName
The name of the alarm as defined in the Name
field
alarmCategory
The user-defined alarm category assigned to the
alarm
alarmSeverity
The severity level assigned to the alarm
alarmRepeatTimes
The number of times the event must occur before
an alarm is generated
alarmRepeatPeriod
The time frame within which the repeated events
must occur for the alarm to be generated
alarmSourceDeviceName
The name of the device on which the event(s)
occurred (taken from the EPICenter database)
alarmSourceIP
The IP address of the device on which the event(s)
occurred
alarmSourceIfIndex
The interface on the device on which the event(s)
occurred
alarmGMTTime
The time at which the alarm occurred, in
Greenwich Mean Time
alarmLocalTime
The time at which the alarm occurred, in local time
alarmMessage
The message defined for the alarm (for use by an
external program executed as an alarm action)
alarmActions
The list of actions defined for the alarm
eventLogID
The ID of the event in EPICenter’s event log
eventTypeName
The type of event (SNMP Trap, RMON Rising
Trap, RMON Falling Trap, or EPICenter event)
concatenated with the Event Name (the SNMP trap
name, RMON rule name, or EPICenter event
name).
eventGenericType
The SNMP Generic Type number of the trap
eventSpecificType
The SNMP Specific Type number for an
enterprise-specific trap
eventSpecificTypeStr
The event description
eventEnterprise
The Enterprise portion of the Object ID (OID) of
the event
EPICenter Software Installation and User Guide
143
The EPICenter Alarm System
Table 4: EPICenter Alarm Variables
Variable Name
Description
eventData
The data associated with the trap, or the Syslog
message content
The Alarm Scope
To define a scope for the alarm, click the Scope tab. The Scope definition page is
displayed, as shown in Figure 41.
Figure 41: The New Alarm Definition window, Scope definition
In this window you define the scope of the alarm—the set of devices that can trigger
the alarm. You can define the scope as a set of individual devices, one or more device
groups, as a set of individual ports, or as one or more port groups.
To define the alarm scope, you select a Source Type (and Device Group, if appropriate),
select individual devices, ports, device groups, or port groups, and add them to the
Selections list. The scope can contain a combination of source types.
144
EPICenter Software Installation and User Guide
Defining Alarms
The fields and buttons in this window are defined as follows:
• Scope on all devices and ports — When this is checked, an event received from any
device or device port will trigger the alarm. In addition, as new devices are added to
the EPICenter inventory database, those devices and ports will also be included in
the device scope.
Uncheck the checkbox to enable scoping by specific devices, device groups, ports or
port groups.
• Source Type — The source of the scoping definition (Device, Device Group, Port, or
Port Group). Select the type you want from the pull-down list.
Selecting Device Group or Port Group will scope the alarm on all members of the
selected group. Group membership is evaluated every time a trap is received.
Therefore, changes to the group membership (adding or removing devices or ports)
will have an immediate effect on alarm processing.
To scope the alarm on individual devices or ports, select Device or Port.
For events that originate from a device port (such as link down) the scope will
determine whether the alarm is generated based on an event from a single port, or
on events from any port on a device, or from any port on any device in a device
group.
For example, if you want to define an alarm that is fired for any port on device A,
you can scope the alarm as “Device,” select the appropriate device group, and select
Device A. If you want to define the alarm only to be fired on selected ports on
Device A, then you would scope the alarm as “Port,” select Device A, and then
select the individual ports. You could also define a port group for the specific ports
of interest, the scope the alarm as Port Group and select the appropriate group.
• Select Group — If you select Device or Port as the Source Type, you must select a
Device Group to indicate what set of devices (and ports) you want to see in the
Source List.
• Source list (Device/Device Group/Port Group) — The list of components of the
specified type. The field label changes based on the Source Type. It is labeled Device
when you select either Device or Port as the Source Type.
• ifIndex — The list of ports available on the device selected in the Devices Source list.
This list appears only if you have selected Port as the Source Type. Select a device
from the Device list, and the appropriate set of ports for the device appears.
• Selection — The devices, ports, device groups, or port groups that are currently
included in the scope.
• Add-> — Adds the selected Device(s), Port(s), Device Groups or Port Groups to the
Selections list, for inclusion in the scope of this alarm.
EPICenter Software Installation and User Guide
145
The EPICenter Alarm System
• Add All-> — Adds all the components in the Source list to the Selection list.
• <-Remove — Removes the selected components from the Selection list.
• <-Remove All — Removes all the components from the Selection list.
The Alarm Actions
To define actions for the alarm, click the Actions tab. The Action definition page is
displayed, as shown in Figure 42.
Figure 42: The New Alarm Definition window, Action definition
In this window you define the actions for the alarm—the functions that should be
performed when the alarm occurs. You can have the alarm perform any or all of the
actions defined here.
The fields and buttons in this window are defined as follows:
• Sound Alert — Click the check box to have the alarm system play an audible alert
on the client computer when the alarm occurs. The alarm will sound on all
EPICenter clients currently connected to the EPICenter server. The sound that is
played will depend on the severity level of the alarm.
146
EPICenter Software Installation and User Guide
Defining Alarms
The alert sound files are kept on the EPICenter server in the directory
<epicenter_installdir>\extreme, and are named according to the severity level
they represent (normal.wav, warning.wav and so on). <epicenter_installdir> is
the directory where EPICenter is installed, by default epc4_0 in the Windows
operating environment, or /opt/epc4_0 on a Solaris system.
• Email to — Click this check box to indicate that e-mail should be sent, then enter the
e-mail address(es) of the recipients for the e-mail. E-mail addresses in a list can be
separated by commas, semicolons, or spaces.
Full email provides the alarm number, alarm name, source IP address and ifIndex,
severity and message in the subject header. In the body of the email it provides the
alarm time, alarm name, alarm category, severity, source IP address and ifIndex,
alarm message, the event name that triggered the alarm, the result of the alarm
action, and a URL link to the EPICenter server.
• Short email to — Click this check box to indicate that a short e-mail (appropriate for
text paging) should be sent. Then enter the e-mail address(es) of the recipients for
the e-mail. E-mail addresses in a list can be separated by commas, semicolons, or
spaces.
Short email provides the alarm number in the subject header, and the alarm name,
source IP address and ifIndex, severity, and alarm message in the body of the email.
For example, a short email might contain the following information:
Subject: Alarm #4017
Body: link down, 10.255.59.150, ifIndex 17, Normal, SNMP Trap Link Down
If this email format is still too long, you can write a customized email message by
writing a script using the ::extr::sendMail command. See “Writing Tcl Scripts for
Alarm Actions” on page 174 for more information.
NOTE
If this box is greyed out, you must first configure your e-mail settings. See “Setting
Up E-mail for the Alarm System” on page 148 for details.
• Forward Trap to: Click this checkbox to forward the trap event that caused this
alarm. Specify the forwarding instructions in the fields to the right of the check box
as follows:
— Host: Enter the host name or host IP address of the system to which the trap
should be forwarded.
— Port: Enter the port on which the specified host receives traps.
EPICenter Software Installation and User Guide
147
The EPICenter Alarm System
— Community String: Enter the community string for the specified host.
• Run program: Click the check box to have the Alarm System run a program when
this alarm occurs. Enter the command string for the program you want to run. You
can include Alarm System variables as arguments by clicking the Variables... button
and selecting the variables you want. See Table 4 on page 143 for a definition of the
Alarm System variables you can use in the message field.
NOTE
On a Windows NT or WIndows 2000 system, if you are running the EPICenter
server as a service, and if you want to run a program that does output to the
desktop, you must specify that output to the desktop is allowed when you start the
server service. Otherwise, the program will not run. See the Alarm System section in
Appendix A for instructions on restarting the EPICenter server service with this
option enabled. If you are running the EPICenter server as a regular program, this is
not a problem.
NOTE
If you want to specify a batch file that does output to the desktop, you must specify
the “.bat” file within a DOS “cmd” command, as follows:
cmd /c start <file.bat>
where <file.bat> is the batch file you want to run.
• Execute script: Click the check box to have the Alarm System execute a Tcl script
when this alarm occurs. Enter the script commands into the window provided.
You can write your own scripts that access selected EPICenter database variables. See
“Writing Tcl Scripts for Alarm Actions” on page 174 for more information.
Setting Up E-mail for the Alarm System
Before you can use the e-mail action, you must configure the e-mail capability. Until
you do so, the Email To field and check box will not be available. To configure the
e-mail capability, do the following:
1 Click the Settings... button on the Action page.
This displays the Email Settings window, as shown in Figure 43.
148
EPICenter Software Installation and User Guide
Defining Alarms
Figure 43: Setting up E-mail for EPICenter alarm actions
2 Enter your outgoing mail server name (or IP address) into the SMTP Host: field.
3 Enter into the Sent By: field the e-mail address that should be used as the sender of
the e-mail.
4 If your mail server authenticates the user before sending out e-mail, check the My
server requires authentication check box, and enter the user name and password of
an account that the SMTP server will accept. Usually this will be the account you use
to log into your network.
If you don’t know whether your server requires authentication, you can go ahead
and enter the authentication information—it will be ignored if it is not actually
needed.
Alarm Definition Examples
Example 1: Define an alarm that will page “Joe” at “4083236789@paging.com” if port 10
on device “switch8” goes down.
1 Bring up the New Alarm Definition dialog. On the Basic page, do the following:
a Type a name for the alarm (for example, WAN Link Down) in the Name field.
b Make sure the Enabled checkbox is checked.
c
Select a category (e.g. “Default”) in the Category field.
d Select “SNMP Trap” in the Event Type field.
e Select “Link Down” in the Event Name field.
2 Click the Scope tab, and do the following:
a Uncheck the All devices and ports checkbox.
b Select “Port” in the Source Type field.
EPICenter Software Installation and User Guide
149
The EPICenter Alarm System
c
Select “switch8” from the Device list.
d Select “10” from the ifIndex list.
e Click the Add button to add port 10 to the Selection list.
3 Click the Action tab, and do the following:
a Click the Short email to: check box to turn on the check.
b Type 4083236789@paging.com in the text field next to the checkbox.
4 Click OK to finish the alarm definition.
Example 2: Define an alarm that will page “Joe” at “4083236789@paging.com” if any
port on device “switch8” goes down.
1 Bring up the New Alarm Definition dialog. Fill in the fields on the Basic page just
as you did in Example 1.
2 Under the Scope tab, do the following:
a Uncheck the All devices and ports checkbox.
b Select “Device” in the Source Type field, instead of “Port.”
c
Select “switch8” from the Device list as in Example 1.
d Click the Add button to add switch8 to the Selection list. No ifIndex list will be
displayed.
3 Click the Action tab, and enter Joe’s paging information as you did in Example 1.
4 Click OK to finish the alarm definition.
Example 3: In a Windows NT environment (where both the EPICenter server and client
are running under Windows), define an alarm that will pop up a message on the
Windows client system “joe” if the port utilization on port 10 on device “switch8”
exceeds 15 percent.
This alarm requires an RMON rule with a Rising Threshold of 15 percent for port
utilization. You can define the RMON rule either before or after you define the alarm.
See “RMON Rule Configuration Example” on page 168for an example of how to create
the RMON rule.
To create the alarm definition:
1 Bring up the New Alarm Definition dialog. On the Basic page, fill in the Name and
Category fields, and check the Enabled checkbox, just as you did in Example 1.
a Select “RMON Rising Trap” in the Event Type field.
150
EPICenter Software Installation and User Guide
Defining Alarms
b Enter the RMON rule name in the Event Name field:
If you have already created the RMON rule, you can select it from the pull-down
menu in the Event Name field. For example, if you named the rule “WAN Link
15%”, that name should appear in the pull-down menu.
If you have not yet created the RMON rule, type in a name for the rule (for
example, “WAN Link 15%”). You will need to use this name for the rule when
you create it.
See “RMON Rule Configuration Example” on page 168 for an example of how to
create the RMON rule.
2 Click the Scope tab, and enter the port information as you did in Example 1:
a Uncheck the All devices and ports checkbox.
b Select “Port” in the Source Type field.
c
Select “switch8” from the Device list.
d Select “10” from the ifIndex list.
e Click the Add button to add port 10 to the Selection list.
3 Click the Action tab, and do the following:
a Click the Run Program checkbox to turn on the check.
b Type net send joe "$alarmName" in the text field next to the checkbox.
NOTE
This program is only available on the Windows platform.
4 Click OK to finish the alarm definition.
Modifying Alarm Definitions
To modify an alarm, select the alarm in the Alarm Definition
List, and click the Modify button at the top of the page.
The Modify Alarm Definition window is displayed. This window, and its Basic, Scope
and Action pages, are identical to the New Alarm Definition window, except that the
current information for the alarm you selected is filled in.
To modify the alarm, make any changes you want, then click OK. For definitions of the
various fields, see the section “Creating a New Alarm Definition” on page 140.
EPICenter Software Installation and User Guide
151
The EPICenter Alarm System
Deleting Alarm Definitions
To delete an alarm definition, select the alarm in the Alarm
Definition List, and click the Delete button at the top of the page.
After you verify that you want to delete the alarm, the definition is removed from the
Alarm Definition List and from EPICenter’s database. You must remove alarm
definitions one at a time.
Alarm Categories
Alarm categories are arbitrary collections of alarms that you can define as appropriate
to your needs, and then assign to specific alarm definitions. For example, you might use
categories to designate alarms from individual buildings, floors, or workgroups. An ISP
might define categories for alarms from a specific customer’s equipment.
By default, all alarms are assigned to the category named Default. This category can be
renamed, but it cannot be deleted.
Creating a New Alarm Category
To create a new alarm category, click the Add button at the top of the window.
A small pop-up window appears into which you can enter the name of the new
category. Click OK to enter the new category into the Category List.
Modifying an Alarm Category
To rename an alarm category, click the Modify button at the top of the window.
A small pop-up window appears and displays the current name of the category. Modify
the name and click OK to enter the revised category into the Category List.
When an alarm category is renamed, all alarms assigned to that category are updated to
use the new category name.
152
EPICenter Software Installation and User Guide
Threshold Configuration
Deleting an Alarm Category
To delete an alarm category, select the category from the Category
List, then click the Delete button at the top of the window.
WARNING!
Deleting a category also deletes all the alarm definitions that are assigned to that
category. If you do not want to delete those alarm definitions, you must first modify the
alarm definitions to use a different alarm category before you delete the category.
A warning message appears to let confirm that you want to delete the category and the
alarm definitions that are assigned to it. Click OK to delete the category and the alarms
from the EPICenter database.
The Default category cannot be deleted.
Threshold Configuration
The Threshold Configuration page lets you define the conditions or rules that will cause
certain trap events to occur, and specify the devices on which these rules should be
configured. You can use this page to define thresholds for RMON utilization or CPU
utilization. You can configure RMON threshold traps for a wide range of variables, but
several (specifically port utilization, temperature, and STP topology change) have been
partially predefined to make the rule definition process easier.
In these types of events, traps are generated based on comparing the value of the
relevant sample variable with a threshold value. The rules you set up specify the
threshold values. Once these rules are in place, you can use them in your EPICenter
alarm definitions to create alarms that will take actions when a trap is received for a
sample value that crosses one of the thresholds you’ve defined.
There are other SNMP traps supported by the EPICenter Alarm System, but not
included in the threshold configuration function, that may require conditions to be set
on the switch to define when a trap should occur. See “Configuring Other SNMP Trap
Events” on page 172 for additional information.
EPICenter Software Installation and User Guide
153
The EPICenter Alarm System
In addition to specifying the conditions under which trap events should be generated,
you also use this page to define the target devices on which the event rules should be
configured.
NOTE
Creating the rules that control trap (event) generation is only the first of the two steps
required to create EPICenter alarms for these events. Even though you have set up
these rules, the trap events generated as a result will be ignored by the Alarm System
until you define alarms that take actions on those events. See “Defining Alarms” on
page 138 for more information.
To view the current threshold configuration rules, and to create new rules or modify
existing rules, click the Threshold Configuration tab at the top of the page. The Alarm
System Configuration page is displayed. Figure 44 shows the Alarm System
Configuration page as it appears when displaying RMON rules for a device.
154
EPICenter Software Installation and User Guide
Threshold Configuration
Figure 44: The Threshold Configuration window showing RMON rules
The Configurations tree shows the existing RMON rule definitions as nodes in the tree,
with the devices to which they are applied shown as subnodes. The main panel shows
the definition for the selected rule on each target device.
CPU Utilization is a predefined node in the Configurations tree. Devices on which a
CPU utilization rule is configured are shown as subnodes of the CPU Utilization node.
There can be only one CPU utilization rule per device.
Click the small plus next to a rule node to display in the tree the devices associated
with that rule.
To display the definition of a rule, click the rule node.
RMON Rule Display
For RMON rules, the display shows the following for each device targeted by that rule:
EPICenter Software Installation and User Guide
155
The EPICenter Alarm System
• Device: The name of the device
• Variable: The MIB variable being monitored
• Sample Type: Absolute or Delta
• Sample Interval: The time between samples, in seconds.
• Rising Threshold: A threshold value that will trigger an event when the value of the
variable increments past this value.
• Falling Threshold: A threshold value that will trigger an event when the value of
the variable decreases past this value.
• Startup: The condition that will cause the initial event (Rising, Falling, or
RisingOrFalling).
• Index: the device index as obtained by the EPICenter server from the device.
For a detailed definition of these parameters, see “Configuring an RMON Rule” on
page 159.
CPU Utilization Rule Display
To display the CPU Utilization rules, click the CPU Utilization node in the
Configurations tree.
Figure 45 shows the Alarm System Configuration page as it appears when displaying
CPU Configuration rules for a selected device.
156
EPICenter Software Installation and User Guide
Threshold Configuration
Figure 45: The Threshold Configuration window showing CPU Configuration rules
For each device targeted by that rule, the CPU Utilization rule display shows the
following:
• Device: The name of the device
• Variable: The MIB variable being monitored (always
extremeCpuUtilRisingThreshold.0)
• Rising Threshold: A threshold value that will trigger an event when the CPU
Utilization value (a percentage) increments past this value.
This value is also used to calculate a Falling Threshold value, which is to be 90% of
the Rising Threshold value.
For a detailed definition of these parameters, see “Rule Configuration for the Predefined
RMON Event Types” on page 166.
EPICenter Software Installation and User Guide
157
The EPICenter Alarm System
Creating an Event Rule
To create a new event rule, click the Add button at the top of the page.
The New Configuration window is displayed, as shown in Figure 46.
Figure 46: New Configuration window for an RMON Rule
There are two parts to an event rule; the rule configuration itself, and the association of
the rule to its target devices.
The New Configuration window comes up with the Configuration page displayed.
In the Configuration Type field, select the type of rule you want to create (RMON
Event, CPU Utilization, Port Utilization, Temperature, or Topology change) from the
drop-down list.
NOTE
CPU Utilization is only supported on switches running ExtremeWare 6.2 or later. STP
Topology change traps are only supported on switches running ExtremeWare 6.2.2 or
later.
When you finish entering the configuration and target information, click the Apply
button, and the new rule is added to the Configurations tree. For RMON rules, the rule
158
EPICenter Software Installation and User Guide
Threshold Configuration
name is included as a “folder” and each target device for the rule appears as a separate
component under that rule. The rule name will also appear in the Event Name list.
For CPU Utilization rules, each target device for a CPU utilization rule appears as a
separate component under the CPU Utilization “folder” in the Configurations tree.
Configuring an RMON Rule
If you select RMON Event as the Configuration Type, the fields and buttons in this
window are defined as follows:
• Name: The name for this rule.
• MIB Variable: The MIB variable that the rule will monitor.
Type in the complete OID, or click the Look Up... button to bring up a list of
variables that are available, organized by MIB groups, as shown in Figure 47.
Figure 47: A list of MIB variables available for use in RMON rules
Click on a variable group to display the individual variables within the group. You
can use the up and down arrow keys to scroll the list.
EPICenter Software Installation and User Guide
159
The EPICenter Alarm System
You can also type the beginning of a variable name into the MIB Variable field, then
type a space, and the Alarm System will attempt to match your typing to the
variable list and auto-complete your entry.
MIB variables that apply to the entire device will have the suffix “.0” appended to
them to create the complete OID. MIB variables that apply per port will be combined
with the port ifIndex to generate the OID.
NOTE
The MIB variable list displays only the MIBs that were shipped with the EPICenter
software. It does not display table variables in tables indexed by an index other than
(or in addition to) ifIndex.
If the MIB variable you want to monitor does not appear in the MIB Variable lookup
list, you can still use the variable by typing its complete OID into the MIB Variable
field. Enter the OID in its numeric form, ending in .0 if it is a per device variable, or
in the specific index if it is a per-port variable. If it is a table variable, you may need
to enter each index and apply it to each target device one by one.
• Description: The description of the MIB variable. This description should specify the
units of measure for the variable, needed in order to correctly specify the Rising
Threshold and Falling Threshold values.
• Rising Threshold: A threshold value that will trigger an event when the value of the
variable increments past this value. An event will be generated when the sample
value meets the following conditions:
— When the sample value becomes greater than or equal to the Rising Threshold for
the first time after the alarm is enabled, if the Startup Alarm condition is set to
Rising or RisingOrFalling
— The first time the sample value becomes greater than or equal to the Rising
Threshold, after having become less than or equal to the Falling Threshold
• Falling Threshold: A threshold value that will trigger an event when the value of
the variable decreases past this value. An event will be generated when the sample
value meets the following conditions:
— When the sample value becomes less than or equal to the Falling Threshold for
the first time after the alarm is enabled, if the Startup Alarm condition is set to
Falling or RisingOrFalling
— The first time the sample value becomes less than or equal to the Falling
Threshold, after having become greater than or equal to the Rising Threshold
160
EPICenter Software Installation and User Guide
Threshold Configuration
• Sample Type: The method used to compare the variable to the threshold. Specify the
type as follows:
— Absolute to use the actual sample value of the variable
— Delta to calculate the difference between the current sample value and the
previous sample value of the variable, and use the difference in the comparison
• Sample Interval (seconds): The interval, in seconds, over which the data is sampled
and compared to the rising and falling thresholds.
• Startup Alarm: The condition that should be met to cause the initial occurrence of
this event. Select from the following:
— Rising: an event will be generated the first time the sample value becomes
greater than or equal to the Rising Threshold value. No events will be generated
related to the Falling threshold until after this has occurred.
— Falling: an event will be generated the first time the sample value becomes less
than or equal to the Falling Threshold value. No events will be generated related
to the Rising threshold until after this has occurred.
— RisingOrFalling: an event will be generated the first time the sample value
becomes either greater than or equal to the Rising Threshold value, or less than
or equal to the Falling Threshold value.
It is important to understand that, except for the initial occurrence of the alarm, an
RMON alarm event will be generated only the when the sample value of the variable
crosses one of the thresholds for the first time after having crossed the other threshold.
NOTE
To configure an alarm using an RMON threshold event, select RMON Rising or RMON
Falling as the Event Type.
The following diagram, shown in Figure 48, shows how alarms are generated for an
RMON rule using Delta values, where the startup alarm condition is set to “Rising” or
“RisingOrFalling.”
EPICenter Software Installation and User Guide
161
The EPICenter Alarm System
Figure 48: RMON Alarm event generation
Sampled
variable
value
Initial
sample
value
B
Rising
threshold
Falling
threshold
A
E
C
D
Time (sample intervals)
= alarm event generated
XM_022
Because the initial sample value of the variable is greater than the value of the Rising
threshold, an RMON rising threshold trap is generated. A second trap occurs at the next
sample interval (point A) because the sample variable value is now less than the Falling
Threshold. At point B the value again passes the Rising Threshold, and another trap
event is generated. However, no trap occurs at point C, even though the value of the
variable again becomes greater than the Rising Threshold, because the value has not yet
become less than the Falling threshold. Another Rising threshold trap event cannot
occur until after a Falling threshold alarm has occurred, as happens at point D.
Note that in order to have any of these trap events cause an alarm in the EPICenter
Alarm System, you need to define an alarm that responds to a RMON Rising Threshold
or RMON Falling Threshold event.
• If you define an alarm based on the RMON Rising Threshold event, then EPICenter
alarms will occur at the initial sample, and at points B and E. Because the alarm is
defined to respond to RMON Rising Threshold events, the falling threshold trap
events that occur at points A and D do not trigger an EPICenter alarm.
• If you also define an alarm based on an RMON Falling Threshold event, then
EPICenter alarms would also be generated at points A and D.
162
EPICenter Software Installation and User Guide
Threshold Configuration
For a more detailed discussion of Remote Network Monitoring alarm behavior, refer to
a book such as SNMP, SNMPv2, SNMPv3, and RMON 1 and 2, Third Edition, by
William Stallings (Addison-Wesley, 1999).
Configuring a CPU Utilization Rule
NOTE
CPU Utilization is only supported on switches running ExtremeWare 6.2 or later.
If you select CPU Utilization, only the Rising Threshold field allows input, as shown in
Figure 49. The other fields and buttons in this window are predefined.
Figure 49: New Configuration window for a CPU Utilization Rule
The fields displayed are defined as follows:
• Rule Name— For CPU Utilization, the name is predefined because there can only be
one rule of this type on a device.
• Rising Threshold— A threshold value, in percent, that will trigger an event when
the CPU utilization rises past this value. This value is also used to compute a falling
threshold, which is defined as 80% of the rising threshold.
• Description: The description of the extremeCpuUtilRisingThreshold MIB variable.
EPICenter Software Installation and User Guide
163
The EPICenter Alarm System
The other parameters that you can set when you configure an RMON event, are
predefined in the Extreme switch agent for a CPU Utilization event. These are:
• MIB Variable: The MIB variable is predefined to be
extremeCpuUtilRisingThreshold.0.
• Falling Threshold: This is predefined as 80% of the rising threshold
• Sample Interval: The sample interval for a CPU Utilization alarm is also predefined,
and is set to 3 seconds
• Sample Type: The sample value (a percentage) is always an absolute value
• Startup Alarm: The Startup condition is predefined to be Rising
NOTE
To define an alarm for a CPU Utilization threshold event, select SNMP Trap as the
Event Type, then select CPU Utilization Rising Threshold or CPU Utilization Falling
Threshold as the Event Name.
If you define an alarm for a CPU Utilization Rising Threshold event, an alarm will
be generated each time the sample value meets the following conditions:
— When the sample value becomes greater than or equal to the Rising Threshold for
the first time (including the initial sample) after the alarm is enabled.
— The first time the sample value becomes greater than or equal to the Rising
Threshold, after having become less than or equal to the Falling Threshold (80% of the
Rising threshold).
If you define an alarm for CPU Utilization Falling Threshold events, an event will be
generated each time the sample value meets the following conditions:
— The first time the sample value becomes less than or equal to 80% of the Rising
Threshold, after having become greater than or equal to the Rising Threshold.
It is important to understand that, except for the initial occurrence of a Rising Threshold
alarm, a CPU Utilization alarm will be generated only the when the sample value of the
variable crosses the target threshold for the first time after having crossed the other
threshold.
The diagram shown in Figure 50 illustrates how CPU Utilization trap events will occur
once you have configured a CPU Utilization rising threshold. The startup condition for
a CPU Utilization event is always predefined to be Rising.
164
EPICenter Software Installation and User Guide
Threshold Configuration
Figure 50: CPU Utilization event generation
Sampled
CPU
utilization
value
Initial
sample
value
B
C
A
Rising
threshold
Falling
threshold
(90% of
rising)
Z
X
Y
Time (sample intervals)
= alarm event generated
XM_023
The first CPU Utilization trap occurs at the initial sample value, since the value is above
the CPU Utilization Rising threshold. If the initial value were below the Rising
threshold, no event would occur.
The second event occurs at point X, because the sample value has fallen below the
falling threshold, which is defined as 80% of the rising threshold value. The third event
occurs at point A because the sample value is again above the Rising Threshold after
having fallen below the Falling threshold. At point B the value again passes the Rising
Threshold, but no alarm is generated because the value has not yet become less than the
Falling threshold. Another Rising threshold alarm cannot occur until after a Falling
threshold event has occurred, which happens at point Y. The next Rising threshold
event happens at point C.
Note that in order to have any of these events cause an alarm in the EPICenter Alarm
System, you need to define an alarm that responds to a CPU Utilization Rising
Threshold or CPU Utilization Falling Threshold event.
• If you define an alarm based on the CPU Utilization Rising Threshold event, an
EPICenter alarm will occur at the initial sample, and at points A and C. Because the
alarm was defined to respond to CPU Utilization Rising Threshold events, the falling
threshold trap events that occur at points X and Y do not trigger an EPICenter
alarm.
EPICenter Software Installation and User Guide
165
The EPICenter Alarm System
• If you also define an alarm based on a CPU Utilization Falling Threshold event, then
EPICenter alarms would be generated at points X and Y.
Rule Configuration for the Predefined RMON Event Types
The Port Utilization, Temperature and Topology Change configuration types are
actually RMON utilization rules with a predefined configuration interface. The New
Configuration window is the same (see Figure 49), except that you must provide a name
for the rule
NOTE
STP Topology change traps are only supported on switches running ExtremeWare 6.2.2
or later.
The fields in this window are defined as follows:
• Rule Name: The name for this rule. For these events, this is user-defined.
• Rising Threshold: A threshold value that will trigger a trap event when the value of
relevant variable rises past this value. The thresholds are specified based on the
configuration type as follows:
— Port Utilization — A threshold value, in 100ths of a percent, that will trigger an
event when the port utilization rises past this value.
— Temperature — A threshold value, in degrees celsius, that will trigger an
Overheat event when the temperature rises past this value.
— Topology Change — An integer threshold value that will trigger a topology
change event when the total number of topology changes seen by this device
since the management entity was last reset or initialized, rises past this value.
For these rules, like a CPU utilization rule, the falling threshold is automatically
defined based on the value of the rising threshold. The falling threshold is set to be
90% of the rising threshold value.
• Description: The description of the relevant MIB variable for the selected rule type.
The other parameters that you can set when you configure an RMON event, are
predefined in the Extreme switch agent for these three events. These are:
• MIB Variable: The MIB variable is predefined to be one of the following:
— For Port utilization: extremeRtStatsUtilization.0
— For Temperature: extremeCurrentTemperature.0
166
EPICenter Software Installation and User Guide
Threshold Configuration
— For Topology Change: dot1dStpTopChanges.0
• Falling Threshold: This is predefined as 90% of the rising threshold.
• Startup Alarm: The Startup condition is predefined to be Rising or falling.
• Sample Interval: The sample interval is also predefined, and is set to 15 seconds.
• Sample Type: The sample value is an absolute value.
NOTE
To define an alarm using one of these predefined threshold events, select RMON Trap
Rising Alarm or RMON Trap Falling Alarm as the Event Type in the Alarm Definition
window.
Configuring the Rule Target
Click the Target tab to display the New Configuration Target page, as shown in
Figure 51.
This page lets you specify which devices should be configured to generate the event
you have defined.
Figure 51: RMON target selection window
EPICenter Software Installation and User Guide
167
The EPICenter Alarm System
The fields and buttons in this window are defined as follows:
• Source Type: The source of the RMON rule targets (Devices, Device Groups, Ports,
or Port Groups). Select the type you want from the pull-down list. The choices you
have are determined by the variable you selected for the rule. For example, if the
variable you have selected to monitor is applied per port, you will be able to select
by Port or Port Group.
• Source List (Device/Device Group/Port Group): The list of components (devices or
groups) of the specified type. The field label changes based on the Source Type. It is
labeled Device when you select either Device or Ports (a second Port field is
provided for port selection).
Note that when you leave your cursor on a device for a moment, a pop-up displays
the IP address of the device.
• Source List (Port): The list of ports available on the device selected in the Devices
Source list. This list appears only if you’ve selected Ports as the Source Type. Select a
device from the Device list, and the appropriate set of ports for the device appears.
• Selection: The devices, ports, device groups, or port groups that are currently targets
for the RMON rule.
• Add->: Adds the selected Device(s), Port(s), Device Groups or Port Groups to the
Selections list, for inclusion as a target for this rule.
• Add All->: Adds all the components in the Source list to the Selection list
• <-Remove: Removes the selected components from the Selection list.
• <-Remove All: Removes all the components from the Selection list.
RMON Rule Configuration Example
Example: Create an RMON rule that will cause an RMON Rising Trap when port
utilization on port 10 of device “switch8” exceeds 15%.
1 Bring up the New Configuration dialog. On the Configuration page, do the
following:
a Type a name for the rule in the Name field (for example, “WAN Link 15%”).
If you have already created an alarm definition that will use this rule, make sure
the name matches the name you entered in the alarm definition.
b Click the Look up... button to display the Select MIB Variable dialog.
c
168
Expand the Extreme folder, select the extremeRtStatsUtilization variable, and
click OK to enter it into the MIB Variable field.
EPICenter Software Installation and User Guide
Threshold Configuration
d Type “1500” in the Rising Threshold field. Note that for this variable the value
must be in hundredths of a percent.
e Type a smaller value, for example “1450” in the Falling Threshold field.
f
Leave the Sample Type as “Absolute” and the Sample Interval at the default
value (15).
g Select Rising for the Startup Alarm field.
2 Click the Target tab and do the following:
a Select Port as the Source Type
b Select “switch8” from the Device list
c
Select 10 from the ifIndex list
d Click Add to add the port to the Selection list
3 Click the Apply button to configure the rule on device switch8.
A message window will appear with the device configuration results.
4 Verify that no switch configuration errors have been reported, and click OK to
dismiss the window.
5 Click Close to dismiss the New Configuration dialog.
Modifying a Rule
Once a set of RMON rules have been created, they must be modified individually. To
modify a RMON rule do the following:
1 Select the rule folder or the individual rule name in the Configurations tree to
display the rule details in the main panel of the window.
2 Select the individual rule you want to modify
3 Click the Modify button at the top of the page.
The Modify Configuration window is displayed for the target you selected.
EPICenter Software Installation and User Guide
169
The EPICenter Alarm System
Figure 52: Modify Configuration window for RMON rules
The window shows the same information as the Configuration page of the New
Configuration window, but with the information for the current target filled in.
See “Configuring an RMON Rule” on page 159 for a definition of the fields on this
page. This window is displayed for all existing RMON rules, including the three
predefined rules (Temperature, Port Utilization, and Topology Change). For CPU
Utilization rules, only three fields are shown, and only the Rising Threshold field can be
changed.
Note that if you change the name of this rule, the new rule will be added as a “folder”
in the Configurations tree, and this specific rule target will be moved under the new
rule.
Deleting a Rule
To delete an RMON or CPU Utilization rule, do the following:
1 Select the rule folder or the individual rule name in the Configurations tree to
display the rule details in the main panel of the window.
2 Select the individual rule or rules you want to delete
3 Click the Delete button at the top of the window.
4 When the warning asking you to confirm that you want to delete is displayed, click
Yes to delete the rule(s) or No to cancel the action.
170
EPICenter Software Installation and User Guide
Threshold Configuration
When you delete a rule, the alarm definition that references the rule is not deleted.
Resynchronizing the RMON Rules
To resynchronize EPICenter’s database with the RMON rules in place on a switch, do
the following:
1 Click the Sync button at the top of the window.
The Synchronize RMON Rules window is displayed, as shown in Figure 53.
Figure 53: The Synchronize RMON Rules window
You can resynchronize individual devices or all devices in a device group.
2 To select a device group, select Device Group from the pull-down list in the Source
Type field. A list of device groups will be displayed.
To select individual devices, select Devices in the Source Type field. A list is
displayed showing all the Extreme Networks devices managed by EPICenter.
3 To add a device or device group to the Selection list, select the device or device
group and click Add ->. To add all devices or device groups in the list, click
Add All ->.
4 To remove a device or device group from Selection list, select the item and click
<- Remove. To remove all devices or device groups, click <- Remove All.
5 Click Synchronize to initiate the synchronization process.
EPICenter Software Installation and User Guide
171
The EPICenter Alarm System
The Alarm Manager uses SNMP to retrieve configuration and status information
from each selected switch, and updates the database with that information.
6 The Synchronize function displays a dialog box with status or error information.
Click OK to continue.
7 Click Close to exit the Synchronize RMON Rules window.
Configuring Other SNMP Trap Events
There are a number of SNMP events that require configuration on the switch before
they can be used in EPICenter alarm definitions. If the configuration is not done on the
switch, no trap events are generated, and no EPICenter alarms for those events can
occur. The Ping and OSPF traps fall into this category.
To configure the switch to send one of these traps, you must use a tool that allows you
to set the value of the appropriate SNMP variable. Tools such as SNMPc can be used to
perform this function. The following information assumes that you have a thorough
understanding of SNMP and an appropriate SNMP utility.
Refer to the appropriate MIBs for details of the variable settings:
• Ping MIB: pingmib.mib (RFC 2925)
• OSPF v2 MIB: RFC 1850 or RFC 1850t
Configuring EPICenter as a Syslog Receiver
To receive Syslog messages, the Syslog receiver function of EPICenter must be enabled,
and remote logging must be enabled with EPICenter configured as a Syslog receiver on
the devices from which you want to receive Syslog messages.
The Syslog server function within EPICenter can be enabled through the Administration
applet. See “Devices Properties”in Chapter 16 for more information.
On the device side, remote logging must be enabled, and the switch must be configured
to log to the EPICenter server. The default on Extreme Networks switches is for logging
to be disabled. You must use the EPICenter Telnet applet or the ExtremeWare CLI to
configure your switches. To enable remote logging on a switch, enter the ExtremeWare
command:
enable syslog
172
EPICenter Software Installation and User Guide
Setting EPICenter as a Trap Receiver
To configure the EPICenter server as a Syslog server, enter the ExtremeWare command:
config syslog <EPICenter IP address> <facility>
You must enter the IP address of the EPICenter server, and a facility level, which can be
local0 through local7. See the ExtremeWare Software User Guide or the ExtremeWare
Software Command Reference Guide for more information on these commands.
To configure remote logging on multiple devices, you can run these commands as a
macro in the EPICenter Telnet module.
You can also include a severity in the config syslog command, which will filter log
messages before they are sent to the EPICenter Syslog server. The EPICenter Syslog
server will in turn filter the incoming messages based on the severity you set using the
Accept SysLog messages with Min Severity property setting in the Administration
applet.
Setting EPICenter as a Trap Receiver
When Extreme devices are added to the EPICenter inventory, they are automatically
configured to send traps to the EPICenter server. However, third-party devices are not
automatically configured to do so.
If you want alarms to function for third-party devices, you must manually configure the
devices to send traps to the EPICenter server.
The information required to set up EPICenter as a trap receiver is the following:
• The IP address of the system where the EPICenter server is running.
• The EPICenter server trap port. By default this is 10550. (This is set in the properties
file extreme.properties, found in the <epicenter_installdir>/extreme
subdirectory).
• The EPICenter server community string. This is a string in the form:
ST.<value of IP address>.<value of trap port>
The value of the IP address is the decimal equivalent of the hex value of the IP
address.
For example, if the IP address of the EPICenter server is 10.0.4.1, you would
calculate the decimal equivalent by doing the following:
EPICenter Software Installation and User Guide
173
The EPICenter Alarm System
a Convert each quad of the IP address to its hex equivalent:
Decimal
10
0
4
1
Hex
a
00
04
01
b Convert the hex value a000401 into a decimal value, in this case 167773185
c
Put the three components together to form the community string:
ST.167773185.10550
You can find and verify the value of the community string by using Telnet to log
into an Extreme Networks device that is being managed by EPICenter, and using the
ExtremeWare CLI command show management to display the list of trap receivers
configured for that device. The EPICenter server, and its community string, should
be included in this list.
To receive RMON traps, you need to ensure that RMON is enabled on the device. For
Extreme devices, you can do this through the ExtremeWare CLI with the command
enable rmon.
Writing Tcl Scripts for Alarm Actions
An EPICenter alarm can call a Tcl function as an alarm action. This Tcl function can be a
user-defined Tcl script that is executed in the EPICenter server.
There is an example script in the <epicenter_install_dir>/user/alarms directory
called example.tcl that you can use as a guide to writing a Tcl function for an alarm
action.
You can access the EPICenter alarm variables for use in your script, as demonstrated in
the example script. These variables are defined in Table 4 on page 143.
The Tcl Scripting Environment
The scripting environment for alarm actions is a fully operational Tcl environment. In
this environment, a Tcl action script can save states across multiple alarms using global
variables, access alarm instance data, access event log data, and access other EPICenter
174
EPICenter Software Installation and User Guide
Writing Tcl Scripts for Alarm Actions
server-side data. In order to protect the EPICenter server from malicious or erroneous
alarm action scripts, the alarm script execution environment uses the “safe interpreter”
ability of the Tcl system.
The safe interpreter is a slave of the main EPICenter server-side Tcl interpreter (master
interpreter). The functions of the safe interpreter are restricted so that it cannot do harm
to the overall EPICenter server. A safe interpreter creates a private “sandbox” in which
the alarm action scripts executes. The master interpreter hides certain functions from
the scripts inside the sandbox. The master interpreter performs some other functions on
behalf of the slave interpreter. By performing functions for the slave, the master has a
chance to check to see if the slave’s request is valid. If not, the master rejects the slave’s
request.
The following table summarizes the Tcl commands that are deemed dangerous for use
by a Tcl alarm action script. Some of these commands are removed entirely from the
Alarm Tcl environment. Others are aliases so that the master interpreter can intercept
the command call to provide restricted operations.
Table 5: Command Restrictions in EPICenter Tcl Safe Interpreter
Tcl
Command
Hidden
in Safe
Interp
Explicit
Hide by
EPICenter
Alias in
Master
Description
cd
✔
file
✔
pwd
✔
Not allowed
exec
✔
Not allowed
glob
✔
✔
Full functions
socket
✔
✔
No server-side socket, client socket is
opened in async mode; the opened client
socket is placed in nonblocking mode using
the default buffer size; the number of open
socket is restricted
exit
✔
Not allowed
load
✔
Not allowed
EPICenter Software Installation and User Guide
Not allowed
✔
Only allow: attime, attributes (read-only),
dirname, executable, exists, extension,
isdirectory, isfile, join, lstat, mtime,
nativename, owned, pathtype, readable,
readlink, rootname, size, split, stat, tail, type,
volume, writable
175
The EPICenter Alarm System
Table 5: Command Restrictions in EPICenter Tcl Safe Interpreter
source
✔
✔
Only from standard $tcl_library and
user/alarm directory, and subdirectories
fconfigure
✔
✔
All channels are non-blocking by default,
cannot set channel to blocking; cannot set
channel buffer size
open
✔
✔
Can only open file in user/alarm and its
subdirectories; file is opened in nonblocking
mode using the default buffer size; number
of open file is restricted
vwait
✔
encoding
✔
not Allowed
✔
after
puts
✔
Cannot change system encoding scheme
✔
Cannot do “after ms”, which does not
respond to events
✔
puts data to stdout
The following table outlines the EPICenter server side commands that available in the
slave interpreter through aliases.
EPICenter
Command
Alias in
Master
extr::query
✔
Description
Retrieve server-side data from the database. Syntax:
extr::query {} ?-raw? sql ?arg arg ...?
{}
The first argument must be {}. Using {} signals the
command to retrieves data from the EEM server, in
which the alarm action scripts are executing.
-raw
(Optional) If specified, the result of the query is
returned unparsed as a string containing the data in
the XML format.
sql
The sql query
arg ... Arguments to the sql query for variable substitution
176
EPICenter Software Installation and User Guide
Writing Tcl Scripts for Alarm Actions
extr::sendMail
✔
Sends e-mail through the EPICenter server. Syntax:
extr::sendMail toList from subject body
?smtpHost? ?login? ?password?
toList
A list of recipient’s email addresses
from
The email address of the sender
subject
body
The subject of the email
The text of the email
smtpHost (Optional) The host ip address of the SMTP host. If
not specified, use the default as defined in the alarm
system.
login
(Optional) The login name to the SMTP host
password (Optional) The password to the SMTP host
extr::postEvent
✔
Log an event to the server’s event log. The event time is
logged. Syntax:
extr::postEvent message
message - the message of the event
EPICenter Software Installation and User Guide
177
The EPICenter Alarm System
178
EPICenter Software Installation and User Guide
6
Configuration Manager
This chapter describes how to use the EPICenter Configuration Manager applet for:
• Uploading configuration settings from one or more devices to EPICenter, on demand
or at a predefined (scheduled) time.
• Downloading configuration settings from EPICenter to a device.
• Downloading an incremental configuration to one or more devices.
• Downloading a new ExtremeWare image to one or more devices.
• Downloading a BootROM image to one or more devices.
• Downloading a new ExtremeWare image to one or more Extreme modules.
• Downloading a BootROM image to one or more Extreme modules.
• Specifying an ExtremeWare software image as the “recommended” image. The
Configuration Manager will compare the image currently running in a switch to
determine if the switch is running the recommended or most current image.
• Performing a live software update by retrieving the latest ExtremeWare software
images from Extreme Networks.
• Specifying and configuring the TFTP server to be used for uploading and
downloading configuration settings and software images.
• Searching for a specific device or group of devices.
• Displaying device and device group parameters
EPICenter Software Installation and User Guide
179
Configuration Manager
Overview of the Configuration Manager
The EPICenter Configuration Manager applet provides a graphical interface for
uploading and downloading files to and from managed devices. The Configuration
Manager also provides a framework for storing the configuration files, to allow tracking
of multiple versions. Configuration file uploads can be performed on demand, or can be
scheduled to occur at regular times—once a day or once a week. The Configuration
Manager supports Extreme Networks and Cisco devices.
To start the Configuration Manager applet, click the Config button in the EPICenter
Navigation Toolbar. The Configuration Manager applet appears (see Figure 54).
When the applet initially appears, it shows the status of the device group(s) defined in
EPICenter. Click a device group name in the Component Tree to display the summary
status for the devices in the group, as shown in Figure 54.
Figure 54: Configuration Manager showing summary device status
180
EPICenter Software Installation and User Guide
Overview of the Configuration Manager
This display shows a summary of the upload and download activity for each managed
device, as follows:
• Status—The status of the most recent configuration activity. A green check
indicates that the activity was successful. A red X
means that the activity (upload
or download) did not complete successfully.
• Name—The device name.
• S/w Version—The version of the ExtremeWare software that is currently running in
the device.
• BootROM—The version of the bootROM currently running in the device.
• Next Scheduled Upload—The date and time for the next Archival upload, if one is
scheduled.
• Last Activity—The last activity (upload or download of a configuration file, software
image, or BootROM) that has taken place through the EPICenter Configuration
Manager for this device.
• Last Activity Schedule—The date and time that the activity occurred.
• Last Activity FilePath—The name and path of the configuration file or image file
that was involved in the last activity.
You can display the upload and download status of the configuration information,
software, and BootROM by clicking on an individual device in the Component Tree in
the left-hand panel of the window. This displays a status window for the device similar
to the one shown in Figure 55.
EPICenter Software Installation and User Guide
181
Configuration Manager
Figure 55: Configuration and Software status for an individual device
The device status window displays the following information:
• The success status, timestamp, and file name and location for configuration uploads
and downloads. If archiving is scheduled, it also displays the time of the next
scheduled archive.
• The success status, timestamp, and versions for software downloads, as well as
version information for both the primary and secondary software stores.
• BootROM version information (at the bottom of the scrollable window, not visible in
Figure 55).
Viewing Device Information from Pop-up Menus
You can select a device group or a device in the Component Tree, then right-click to
display a pop-up menu that contains the Upload, Archive, Download, Increment,
Upgrade, and Properties commands. All of the commands—with the exception of the
182
EPICenter Software Installation and User Guide
Overview of the Configuration Manager
Properties command—perform the same functions as the buttons at the top of the page,
but with the appropriate device or device group displayed. The Properties command
displays the attributes for a specific device group or device. The device pop-up menu
also contains the Alarms, Browse, Statistics, Telnet, Eview, and VLANs commands. All
of these commands perform the same functions as the applets in the Navigation Toolbar
to the left of the page, but with the appropriate device displayed.
Upload
The Upload function lets you upload configuration information from one or more
devices to EPICenter.
To view the Upload Config display for a selected device group or device:
• Right-click on the device group or device, then select Upload from the pop-up menu
that appears
This opens the Upload Config from Devices window.
See “Uploading Configurations from Devices” on page 187 for details on using this
feature.
Archive
The Archive function lets you schedule device configuration archive uploads.
To view the Archive display for a selected device group or device:
• Right-click on the device group or device, then select Archive from the pop-up
menu that appears
This opens the Schedule Upload window. Select the appropriate tab to display the
Device Schedule window or the Global Schedule window.
See “Archiving Configuration Settings” on page 190 for details on using this feature.
Download
The Download function lets you manually update device configuration and status
information.
To view the Download display for a selected device group or device:
EPICenter Software Installation and User Guide
183
Configuration Manager
• Right-click on the device group or device, then select Download from the pop-up
menu that appears
This opens the Download Configuration to Devices window and displays the devices in
a device group. If configuration information has been uploaded from the device, the file
where it was saved is listed in the Last Upload Configuration column.
See “Downloading Configuration Information to a Device” on page 194 for details on
using this feature.
Increment
The Increment function lets you execute only the commands specified in the
incremental download file. The incremental download file is used as a baseline
configuration for devices running ExtremeWare 6.0 or later.
To view the Incremental display for a selected device group or device:
• Right-click on the device group or device, then select Increment from the pop-up
menu that appears
This opens the Download Incremental Configuration to Devices window.
See “Downloading an Incremental Configuration to Devices” on page 196 for details on
using this feature.
Upgrade
The Upgrade function lets you upgrade the ExtremeWare software or BootROM image
on Extreme devices or to Extreme modules that include software.
To view the Upgrade display for a selected device group or device:
• Right-click on the device group or device, then select Upgrade from the pop-up
menu that appears
This opens the Download Image window. Select the appropriate tab to display the
Device window or the Device Slot window.
See “Upgrading Software Images” on page 199 for details on using this feature.
184
EPICenter Software Installation and User Guide
Overview of the Configuration Manager
Properties
The Properties function lets you view the attributes for a device group or a device.
To view the Properties display for all device groups:
• Right-click on the Device Groups component, then select Properties from the pop-up
menu that appears
The Device Groups Properties window appears and displays the number of device
groups and the names of the device groups that are known to EPICenter.
To view the Properties display for a selected device group:
• Right-click on the device group, then select Properties from the pop-up menu that
appears
The Device Group Properties window appears and displays the attributes for the
selected device group.
To view the Properties display for a selected device:
• Right-click on the device, then select Properties from the pop-up menu that appears
The Device Properties window appears and displays the attributes for the selected
device.
See “Displaying Properties” on page 213 for details on using this feature.
Alarms
The Alarms function runs the EPICenter Alarm System and displays the Alarm Browser
function to show the alarms for the selected device.
To view the Alarms display for a selected device:
• Right-click on the device, then select Alarms from the pop-up menu that appears
This starts the Alarm System applet in a new window. The Alarm System displays the
Alarm Log Browser and displays the alarms for the selected device.
See Chapter 5 for details on using this feature.
EPICenter Software Installation and User Guide
185
Configuration Manager
Browse
The Browse function runs the ExtremeWare Vista switch management interface for the
selected device.
To run ExtremeWare Vista for a selected device:
• Right-click on the device, then select Browse from the pop-up menu that appears
This starts the ExtremeWare Vista login page in a new web browser window.
Refer to the ExtremeWare Software User Guide for details on using ExtremeWare Vista.
Statistics
The Statistics function runs the EPICenter Real-Time Statistics applet and displays port
statistics for the selected device.
To view the Device Statistics display for a selected device:
• Right-click on the device, then select Device from the pop-up menu that appears
This starts the Real-Time Statistics applet in a new window and displays port statistics
for the selected device.
See Chapter 11 for details on using this feature.
Telnet
The Telnet function opens an EPICenter telnet window that is connected to the selected
device.
To open a telnet session for a selected device:
• Right-click on the device, then select Telnet from the pop-up menu that appears
This starts a telnet session for the device in a new window.
See Chapter 7 for details on using this feature.
EView
The EView function runs the EPICenter ExtremeView applet and displays the device
front-panel image and device information for the selected device.
186
EPICenter Software Installation and User Guide
Uploading Configurations from Devices
To view the EView for a selected device:
• Right-click on the device, then select EView from the pop-up menu that appears
This starts the ExtremeView applet in a new window and displays the front-panel
image and information for the selected device.
See Chapter 10 for details on using this feature.
VLANs
The VLANs function runs the EPICenter VLANs applet and displays the VLANs
currently known to the EPICenter database.
To view the VLANs for a selected device:
• Right-click on the device, then select VLANs from the pop-up menu that appears
This starts the VLAN applet in a new window and displays the VLANs currently know
to the EPICenter database.
See Chapter 13 for details on using this feature.
Uploading Configurations from Devices
To upload the configuration information from one or more devices, click the Upload
button at the top of the window.
The Upload Config from Devices window appears, as shown in Figure 56.
EPICenter Software Installation and User Guide
187
Configuration Manager
Figure 56: The Upload Config window
To upload device configurations to EPICenter, do the following:
1 Select a device group or All Devices from the drop-down menu in the Device
Group field.
2 From the Available Devices list, select the devices from which you want to upload
configuration information, then click the Add-> button.
If you want to upload from all the devices in the device group, click the Add All->
button.
The devices you select will be moved to the Devices for Upload list.
To remove devices from the Devices for Upload list, select the devices and click the
<-Remove button. This moves the selected devices back to the Available Devices
list. Click <-Remove All to move all the devices in the Devices for Upload list back
to the Available Devices list.
3 Specify where the uploaded information should be stored:
188
EPICenter Software Installation and User Guide
Uploading Configurations from Devices
a Select Archive to create files for each upload under the EPICenter Configs
directory, in a subdirectory hierarchy organized by year, month, and day. The
form of the fully-qualified file names for these files is:
<tftp_root>\configs\<year>\<month>\<day>\<device_address>_<time>.txt
where <tftp_root> is the location of your TFTP server. By default, <tftp_root>
is <EPICenter_install_dir>\user\tftp.
<EPICenter_install_dir> is the EPICenter installation directory, by default
epc4_0.
For example, a file uploaded from device Summit24 (10.205.0.25) on September 1,
2000 at 8:06 am, would be saved as follows:
EPC4_0\user\tftp\configs\2000\Sept\01\10.205.0.25_0806.txt
NOTE
If you have reconfigured your TFTP root directory (see “Configuring the TFTP
Server” on page 211), the configs subdirectory will be found directly below (as a
child of) your TFTP root directory.
b Select Specify to specify your own directory structure and file naming
convention relative to the TFTP root’s configs subdirectory. The structure will be
of the form:
<tftp_root>\configs\<file_location>\
<device_address>_<filename_trailer>.txt
In the File Location field, specify the <file_location> path where the files
should be stored, starting from the configs subdirectory. DO NOT include
<tftp_root>\configs as part of the path; just include the remaining path.
In the FileName Trailer field, you can specify a string to be appended to the
device address to create a file name. For example, if you specify a file name
trailer of “week_8_backup” then the filename for the device Summit24 would be
10.205.0.25_week_8_backup.txt.
4 Click Apply to start the upload process.
The Reset button restores all the fields to their initial state.
EPICenter Software Installation and User Guide
189
Configuration Manager
Archiving Configuration Settings
You can schedule the uploading (archiving) of configuration information so that it is
done automatically, either once a day or once a week. By default, all new devices added
to the EPICenter database use the global schedule and do not have a set schedule for
uploading configuration information.
In the Admin applet, you can specify whether the device configurations are uploaded
only when the device configuration has changed, or if switch configurations are always
uploaded at the scheduled archive time. See Chapter 16 for more information about
how to set the uploading configuration settings.
Device Schedules
A device, a set of devices, or one or more device groups can be scheduled for archive
individually and independently of other device upload schedules. To schedule device
configuration archive uploads, click the Archive button at the top of the window.
The Schedule Upload window appears, as shown in Figure 57.
190
EPICenter Software Installation and User Guide
Archiving Configuration Settings
Figure 57: Schedule Upload window
To schedule the upload of device configurations, do the following:
1 Select the appropriate tab to display the Device Schedule window.
2 Select a device group or All Devices from the drop-down menu in the Device
Group field.
3 From the Available Devices list, select the devices for which you want to schedule
the upload of configuration information, then click the Add-> button.
If you want to create the same schedule for all the devices in the device group, click
the Add All-> button.
The devices you select will be moved to the Devices for Scheduling list.
To remove devices from the Devices to Scheduling list, select the devices and click
the <-Remove button. This moves the selected devices back to the Available Devices
list. Click <-Remove All to move all the devices in the Devices for Scheduling list
back to the Available Devices list.
EPICenter Software Installation and User Guide
191
Configuration Manager
4 Specify the schedule you want:
No Schedule will remove any schedule associated with the selected device(s).
Repeat Every Day indicates that the upload should be done every day at the
specified time. When you select this option, you will be able to specify the time of
day (the hour and minutes) at which the upload should be done.
Repeat Every Week indicates that the upload should be done every week at the
specified day and time. When you select this option, you will be able to specify the
time of day (the hour and minutes), and the day of the week at which the upload
should be done.
5 Click Apply to have the upload schedule set for these devices.
Click the Reset button to return the schedule to its state when you initiated this
window.
Global Schedules
When you use the Inventory Manager to add devices to the EPICenter database, the
devices use the global schedule for configuration uploads. If you have a device or series
of devices that require a configuration upload schedule that differs from the global
schedule, see “Device Schedules” on page 190 for information on how to create an
individual configuration schedule. You can modify global configuration uploads for all
devices that use the global schedule by clicking the Archive button at the top of the
window.
The Schedule Upload window appears, as shown in Figure 57.
To schedule the global upload of device configurations, do the following:
192
EPICenter Software Installation and User Guide
Archiving Configuration Settings
1 Select the appropriate tab to display the Global Schedule window, as shown in
Figure 58.
Figure 58: Global Schedule Upload window
2 Specify the global schedule you want:
No Schedule will remove any schedule associated with the device(s) that use the
global schedule.
Repeat Every Day indicates that the upload should be done every day at the
specified time for devices that use the global schedule. When you select this option,
you will be able to specify the time of day (the hour and minutes) at which the
upload should be done on.
Repeat Every Week indicates that the upload should be done every week at the
specified day and time for devices that use the global schedule. When you select this
option, you will be able to specify the time of day (the hour and minutes), and the
day of the week at which the upload should be done.
EPICenter Software Installation and User Guide
193
Configuration Manager
3 Click Apply to set the global upload schedule for the devices that do not have a set
configuration schedule.
Click the Reset button to return the schedule to its state when you initiated this
window.
Downloading Configuration Information to a
Device
Downloading a configuration does a complete configuration download, resetting the
current switch configuration and replacing it entirely with the new downloaded
configuration. The switch will be rebooted automatically after the download has
completed. Configuration downloads are supported on Extreme Networks devices and
Cisco devices running IOS 12.0 and above.
To download saved configuration information to a device, click the Download button at
the top of the window.
The Download Config to a device window appears, as shown in Figure 59.
194
EPICenter Software Installation and User Guide
Downloading Configuration Information to a Device
Figure 59: Download configuration window
To download a configuration to a device, do the following:
1 Select a device group or All Devices from the drop-down menu in the Device
Group field.
2 Select the device from the device list presented. You can only download to one
device at a time.
If configuration information has been uploaded from the device, the file where it
was saved is listed in the Last Uploaded Config column.
3 In the File Location field, type the location and name of the file you want to
download, or click the Show Uploaded Configs button and select the file to be
downloaded.
The Browse pop-up displays the list of uploaded files for the selected device.
Click Reset to clear all of the selections and to restore the download configuration
window to its initial state.
4 To start the download, click the Download button.
EPICenter Software Installation and User Guide
195
Configuration Manager
NOTE
When the download completes, the switch will be rebooted. The EPICenter software
does not save the configuration on the device after the reboot. You can use the
Telnet applet to open a telnet session on the affected devices and execute a save
configuration command.
Downloading an Incremental Configuration to
Devices
You can create or designate a set of configuration information to be used as a baseline
configuration for devices running ExtremeWare 6.0 or later. Using an incremental
download to execute a baseline configuration provides a known, “standard”
configuration that you can use to ensure that devices are configured into a known state.
For example, if you want to set a group of devices to the same basic configuration, you
can first set individual IP addresses on each device, and then use the incremental
configuration download feature to set all other configuration settings on all devices to a
common state.
An incremental configuration download executes only the commands specified in the
incremental download file. It does not reset the switch configuration or replace any
other configuration settings that may exist in the device. No reboot is necessary. The
EPICenter incremental download does not save the configuration; you must do so.
Incremental downloads are supported on Extreme Networks devices running
ExtremeWare 6.0 or later and on Cisco devices running IOS 12.0 or later.
To download an incremental configuration to a device, click the Increment button at the
top of the window.
The Download Incremental Config To Devices window appears, as shown in
Figure 60.
196
EPICenter Software Installation and User Guide
Downloading an Incremental Configuration to Devices
Figure 60: Download incremental configuration window
From this window, do the following:
1 Select a device group or All Devices from the drop-down menu in the Device
Group field.
2 From the Supported Devices list, select the devices for which you want to download
the baseline configuration, then click the Add-> button.
If you want to download the baseline configuration to all the devices in the device
group, click the Add All-> button.
The devices you select will be moved to the Download Incremental Config to: list.
To remove devices from the Download Incremental Config to: list, select the devices
and click the <-Remove button. This moves the selected devices back to the
Supported Devices list. Click <-Remove All to move all the devices in the
Download Incremental Config to: list back to the Supported Devices list.
3 Select the baseline configuration you want to download from the pull-down list in
the Available Incremental Configs field.
4 Click Apply to start the baseline download to the selected device.
EPICenter Software Installation and User Guide
197
Configuration Manager
NOTE
The EPICenter software does not save the configuration on the device after the
download. You can use the Telnet applet to open a telnet session on the affected
devices and execute a save configuration command.
NOTE
The Configuration Manager will display an error if you attempt an incremental
download on a switch running a version of ExtremeWare prior to 6.0.
Creating an Incremental Configuration File
The purpose of an incremental configuration is to provide a set of known, standard
configuration settings you can download to a device to restore it or initialize it to a
known software state.
To create an incremental configuration, you can start with a configuration file you have
uploaded, or one of the standard configuration. You can edit it, if needed, to reflect the
basic configuration settings you want to use as your baseline configuration, and to
remove settings you don’t want changed.
Incremental configuration files must be stored in the <tftp_root>\baselines directory,
where <tftp_root> is the location of your TFTP server. By default, <tftp_root> is
<EPICenter_install_dir>\user\tftp.
<EPICenter_install_dir> is the EPICenter installation directory, by default epc4_0.
Thus, if you installed the EPICenter server under Windows NT using the default
installation path, your incremental configurations must be in
epc4_0\user\tftp\baselines, unless you have reconfigured your TFTP root directory.
You can name an incremental configuration file any way you want.
NOTE
If you have reconfigured your TFTP root directory (see “Configuring the TFTP Server”
on page 211), the baselines subdirectory will be found directly below (as a child of) your
TFTP server root directory.
198
EPICenter Software Installation and User Guide
Upgrading Software Images
Upgrading Software Images
The ExtremeWare software image contains the executable code that runs on the switch
and on certain Extreme modules that include software. An image comes pre-installed
from the factory on every switch and on certain modules. You can upgrade this image
by downloading a new version through the Configuration Manager. You can download
the image into either the primary or secondary image, and specify whether the switch
should be rebooted to use the new image.
The BootROM software initializes certain important switch variables during the switch
boot process.
CAUTION
If a BootROM upgrade does not complete successfully, it could prevent the switch from
booting.
When you perform a software image upgrade, EPICenter automatically creates a
backup of your existing switch configuration. Switch configuration files are saved as
text files in the <tftp_root>\configs directory, where <tftp_root> is the location of
your TFTP server. By default, <tftp_root> is <EPICenter_install_dir>\user\tftp.
The name of the configuration file contains the switch IP address and a timestamp, and
the file is saved in folders according to the day, month, and year of the upgrade.
Upgrading Images on Devices
To download a new ExtremeWare software or BootROM image to an Extreme device,
click the Upgrade button at the top of the window and select the Device tab.
The Download Image on Device window appears, as shown in Figure 61.
EPICenter Software Installation and User Guide
199
Configuration Manager
Figure 61: Download Image on Device window
To download a new software image to one or more Extreme Devices, do the following:
1 Select a device group or All Devices from the drop-down menu in the Device
Group field.
The devices that belong to this group are displayed in the Device list.
Click the Devices with Outdated Images checkbox to show only devices with
images that differ from the image you specified in the Versions window.
The entries in the Image, New Image Available, and Image Status columns let you
determine which switches have outdated software images.
— The Image shows the image currently running in the device.
— The BootROM column shows the version of the BootROM running on the device.
— The New Image Available information comes from the information you provide
in the Versions window for devices of this type (see “Specifying the Current
200
EPICenter Software Installation and User Guide
Upgrading Software Images
Software Versions”on page 207). If you have not specified a software version in
the Versions window, this will be blank.
— Image Status shows the status of the image compared to the version shown in
the New Image Available column. A green check
indicates that the version
running in the device and the New Image Available version are the same. A red
X
indicates that the image running in the device differs from the New Image
Available version. The status is also shown as a red X if the New Image Available
column is blank.
2 From the Device list, select the devices you want to upgrade, then click the Add->
button.
If you want to upgrade the images on all the displayed devices, click the Add All->
button.
The devices you select will be moved to the Upgrade Image on Devices list.
To remove devices from the Upgrade Image on Devices list, select the devices and
click the <-Remove button. This moves the selected devices back to the Device list.
Click <-Remove All to move all the devices in the Upgrade Image on Devices list
back to the Device list.
3 In the Download Options box select the type of upgrade you want to perform:
• Click the Image Download button to specify a software image upgrade.
• Click the BootROM Download button to specify a BootROM upgrade.
4 For a software image upgrade do the following:
a To select the software image you want to download, click the Image Download
button in the Download Options box. This displays the Selected Software Image
field.
Click the Select Image... button to display the Select Software Image window.
Select the software image you want to download from the Select Software Image
window and click OK.
For more information about selecting software images, see “Selecting Software
Images” on page 206.
NOTE
There are different images for Summit devices and the “i” Series devices. If you try
to download an incompatible image, you will receive an error message.
Standard images as shipped by Extreme Networks are provided in the directory
<EPICenter_install_dir>\user\tftp\images directory (by default
EPICenter Software Installation and User Guide
201
Configuration Manager
epc4_0\user\tftp\images) in the Windows operating environment, or
/opt/epc4_0/user/tftp/images on a Solaris system.
You can check the Extreme Networks web site for the availability of newer
software releases.
b Select the download target in the Download To field: Current, Primary, or
Secondary.
5 For a BootROM upgrade, click the BootROM Download button in the Download
Options box. This displays the Selected BootROM Image field.
Click the Select Image... button to display the Select Software Image window. Select
the software image you want to download from the Select Software Image window
and click OK.
For more information about selecting BootROM images, see “Selecting Software
Images” on page 206.
Standard BootROM images are provided in the directory
<EPICenter_install_dir>\user\tftp\bootrom directory (by default
epc4_0\user\tftp\bootrom) in the Windows operating environment, or
/opt/epc4_0/user/tftp/bootrom on a Solaris system.
6 Indicate whether the devices should be rebooted:
— Click Do not reboot after download to indicate the devices should not be
rebooted.
— Click Reboot immediately after download to indicate the devices should be
rebooted immediately after the download.
— Click Reboot after to indicate the devices should be rebooted at a later time, and
enter the number of hours (up to 72) to wait before doing the reboot.
7 Click Apply to start the software download to the selected devices.
Click Reset to return the window to its initial state (removing all devices from the
Upgrade Image on Devices list, removing all image selections, and so on).
8 When the upgrade process has completed, click Close to close the Download Image
on Device window.
Upgrading Slot Images on Modular Devices
To download a new ExtremeWare software or BootROM image to an Extreme module,
click the Upgrade button at the top of the window and select the Device Slot tab.
The Download Image on Device Slot window appears, as shown in Figure 62.
202
EPICenter Software Installation and User Guide
Upgrading Software Images
Figure 62: Download Image on Device Slot window
To download a new software image to one or more slots in Extreme modular devices,
do the following:
1 Select a device group or All Devices from the drop-down menu in the Device
Group field.
Regardless of the number of devices that are members of a device group, only
Extreme modular devices are displayed in the Device list.
The Slot list displays information about the slots in the selected modular device.
— Slot shows the number of the slot in the device.
— Type shows the type of module that is installed in the slot. If a module is not
installed in the slot, the Type field shows the word Empty.
— Image shows the ExtremeWare software version that is currently installed in the
module, if applicable.
— BR shows the BootROM image that is currently installed in the module, if
applicable.
EPICenter Software Installation and User Guide
203
Configuration Manager
NOTE
If the Image and BR columns are empty, the module does not contain a special
ExtremeWare software version or BootROM image and does not support a software
download.
2 To upgrade modules, select a device from the Device list. A list of the modules
installed in the device is displayed in the Slot list. From the Slot list, select the
module you want to upgrade then click the Add-> button.
If you want to upgrade the images on all of the displayed modules that support
software, click the Add All-> button.
NOTE
If you try to download an ExtremeWare software image or BootROM image on a
module that does not support those images, you will receive an error message.
The modules you select will be moved to the Upgrade Image on device slot list.
To remove modules from the Upgrade Image on device slot list, select the module
and click the <-Remove button. This moves the selected modules back to the Slot
list. Click <-Remove All to move all of the modules in the Upgrade Image on device
slot list back to the Slot list.
3 In the Download Options box, select the type of upgrade you want to perform:
— Click the Image Download button to specify a software image upgrade.
— Click the BootROM Download button to specify a BootROM upgrade.
4 For a software image upgrade, do the following:
a To select the software image you want to download, click the Image Download
button in the Download Options box. This displays the Selected Software Image
field.
Click the Select Image... button to display the Select Software Image window.
Select the software image you want to download from the Select Software Image
window and click OK.
For more information about selecting software images, see “Selecting Software
Images” on page 206.
204
EPICenter Software Installation and User Guide
Upgrading Software Images
NOTE
Some Alpine modules and BlackDiamond modules require a special ExtremeWare
software image that only runs on that particular module. If you try to download an
incompatible image, you will receive an error message.
Standard images as shipped by Extreme Networks are provided in the directory
<EPICenter_install_dir>\user\tftp\slotImages directory (by default
epc4_0\user\tftp\slotImages) in the Windows operating environment, or
/opt/epc4_0/user/tftp/slotimages on a Solaris system.
You can check the Extreme Networks web site for the availability of newer
software releases.
b Select the download target in the Download To field: Current, Primary, or
Secondary.
5 For a BootROM upgrade, click the BootROM Download button in the Download
Options box. This displays the Selected BootROM Image field.
Click the Select Image... button to display the Select Software Image window. Select
the software image you want to download from the Select Software Image window
and click OK.
For more information about selecting BootROM images, see “Selecting Software
Images” on page 206.
NOTE
Some Alpine modules and BlackDiamond modules require a special BootROM
image that only runs on that particular module. If you try to download an
incompatible image, you will receive an error message.
Standard BootROM images are provided in the directory
<EPICenter_install_dir>\user\tftp\slotBootRom directory (by default
epc4_0\user\tftp\slotBootRom) in the Windows operating environment, or
/opt/epc4_0/user/tftp/slotbootrom on a Solaris system.
6 Indicate whether the slots should be rebooted:
— Click Do not reboot after download to indicate the slots should not be rebooted.
— Click Reboot immediately after download to indicate the slots should be
rebooted immediately after the download.
7 Click Apply to start the software download to the selected modules.
EPICenter Software Installation and User Guide
205
Configuration Manager
Click Reset to return the window to its initial state (removing all modules from the
Upgrade Image on device slot list, removing all image selections, and so on).
8 When the upgrade process has completed, click Close to close the Download Image
on device slot window.
Selecting Software Images
EPICenter makes it easy for you to select and download ExtremeWare software images
or BootROM images to devices or device slots in modular devices.
To select ExtremeWare software images:
1 From the Download Image on window, select the appropriate tab to display the
Device or Device Slot options.
2 Select the devices or device slots you want to update.
3 In the Download Options box, click the Image Download button.
4 Click the Select Image... button to display the Select Software Image window. Select
the software image you want to download from the Select Software Image window
and click OK.
The Select Software Image window displays the following information in a tabular
format:
• The Name column lists the name of the ExtremeWare software build.
• The Version column lists the version of the ExtremeWare software.
• The Description columns lists additional information about the software. For
example, if the software is available for “i” series devices only, you may see a
notation in the Description column.
If you select a software image and click the Close button to exit the Select Software
Image window, the software image is displayed in the Selected Software Image field.
To select BootROM images:
1 From the Download Image on window, select the appropriate tab to display the
Device or Device Slot options.
2 Select the devices or device slots you want to update.
3 In the Download Options box, click the BootROM Download button.
206
EPICenter Software Installation and User Guide
Specifying the Current Software Versions
4 Click the Select Image... button to display the Select Software Image window. Select
the software image you want to download from the Select Software Image window
and click OK.
The Select Software Image window displays the following information in a tabular
format:
• The Name column lists the name of the BootROM image.
• The Version column lists the version of the BootROM image.
• The Description columns lists additional information about the software. For
example, if the software is available for Summit series devices only, you may see
a notation in the Description column.
If you select a BootROM image and click the Close button to exit the Select Software
Image window, the BootROM image is displayed in the Selected BootROM Image
field.
Specifying the Current Software Versions
The Versions window lets you specify the current version of the ExtremeWare software
for pre-”i” Series devices (Summits/Black Diamonds) and “i” Series devices.
This information is used by the EPICenter software to determine whether an individual
device is running the version you have specified as the “current version.” This is the
version that appears in the New Image Available column in the Download Image on
Device window.
Click the Versions button at the top of the window to display the Configure New
Image window, as shown in Figure 63.
Figure 63: Configure New Image window
EPICenter Software Installation and User Guide
207
Configuration Manager
Enter the version information into the appropriate field. The version information is the
version, release, and build number (in parentheses) associated with a specific
ExtremeWare software release. For example, for a Summit device this could be a version
such as 4.1.20 (3). For the “i” chipset devices, it should be 6.1.7 (9) or later. For more
information about current ExtremeWare versions, go to the Extreme Networks technical
support page at http://www.extremenetworks.com/support/techsupport.asp.
NOTE
You must specify the version exactly in its correct form, including periods, spaces, and
parentheses. For example, version 6.1.7 b9 must be specified as “6.1.7 (9)”, with a
space between the 7 and the “(“. The version names are always in the form #.#.#_(#)
where # is a numeric, and _ indicates a space.
Performing a Live Software Update
The Live Update Software Images window displays a list of available software and
allows you to connect directly to Extreme Networks to download the most current
ExtremeWare software images and BootROM images to your local EPICenter server.
After you download the new images, you can use the images to upgrade your managed
devices and modules. Before you can download the software images, you must have a
current support contract as well as a user name and password to obtain access to the
Extreme Networks server.
Downloading the software or BootROM images from Extreme Networks does not
automatically upgrade the devices with the new images. Depending on the software
image you downloaded, the image is placed in one of the following directories:
• Device images—<EPICenter_install_dir>\user\tftp\images (by default
epc4_0\user\tftp\images in the Windows operating environment) or
/opt/epc4_0/user/tftp/images on a Solaris system
• Device BootROM images—<EPICenter_install_dir>\user\tftp\bootrom (by
default epc4_0\user\tftp\bootrom in the Windows operating environment) or
/opt/epc4_0/user/tftp/bootrom on a Solaris system
• Slot images—<EPICenter_install_dir>\user\tftp\slotImages (by default
epc4_0\user\tftp\slotImages in the Windows operating environment) or
/opt/epc4_0/user/tftp/slotimages on a Solaris system
208
EPICenter Software Installation and User Guide
Performing a Live Software Update
• Slot BootROM images—<EPICenter_install_dir>\user\tftp\slotBootRom (by
default epc4_0\user\tftp\slotBootRom in the Windows operating environment) or
/opt/epc4_0/user/tftp/slotbootrom on a Solaris system.
Obtaining New Software Images
To obtain a current software image, do the following:
1 Click the Update button at the top of the window to display the Live Update
Software Images window, as shown in Figure 64.
Figure 64: Live Update Software Images window
• The Type column lists whether the image is a version of ExtremeWare software
or a version of BootROM software.
• The Name column lists the name of the software build.
• The Version column lists the version number of the software.
• The Status column lists whether the software is a general availability software
release.
EPICenter Software Installation and User Guide
209
Configuration Manager
• The Present column lets you know if current versions of software are available
on your local system in the following directories (where <tftp_root> is the
location of your TFTP server): <tftp_root>/images, <tftp_root> bootrom,
<tftp_root>SlotImages, or <tftp_root>/slotBootRom, or if the software is
only available remotely, directly from Extreme Networks. If you see yes, the
software is available from EPICenter, and you have the most current release of
software. If you see no, the software is available from Extreme Networks, and
you do not have the most current release of software.
• The Description column provides a description of the software. For example, if
the software is intended for a Summit device, you will see an explanation that
tells you the software is for the Summit product line. Use the description
information to determine the type of device or module the software is intended
for.
2 Select the device or slot image you want to update. You can select more than one
image.
3 Click OK to display the Login to Remote Server window, as shown in Figure 65.
Figure 65: Login to Remote Server window
4 Enter your support user name in the User Name field and password in the
Password field to access the Extreme Networks server.
NOTE
You must have a current support contract as well as a user name and password to
obtain access to the Extreme Networks server
5 Click OK to log into the Extreme Networks server.
A Messages From Server dialog box appears and displays the status of your request.
Click OK to close the dialog box.
6 Click Cancel to close the window.
210
EPICenter Software Installation and User Guide
Configuring the TFTP Server
Configuring the TFTP Server
If you already have a TFTP server installed on the system where the EPICenter server is
running, you may choose to use that TFTP server instead of the one provided with
EPICenter. This is the server that actually does the downloading and uploading from
the devices.
NOTE
In EPICenter 4.0, the Configuration Manager can cause multiple devices to contact the
TFTP server at once to perform upload or download operations. Some third party TFTP
servers can have problems accepting multiple TFTP requests. If you are running a third
party TFTP server and this happens, disable the TFTP server and use the EPICenter
TFTP server.
The Server function lets you enable or disable the embedded TFTP server, and specify
an alternate path for the location of the server.
Click the TFTP button at the top of the window to display the Configure TFTP Server
window, as shown in Figure 66.
Figure 66: Configure TFTP Server window
By default, the embedded TFTP server is enabled.
• Click the Disable EPICenter TFTP Server button to disable the server.
• Click the Enable EPICenter TFTP Server button to enable the server.
NOTE
You cannot disable the server unless you provide a path to an alternate TFTP server.
EPICenter Software Installation and User Guide
211
Configuration Manager
• To change the location of the TFTP server root, change the path in the Set TFTP Root
field.
By default, the TFTP server is installed in <epicenter_install_dir>\user\tftp
where <epicenter_install_dir> is the directory where the EPICenter server is
install. By default, the TFTP server is found in epc4_0\user\tftp in the Windows
operating environment, or /opt/epc4_0/user/tftp on a Solaris system.
EPICenter will create six subdirectories (baselines, bootrom, configs, images,
slotImages, and slotBootRom) as children of the directory you specify as the TFTP
server root.
NOTE
If you plan to use this TFTP server with other software, such as the ExtremeWare CLI
or for any other purpose, be aware of possible differences in the expected locations of
the TFTP server and other components such as ExtremeWare software images or
configuration files. See the EPICenter Release Note and Quick Start Guide for
information on any known issues.
Finding Devices
You can search for a device in the EPICenter database by name, by IP address, or by
type of device. This may be useful if you have a large number of devices in your
inventory.
To search for a device, follow these steps:
1 Click Find at the top of the Configuration Manager page.
2 Enter your search criteria:
You can search for devices by name or by IP address. You can limit the search to a
specific device group, or to a specific type of Extreme device. Search criteria can
include:
— A device name. Click the Device Name button, and enter a complete or partial
name in the Search: field.
— An IP address. Click the IP Address button and enter a complete or partial IP
address in the Search: field. You can use the wild card characters * or ? in your
search criteria.
212
EPICenter Software Installation and User Guide
Displaying Properties
* acts as a wildcard for an entire octet (0-255)
? is a wildcard for a single digit (0-9)
— A device group. Select the device group from the drop-down menu in the device
group field. If you do not specify a name or IP address in the Search field, all
devices in the device group you select will be found.
— A device type. Select the device type from the drop-down menu in the type field.
If you do not specify a name or IP address in the Search field, all devices of the
type you select will be found.
3 Click Find to search for devices that meet the criteria you have specified. All devices
found are listed in the center panel. Information includes the device group in which
the device can be found, its name, IP address, and the type of device.
4 Double-click on a device in the results table to highlight the device in the
Component Tree, or select a device in the results table and click OK, to display the
configuration information for that device. If you click OK, the search window will
close.
5 Click New Search to clear all search criteria.
6 Click Cancel to close the search window.
Displaying Properties
You can view the properties of a device group, device, slot, or port in the EPICenter
database. This section describes how to view properties through the ExtremeView
applet.
Device Group Properties
You can view summary information for all device groups, or view information about
individual device groups.
To view summary information for all device groups, right-click on the Device Groups
component and select Properties from the pop-up menu.
The Device Groups Properties window appears, showing the All Device Groups display.
This displays a list of the current device groups and their descriptions. For more details
about this display, see Chapter 4.
EPICenter Software Installation and User Guide
213
Configuration Manager
You can also view properties for a specific device group. To view properties for a
specific device group, right-click on a device group and select Properties from the
pop-up menu.
The Device Group Properties window appears, showing information about the selected
group. This includes the group description, the number of devices in the group, and a
list of the devices. For more details about this display, see Chapter 4.
Device Properties
To view properties for a device, right-click on a device in the Component Tree and
select Properties from the pop-up menu that appears.
The Device Properties window has three tabs at the top of the window:
• Device
• VLAN
• STP
Each tab displays the name of the device and a status “light” which shows the status of
the device as detected by EPICenter.
The Device Tab
The Device tab displays information about the device such as its IP address, MAC
address, and boot time. The main section of the window presents the same information
you can view in the Inventory Manager for the device. If the device is an Extreme
device, the ExtremeWare software running in the switch provides comprehensive status
information.
The VLAN Tab
The VLAN tab lists the VLANs configured on the device.
The STP Tab
The STP tab lists the Spanning Tree domains (STPDs) configured on the device. There
may be more than one entry per STPD if the domain includes multiple VLANs.
For more details about the Device Properties window, see Chapter 4.
214
EPICenter Software Installation and User Guide
Displaying Properties
EPICenter Software Installation and User Guide
215
Configuration Manager
216
EPICenter Software Installation and User Guide
7
Using the Interactive Telnet
Application
This chapter describes how to use the Interactive Telnet application for:
• Configuring Extreme devices using Telnet and the ExtremeWare Command Line
Interface (CLI)
• Configuring third-party devices using interactive Telnet
Overview of the Interactive Telnet Applet
Users with Administrator or Manager access can view and modify configuration
information for Extreme switches (Summit, Alpine, and Black Diamond switches) and
third-party devices managed by EPICenter using Telnet and the ExtremeWare
Command Line Interface (CLI). You can also use the interactive Telnet capability to
view and modify configuration information for third-party devices being managed by
EPICenter.
The Telnet application provides two usage modes:
• A Macro View, where you can set up CLI command macros, and run them on
multiple switches in a single operation. You set a macro to run repeatedly, and can
save them in the EPICenter database for future use.
• An individual session mode, where you can open a session on an individual device,
and execute commands just as you would from a standard Telnet interface.
EPICenter Software Installation and User Guide
217
Using the Interactive Telnet Application
Using Telnet with Extreme Switches
The Telnet applet allows the scripting and playback of groups of CLI commands
(macros) to a selection of Extreme switches. You can also use this applet to run an
interactive Telnet session on an individual switch, including third-party switches.
Select Telnet from the Navigation Toolbar to display the Telnet module. The Telnet
Macro view for all of the devices known to EPICenter is displayed, as shown in
Figure 67.
Figure 67: The Telnet applet, macro interface
The Telnet Connections list displays the switches in all of the device groups, and shows
the status of any macros that have run or are being run on the switch. If macros are not
supported on an individual switch (true of third party switches and a few Extreme
switches) the Macro Status will be “Macros not supported.”
218
EPICenter Software Installation and User Guide
Using Telnet with Extreme Switches
NOTE
If a switch is not supported by the EPICenter interactive Telnet feature, it will not appear
in the Telnet Connections list, or in the Component Tree in this applet.
When a Telnet session is currently open on a switch, the switch name is highlighted in
bold in the list of switches in the Component Tree.
NOTE
If a switch displayed in the Component Tree has an “S” in a red circle along with the
name, that means that the switch is not responding to SNMP requests. However, the
switch may still respond to HTTP or Telnet requests.
Running ExtremeWare Command Macros
The lower half of the Macro view page contains the macro command buffer. You can
enter a series of ExtremeWare commands into this buffer, which will form a script that
can be played to the set of switches you select in the Telnet Connections list.
Figure 68 shows a command script entered into the buffer.
EPICenter Software Installation and User Guide
219
Using the Interactive Telnet Application
Figure 68: The Telnet record and play buffer
To create a macro for playback to a set of Extreme switches, follow these steps:
1 In the Telnet Connections list, select the set of switches where you want your
command macro to run. The switches need not have a Telnet session already
open—the macro play function will open a connection and log into the switch.
2 Enter a series of ExtremeWare commands into the macro buffer.
There are three ways to enter commands into the macro buffer:
— Type the commands directly into the buffer.
— Cut or copy commands from another location, either elsewhere in the buffer or
from an external document, and paste them into the buffer.
Click the right mouse button anywhere in the macro buffer to display a pop-up
edit menu which provides copy and paste functions. You can copy text from
within the macro buffer using the copy function from the pop-up menu. From an
220
EPICenter Software Installation and User Guide
Using Telnet with Extreme Switches
external document, cut or copy text into the clipboard, then use the paste
function from the pop-up edit menu.
— Load a saved macro (see “Saving a Macro in the EPICenter Database” on
page 222).
The source of the commands in the macro buffer is indicated by the Macro Source:
field at the top of the macro buffer panel.
3 To set the macro so that it plays back repeatedly at a specified interval, click the
Repeat button to display the Macro Repeat pop-up window.
a Check the Repeating check-box.
b Enter an interval (in seconds) in the Repeat Delay (sec) field.
c
Click OK.
4 Click Play to initiate playback of the macro on the selected switches. This opens a
connection to the switch, logs in using the switch login and password as specified in
the Inventory Manager, and runs the macro.
If the macro is a repeating macro, it will repeat sequentially on all selected switches
until you click Stop.
You can execute just a portion of a macro by highlighting just the portion of the
macro that you want to execute. Only the selected portion will execute when you
initiate the playback. This will not affect saving the macro—the entire macro will be
saved even if only a portion is highlighted.
The Macro Status column in the Telnet Connections table indicates the status of the
macro as execution progresses on the selected switches. The states are:
— Pending—The macro is intended to run on this switch, but has not yet started.
— Playing—The macro is currently running.
— Stopped—The macro was stopped before it completed.
— Complete—The macro has completed running.
— Macros Not Supported—Macros cannot be run on this device (may appear if you
select a non-Extreme device or the Summit Px1 or Summit 24e2T/X devices).
— Failed—A failure occurred when the macro was run. This is frequently due to an
inability to connect to the switch.
CAUTION
Macro play will be automatically stopped if you exit the Telnet applet (by selecting
another applet or logging out) while a macro is running.
EPICenter Software Installation and User Guide
221
Using the Interactive Telnet Application
There are two ways to view the results of the last macro execution on a particular
switch:
• You can select the switch in the Telnet Connections list, and click the View button at
the top of the screen. The View window displays the command output. Click OK to
close the window.
Or
• You can view the Telnet log file, found in the user subdirectory in the EPICenter root
install directory. Log files are created for each switch that runs the macro, and the
files are saved according to the switch IP address. The log files display the command
output.
Saving a Macro in the EPICenter Database
To save a macro you have defined, click the Save button. This displays the Macro Save
pop-up window (see Figure 69).
Figure 69: Saving a macro to the database
Enter a name for the macro, an optional description, and click OK.
All current contents of the macro buffer will be saved in the database under the name
you specify. Selecting a portion of the macro (to playback only part of the macro) does
not affect the save function.
To load a saved macro, click the Load button. This displays the Load Macro pop-up
window (see Figure 70).
222
EPICenter Software Installation and User Guide
Using Telnet with Extreme Switches
Figure 70: Loading a macro from the database
The pop-up window displays the names and descriptions of all saved macros, as well
as the owner (EPICenter user) who created the macro, and the time at which it was last
saved.
Select the macro you want to load and click Load. You can select only one macro to
load at a time.
The contents of the saved macro will replace any previous contents in the macro buffer.
You can delete a saved macro by clicking the Delete button. A pop-up window similar
to the Load Macro window appears. Select one or more macros to delete, then click
Delete.
You will be asked to confirm the deletion.
Examples of ExtremeWare Command Macros
EPICenter supports the use some interactive ExtremeWare commands, such as create,
configure, and save, as well as commands that may require you to press the space bar
to continue or [Q] to quit. For interactive commands used in a command macro, you
need to supply the response to the command in a separate line. The following examples
illustrate usage of these commands.
• To create a user account with the name “joesmith” and a password of “2joe3,” enter
the following commands:
create account user joesmith
2joe3
2joe3
EPICenter Software Installation and User Guide
223
Using the Interactive Telnet Application
NOTE
If you type a command that requires a password, you need to enter the password
twice. In a command macro, unlike an interactive Telnet session, the first “password”
sets the password, and the second “password” confirms the password.
• To use the save command to save a configuration to the switch, enter the following
commands:
save
yes
• To delete a user-defined STPD domain (stpd2) from the switch, enter the following
commands:
delete stpd2
yes
• To reboot the switch, enter the following commands:
reboot
yes
Running a Telnet Session on an Individual Switch
You can open a Telnet session on an individual switch by selecting the switch from the
Telnet switch list in the Component Tree. This opens a Telnet session to the selected
switch, and then waits for command input, just as with any other Telnet session.
EPICenter allows only five Telnet sessions to be open concurrently. Therefore, if you
select more than five switches, EPICenter will open five connections, then close the
oldest (the first connection) in order to open a connection on the sixth switch, and so
on. Open telnet sessions are indicated by displaying the switch name in bold in the
Component Tree.
Any open Telnet sessions will be closed when you leave the Telnet applet to view a
different EPICenter applet.
224
EPICenter Software Installation and User Guide
Using Telnet with Extreme Switches
Figure 71: A newly-opened Telnet session
Devices with open
Telnet sessions
The Telnet session window is a two-tone window—the bottom of the window is white,
the top is grey. The last 25 lines of Telnet commands and responses always appear in
the white portion of the window. As output grows, the older lines scroll up into the
grey portion of the screen. This makes it easy to tell whether you are viewing the most
recent Telnet output.
The Telnet session window will display the commands and results from macros that are
run on the switch. You can also type in commands individually.
Copy/Paste from an Interactive Telnet Session
A copy and paste function is available within an interactive Telnet session. Copy and
paste let you copy from one interactive Telnet session into another interactive session or
EPICenter Software Installation and User Guide
225
Using the Interactive Telnet Application
into the macro buffer. You can also paste commands from an external document into an
interactive Telnet session. The copy and paste commands reside on a pop-up menu that
you can display using the right mouse button (see Figure 72).
Figure 72: An open Telnet session showing the pop-up edit menu
• To copy from an interactive session, highlight the lines you want to copy, click the
right mouse button and select Copy from the pop-up menu.
• To paste into an interactive Telnet session or into the macro buffer, place the cursor
where you want the lines inserted, click the right mouse button and select Paste
from the pop-up menu.
NOTE
You cannot use the browser cut and paste functions for this purpose.
226
EPICenter Software Installation and User Guide
Using Interactive Telnet with Third-Party Devices
Macro Recording and Playback from an Interactive Telnet Session
The record function creates a macro by echoing commands that you type in an
interactive Telnet session, into the Macro Record/Play Buffer. The record function is
controlled by commands from a pop-up menu displayed by using the right mouse
button (see Figure 72).
• To start recording a macro, click the right mouse button and select Start Record from
the pop-up menu
Everything you type after this is copied into the macro Record/Play Buffer until you
select Stop Record from the pop-up menu
• To stop recording a macro, click the right mouse button and select Stop Record from
the pop-up menu
The commands that are part of the macro are automatically entered into the macro
command buffer
• To play the macro on one or more switches, select the Device Groups component or
the name of a device group in the Component tree, and play back the macro in the
main Telnet page as discussed in the section “Running ExtremeWare Command
Macros” on page 219
Using Interactive Telnet with Third-Party Devices
You can open an interactive Telnet session on a third-party device and execute
commands interactively. Select the switch from the Telnet device list in the Component
Tree. This opens a Telnet session to the selected switch, and waits for input as
appropriate to the device’s telnet interface. Unlike Telnet to an Extreme Networks
switch, it does not log you in to the device. You must log in as required for the device.
You can enter and execute commands using the device’s command line interface. The
commands and any resulting output will be displayed in the session window just as if
you were running a Telnet session on any other client.
The Telnet session window is a two-tone window—the bottom of the window is white,
the top is grey. The last 25 lines of Telnet commands and responses always appear in
the white portion of the window. As output grows, the older lines scroll up into the
grey portion of the screen. This makes it easy to tell whether you are viewing the most
recent Telnet output.
EPICenter Software Installation and User Guide
227
Using the Interactive Telnet Application
To close the Telnet session, type the appropriate exit command on the command line.
The session will be closed automatically when you exit the Telnet applet.
Viewing Device Information from Pop-up Menus
You can select a device group or a device in the Component Tree, then right-click to
display a pop-up menu that contains the Properties command. The Properties command
displays the attributes for a specific device group or device. The device pop-up menu
also contains the Alarms, Browse, EView, Statistics, and VLANs commands. All of these
commands perform the same functions as the applets in the Navigation Toolbar to the
left of the page, but with the appropriate device displayed.
Properties
The Properties function lets you view the attributes for a device group or a device.
To view the Properties display for all device groups:
• Right-click on the Device Groups component, then select Properties from the pop-up
menu that appears
The Device Groups Properties window appears and displays the number of device
groups and the names of the device groups that are known to EPICenter.
To view the Properties display for a selected device group:
• Right-click on the device group, then select Properties from the pop-up menu that
appears
The Device Group Properties window appears and displays the attributes for the
selected device group.
To view the Properties display for a selected device:
• Right-click on the device, then select Properties from the pop-up menu that appears
The Device Properties window appears and displays the attributes for the selected
device.
See “Displaying Properties” on page 231 for details on using this feature.
228
EPICenter Software Installation and User Guide
Viewing Device Information from Pop-up Menus
Alarms
The Alarms function runs the EPICenter Alarm System and displays the Alarm Browser
function to show the alarms for the selected device.
To view the Alarms display for a selected device:
• Right-click on the device, then select Alarms from the pop-up menu that appears
This starts the Alarm System applet in a new window. The Alarm System displays the
Alarm Log Browser and displays the alarms for the selected device.
See Chapter 5 for details on using this feature.
Browse
The Browse function runs the ExtremeWare Vista switch management interface for the
selected device.
To run ExtremeWare Vista for a selected device:
• Right-click on the device, then select Browse from the pop-up menu that appears
This starts the ExtremeWare Vista login page in a new web browser window.
Refer to the ExtremeWare Software User Guide for details on using ExtremeWare Vista.
EView
The EView function runs the EPICenter ExtremeView applet and displays the device
front-panel image and device information for the selected device.
To view the EView for a selected device:
• Right-click on the device, then select EView from the pop-up menu that appears
This starts the ExtremeView applet in a new window and displays the front-panel
image and information for the selected device.
See Chapter 10 for details on using this feature.
EPICenter Software Installation and User Guide
229
Using the Interactive Telnet Application
Statistics
The Statistics function runs the EPICenter Real-Time Statistics applet and displays port
statistics for the selected device.
To view the Device Statistics display for a selected device:
• Right-click on the device, then select Device from the pop-up menu that appears
This starts the Real-Time Statistics applet in a new window and displays port statistics
for the selected device.
See Chapter 11 for details on using this feature.
VLANs
The VLANs function runs the EPICenter VLANs applet and displays the VLANs
currently known to the EPICenter database.
To view the VLANs for a selected device:
• Right-click on the device, then select VLANs from the pop-up menu that appears
This starts the VLAN applet in a new window and displays the VLANs currently know
to the EPICenter database.
See Chapter 13 for details on using this feature.
Finding Devices
You can search for a device in the EPICenter database by name, by IP address, or by
type of device. This may be useful if you have a large number of devices in your
inventory.
To search for a device, follow these steps:
1 Click Find at the top of the Telnet applet page.
2 Enter your search criteria:
You can search for devices by name or by IP address. You can limit the search to a
specific domain, or to a specific type of Extreme device. Search criteria can include:
230
EPICenter Software Installation and User Guide
Displaying Properties
— A device name. Click the Device Name button, and enter a complete or partial
name in the Search: field.
— An IP address. Click the IP Address button and enter a complete or partial IP
address in the Search: field. You can use the wild card characters * or ? in your
search criteria.
* acts as a wildcard for an entire octet (0-255)
? is a wildcard for a single digit (0-9)
— A device group. Select the device group from the drop-down menu in the device
group field. If you do not specify a name or IP address in the Search field, all
devices in the device group you select will be found.
— A device type. Select the device type from the drop-down menu in the type field.
If you do not specify a name or IP address in the Search field, all devices of the
type you select will be found.
3 Click Find to search for devices that meet the criteria you have specified. All devices
found are listed in the center panel. Information includes the domain in which the
device can be found, its name, IP address, and the type of device.
4 Double-click on a device in the results table to highlight the device in the
Component Tree, or select a device in the results table and click OK, to initiate a
telnet session on the device (see “Running a Telnet Session on an Individual Switch”
on page 224). If you click OK, the search window will close.
5 Click New Search to clear all search criteria.
6 Click Cancel to close the search window.
Displaying Properties
You can view the properties of a device group or a device in the EPICenter database.
This section describes how to view the device group properties and the device
properties.
Device Group Properties
You can view summary information for all device groups, or view information about
individual device groups.
To view summary information for all device groups, right-click on the Device Groups
component and select Properties from the pop-up menu.
EPICenter Software Installation and User Guide
231
Using the Interactive Telnet Application
The Device Groups Properties window appears, showing the All Device Groups display.
This displays a list of the current device groups and their descriptions. For more details
about this display, see Chapter 4.
You can also view properties for a specific device group. To view properties for a
specific device group, right-click on a device group and select Properties from the
pop-up menu.
The Device Group Properties window appears, showing information about the selected
group. This includes the group description, the number of devices in the group, and a
list of the devices. For more details about this display, see Chapter 4.
Device Properties
To view properties for a device, right-click on a device in the Component Tree and
select Properties from the pop-up menu that appears.
The Device Properties window has three tabs at the top of the window:
• Device
• VLAN
• STP
Each tab displays the name of the device and a status “light” which shows the status of
the device as detected by EPICenter.
The Device Tab
The Device tab displays information about the device such as its IP address, MAC
address, and boot time. The main section of the window presents the same information
you can view in the Inventory Manager for the device. If the device is an Extreme
device, the ExtremeWare software running in the switch provides comprehensive status
information.
The VLAN Tab
The VLAN tab lists the VLANs configured on the device.
232
EPICenter Software Installation and User Guide
Displaying Properties
The STP Tab
The STP tab lists the Spanning Tree domains (STPDs) configured on the device. There
may be more than one entry per STPD if the domain includes multiple VLANs.
For more details about the Device Properties window, see Chapter 4.
EPICenter Software Installation and User Guide
233
Using the Interactive Telnet Application
234
EPICenter Software Installation and User Guide
8
The Grouping Manager
This chapter describes how to use the Grouping Manager to do the following:
• Create new groups
• Create new user or host resources
• Add resources or groups to a parent group
• Define relationships between resources
• Add attributes to a resource or a group
• Search for resources
• Import users and hosts from Windows NT Domain Controller, NIS, an LDAP
directory, or a file
Overview of the Grouping Manager
The Grouping Manager allows you to collect network “resources” (devices, ports, users,
hosts, and VLANs) into groups that can be manipulated or managed as a single entity.
A group is a hierarchical collection of resources that have been grouped together for
some common purpose. A group can contain individual resources as well as other
(subordinate) groups. Groups (except for Device Groups) are not exclusive—a resource
can be a member (child) of more than one group.
Resources are individual elements in your network, such as a device, port, host (end
station), user, or VLAN. Device, port, and VLAN resources are defined externally to the
EPICenter Software Installation and User Guide
235
The Grouping Manager
Grouping Manager, through the EPICenter discovery capability and the Inventory and
VLAN applets. User and Host resources are defined within the Grouping module,
either by importing the information from an external source (such as an LDAP
directory, NT Domain Controller, NIS server, or a file) or by creating the resources
within the grouping module. A group can also be considered a “resource” when it is
used as an entity in the same way as an individual resource would be used—such as in
a Policy definition within the EPICenter Policy Manager, an optional,
separately-licensed product.
With the exception of Device Groups and Port Groups, the group and resource
definitions you create through the Grouping applet are primarily useful within the
Policy Manager. For more information on how groups are used within that application,
see the EPICenter Policy Manager Software User Guide.
You can define groups and add resources to them to create an organizational structure
that facilitates managing your network. The EPICenter software provides several
predefined groups:
• Device Groups
• Hosts
• Import Sources
• Port Groups
• Users
You can define your own groups at the same hierarchical level as the predefined
groups, or as subordinate groups (children) of an existing group. You can assign
resources to your own user-defined groups and to the predefined groups, with the
exception of Device Groups and Import Sources.
Three of the predefined groups—Hosts, Port Groups, and Users—initially have no
members. Although these groups are provided to help you organize your host, user,
and port resources, they can contain children of any resource type. You can create new
groups as members of these groups, or add resources of any type directly to them.
• Port Groups may be used by the Real Time Statistics applet and the IP/MAC
Address Finder applet. However, these applets do not support hierarchical
groups—if you have subordinate groups within a port group, the subordinate layers
are all collapsed into a single layer. Resources of types other than ports are ignored
by these applets.
Port Groups, along with all the other types of groups and resources, may also be
used by the optional Policy Manager module.
236
EPICenter Software Installation and User Guide
Overview of the Grouping Manager
• The Hosts and Users groups (either the predefined groups or subordinate groups)
may be used by the optional Policy Manager. This is also true of all user-defined
groups. No other EPICenter applets currently support groups of these types.
In a group that contains resources of different types, the Policy Manager will ignore
those resources that are not relevant to the purpose for which the group has been
selected.
The other two predefined groups, the Device Groups group and the Import Sources
group, are restricted in the way they can be used.
Device Groups. The “Device Groups” group contains the device groups and devices
known to the EPICenter inventory database. Device groups are created within the
EPICenter Inventory Manager applet, and devices are added or discovered, and are
assigned to device groups, within that applet. All port resources are also defined in
association with the devices known to the Inventory Manager.
• You cannot add resources to or remove resources from the Device Groups group
through the Grouping Manager.
• You can add resources that are children of Device Groups group—device groups,
devices, and ports—as members (children) of other groups.
Import Sources. The Import Sources group is used to contain resources imported from
an external source, such as a file, NT Domain Controller, or LDAP directory. When you
perform an import operation, the Grouping Manager creates a new group under the
Import Sources group, and puts all the imported resources under that group.
• You cannot add groups or individual resources as children of the Import Sources
group except by using the Import function.
• You cannot remove any of the members (including sub-groups) of an imported
group. The imported group can only be deleted in its entirety, using the Destroy
function.
• You can add resources that are children of an Import Sources group as members
(children) of other groups.
Resource Attributes
Attributes are name and value pairs that you can use for a variety of purposes. You can
associate attributes with both groups and individual resources, including resources that
are members of the Device Groups and Import Sources groups.
EPICenter Software Installation and User Guide
237
The Grouping Manager
Some predefined resources, such as devices and imported resources, may also have
predefined attributes. For example, device resources have their IP address as an
attribute. Imported resources may bring with them sets of attributes determined by the
content and configuration of the import source. Certain attributes, such as IP/subnet
address and DLCS ID, are used by the optional Policy Manager applet to help it map
between high-level named resources such as Users, and the information required to
generate a QoS policy (IP address and port information).
You can also define attributes of your own, and then use them as search criteria when
you want to find sets of resources with common attributes.
Relationships between Resources
The Grouping Manager also supports “relationships” between User, Host, and Port
resources. These relationships are used by the optional Policy Manager applet, and help
the Policy Manager generate specific QoS rules that it derives from high-level policy
specifications that are given in terms of named objects such as users or hosts. See the
EPICenter Policy Manager Software User Guide for details.
Displaying EPICenter Groups and Resources
When you click the Groups button in the Navigation toolbar, the main Grouping
Manager window is displayed, showing Resource Details for the root-level group.
Figure 73 shows the Grouping Manager window with a number of the groups
expanded to show their children.
238
EPICenter Software Installation and User Guide
Overview of the Grouping Manager
Figure 73: Resource Details view
Groups Children
Device Resources
Tab to display Children
or Relationships
Tab to display
Attributes
The Component Tree on the left shows the currently-defined resources. Initially, this
shows only the root-level group named “Groups.” Click on the plus sign to the left of a
resource to display the children of that resource.
Children can be individual resources (devices, hosts, users, or ports) or groups. The
icons indicate the type of resource:
indicates a general-purpose group.
indicates a device group.
indicates a host resource.
EPICenter Software Installation and User Guide
239
The Grouping Manager
indicates a user resource.
indicates a VLAN resource.
Devices, slots, and ports are indicated by icons that vary based on the specific device
model and port type. The icons are the same as are used in the Component Tree of
the Inventory module and other EPICenter modules. Although slots appear in the
Component Tree, they are not true resources, and cannot be children of groups
within the Grouping Manager.
VLANs may appear as children in the Component Tree. However, unlike devices
and Device Groups, VLANs will appear in this list only after they have been
specifically added as children of a group. VLANs known to EPICenter but not used
as children of a group will not appear in this list.
Resource Details
The Resource Details display in the main panel shows the following information for
the group (or resource) that is selected in the Component Tree on the left:
• Name—The name of the Resource.
For ports, the name of the port is the Device name followed by the port number. For
example, S1 3 is the name of port 3 on the device named S1.
• Description—A description of the resource (optional for user-defined resources).
— For Device Groups, this is the description entered for the group in the Inventory
Manager.
— For devices, this is the device description (sysDescr variable) if present in the
agent.
— For ports, this is the interface description (ifDescr variable) if present in the
agent.
— For VLANs, this contains the protocol and tag information.
• Type—The type of resource (Group, Device, Host, Port, User, VLAN).
Note that if you select a slot under a chassis device in the tree, the Resource Details
window displays it as a “Slot” resource. However, a slot is not a true resource in that
it cannot be added as a child of a group— its ports can be used as resources, but the
slot as an entity cannot.
• Source—The origin of the resource. The source determines what actions are allowed
relative to the resource, this can be one of the following:
240
EPICenter Software Installation and User Guide
Overview of the Grouping Manager
— EPICenter indicates that the resource was defined by the EPICenter software:
either by the Grouping Manager in the case of the predefined groups, or by
another EPICenter applet in the case of device group, device, port, or VLAN
resources. You cannot modify these resources or their children (if they are groups)
through the Grouping Applet.
— Manual indicates that this is a user-defined resource, created within the grouping
applet using the New button. These resources can be deleted from the Grouping
Manager using the Destroy function. The exception is the three predefined
groups, Hosts, Users, and Port Groups, which are considered Manual resources
but cannot be destroyed. If the user-defined resource is a group, you can add and
remove children as desired.
— Imported resources are assigned a source name as part of the Import process. See
“Importing Resources” on page 263 for more information.
User-defined (Manual) resources can be deleted using the Destroy function.
System-defined (EPICenter) and imported resources cannot be deleted, although
they can be removed as children of other groups to which you have added them. See
“Deleting Resources” on page 245 for more information on deleting resources, and
“Removing A Child Resource from a Group” on page 250 for more information on
removing resources from groups.
• Unique Name—A name that uniquely defines this resource within the Source scope.
For user-defined resources (Source is Manual) this will always be blank.
— For pre-defined resources, the Unique Name is the same as the Resource Name.
— For device resources, the Unique Name is the device IP address.
— For port resources, the Unique Name is the IP address of the device followed by
the port number. For ports on a chassis device, the port number combines the slot
number and the port number.
— For resources imported from a file or LDAP directory, the Unique Name is
specified in the input process, and may be different from the Resource Name.
Below these fields there are two tabbed pages whose contents depends on the type of
resource being displayed.
• For Groups, you can view a list of Children of the group. This lists the resources
(individual resources or subordinate groups) associated with the selected group. For
each child, the list includes the resource name, its type, and its source.
• For User, Port and Host resources, you can view a list of Relationships for the
resource. This displays a list of other resources related to the selected resource.
EPICenter Software Installation and User Guide
241
The Grouping Manager
• For all types, you can view a list of the Attributes associated with the resource. The
exception is the top level (root) node, “Groups,” which has no attributes.
Resource Filtering
The field at the top of the Component Tree provides a drop-down menu from which
you can select a filter to apply to the Component Tree display. This filter controls the
types of resources that are displayed as subcomponents of the groups in the tree. This
feature is useful when you have a large number of resources of various types, and lets
you limit the display to resources of a specific type in which you are interested.
Groups are always displayed. The following filter choices determine the types of
individual resources that will be displayed within the groups:
• All allows resource children of all types to be displayed.
• Devices shows only the Device resources within the groups.
• Hosts shows only Host resources within the groups.
• Ports shows only Device and Port resources within the groups.
• Users shows only User resources within the groups.
• VLANs shows only VLAN resources within the groups.
Grouping Manager Functions
The buttons in the navigation bar at the top of the page provide the following functions:
• New lets you create a new Group, User, or Host resource.
• Destroy lets you delete a user-defined resource. This completely eliminates the
resource from the EPICenter database, as well as removing it from all groups of
which it was a member. This is not the same as removing a resource from an
individual group. You cannot destroy system-defined resources or individual
imported resources. You can only destroy imported resources by destroying the
entire Import Source group.
• Import lets you import resources from an external source such as an NT Domain
Controller, LDAP database, or a specially-formatted text file.
• Find lets you find a resource based on a set of search criteria that can include a
resource name, description, type, source, or attribute value.
• Help displays on-line help for the Grouping Manager and the Resource Details
display.
242
EPICenter Software Installation and User Guide
Creating a New Resource
These functions are described in detail in the following sections.
Creating a New Resource
You can create new groups and add new User and Host resources through the New
Resource function. You can also associate attributes with the resource during this
process.
This function creates a new resource. To add an existing resource to an existing group,
see “Adding a Resource as a Child of a Group” on page 246.
NOTE
You cannot add resources of any type to the Device Groups or Import Sources groups,
or any subgroups within those groups.
To add a new resource, do the following:
1 In the Component Tree, select the Group to which you want the resource added. To
add a new group at the highest level, select the root “Groups” node. The new
resource will be added as a child of the group you select.
If you plan to add User or Host resources, it is suggested that you add these initially
to the User or Host groups, or to another group you have created, rather than to the
root-level group. Once you’ve created a resource, you can add it as a child of other
groups. For example, a User resource “Fred” can be a member of both the group
“Marketing” and the group “Chicago.”
2 Click the New button at the top of the Grouping Manager window.
The Add a New Resource to Group window, as shown in Figure 74, is displayed.
EPICenter Software Installation and User Guide
243
The Grouping Manager
Figure 74: Adding a new resource
3 Enter identifying information in the fields at the top of the dialog:
— Resource Name—A name for the resource. The name can include any characters
except a colon.
— Resource Type—Select a type (Group, User, or Host) from the drop-down menu.
If you are creating this resource as a member of the Hosts group, the type
defaults to Host. If you are creating it as a member of the Users group, the type
defaults to User. Otherwise, the type is set to Group by default.
— Resource Description—an optional description of the resource
4 Define any attributes that you want to associate with this resource. Attributes are
name-value pairs that can be used as search criteria, and are used by the EPICenter
Policy Manager. For a more detailed explanation of attributes, see “Adding and
Removing Attributes” on page 255.
a Enter the name of the attribute in the Name field.
b Select an attribute type from the drop-down list in the Type field:
Generic—Any attribute not specified as one of the other two types. The value is a
string. You can use this attribute to classify your resources in any way you want,
for search purposes.
IP/Subnet—This attribute specifies an IP address and subnet mask. For Host or
User resources, this attribute may be used by the Policy Manager.
244
EPICenter Software Installation and User Guide
Creating a New Resource
DLCS ID—This attribute specifies a DLCS ID (user ID or host ID) that can be
detected by DLCS in the switch. DLCS ID attributes are most commonly created
when a resource is imported from an external source such as an NT Domain
Controller or NIS that contains user and host information.
For Host and User resources, this attribute may be used by the EPICenter Policy
Manager. If DLCS is enabled on the switches in your network, attribute and
relationship information (mappings between users, hosts, and IP addresses) for
host and user resources with DLCS IDs, will be maintained automatically.
c
Enter a value for the attribute:
For a Generic attribute, enter a string.
For an IP/Subnet attribute, fill in the fields provided, and edit the subnet mask
specification as appropriate.
For a DLCS ID, enter a string. In order to be recognized correctly by the DLCS in
Extreme switches, this should be the user name (login name) or host name as
known within the network.
d To add this attribute to the list of attributes associated with this resource, click the
Add Attribute to Resource button
.
e To remove an attribute from the list of attributes, select the attribute in the list
and click the Remove Attribute from Resource button
.
5 When you have finished entering attributes, click the OK button to save your new
resource definition.
To close this dialog without saving the resource definition, click the Cancel button.
Deleting Resources
The Destroy button in the Grouping Manager toolbar lets you delete user-defined
resources from the EPICenter database. The destroy function removes the resource from
the database entirely, removing it from all groups where it exists as a child.
NOTE
You can only destroy resources whose source is “Manual” (except for the predefined
groups) and the root groups of imported resources. You cannot destroy the predefined
EPICenter Software Installation and User Guide
245
The Grouping Manager
groups, system-defined resources (devices, device groups, or ports) whose source is
EPICenter, or individual imported resources (where the source is a file, LDAP database
etc.). If you select a resource you cannot delete, the Destroy button will not be available.
To delete a user-defined resource do the following:
1 Select the resource in the Component Tree.
2 Click the Destroy button on the toolbar.
A confirmation dialog will be displayed. Click OK to confirm that you want to
delete this resource.
If you delete a group, any orphaned children of the group (resources that are not
members of any other group) are also deleted.
If you delete a Host or User, all relationships to other resources are also deleted.
To remove a resource as a child of a group, use the Remove function, see “Removing A
Child Resource from a Group” on page 250. This just removes the parent-child
relationship with the group, but does not delete the resource from the database.
Adding a Resource as a Child of a Group
A group’s children are individual resources or subordinate groups that will be
manipulated or managed together. A resource is placed into a group as it is created—
either the root-level group, or the group that was selected when it was created.
However, because a resource can be a member of multiple groups, you may wish to add
an existing resource to an additional group, or move it to a different group. To add a
resource to a group, you select the resource from a list of the resources that are
currently defined in the EPICenter database.
You can add individual resources as children of a group, or you can add groups as
children. You cannot add an ancestor group as a child of one of its subordinate groups.
When you add a group as a child of another group, all members of the sub-group (its
children) are considered members of the higher level (ancestor) group. As membership
in the sub-group changes, so does the membership in the higher level (ancestor) group.
This can have important effects when a group is used by another EPICenter module.
For example, suppose you create group “A” that contains two groups of hosts “HostsA”
and “HostsB”, and then use group A in defining access list policies through the Policy
Manager. The Policy Manager will generate access list rules for traffic related to all the
246
EPICenter Software Installation and User Guide
Adding a Resource as a Child of a Group
hosts in groups HostsA and HostsB. If you subsequently change the membership of
HostsB, and auto-configuration of policies is enabled in the Policy Manager, the QoS
rules that define the access lists will automatically be recomputed and reconfigured.
(See the EPICenter Policy Manager Software User Guide for more information on this
optional module).
Adding resources to a group as individuals is a more static relationship—resources
remain as children until they are explicitly removed from the group (or deleted from the
EPICenter database).
To add a resource or group of resources to a higher-level group, do the following:
1 In the Component Tree, select the group to which you want to add the resource, so
that the group’s information is displayed in the Resource Details view.
2 Click the tab labeled Children to display the list of children belonging to this group.
3 Click the Add button at the bottom of the list of Children to display the Add
Resources to Group pop-up dialog, as shown in Figure 75.
Figure 75: Adding Resources to a Group
EPICenter Software Installation and User Guide
247
The Grouping Manager
This window has two parts:
— A display of the resources in the EPICenter database that are available to be
added to the group.
— A list of the resources you have selected to add.
4 Select a resource from one of the lists in the Select Resources to be Added panel at
the left hand side of the dialog window. You can make your selection from either
side of the panel.
The Select Resources to be Added panel is split into two parts:
— The Component Tree in the left half of the panel displays the groups that contain
resources of interest. It may include devices if you have filtering set to display
port resources.
The drop-down menu field at the top of the Component Tree lets you select a
filter to apply to the resource display. This filter controls the types of resources
that are displayed as subcomponents of the groups in the tree.
Groups are always displayed. The following filter choices determine the types of
individual resources that will be displayed within the groups:
Show All allows resource children of all types to be displayed.
Show Devices shows only Device resources within the groups.
Show Hosts shows only Host resources within the groups.
Show Ports shows only Device and Port resources within the groups.
Show Users shows only User resources within the groups.
Show VLANs shows only VLAN resources within the groups.
— The resource list in the right half of the panel displays the resources available
within the group you have selected in the Component Tree.
5 Select one or more resources from the list of individual resources, or select a resource
group or device from the left-hand list.
6 Click the Add button
to add your selections to the Resource Results list.
You can select a group in the Component Tree or one or more groups or individual
resources from the resource list.
Click the Add All button
to add all the individual resources in the
right-hand list to the Resource Results list.
248
EPICenter Software Installation and User Guide
Adding a Resource as a Child of a Group
NOTE
There is an important difference between adding individual resources as children of
a group, and adding a group as a child of another group. Adding a group to the
results list does not have the same effect as selecting the group in the Component
Tree, and then adding its children using the Add All button.
When you add a group as a child of another group, all members of the subgroup (its
children) are considered members of the higher level (ancestor) group. As
membership in a subgroup changes, so does the membership in the higher level
(ancestor) group. Resources added individually, on the other hand, remain as
children until they are explicitly removed from the group (or deleted from the
EPICenter database).
To search for a resource using the Query function, click the Find button. You can add
the results of your query directly into your Resource Results list by selecting the
resources you want to add and clicking the Add button at the bottom of the Query
window. See “Searching for a Resource” on page 258 for more information on the
Find function.
7 You can remove resources from the Resource Results list if you change your mind
about your selections.
Select one or more resources in the Resource Results list, and click the Remove
button to remove the selected resources, and return them to the Resources to be
Added list.
Click the Remove All button to clear the Resource Results list.
8 Click OK to add the resources in the Resource Results list to the list of children for
this resource, or Cancel to cancel the Add function.
9 To save your changes to the EPICenter database, click the Save button at the bottom
of the Grouping Manager window.
If you attempt to begin a different operation or leave the Grouping Manager applet
without saving, the Grouping Manager will prompt you to save your changes.
However, you can add and remove children and attributes to the group you have
selected in multiple operations before you save.
Click the Cancel button at the bottom of the window to cancel the changes you have
made to this group.
EPICenter Software Installation and User Guide
249
The Grouping Manager
Removing A Child Resource from a Group
If you have added a resource as a child of a group, you can remove the resource from
that group using the Remove function. This removes the parent-child relationship
between the resource and the group. This does not remove the resource from the
EPICenter database, unless it is a user-defined resource and this is the only instance of
the resource. (Removing all instances of a resource is the equivalent of destroying the
resource.)
To remove a resource from a group, do the following:
1 Select the parent group in the Component Tree to display the group in the Resource
Details window.
2 Select the Children tab to display the resources that are children of the group.
3 Select the resource you want to remove.
4 Click the Remove button at the bottom of the window.
5 To save your changes to the EPICenter database, click the Save button at the bottom
of the Grouping Manager window.
If you attempt to begin a different operation or leave the Grouping Manager applet
without saving, the Grouping Manager will prompt you to save your changes.
However, you can add and remove children and attributes to the group you have
selected in multiple operations before you save.
Click the Cancel button at the bottom of the window to cancel the changes you have
made to this group.
Note that you can also remove resources by locating them using the Find function, and
removing them using the search results list. See “Searching for a Resource” on page 258
for more information on the Find function.
Removing a resource from all groups of which it is a member is the equivalent of
destroying the resource.
Adding Relationships to a Resource
Individual resources cannot have children. However, certain types of resources (Hosts,
Users, or Ports) can have relationships. Devices cannot have either relationships or
children.
250
EPICenter Software Installation and User Guide
Adding a Resource as a Child of a Group
For example, a Host may have a relationship with a User, which indicates that the User
is associated with the IP address of that Host. A Host may also have a relationship with
a port, indicating that the host communicates over that port.
These relationships may be used by the Policy Manager applet to create low-level QoS
policy rules based on named higher-level objects such as users and hosts. Relationships
can be created between the following:
• Hosts and Users
• Hosts and Ports
• Users and Ports
These relationships are always reciprocal: when you create a relationship between two
resources, it is added simultaneously to both resources.
1 In the Component Tree, select the resource to which you want to add a relationship,
so that it is displayed in the Resource Details view.
2 Click the tab labeled Relationships to display the list of children belonging to this
group.
3 Click the Add button at the bottom of the list of Children to display the Add
Relationship to Group pop-up dialog, as shown in Figure 76.
EPICenter Software Installation and User Guide
251
The Grouping Manager
Figure 76: Adding Relationships to a Resource
This window has two parts:
— A display of the resources in the EPICenter database that are eligible to be used
in a relationship.
— A list of the relationships you’ve selected to add to the resource.
4 Select a resource from one of the lists in the Select Resources to be Added panel at
the left hand side of the dialog window. You can make your selection from either
side of the panel.
The Select Resources to be Added panel is split into two parts:
— The Component Tree in the left half of the panel displays the groups that contain
resources of interest.
The drop-down menu field at the top of the Component Tree lets you select a
filter to apply to the resource display. You can filter the resources that will be
presented as children of the groups in the tree.
Show All allows resource children of all types to be displayed.
Show Devices shows only Device resources. (However, devices cannot be used in
relationships, so nothing is displayed if you select this filter.)
Show Hosts shows only Host resources.
252
EPICenter Software Installation and User Guide
Adding a Resource as a Child of a Group
Show Ports shows only Device and Port resources.
Show Users shows only User resources.
Show VLANs shows only VLAN resources. (However, VLAN resources cannot
be used in relationships, so nothing is displayed if you select this filter.)
— The resource list in the right half of the panel displays the resources available
within the group you have selected in the Component Tree. It will display only
the types of resources that are eligible to have relationships (host, users, and
ports).
5 Select one or more resources in the list, and click the Add button
to add
your selections to the Resource Results list. You can select a group in the Component
Tree or one or more groups or individual resources from the resource list.
Click the Add All button
to add all the individual resources in the
right-hand list to the Resource Results list.
To search for a resource using the Search function, click the Find button. You can
add the results of your query directly into your Resource Results list by selecting the
resources you want to add and clicking the Add button at the bottom of the Search
window. See “Searching for a Resource” on page 258 for more information on the
Find function.
6 You can remove resources from the Resource Results list if you change your mind
about your selections.
Select one or more resources in the Resource Results list, and click the Remove
button to remove the selected resources, and return them to the Resources to be
Added list.
Click the Remove All button to clear the Resource Results list.
7 Click OK to add the resources in the Resource Results list to the list of relationships
for this resource.
8 To save your changes to the EPICenter database, click the Save button at the bottom
of the Grouping Manager window.
If you attempt to begin a different operation or leave the Grouping Manager applet
without saving, the Grouping Manager will prompt you to save your changes.
However, you can add and remove relationships and attributes in multiple
operations on the resource you have selected before you save.
EPICenter Software Installation and User Guide
253
The Grouping Manager
Click the Cancel button at the bottom of the window to cancel the changes you have
made to this group.
Removing Relationships from a Resource
To remove a relationship between two resources (Hosts, Users, or Ports) do the
following:
1 In the Component Tree, select one of the resources that is involved in the
relationship, so that the resource is displayed in the Resource Details window.
2 Select the Relationship tab to display the relationships for the resource.
3 Select the relationship you want to remove.
4 Click the Remove button at the bottom of the window. The relationship will be
removed both from the resource you are viewing, and from the other resource
involved in the relationship.
For example, if Host resource “HostB” has a relationship with user resource
“Watson” the relationship will appear in the relationship list of both resources. If
you display the relationships for resource HostB, and remove the relationship with
user Watson, the relationship will be removed from the relationship lists of both
HostB and Watson.
5 To save your changes to the EPICenter database, click the Save button at the bottom
of the Grouping Manager window.
If you attempt to begin a different operation or leave the Grouping Manager applet
without saving, the Grouping Manager will prompt you to save your changes.
However, you can add and remove relationships and attributes in multiple
operations on the resource you’ve selected before you save.
Click the Cancel button at the bottom of the window to cancel the changes you’ve
made to this group.
Removing a relationship does not affect the group memberships of either resource.
NOTE
If you destroy a resource, any relationships with that resource will automatically be
removed from the other resources involved.
254
EPICenter Software Installation and User Guide
Adding and Removing Attributes
Adding and Removing Attributes
Any resource (individual resources or groups) can have attributes. Attributes are simply
name-value pairs that can be used for a number of purposes.
There are three types of attributes:
• Generic—A user-defined attribute not specified as one of the other two types. The
value is a string. You can use this attribute to classify your resources in any way you
want, for search purposes.
• IP/Subnet—An IP address and subnet mask. This attribute may be used by the
Policy Manager to map a User or Host resource to an IP address.
• DLCS ID—This attribute specifies a DLCS ID (user ID or host ID) that can be
detected by DLCS in the switch. DLCS ID attributes are most commonly created
when a resource is imported from an external source such as an NT Domain
Controller or NIS that contains user and host information.
For Host and User resources, this attribute may be used by the EPICenter Policy
Manager. If DLCS is enabled on the switches in your network, attribute and
relationship information (mappings between users, hosts, and IP addresses) for host
and user resources with DLCS IDs, will be maintained automatically.
To view the attributes associated with a resource, do the following:
1 Select the resource in the Component Tree, so that it is displayed in the Resource
Details view.
2 Click the Attributes tab. This will display the attributes (if any) associated with the
resource, as shown in Figure 77.
EPICenter Software Installation and User Guide
255
The Grouping Manager
Figure 77: Resource attribute display
To add an attribute to the displayed resource, do the following:
1 Make sure the Attributes page is displayed. If it is not, the Add button will not be
present.
2 Click the Add button
.
The Add Attributes pop-up dialog appears, as shown in Figure 78.
256
EPICenter Software Installation and User Guide
Adding and Removing Attributes
Figure 78: Adding attributes to a resource
3 Enter the name of the attribute in the Attribute Name field.
4 Select an attribute type from the drop-down list in the Attribute Type field:
Generic—Any user-defined attribute other than an IP Address or DLCS ID.
IP/Subnet—An IP address and subnet mask.
DLCS ID—A User ID or Host ID as it will be detected by DLCS in the switch.
5 Enter a value for the attribute:
For a Generic attribute, enter a string.
For an IP/Subnet attribute, fill in the fields provided, and edit the subnet mask
specification as appropriate.
For a DLCS ID, enter a string. In order to be recognized correctly by DLCS in
Extreme switches, this should be the user name (login name) or host name as known
within the network.
6 CLick OK to enter the attribute into the attribute list.
7 To save your changes to the EPICenter database, click the Save button at the bottom
of the Grouping Manager window.
If you attempt to begin a different operation or leave the Grouping Manager applet
without saving, the Grouping Manager will prompt you to save your changes.
However, you can add and remove relationships and attributes in multiple
operations on the resource you’ve selected before you save.
Click the Cancel button at the bottom of the window to cancel the changes you’ve
made to this group.
To remove an attribute from the list of attributes, do the following:
EPICenter Software Installation and User Guide
257
The Grouping Manager
1 Select one or more attributes you want to remove.
2 Click the Remove button
.
3 To save your changes to the EPICenter database, click the Save button at the bottom
of the Grouping Manager window.
Click the Cancel button at the bottom of the window to cancel the changes you have
made to this group.
Searching for a Resource
If you have a large number of resources defined in your EPICenter database, it may be
cumbersome to find a specific resource in the Component Tree. In addition, you may
want to be able to quickly identify all the resources that share a certain attribute. The
Grouping Manager’s Search function lets you find resources using any of the resource
information fields as well as attributes as search criteria.
A search can be initiated either from the main toolbar, or by using the Find button in
the Add Resource or Add Relationship pop-up windows. Setting up and executing the
search is the same regardless of where you initiate the search; however, the actions you
can take with the results differ depending on where you started from.
The Search Results provide you with the name of the resources that match your criteria,
and the paths (group hierarchy) to where the resources reside within your search scope.
• If you initiate the Search from the main toolbar, you can select one or more resource
in the result list, and remove them from their parent groups. See “Searching from the
Main Toolbar” on page 262 for more information. You can double-click a resource in
the results list to see where it is located in the Component Tree.
• If you initiate the search from an Add Relationship or Add Resource window, you
can select one or more resources in the result list and add them to the Resource
Results list in the Add Resource or Add Relationship window. See “Searching from
the Add Resources or Add Relationship Window” on page 262 for more information.
Setting up a Resource Search
To search for resources that match criteria you specify, do the following:
258
EPICenter Software Installation and User Guide
Searching for a Resource
1 Click the Find button in the toolbar at the top of the main Grouping Manager
window, or click the Find button in the Add Relationship or Add Resource pop-up
windows.
The Search Criteria window is displayed, as shown in Figure 79.
Figure 79: Searching for a resource
The top half of the window is used to specify your search criteria. The Component
Tree is used to define a scope for the search.
The bottom half of the window contains the results of the search. You can limit the
number of results you want to receive in the case of a search that could yield a large
number of matches.
2 Enter your search criteria using the fields in the top part of the window. A resource
will match the query if it meets all the criteria specified in this section:
EPICenter Software Installation and User Guide
259
The Grouping Manager
— <ANY> specifies a wildcard match, meaning that any and all values for this item
will produce a match. There are also two other ways to indicate a wildcard
match:
• The asterisk character * used by itself.
• A blank field.
— For Resource Name, Resource Description, and Resource Source, enter a string to
specify the value you want to match. You can specify a partial match using the
wildcard characters * and ?.
• An * indicates a wildcard match of unspecified length. Specifying a Resource
Name as “A*n” will find all Resources whose names start with “A” and end
with “n.” This would include Ann, Alan, Allen, Allison, and so on. Using the
* by itself is the same as specifying <ANY>.
• A ? indicates a single character wildcard. Specifying a Resource Name as
“A?n” will find all Resources whose name start with “A”, and with “n” and
having exactly one character in between. This would include Ann and Ayn,
but not Alan, Allen or Allison.
— For Resource Type, select a specific type from the drop-down menu, or use
<ANY> to match on all types.
NOTE
The values you enter into the search criteria fields are combined using a Boolean
AND. This means a resource must match all the criteria you specify in these fields in
order be included in the search results.
3 Enter any attribute specifications you want to use as search criteria. The process is
similar to that used to add attributes to a resource. A resource will match the query
if it matches any of the attributes specified in this section:
a Enter an attribute name or a partial name using the * and ? wildcard characters.
b Select an attribute type from the drop-down list in the Type field, or select
<ANY> to match all attribute types.
c
Enter a value you want to match, or a partial match using the * and ? wildcard
characters.
d Click the Add button,
Criteria list.
260
, to add the attribute specification to the Attribute
EPICenter Software Installation and User Guide
Searching for a Resource
e To remove an attribute search criteria you
have added to the Attribute Criteria list,
select the attribute and click the Remove button
.
NOTE
Attributes used as search criteria are combined using a Boolean OR. This means
that a resource that matches all the criteria specified in search criteria fields (in the
top part of the window) and that matches any one (or more) of the attribute criteria,
will be included in the search results.
4 Specify a Scope for the search from the Component Tree at the left side of Search
Criteria area. The scope will limit the search to the group you select, and its
subordinate groups. By default the scope is set to the root-level group “Groups,”
which means all groups will be searched.
5 To reset all the criteria to their defaults (<ANY>) and to clear the Attribute Criteria
list, click the Reset button at the bottom of the window.
6 At the top of the Results portion of the window, select from the drop-down menu a
limit for the number of matches you want to see. All indicates you want to see all
matches. You can limit the results to 1, 10, 50, or 100 matches. The actual number of
matches found will be displayed next to this field.
7 Click the Query button to initiate the search. The results will be displayed in the
bottom portion of the window. The list will become a scrolling list if the number of
results requires it.
For each match, the results will display the following:
— Resource ID: a unique internal number provided by the EPICenter software. This
may be useful to distinguish between resources if you happen to have created
several resources with the same name.
— Resource Name: the name of the resource
— Path: the path through the Group hierarchy to the location of the resource.
Note that an individual resource (i.e. the same Name and ID) may appear multiple
times in this list if it is a child of multiple groups.
Once the list is complete, you can select resources in the Results list and take actions,
depending on how you initiated the Find function. The buttons at the bottom of the
window are slightly different depending on where you initiated the Find. See the
following sections, “Searching from the Main Toolbar,” and “Searching from the Add
Resources or Add Relationship Window” on page 262, for details on how you can use
the results of the search.
EPICenter Software Installation and User Guide
261
The Grouping Manager
Searching from the Main Toolbar
When you initiate a search from the Main Toolbar, you can use the results to determine
where a resource is used—i.e. to find out what groups it belongs to. Since a resource
can be a child of multiple groups, this lets you identify all the parents of a particular
resource. In particular, before you delete a resource from the EPICenter database, you
may want to make sure that you know all the places it is being used to avoid problems
when you remove it. Once you find a resource using the Find function from the main
toolbar, you can remove instances of the resource directly from the Find window.
Setting up a search is the same regardless of where you initiate the Find function. This
is describe in the section “Setting up a Resource Search” on page 258.
To remove resources you have identified with the Search function, do the following:
1 Select and highlight the resource or resources you want to remove.
You can double-click on the resource and its location is highlighted in the
Component Tree.
2 Click the Remove button to remove those resources from the locations specified in
the Results entries you’ve selected.
The results list may present multiple entries for a given resource, if the resource is a
child of multiple groups. You can remove a resource from specific groups on an
individual basis without removing it from the EPICenter database.
The Remove function is subject to the same restrictions as removing resource children
through the Resource Details window. If the resource is a system or imported resource
(its source is EPICenter, a file, LDAP database etc.) you cannot remove the resource
from it’s “home” group—the group in which it was initially created. If the function is a
user-defined resource (source is “Manual”), removing it from all groups will delete it
from the EPICenter database.
When you are finished, click the OK button to close the window.
Searching from the Add Resources or Add Relationship
Window
When you initiate a search from the Add Resources or Add Relationship window, you
can identify resources with a common set of attributes, which can simplify the process
of finding the attributes you want to include in a group. Once you find a set of resource
using the Find function from the Add Resources or Add Relationship windows, you can
262
EPICenter Software Installation and User Guide
Importing Resources
add those resources directly from the Find window to the Resource Results list of the
“Add...” window.
Setting up a search is the same regardless of where you initiate the Find function. This
is describe in the section “Setting up a Resource Search” on page 258.
NOTE
When you do a search from the Add Resources or Add Relationship windows, the
results will include only those resources that are relevant to the Add function you are
performing.
To add resources you have identified with the Search function to the Resource Results
list of the Add Resources or Add Relationship windows, do the following:
1 Select and highlight the resource or resources you want to add.
2 Click the Add button to add those resources to the Resource Results list.
The selected resources are added to the list, and the Search window is closed.
To close the Search window without adding any resources, click the Cancel button.
Importing Resources
The Import feature allows you to import user and host resource definitions, and groups
containing those resources, from a source external to the EPICenter system. You can
import from an NT Domain server, an NIS server, or an LDAP directory. You can also
import host and user resource definitions from a tab-delimited text file.
• Importing from a text file requires a tab-delimited file in a very specific format.
• Importing from an LDAP directory requires an import specification file that defines
how to map entries in the LDAP directory to resources and their attributes.
• Importing default domain information from an NT Domain server or an NIS server
does not require any special preparation.
NOTE
If you import information from an LDAP server or NT Domain Controller, that information
will become visible to all EPICenter users. If this is a security concern, you may want to
consider exporting information from the NT Domain Controller or LDAP directory to a
EPICenter Software Installation and User Guide
263
The Grouping Manager
file, and using that to create an import file that contains only the information that you
want to be visible through EPICenter Grouping Manager.
Imported resources are placed under a group created in the Import Sources group (one
of the pre-defined EPICenter groups). The name you specify in the Source Name field of
the Import dialog will be used as the group name.
You can perform the same import operation (importing from the same source) multiple
times. Once an import is complete, subsequent imports from the same source will act as
an update:
• Existing resources will be left intact (including any attributes you may have added).
• New resources will be added.
• Resources that have been removed from the source will be deleted from the
EPICenter database.
• Changes is group memberships and changes in relationships will be enacted.
To import resources from an external source, do the following:
1 Click the Import button in the toolbar at the top of the main Grouping Manager
window. The Import Resources window is displayed (see Figure 80).
Figure 80: Importing resources
2 Select the type of source from which you want to import information.
— Select NT Domain Controller/NIS to import information from the default
Windows NT Domain Controller or NIS server. This will import information
about users, hosts (stations), and user groups. See “Importing from an NT
Domain Controller or NIS Server” on page 272 for more detailed information.
— Select LDAP to import information from an LDAP directory.
264
EPICenter Software Installation and User Guide
Importing Resources
See “Importing from an LDAP Directory” on page 266 for information on
modifying the file containing the LDAP import mapping specification.
— Select File to import information from a tab-delimited text file.
See “Importing from a File” on page 268 for information on creating the import
text file.
— In the Source Name field, enter a name that will identify the source of the
imported resources. This name is used for two purposes:
• It is used to create a group under which all the resources imported in this
operation are placed. The group is created under the Import Sources group.
• It appears in the Source field of the Resource Details view, or in the Source
column when the resource is displayed as a child of group, for all resources
imported from this source. It can be used as a search criteria in the Find
function.
3 Click Import to begin the import process. The import button will not be enabled
until you enter a source name.
Progress during the import will be displayed in a pop-up window, as shown in
Figure 81.
Figure 81: Monitoring the progress of an Import function
4 When the process has completed, click OK.
If you are importing from a large source, the import process can take several
minutes.
EPICenter Software Installation and User Guide
265
The Grouping Manager
The new group and resources will be available under the Import Sources group in
the Component Tree.
If errors occur in the import process, it is possible that no data will be imported. This
can result in an empty import group in the Import Sources tree. Once you fix the
problems, you can rerun the import.
Importing from an LDAP Directory
The EPICenter Grouping Manager supports importing groups, users, and hosts from a
LDAP directory. The import process uses a TCL script to extract the requested data
from the LDAP directory, and create a text file that specifies how the resources should
be added to the EPICenter database. This file is in the same format as the import file
discussed in “Importing from a File” on page 268.
The import process uses an import specification file that defines the following:
• The information you want to extract from the directory.
• How to map that data to groups, resources, and attributes in the EPICenter
Grouping module.
The specification file must be named LDAPConfig.txt, and must reside in the
EPICenter user/import directory.
You can use the LDAPConfig.txt file provided in the EPICenter user/import directory
as a template.
You should only need to modify three lines in this file:
host: the name of the host where the directory resides.
user: the username, if required, to allow access to the directory.
password: the password, if required, to allow access to the directory.
NOTE
The information below is provided as an aid to importing data from LDAP directories
with schemas that differ from the template provided. However, Extreme Networks
cannot provide support for modifications to the template file other than the three
changes mentioned above.
266
EPICenter Software Installation and User Guide
Importing Resources
If your LDAP directory is organized differently, you can modify the LDAPConfig.txt
file to meet your individual needs. This requires that you understand the organizational
structure of the directory from which you want to import data.
The LDAPConfig.txt file must include the following entries:
base: specifies the LDAP naming context. Leave this blank to use the default LDAP
naming context. This is required.
attributes: specifies the attributes that you want to import into the EPICenter
database from entries in the LDAP directory. By default, all imported attributes are
considered type Generic.You can specify an EPICenter attribute type (Generic,
IP/subnet, or DLCS ID) by enclosing both the attribute name and the EPICenter
attribute type in curly brackets, as shown: {uid {DLCS ID}}. This is required.
uniqueID: specifies the attribute that should be used in the EPICenter database as
the ID for this resource. This is required.
scope: the scope of the search (base, sub, one). This is required.
groupBy: the attribute that should be used to create EPICenter sub-groups within
the imported group structure. This is optional.
memberNameAttribute: the attribute that should be used to define the child entry in
a group.
resourceName: the attribute that should be used as the displayed name of the
resource within the EPICenter Grouping Manager. This is required.
filterList: defines the search criteria. Because of the limits on the amount of data
that a search will return in one operation, you may need to split your search into
multiple operations, as is done in the example file. This is required.
objectClassMapping: this maps an LDAP entry to a Grouping Manager resource
type based on the object class of the entry. You will need multiple entries of this
type. The name-value pair contains the EPICenter resource type on the left, and
either the LDAP object class specification or an EPICenter resource type of the right.
For example, the following line specifies that entries whose object class is
“organizationalPerson” should be imported as user resources.
objectClassMapping: user=organizationalPerson person Top
The following line specifies that user resources can be group members.
objectClassMapping: groupmember=user
At least one mapping specification is required. You can comment out resource types
that you don’t need to use in the sample file, or leave them. They will be ignored if
not defined.
EPICenter Software Installation and User Guide
267
The Grouping Manager
Importing from a File
To import data from a text file, you define the resources you want to import in a
tab-delimited text file. The elements on each line are separated by tabs.
The Import File Format
The simplest way to create this file is to enter it in a spreadsheet program such as
Microsoft Excel, and then export it as tab-delimited text.
The elements on each line are separated by tabs.
Format Definitions.
The first three lines are required. They define the format of the data that follows. The
first three lines are:
#SYNTAX VERSION:1.0
Resource_UniqueName <tab> Resource_Type <tab> Resource_Name [<tab> attribute ... ]
<tab> <tab> <tab> (<attribute_type>)[<tab> (<attribute_type>)...]
The first line simply defines the version of the import syntax:
#SYNTAX VERSION:1.0
Enter this exactly as specified.
The second line defines the mapping of the data in the file to EPICenter resources:
Resource_UniqueName <tab> Resource_Type <tab> Resource_Name [<tab> attribute ... ]
• The first three items are required,
— Resource_UniqueName specifies that the first field maps to the unique ID.
— Resource_Type specifies that the second field defines the resource type (user,
host, group, device, or port).
— ResourceName specifies that the third field maps to the resource name. This is the
name that will appear as the name of the resource in the Grouping Manager.
• The remaining items on the line define the attributes that can be included for each
resource. The names you specify here will be used as the attribute names in the
Grouping Manager.
The third line defines the type of each attribute (Generic, IP/subnet, or DLCS ID).
<tab> <tab> <tab> (<attribute_type>)[<tab> (<attribute_type>)...]
268
EPICenter Software Installation and User Guide
Importing Resources
Each type specifier must be enclosed by parenthesis, and separated from the preceding
type specifier by a tab. Three tabs must precede the first type specifier.
• The items in this line define the type of each attribute defined in line two. You must
include a type specification for every attribute included in line two.
• The first three items in line two do not require a type (as they are predefined). You
skip these by including the three tabs before the first type specifier.
Resource Definitions.
The remaining lines in the first section define the resources to be imported. Each
resource must include the uniqueID, the resource type, and a name. Attribute values are
optional, and will be assigned in the order presented on the line (separated by tabs).
These lines are formatted as follows:
uniqueID1 <tab> <resource_type> <tab> resource_name1 <tab> {attribute <tab> ... }
uniqueID2 <tab> <resource_type> <tab> resource_name2 <tab> {attribute <tab> ... }
...
uniqueIDn <tab> <resource_type> <tab> resource_nameN <tab> {attribute <tab> ... }
• uniqueID will be used as the resource’s unique name. It can be the same or different
from the resource name. For a device, the uniqueID must be the device IP address.
For a port it is the IP address of the device followed by the port number.
• resource_type can be user, host, group, device, or port.
• resource_name is the name that will be displayed as the name of the resource.
• attribute defines the value of the attribute that corresponds to this position in the
list.
The combination of uniqueID and resource_type must be unique within this section.
Duplicate definitions generate a warning.
For example, assume the following format definition at the beginning of the import file:
Resource_UniqueName Resource_Type Resource_Name
Location Department RoomNo
To create a user resource named Judy Jones, with three attributes:
— Location, whose value is Denver
— Department, whose value is Sales
— RoomNo whose value is 3050
EPICenter Software Installation and User Guide
269
The Grouping Manager
Enter a resource definition as follows:
judy user
Judy Jones
Denver
Sales
3050
You cannot use the Import function to create new device or port resources. You can
import attributes for device and port resources, and define relationships for them. The
device and port resources must already exist in the EPICenter database, and the names
you specify must match their names in the database.
See “Resource Details” on page 240 for more information on the components of a
resource.
Group and Relationship Definitions.
The second part of the file defines the relationships between the resources—both group
membership and relationships between the resources themselves (see “Adding
Relationships to a Resource” on page 250 for more information about relationships).
The #GROUPS# specification is required, even if you do not define any groups.
#GROUPS#
Each line in this section has the following form:
<resource_type>:<resource_uniqueID> <tab> <resource_type>:<resource_uniqueID>
<resource_type>:<resource_uniqueID> <tab> <resource_type>:<resource_uniqueID>
• resource_type can be user, host, group, device, or port. A group that exists in
the EPICenter database (and is not defined in the import file) can be specified as a
child of an imported group, but the reverse is not supported.
• resource_uniqueID is the unique ID defined in the first part of the file (or known to
exist already in the EPICenter database).
For creating group membership relationships, the first type:ID pair defines the parent,
the second one defines the child. Thus, the first pair must always be a group. The
second pair can be a group or an individual resource.
For defining peer-to-peer relationships, (user-host, user-port, and host-port
relationships) either member of the relationship can be specified first.
Example
The following is an example of an import file.
#SYNTAX VERSION:1.0
270
EPICenter Software Installation and User Guide
Importing Resources
Resource_UniqueNameResource_TypeResource_Name IP Address DLCS OSType
Dept
(IP/Subnet)(DLCS ID)(Generic)(Generic)
wendy
user
Wendy Lee
NMS
heidi
user
Heidi Smith
NMS
pam
user
Pam Johnson
SQA
eric
user
Eric Wilson
SQA
mary
user
Mary Baker
NMS
win2k
host1
host2
host3
host4
host
host
host
host
host
win2k
host1
host2
host3
host4
ugr1
ugr2
hgr1
dgr1
switch
portgr
group
group
group
group
group
group
SQA
dev
hostgr1
eng1
switch
portgr
#GROUPS#
group:ugr1
group:ugr1
group:ugr1
user:wendy
user:heidi
user:mary
group:ugr2
group:ugr2
user:pam
user:eric
group:hgr1
group:hgr1
group:hgr1
host:win2k
host:host1
host:host2
group:dgr1
group:dgr1
host:host3
host:host4
10.20.30.2
10.20.30.4
10.20.30.5
10.20.30.6
10.20.30.7
wlee
windows
HPUX
Solaris
windows
Solaris
NMS
NMS
NMS
SQA
SQA
## Host to User Relation
user:wendy
host:win2k
user:heidi
host:host1
user:mary
host:host2
host:host3
user:pam
host:host4
user:eric
EPICenter Software Installation and User Guide
271
The Grouping Manager
Importing from an NT Domain Controller or NIS Server
Importing from an NT Domain Controller or NIS server is straightforward. The import
is always done from the Domain Controller or NIS server that is serving the domain for
the system running the EPICenter server. The type of system you are running will
determine where the EPICenter server looks for the information.
In order to import information from an NT Domain Controller, the EPICenter server
must be running with the appropriate user permissions in order to extract the
information from the Domain Controller.
NOTE
If you import information from an NT Domain Controller, that information will become
visible to all EPICenter user. If this is a security concern, you may want to consider
exporting information from the NT Domain Controller to a file, and using that to create
an import file that contains only the information that you want to be visible through
EPICenter Grouping Manager.
The import process imports the following information:
• For users: username, fullname, description.
• For hosts: hostname, description, Primary IP address.
• For groups (users only): name, description, usernames of members.
The import process creates a file, import.txt, in the user/import subdirectory.
272
EPICenter Software Installation and User Guide
9
Using the IP/MAC Address Finder
This chapter describes how to use the IP/MAC Address Finder applet for:
• Creating search requests for locating specific MAC or IP addresses on the network,
and determining the devices and ports where they are located.
• Creating search requests to identify MAC and IP addresses on specific devices and
ports.
Overview of the IP/MAC Finder Applet
Using the IP/MAC Address Finder applet you can specify a set of Media Access
Control (MAC) or Internet Protocol (IP) network addresses, and a set of network
devices to query for those addresses. The applet returns a list of the devices and ports
associated with those addresses. You can also specify a set of devices and ports, and
search for all MAC and IP addresses known to those devices and ports.
The Search Tool lets you configure and start a search task, view the status of the task,
and view the task results. The task specification and results are kept in the task list until
you delete them, or until you log out of the EPICenter client.
When you click the Find IP/MAC button in the Navigation Toolbar, the main IP/MAC
Address Finder page is displayed as shown in Figure 82. Initially there are no search
requests displayed.
EPICenter Software Installation and User Guide
273
Using the IP/MAC Address Finder
Figure 82: IP/MAC Address Finder main page
ExtremeWare Software Requirements
The IP/MAC AddressFinder applet requires certain versions of ExtremeWare to be
running on your Extreme Networks switch in order to retrieve data from an IP address
or MAC address search task.
Table 6 lists versions of ExtremeWare and whether or not they are currently supported
by the IP/MAC address applet.
Table 6: ExtremeWare Requirements for Using the IP/MAC Address Applet
ExtremeWare Version
Requirements
2.x through 6.1.4
Fully supported using the dot1dTpFdbTable.
6.1.5
Not supported.
274
EPICenter Software Installation and User Guide
Tasks List Summary Window
Table 6: ExtremeWare Requirements for Using the IP/MAC Address Applet (continued)
ExtremeWare Version
Requirements
6.1.6 through 6.1.9
Supported using the using the dot1dTpFdbTable. Use
the enable snmp dot1dTpFdbTable command to
enable the dot1dTpFdbTable on the switch.
6.2 and above
Fully supported using a private MIB.
Tasks List Summary Window
As search tasks are initiated, they are placed in the Find Address Tasks List in the
Component Tree. Selecting the Find Address Tasks folder in the Component Tree
displays a summary of the status of the tasks in the Task List (see Figure 83).
Figure 83: Tasks List summary
The Tasks List shows you basic information about the tasks you set up
EPICenter Software Installation and User Guide
275
Using the IP/MAC Address Finder
• ID is automatically assigned by the EPICenter server
• Name is the name you gave the task when you created it. Giving a task a unique
name is important to distinguish it from other tasks in the Tasks List
• Type is the type of search this will perform. In EPICenter release 4.0, this is always
Find Addresses
• Status shows the status of the request
• Date Submitted shows the date and time the task was submitted
• Date Completed shows the date and time the task was finished
From the Tasks List you can perform the following functions:
• Select a Pending task and click Cancel to cancel the task before it has completed
• Select a task and click Delete to delete an individual task. This deletes the task
specification as well as the task results. Once a task has completed, it cannot be
rerun unless it is the most recent task completed
• Select a task and click ReRun to execute the task again
• Select a task and click Clone to bring up the Find Addresses window with the
specifications of the selected task already displayed
• Select a task and click Export to export the task details to a text file. See “Exporting
Task Results to a Text File” on page 282 for more information.
• Select a task and click Export Local to export the task details locally to a text file on
your client system. You can only use this feature if you are running the stand-alone
client on your local system. If you are using the browser-based client, this button
will be greyed out. See “Exporting Task Results to a Text File” on page 282 for more
information.
NOTE
The specified tasks and their search results persist as long as you are running the
EPICenter client, even if you leave the IP/MAC Address Finder applet and go to another
EPICenter applet. However, when you exit the EPICenter client, all the task
specifications and search results are deleted.
276
EPICenter Software Installation and User Guide
Creating a Search Task
Creating a Search Task
To create a search task, click the Find button
in the tool bar at the top of the
IP/MAC Address Finder page. This displays the Find IP and MAC Addresses window
(Figure 84).
NOTE
If you have already submitted a task, the most recent task with its specifications is
displayed in the Find Addresses window.
Figure 84: Find IP and MAC Addresses window
EPICenter Software Installation and User Guide
277
Using the IP/MAC Address Finder
To create a search task:
1 Enter the task name in the Task Name field. This name helps you identify the task in
the Find Address Tasks List. Names of the form Task1, Task2 and so on are provided
by default.
2 Define the search targets: in the Enter an Address group box, select either IP or
MAC to determine the format of the address to search for, and enter the address into
the fields provided. Click the Add Address button to add the address to the
Addresses to Find list.
— To find all addresses in the given search domain, click All in the Enter an
Address group box, then click the Add Address button to add All to the to
Addresses to Find list
Note that All is added to the search list in addition to any individually-specified
addresses. The All specification does overlap with the other target addresses.
However, this allows the user to remove the All specification without losing the
other addresses in the search list.
— Click the WildCard button to search for a MAC address defined only by the first
three hexadecimal tuples.
The first three hexadecimal tuples in a MAC address are assigned to vendors,
such as Extreme Networks, and they are vendor specific. The wildcard feature
allows you to find all MAC addresses coming from a particular vendor.
— Click the Remove Address button to remove an address from the list
3 Define the search domain. The Target Domains list specifies the scope of the devices
to be included in the search. Devices not included in this domain will not be
searched.
You can define the search space in several ways:
— Devices lets you select individual devices to include in the search
— Device Groups lets you search all the devices in a specified device group
— Ports lets you select individual ports to include in the search
— PortGroups lets you search all the devices in a specified port group
You can create a target domain that includes a combination of these specifications.
NOTE
The IP/MAC Finder applet does not support hierarchical port groups. If you have
created port groups in the Grouping Manager that include subgroups as members,
the subgroups will not appear in the Target Domains list. Instead, any ports that are
278
EPICenter Software Installation and User Guide
Creating a Search Task
members of subgroups will be displayed directly under the top-level port group, as if
they are members of the top-level group.
4 If you select Devices or Ports as the Source Type, you must also select a Device
Group from the Select Group field to define the list of devices that will appear in
the Devices list. If you select Domains or PortGroups, this field well be inactive.
5 Select the Device, Port, Device Group, or Port Group that you want to search and
click the Add button to move it into the Target Domains list.
To remove a member of the Target Domains list, select the item in the list and click
Remove. To clear the Target Domains list, click Remove All.
6 Define the search type. From the Search Type field, select Network to perform a
search from the network or DataBase to perform a search from the EPICenter
database using the collected edge port information.
If you perform a network search, EPICenter reports unreachable devices. If you
perform an EPICenter database search, EPICenter does not report unreachable
devices.
7 When you have completed your search specification, click the Submit button at the
bottom of the window to initiate the search.
The IP/MAC Finder applet searches the IP Address Translation Table (the
ipNetToMediaTable) in each device agent for IP addresses, and the Forwarding
Database (FDB) for MAC addresses.
NOTE
The IP/MAC Finder applet will not identify a device’s own IP address when you search
for IP addresses on that device. In other words, the applet will not find IP address
10.2.3.4 on the switch whose address is 10.2.3.4. It can only find addresses that are in
the agent’s IP Address Translation table, and a device’s own address is not included in
the table. The applet will find the address on the other switches that have connectivity
to the switch with the target IP address, however.
NOTE
Each search task can return a maximum of 2,000 MAC address entries. If a search
returns more than 2,000 entries, a warning message is displayed in the status window.
If you see a warning message, add additional search constraints to reduce the number
of returned MAC addresses to less than 2,000.
EPICenter Software Installation and User Guide
279
Using the IP/MAC Address Finder
Detailed Task View
When you initiate a search, the task is placed in the Find Address Tasks list in the
Component Tree. The main panel displays the Detailed Task View for the current search
task (see Figure 85).
Figure 85: Search in progress
While the task is in progress, the window shows the status as Pending. When the
search is complete, the Detailed Task View shows the results for the search (Figure 86).
280
EPICenter Software Installation and User Guide
Detailed Task View
Figure 86: Address search results in the Detailed Task view
The Detailed Task View shows the following information about your search.
• Task Name is the name you gave the task when you created it. Giving a task a
unique name is important to distinguish it from other tasks in the Tasks List
• Status shows the status of the request
• Submitted shows the date and time the task was submitted
• Completed shows the data and time the task was finished
The Search Criteria areas shows:
• The list of IP or MAC addresses that were the object of the search
• The Search Domains where the search took place. The Search Domains lists shows
the name and type (Device or Group) of the components of the domain specification
The Search Results list shows the results of the search. For every address successfully
located, this list shows:
EPICenter Software Installation and User Guide
281
Using the IP/MAC Address Finder
• Both the MAC address and the corresponding IP address.
• The switch and port to which the address is connected.
• The User (name) currently logged in at that address.
Once the search is complete, the search results will stay in the Tasks List until you
explicitly delete them using the Delete Function from the Tasks List Summary View, or
until you exit the EPICenter client.
From the Task Detail window you can do the following:
• Click Delete to delete this task. This deletes the task specification as well as the task
results.
• Click ReRun to execute the task again.
• Click Clone to bring up the Find Addresses window with the specifications of the
selected task already displayed.
• Click Export to export task search results to a text file on the server machine. See
“Exporting Task Results to a Text File” on page 282 for more information.
• Click Export Local to export task search results locally to a text file on your client
system. You can only use this feature if you are running the stand-alone client on
your local system. If you are using the browser-based client, this button will be
greyed out. See “Exporting Task Results to a Text File” on page 282 for more
information.
Exporting Task Results to a Text File
You can export a task’s detail results or search results to a text file. You can do this from
the Tasks List.
To export the detail or search results to a file, do the following:
1 From the Detailed Task View, click the Export button if you are running the
browser-based client. Click the Export Local button if you are running the
stand-alone client and you want to save the file locally.
If you select Export, the Export pop-up dialog is displayed.
If you select Export Local, the Save dialog is displayed.
2 Enter a file name and subdirectory name in the fields provided.
If you select Export:
282
EPICenter Software Installation and User Guide
Detailed Task View
— Detail and search result files for a task are saved in the EPICenter
user/AddressFinderResults directory, which is a subdirectory of the
EPICenter installation directory. You can optionally specify a subdirectory within
the AddressFinderResults directory by entering the subdirectory name into the
Directory field.
— By default, a search result exported file will be given a name created from the
current date, time, and task name. For example, the results for task “Task 2” run
on April 25, 2001 at 3:52 pm will be saved in a file named 2001_4_25_1552_Task
2.txt. You can change the file name by replacing the name in the File Name
field.
If you select Export Local:
— Detail and search result files for a task are saved by default in the
WINNT\Profiles\user directory on Windows systems or your local home
directory on Solaris systems. You can also choose to save the file in a different
location in the Save dialog.
3 Click the Apply button to save the results.
Click Reset to clear all the fields.
Click Close to close the dialog without saving the file.
EPICenter Software Installation and User Guide
283
Using the IP/MAC Address Finder
284
EPICenter Software Installation and User Guide
10 Using ExtremeView
This chapter describes how to use ExtremeView for:
• Viewing Extreme and third-party device status.
• Viewing and setting Extreme device configuration information using the
ExtremeWare Vista graphical user interface.
• Viewing Extreme device statistics using the ExtremeWare Vista graphical user
interface.
Overview of the ExtremeView Application
The ExtremeView applet displays information about the status of Extreme switches
(Summit, Alpine, and Black Diamond switches) and third-party devices managed by
EPICenter. Any EPICenter user can view status information about these network
devices. Users with Administrator or Manager access can view and modify
configuration information for those switches through the ExtremeWare Vista graphical
user interface.
ExtremeWare Vista is device management software running in a Summit, Alpine, or
Black Diamond switch. It allows you to access the switch over a TCP/IP network using
a standard Web browser, and provides a set of pages for configuring and monitoring
the Summit or Black Diamond switch.
EPICenter Software Installation and User Guide
285
Using ExtremeView
NOTE
You must have a user account on the Extreme switch to run ExtremeWare Vista on the
switch. A user account on a switch is separate from an EPICenter user account.
When you click the EView button in the Navigation Toolbar, the main ExtremeView
page appears as shown in Figure 87.
Figure 87: The ExtremeView applet, main page
Use the tabs in the Component status/detail panel as follows:
• Status displays status information for the devices known to EPICenter. You can view
summary status for the devices within a device group. You can view status and
configuration information for individual devices, slots, and ports through a front
panel view accompanied by a table of configuration and status information. Select a
286
EPICenter Software Installation and User Guide
Viewing Device Status Information
device subnode under a Device Group name node to view configuration information
for the device.
• Configuration displays configuration information for Extreme Networks switches
based on the configuration categories in ExtremeWare Vista. You can view summary
configuration information for all devices in a device group known to EPICenter, as
well as detailed configuration information for individual Extreme Networks
switches, organized by ExtremeWare Vista configuration categories. Individual
third-party devices cannot be accessed through this feature.
• Statistics displays monitoring results for Extreme Networks switches, also based on
ExtremeWare Vista statistics monitoring categories. You can view summary statistics
that include active and inactive port counters for all Extreme Networks devices—in a
specific device group—known to EPICenter, or statistics for individual Extreme
Networks switches. Individual third-party devices cannot be accessed through this
feature.
Viewing Device Status Information
Select the Status tab in the ExtremeView applet to display the Status window. The
Status window displays a summary of all of the device groups known to EPICenter, as
shown in Figure 88.
EPICenter Software Installation and User Guide
287
Using ExtremeView
Figure 88: The ExtremeView applet, Status window
To show summary status for the devices in a Device Group, select a Device Group name
from the Component Tree on the left (see Figure 89).
288
EPICenter Software Installation and User Guide
Viewing Device Status Information
Figure 89: The ExtremeView applet, device group status
The following status information is displayed:
• The status “lights” show the status of the device as detected by EPICenter.
Table 7: ExtremeView Device Status Indicators
Status Light
Green
Yellow
Red
Device Status
Device is up and OK
Device is responding, but reports an error condition such as a fan or
power supply failure, or excessive temperature
Device is not responding to EPICenter status queries. This may mean
that the switch is down, that it is unreachable on the network, or that
the SNMP community strings have changed and EPICenter can no
longer contact the switch.
EPICenter Software Installation and User Guide
289
Using ExtremeView
• The name, type of switch, IP address, the ExtremeWare software version, and the last
reboot time are retrieved from the device by EPICenter.
Select a device in the Component Tree on the left to display detailed configuration and
status information, as shown in Figure 90. This display shows additional information
that EPICenter has gathered from the switch agent.
Figure 90: The ExtremeView applet, switch status
This view shows an active graphical display of the switch front panel, as well as a panel
of status information.
You can view the status of individual modules (slots), ports, and power supplies (where
shown), as shown in Figure 91, in two ways:
• Select the slot, port, or power supply by clicking the cursor on the item in the switch
image.
290
EPICenter Software Installation and User Guide
Viewing Device Status Information
• Display the list of slots or ports in the Component Tree, and select the element about
which you want status information.
NOTE
The Component Tree does not display the empty slots in a device.
Figure 91: The ExtremeView applet, port status
Selected port
The right-hand panel displays status information about the selected port
There are a few Extreme devices, such as the Summit24e2T, Summit24e2X, and Summit
Px1 switches, on which the ports are not selectable through ExtremeView. In these cases,
the ifIndex entries for the device are displayed in the Device Information panel on the
right.
EPICenter Software Installation and User Guide
291
Using ExtremeView
Third-party Device Status
If the device you select is a third-party device, and EPICenter does not have an image
for the specific model, it displays a generic device image (a vendor-specific image if
possible, but without model-specific details). If there is no configuration file for the
device, and it is being managed by the EPICenter, the ifIndex entries for the entire
device are displayed in the Device Information panel on the right. Figure 92 shows a
third-party device with an unknown configuration.
Figure 92: A third-party device with unknown configuration
The port type is ethernet-csmacd(6) by default. However, some devices may support
other port types. For example, some 3Com devices support a layer 3 module which is of
type other(1).
As Extreme Networks continues to develop additional device images, they will be made
available on Extreme Networks’ support web site at:
www.extremenetworks.com/support/Patches.asp
292
EPICenter Software Installation and User Guide
Viewing Switch Configuration Information
under the Patches section. You can also contact your Extreme Networks sales
representative or reseller if you would like help from Extreme’s Professional Services
organization for creating images or configuration files for specific devices.
Viewing Switch Configuration Information
Select the Configuration tab in the ExtremeView applet to display the Configuration
window. The Configuration window displays a summary of all of the device groups
known to EPICenter, as shown in Figure 93.
Figure 93: The ExtremeView applet, Configuration window
To show a configuration summary for the Extreme Networks switches in a device
group, select a device group name from the Component Tree on the left (see Figure 94).
EPICenter Software Installation and User Guide
293
Using ExtremeView
Figure 94: The ExtremeView applet, Configuration summary
The sub-components under the device group name in the Component Tree are the
devices that are members of the device group. Select a device, slot, or port from the
Component Tree on the left to display the categories of configuration information that
are available through this applet for the selected device, as shown in Figure 95.
294
EPICenter Software Installation and User Guide
Viewing Switch Configuration Information
Figure 95: The ExtremeView applet, ExtremeWare Vista summary
The categories in the Configuration window correspond to pages from the ExtremeWare
Vista application running on the switch. Select one of the categories to view the
configuration settings for that switch in the category you have chosen.
As shown in Figure 96, this displays the current switch configuration, and provides an
interface through which you can change the configuration.
EPICenter Software Installation and User Guide
295
Using ExtremeView
Figure 96: The ExtremeView applet, Configuration details
Enter your changes directly into the editable fields in the configuration display. When
you have made the necessary configuration changes, click Submit to send these to the
switch for implementation.
296
EPICenter Software Installation and User Guide
Viewing Switch Statistics
Viewing Switch Statistics
Select the Statistics tab in the ExtremeView applet to display the Statistics window. The
Statistics window displays a summary of all of the device groups known to EPICenter,
as shown in Figure 97.
Figure 97: The ExtremeView applet, Statistics window
To show summary statistics for Extreme switches in a device group, select a device
group name from the Component Tree on the left (see Figure 98).
EPICenter Software Installation and User Guide
297
Using ExtremeView
Figure 98: The ExtremeView applet, device group statistics
The sub-components under the device group name in the Component Tree are the
devices that are members of the device group. Select a device from the Component Tree
on the left to display the categories of statistical information that are available through
this applet for the selected device, as shown in Figure 99.
298
EPICenter Software Installation and User Guide
Viewing Switch Statistics
Figure 99: The ExtremeView applet, ExtremeWare Vista statistics
The categories in the Statistics window correspond to pages of information from the
ExtremeWare Vista application running on the switch. Select one of these categories to
to view the configuration settings for that switch in the category you have chosen.
This displays the selected set of statistics for the selected switch. For some types of
statistics, you may be able to view the data in different ways through the use of view
options or filters, such as the options shown in Figure 100.
EPICenter Software Installation and User Guide
299
Using ExtremeView
Figure 100: The ExtremeView applet, Statistics details
Finding Devices
You can search for a device in the EPICenter database by name, by IP address, or by
type of device. This may be useful if you have a large number of devices in your
inventory.
To search for a device, follow these steps:
1 Click Find at the top of the ExtremeView applet page.
2 Enter your search criteria:
You can search for devices by name or by IP address. You can limit the search to a
specific domain, or to a specific type of Extreme device. Search criteria can include:
— A device name. Click the Device Name button, and enter a complete or partial
name in the Search: field.
300
EPICenter Software Installation and User Guide
Viewing Device Information from Pop-up Menus
— An IP address. Click the IP Address button and enter a complete or partial IP
address in the Search: field. You can use the wild card characters * or ? in your
search criteria.
* acts as a wildcard for an entire octet (0-255)
? is a wildcard for a single digit (0-9)
— A domain. Select the domain from the drop-down menu in the domain field. If
you do not specify a name or IP address in the Search field, all devices in the
domain you select will be found.
— A device type. Select the device type from the drop-down menu in the type field.
If you do not specify a name or IP address in the Search field, all devices of the
type you select will be found.
3 Click Find to search for devices that meet the criteria you have specified. All devices
found are listed in the center panel. Information includes the domain in which the
device can be found, its name, IP address, and the type of device.
4 Double-click on a device in the results table to highlight the device in the
Component Tree, or select a device in the results table and click OK, to display the
associated front panel view and status information for that device (see “Viewing
Device Status Information” on page 287). If you click OK, the search window will
close.
5 Click New Search to clear all search criteria.
6 Click Cancel to close the search window.
Viewing Device Information from Pop-up Menus
You can select a device group, a device, a slot, or a port in the Component Tree, then
right-click to display a pop-up menu that contains the Properties command. The
Properties command displays the attributes for a specific device group, device, slot, or
port. The device pop-up menu also contains the Alarms, Browse, Statistics, Telnet, and
VLANs commands. All of these commands perform the same functions as the applets
in the Navigation Toolbar to the left of the page, but with the appropriate device
displayed.
Properties
The Properties function lets you view the attributes for a selected device group, device,
slot, or port.
EPICenter Software Installation and User Guide
301
Using ExtremeView
Device Group
To view the Properties display for all device groups:
• Right-click on the Device Groups component, then select Properties from the pop-up
menu that appears
The Device Groups Properties window appears and displays the number of device
groups and the names of the device groups that are known to EPICenter.
To view the Properties display for a selected device group:
• Right-click on the device group, then select Properties from the pop-up menu that
appears
The Device Group Properties window appears and displays the attributes for the
selected device group.
See “Device Group Properties” on page 304” for details on using this feature.
Device
To view the Properties display for a selected device:
• Right-click on the device, then select Properties from the pop-up menu that appears
The Device Properties window appears and displays the attributes for the selected
device.
See “Device Properties” on page 305 for details on using this feature.
Slot
To view the Properties display for a selected slot:
• Right-click on the slot, then select Properties from the pop-up menu that appears
The Slot Properties window appears and displays the attributes for the selected slot.
See “Slot Properties” on page 306 for details on using this feature.
Port
To view the Properties display for a selected port:
• Right-click on the slot, then select Properties from the pop-up menu that appears
302
EPICenter Software Installation and User Guide
Viewing Device Information from Pop-up Menus
The Port Properties window appears and displays the attributes for the selected port.
See “Port Properties” on page 309 for details on using this feature.
Alarms
The Alarms function runs the EPICenter Alarm System and displays the Alarm Browser
function to show the alarms for the selected device.
To view the Alarms display for a selected device:
• Right-click on the device, then select Alarms from the pop-up menu that appears
This starts the Alarm System applet in a new window. The Alarm System displays the
Alarm Log Browser and displays the alarms for the selected device.
See Chapter 5 for details on using this feature.
Browse
The Browse function runs the ExtremeWare Vista switch management interface for the
selected device.
To run ExtremeWare Vista for a selected device:
• Right-click on the device, then select Browse from the pop-up menu that appears
This starts the ExtremeWare Vista login page in a new web browser window.
Refer to the ExtremeWare Software User Guide for details on using ExtremeWare Vista.
Statistics
The Statistics function runs the EPICenter Real-Time Statistics applet and displays port
statistics for the selected device.
To view the Device Statistics display for a selected device:
• Right-click on the device, then select Device from the pop-up menu that appears
This starts the Real-Time Statistics applet in a new window and displays port statistics
for the selected device.
EPICenter Software Installation and User Guide
303
Using ExtremeView
See Chapter 11 for details on using this feature.
Telnet
The Telnet function opens an EPICenter telnet window that is connected to the selected
device.
To open a telnet session for a selected device:
• Right-click on the device, then select Telnet from the pop-up menu that appears
This starts a telnet session for the device in a new window.
See Chapter 7 for details on using this feature.
VLANs
The VLANs function runs the EPICenter VLANs applet and displays the VLANs
currently known to the EPICenter database.
To view the VLANs for a selected device:
• Right-click on the device, then select VLANs from the pop-up menu that appears
This starts the VLAN applet in a new window and displays the VLANs currently know
to the EPICenter database.
See Chapter 13 for details on using this feature.
Displaying Properties
You can view the properties of a device group, device, slot, or port in the EPICenter
database. This section describes how to view properties through the ExtremeView
applet.
Device Group Properties
You can view summary information for all device groups, or view information about
individual device groups.
304
EPICenter Software Installation and User Guide
Displaying Properties
To view summary information for all device groups, right-click on the Device Groups
component and select Properties from the pop-up menu.
The Device Groups Properties window appears, showing the All Device Groups display.
This displays a list of the current device groups and their descriptions. For more details
about this display, see Chapter 4.
You can also view properties for a specific device group. To view properties for a
specific device group, right-click on a device group and select Properties from the
pop-up menu.
The Device Group Properties window appears, showing information about the selected
group. This includes the group description, the number of devices in the group, and a
list of the devices. For more details about this display, see Chapter 4.
Device Properties
To view properties for a device, right-click on a device in the Component Tree and
select Properties from the pop-up menu that appears.
The Device Properties window has three tabs at the top of the window:
• Device
• VLAN
• STP
Each tab displays the name of the device and a status “light” which shows the status of
the device as detected by EPICenter.
The Device Tab
The Device tab displays information about the device such as its IP address, MAC
address, and boot time. The main section of the window presents the same information
you can view in the Inventory Manager for the device. If the device is an Extreme
device, the ExtremeWare software running in the switch provides comprehensive status
information.
The VLAN Tab
The VLAN tab lists the VLANs configured on the device.
EPICenter Software Installation and User Guide
305
Using ExtremeView
The STP Tab
The STP tab lists the Spanning Tree domains (STPDs) configured on the device. There
may be more than one entry per STPD if the domain includes multiple VLANs.
For more details about the Device Properties window, see Chapter 4.
Slot Properties
To view slot properties, do the following:
1 From the Component Tree, click on the plus sign of a modular device to display the
slots for that particular device.
2 Right-click on a slot and select Properties from the pop-up menu that appears. The
Device Slot Properties window appears. The information displayed in this window
depends on whether the module requires additional software to be installed.
For modules that do not require a special version of ExtremeWare to be installed, the
Device Slot Properties window appears, as shown in Figure 101.
306
EPICenter Software Installation and User Guide
Displaying Properties
Figure 101: Device Slot Properties window for modules that do not require additional
software
For these modules, the Device Slot Properties window displays the following
information:
• Slot Name—The number, or letter, of the slot where the module is installed
• Configured Type—The type of module that is configured for the slot
• Inserted Type—The type of module that is inserted into the slot
• Module State—The operational state of the module
• Serial Number—The serial number of the module
For modules that require a special version of ExtremeWare to be installed, the Device
Slot Properties window appears, as shown in Figure 102.
EPICenter Software Installation and User Guide
307
Using ExtremeView
Figure 102: Device Slot Properties window for modules that require additional software
For these modules, the Device Slot Properties window displays the following
information:
• Slot Name—The number, or letter, of the slot where the module is installed
• Configured Type—The type of module that is configured for the slot
• Inserted Type—The type of module that is inserted into the slot
• Module State—The operational state of the module
• Serial Number—The serial number of the module
• Description—A description of the module that is inserted into the slot
• Primary Version—The primary ExtremeWare software image running on the
module
• Secondary Version—The secondary ExtremeWare software image running on the
module
308
EPICenter Software Installation and User Guide
Displaying Properties
• Current Version—The current ExtremeWare software image running on the
module
• BootROM Version—The current BootROM image running on the module
• Module Processor State—The operational state of the General Processor and the
Network Processor(s) in the module.
NOTE
The Component Tree does not display the empty slots in a device.
Port Properties
To view port properties, do the following:
1 From the Component Tree, click on the plus sign of a device.
For a non-modular device, this displays the ports for that particular device.
For a modular device, this displays the slots for that particular device. Click on the
plus sign of a slot to display the ports for that particular device.
2 Right-click on a port and select Properties from the pop-up menu that appears.
The Device Port Properties window appears, as shown in Figure 103.
EPICenter Software Installation and User Guide
309
Using ExtremeView
Figure 103: Device Port Properties window
The Device Port Properties window displays the following information:
• Port Number—The number of the port
• Configured Type—The type of port
• Media—The media for a redundant port (Primary or Redundant)
• Port Enabled—Whether the port is enabled (yes) or not enabled (no)
• Actual Speed—The speed of the port
• Actual Duplex—The duplex setting of the port (Half, Full, or None )
• Load Sharing—The load sharing state of the port (On or Off)
• Uplink Status—The uplink status of the port (Uplink or Edge port)
310
EPICenter Software Installation and User Guide
11 Real-Time Statistics
This chapter describes how to use the Real-Time Statistics applet for:
• Viewing percentage utilization or total errors data for multiple ports in an Extreme
Networks switch, a switch slot, or a port group.
• Viewing historical utilization, total errors, or individual errors data for a specific port
on an Extreme Networks switch.
Overview of Real-Time Statistics
The Real-Time Statistics feature of the EPICenter software enables you to view a
graphical presentation of utilization and error statistics for Extreme Networks switches
in real time. The data is taken from Management Information Base (MIB) objects in the
etherHistory table of the Remote Monitoring (RMON) MIB. The Real-Time Statistics
function is supported only for Extreme Networks switches.
NOTE
You must have RMON enabled on the switch in order to collect real-time statistics for
the switch.
You can view data for multiple ports on a device, device slot, or within a port group,
and optionally limit the display to the “top N” ports (where N is a number you can
configure). If you choose to view multiple ports, the display shows data for the most
EPICenter Software Installation and User Guide
311
Real-Time Statistics
recent sampling interval for the selected set of ports. The display is updated every
sampling interval.
You can also view historical statistics for a single port. If you choose to view a single
port, the display shows the value of the selected variable(s) over time, based on the
number of datapoints the MIB maintains in the etherHistory table.
You can choose from a variety of styles of charts and graphs as well as a tabular
display.
You can view the following types of data:
• Percent Utilization for each port in the set (device, port group, or single port).
Percent utilization reports the value of the etherHistoryUtilization MIB object. The
MIB defines this variable as follows:
Table 8: Definition of RMON Utilization Variable Used in Port Utilization Displays
etherHistoryUtilization
The best estimate of the mean physical layer network
utilization on this interface during this sampling
interval, graphed in percents.
• Total Errors for each port in the set (device, port group, or single port).
Total Errors is the sum of the six error variables shown in Table 9.
• Individual Errors for a single port.
An individual errors display shows the six variables shown in Table 9.
Table 9: Definition of RMON etherHistory Error Variables for Port Error Displays
312
etherHistoryCRCAlignErrors
The number of packets received during this sampling
interval that had a length between 64 and 1518
octets, inclusive (excluding framing bits but including
Frame Check Sequence (FCS) octets), but that had
either a bad FCS with an integral number of octets
(FCS Error) or a bad FCS with a non-integral number
of octets (Alignment Error).
etherHistoryUndersizePkts
The number of packets received during this sampling
interval that were less than 64 octets long (excluding
framing bits but including FCS octets) and were
otherwise well formed.
EPICenter Software Installation and User Guide
Displaying Multi-port Statistics
Table 9: Definition of RMON etherHistory Error Variables for Port Error Displays
etherHistoryOversizePkts
The number of packets received during this sampling
interval that were longer than 1518 octets (excluding
framing bits but including FCS octets) but were
otherwise well formed.
etherHistoryFragments
The total number of packets received during this
sampling interval that were less than 64 octets in
length (excluding framing bits but including FCS
octets) had either a bad Frame Check Sequence
(FCS) with an integral number of octets (FCS Error)
or a bad FCS with a non-integral number of octets
(Alignment Error).
etherHistoryJabbers
The number of packets received during this sampling
interval that were longer than 1518 octets (excluding
framing bits but including FCS octets), and had either
a bad Frame Check Sequence (FCS) with an integral
number of octets (FCS Error) or a bad FCS with a
non-integral number of octets (Alignment Error).
etherHistoryCollisions
The best estimate of the total number of collisions on
this Ethernet segment during this sampling interval.
You can choose to have the component tree show the device name only, the device
name followed by the IP address in parentheses, or the device IP address followed by
the device name in parentheses. See Chapter 16, “Real-Time Statistics” for more details
about how to display the device in the component tree.
Displaying Multi-port Statistics
When you click the RT Stats button in the Navigation Toolbar, the main Real-Time
Statistics page is displayed, as shown in Figure 104. Initially, no data is displayed—you
see a message asking you to select a device, device slot, or port group to be displayed.
The Component Tree displays the devices and port groups for which you can display
statistics. An “S” in a red circle next to a device name indicates that the device is not
responding to SNMP requests. A port group with a red-circled “S” indicates that the
port group is empty.
EPICenter Software Installation and User Guide
313
Real-Time Statistics
NOTE
The Real-Time Statistics applet does not support hierarchical port groups. If you have
created port groups in the Grouping Manager that include subgroups as members, the
subgroups will not appear in the Component Tree of the Real-Time statistics applet.
Instead, any ports that are members of subgroups will be displayed directly under the
top-level port group, as if they are members of the top-level group.
Figure 104: Real-Time Statistics main page
For an individual port, you can display individual errors in addition to utilization and
total errors.
• Select a network device to display data for some or all ports on the device.
• Select a port group to display data for all ports in the port group.
314
EPICenter Software Installation and User Guide
Displaying Multi-port Statistics
You will first see a message saying “Please wait, loading statistics data.” If the
EPICenter server is successful in accessing the data, utilization data is displayed as
shown in Figure 105.
Figure 105: Bar chart showing port statistics for a group of ports
If you place the cursor near a bar in the chart, a pop-up window shows the port
number and device, actual data value, and the time stamp on the data sample.
You can use the mouse to change the depth and rotation of a 3-dimensional chart:
• Hold down the [Shift] key, press the left mouse button, and drag the cursor left or
right to rotate the graph.
• Hold down the [Ctrl] key, press the left mouse button, and drag the cursor up or
down to set the depth of the 3-dimensional view.
For any of the bar graphs, move the cursor and then wait to see the change take effect,
which may take a few seconds.
EPICenter Software Installation and User Guide
315
Real-Time Statistics
There are cases where you may not see data for every port you expect in a multi-port
display:
• You have selected the “top N” feature (top 15 by default), so only the “N” ports with
the highest utilization or the highest total number of errors are displayed.
• RMON is disabled for some ports on the switch. If the switch as a whole can be
reached and is reporting data, then individual ports that do not report data will be
ignored. No error message appears in this case.
If the EPICenter server is not successful in loading data from the device, it displays a
message similar to that shown in Figure 106.
Figure 106: Warning displayed when the EPICenter server cannot retrieve data
There are several reasons why the EPICenter server may not be able to display any
device data:
• The EPICenter server cannot communicate with the device (indicated by an “S” in a
red circle next to the device name).
316
EPICenter Software Installation and User Guide
Displaying Statistics For a Single Port
• The device does not have RMON enabled, or RMON was just recently enabled and
no data samples exist yet.
Displaying Statistics For a Single Port
In addition to displaying data for a set of ports, you can display historical data for an
individual port. You can select a port in one of two ways:
• Double-click on the data point for an individual port in the device or port group
statistics display (bar, data point, or pie slice in the respective chart, or row in a
tabular display).
• Click on a device, device slot, or port group in the left-side Component Tree to list
the ports it contains, then select a port.
A set of utilization statistics for the selected port is displayed, as shown in Figure 107.
Figure 107: Utilization data over time for an individual port on a device
EPICenter Software Installation and User Guide
317
Real-Time Statistics
The number of data points displayed, and the sampling interval are user-configurable
parameters, within the limitations of the device configuration. The defaults are:
• A 30-second sampling interval
• 50 data points displayed
NOTE
For BlackDiamond switches, only 25 data points are displayed because that is the
maximum number of values the switch stores as historical data.
For an individual port, you can display individual errors in addition to utilization and
total errors.
• Select the tab at the bottom of the page to generate one of these displays. Figure 108
is an example.
318
EPICenter Software Installation and User Guide
Changing the Display Mode
Figure 108: Individual errors in a single-port chart
Changing the Display Mode
The icons at the top of the page let you select the format of the statistical display, and
control several other aspects of the display.
Select this to determine whether the display for a device or port group
will include all ports, or only the top N ports (where N is initially fifteen).
Click the icon to toggle between the red X, which indicates the top N
limitation is not in effect, and a green check, which indicates that the top
N ports are being displayed. The top N ports are displayed in order from
highest (largest percent utilization or largest total errors) to lowest. The number of
EPICenter Software Installation and User Guide
319
Real-Time Statistics
ports (N) is a user-configurable setting. This option is available only for multi-port
displays.
Select this to display the data as a line graph. This chart type is especially
useful when displaying individual errors for a single port.
Select this to display the data as a pie chart. This chart type is available only
when you are displaying statistics for multiple ports on a device, device slot,
or in a port group. The maximum number of slices in the pie is a
user-configurable setting. It is initially set to display 10 slices.
Select this to display the data as a bar chart. A 3D bar chart is the default for
all chart displays. The 3D setting is also a user-configurable option.
Select this to display the data as a horizontal bar chart. This chart type by
default displays in 3D. The 3D setting is also a user-configurable option.
Select this to display the data as a stacked bar chart. This chart type is only
available when you are displaying individual errors for a single port.
Select this to display the data as an area chart. This chart type by default
displays in 3D. The 3D setting is also a user-configurable option.
Select this to display the data as a table.
Select this to zoom in on (magnify) the size of the display. You can select this
repeatedly to zoom up to three times the screen size.
Select this to zoom out (shrink) the size of the display. You can select this
repeatedly until the chart is the desired size.
320
EPICenter Software Installation and User Guide
Setting Graph Preferences
Select this to display grid lines on the background of the chart.
Determines whether the graph data is updated automatically at every
sampling interval. Click on the icon to toggle between continuous updates,
and suspended updates.
Select this to take a “snapshot” of the graph or table view of the current
real-time statistics data.
Select this to bring up the graph preferences pop-up window. You can
change a variety of settings, such as graph and data colors, the sampling
interval, or the number of ports in a top N display.
Setting Graph Preferences
To change the graph settings used in this applet, click the Set Graph Preferences icon in
the toolbar.
The Graph Preferences window is displayed, as shown in Figure 109.
Use the tabs across the top of the window to select the type of setting you want to
change. Each tab displays a page with a group of related settings. When you have
changed any setting you want on a given page:
• Click Apply to put the changes into effect, but keep the Graph Preferences window
open so you can make changes on another page.
• Click OK to put the changes into effect and close the Graph Preferences window.
NOTE
The Graph preferences settings are not persistent—if you log out and close your
EPICenter Client or browser, the settings will return to the defaults.
EPICenter Software Installation and User Guide
321
Real-Time Statistics
Graph View (Figure 109) lets you change from 3D to 2D displays, and change the
values for the 3D depth, elevation and rotation.
Figure 109: Setting 3D graph preferences
• To change to a 2D graph view, click the Set 3D Graph View box to remove the check
mark.
• View Depth controls the depth of a bar. The default is 10, maximum is 1000.
• View Elevation controls the elevation (rise) from the front of the bar to the back, in
degrees. The default is 10°, range is ±45°.
• View Rotation controls the angle of rotation of the bar, in degrees. The default is 12°,
range is ±45°.
• Minimum Graphed Utilization specifies the minimum scale for the Y axis for
utilization graphs. The default is 1.0 (1%), meaning that the Y axis will not show less
than 1% as the top value of the Y axis.
• Minimum Graphed Errors specifies the minimum scale for the Y axis for error
graphs. The default is 25, meaning that the Y axis will not show less than 25 errors
as the top value of the Y axis.
322
EPICenter Software Installation and User Guide
Setting Graph Preferences
Graph Colors (Figure 110) lets you set the colors for the graph background and text
(data and axis labels).
Figure 110: Setting graph color preferences
• To change a color, click on a button with the color bar icon. This displays a color
selection window where you can select the color you want. You can select a color
using color swatches, or by specifying HSB or RGB values.
• Set Graph Background Color sets the color of the background surrounding the
graph.
• Set Graph Foreground Color sets the color of the text and bar outlines.
• Set Plot Background Color sets the color of the background behind the graph data.
Data Colors (Figure 111) lets you set the colors used for the various data sets in your
graph.
Figure 111: Setting data color preferences
EPICenter Software Installation and User Guide
323
Real-Time Statistics
• To change a color, click on a button with the color bar icon. This displays a color
selection window where you can select the color you want. You can select a color
using color swatches, or by specifying HSB or RGB values.
• Data Color 1 is the color used for Utilization and Total Error graphs.
• Data colors 1 through 6 are used for the different errors in a individual errors chart.
• Data colors in order starting from 1 are used in a pie chart, for as many slices as
you’ve specified. (If you specify more than 12 slices, the colors will repeat, with slice
13 using the same color as slice 1).
Graph Data (Figure 112) lets you set several miscellaneous graph parameters.
Figure 112: Setting other graph preferences
• Top N Display Count specifies the number of ports to include in a Top N display.
The default is 15, maximum is 100.
• Pie Slice Display Count specifies the number of slices to display in a pie chart. The
default is 10, maximum is 50.
• Historical Data Display Count specifies the number of historical data points to
display in a graph for an individual port. The default is 50, the maximum value you
can set is 100. However, the actual maximum number of data points you can get is
determined by the SNMP agent running in the device from which you are getting
data.
• Historical Data Sampling Interval is the sampling interval to use when displaying
historical data. Select a choice from the pull-down list. The choices in the list are
determined by the configuration of the device from which you are getting data.
324
EPICenter Software Installation and User Guide
Taking Graph Snapshots
Taking Graph Snapshots
The Real-Time Statistics Snapshot feature lets you take a static image of a graph or table
view of the current real-time statistics data. The snapshot generates a persistent HTML
page that is displayed in a separate window (see Figure 113).
Figure 113: Snapshot of Real-Time Statistics graph display
To take a snapshot, click the camera icon located in the toolbar at the top of the RT
Statistics applet window. The snapshot image will be displayed in a new window in the
same form (graph or table) as it was in the RT Statistics applet. Graph images reflect the
current display size and graph type (pie, bar, etc.).
From the window, the snapshot image can be saved as a file, printed, or sent by e-mail,
just as with any other HTML page.
EPICenter Software Installation and User Guide
325
Real-Time Statistics
When a graph image is displayed in the window, you can click a link below the initial
display to change the way the data is displayed:
• display table reformats the data as a table
• display graph/table displays both the graph and table formats on the same HTML
page
• display graph image displays the data as a graph, in the style in which it was
displayed when the snapshot was taken.
NOTE
Once you select “display graph image” you can no longer change the display format
to a table or to a dual display. However, you can use the browser “Back” button to go
to the previously displayed page.
When you snapshot a table, you cannot change to a graph from within the snapshot
image window.
The HTML page persists in a snapshot image cache until the EPICenter server is
restarted, or until the image cache becomes full. When the image cache reaches its limit,
older snapshot images will be deleted as needed to make room for new snapshot
images.
Viewing Device Information from Pop-up Menus
You can select a device, a slot, or a port in the Component Tree, then right-click to
display a pop-up menu that contains the Properties command. The Properties command
displays the attributes for a specific device group, device, slot, or port. The device
pop-up menu also contains the Alarms, Browse, EView, Telnet, and VLANs commands.
All of these commands perform the same functions as the applets in the Navigation
Toolbar to the left of the page, but with the appropriate device displayed.
Properties
The Properties function lets you view the attributes for a selected device, slot, or port.
Device
To view the Properties display for a selected device:
326
EPICenter Software Installation and User Guide
Viewing Device Information from Pop-up Menus
• Right-click on the device, then select Properties from the pop-up menu that appears
The Device Properties window appears and displays the attributes for the selected
device.
See “Device Properties” on page 330 for details on using this feature.
Slot
To view the Properties display for a selected slot:
• Right-click on the slot, then select Properties from the pop-up menu that appears
The Slot Properties window appears and displays the attributes for the selected slot.
See “Slot Properties” on page 330 for details on using this feature.
Port
To view the Properties display for a selected port:
• Right-click on the slot, then select Properties from the pop-up menu that appears
The Port Properties window appears and displays the attributes for the selected port.
See “Port Properties” on page 331 for details on using this feature.
Alarms
The Alarms function runs the EPICenter Alarm System and displays the Alarm Browser
function to show the alarms for the selected device.
To view the Alarms display for a selected device:
• Right-click on the device, then select Alarms from the pop-up menu that appears
This starts the Alarm System applet in a new window. The Alarm System displays the
Alarm Log Browser and displays the alarms for the selected device.
See Chapter 5, “The EPICenter Alarm System” for details on using this feature.
EPICenter Software Installation and User Guide
327
Real-Time Statistics
Browse
The Browse function runs the ExtremeWare Vista switch management interface for the
selected device.
To run ExtremeWare Vista for a selected device:
• Right-click on the device, then select Browse from the pop-up menu that appears
This starts the ExtremeWare Vista login page in a new web browser window.
Refer to the ExtremeWare Software User Guide for details on using ExtremeWare Vista.
EView
The EView function runs the EPICenter ExtremeView applet and displays the device
front-panel image and device information for the selected device.
To view the EView for a selected device:
• Right-click on the device, then select EView from the pop-up menu that appears
This starts the ExtremeView applet in a new window and displays the front-panel
image and information for the selected device.
See Chapter 10, “Using ExtremeView” for details on using this feature.
Telnet
The Telnet function opens an EPICenter telnet window that is connected to the selected
device.
To open a telnet session for a selected device:
• Right-click on the device, then select Telnet from the pop-up menu that appears
This starts a telnet session for the device in a new window.
See Chapter 7, “Using the Interactive Telnet Application” for details on using this
feature.
328
EPICenter Software Installation and User Guide
Displaying Properties
VLANs
The VLANs function runs the EPICenter VLANs applet and displays the VLANs
currently known to the EPICenter database.
To view the VLANs for a selected device:
• Right-click on the device, then select VLANs from the pop-up menu that appears
This starts the VLAN applet in a new window and displays the VLANs currently know
to the EPICenter database.
See Chapter 13, “Using the VLAN Manager” for details on using this feature.
Displaying Properties
You can view the properties of a device group, device, slot, or port in the EPICenter
database. This section describes how to view properties through the ExtremeView
applet.
Device Group Properties
You can view summary information for all device groups, or view information about
individual device groups.
To view summary information for all device groups, right-click on the Device Groups
component and select Properties from the pop-up menu.
The Device Groups Properties window appears, showing the All Device Groups display.
This displays a list of the current device groups and their descriptions. For more details
about this display, see Chapter 4 “Using the Inventory Manager.”
You can also view properties for a specific device group. To view properties for a
specific device group, right-click on a device group and select Properties from the
pop-up menu.
The Device Group Properties window appears, showing information about the selected
group. This includes the group description, the number of devices in the group, and a
list of the devices. For more details about this display, see Chapter 4 “Using the
Inventory Manager.”
EPICenter Software Installation and User Guide
329
Real-Time Statistics
Device Properties
To view properties for a device, right-click on a device in the Component Tree and
select Properties from the pop-up menu that appears.
The Device Properties window has three tabs at the top of the window:
• Device
• VLAN
• STP
Each tab displays the name of the device and a status “light” which shows the status of
the device as detected by EPICenter.
The Device Tab
The Device tab displays information about the device such as its IP address, MAC
address, and boot time. The main section of the window presents the same information
you can view in the Inventory Manager for the device. If the device is an Extreme
device, the ExtremeWare software running in the switch provides comprehensive status
information.
The VLAN Tab
The VLAN tab lists the VLANs configured on the device.
The STP Tab
The STP tab lists the Spanning Tree domains (STPDs) configured on the device. There
may be more than one entry per STPD if the domain includes multiple VLANs.
For more details about the Device Properties window, see Chapter 4 “Using the
Inventory Manager.”
Slot Properties
You can view summary information about a specific slot in a modular device. To view
properties for a slot, click on the plus sign of a modular device to display the slots for
that particular device. Right-click on a slot and select Properties from the pop-up menu
that appears.
330
EPICenter Software Installation and User Guide
Displaying Properties
The Device Slot Properties window displays information about the slot such as the
number or letter of the slot, the type of module that is inserted into the slot, and the
serial number of the module. If you have a module that requires a special version of
ExtremeWare to be installed, the window also displays information such as the primary,
secondary, and current software images running on the module as well as the current
BootROM image running on the module. The main section of the window presents the
same information you can view in the ExtremeView applet for the slot.
For more details about this display, see Chapter 10 “Using ExtremeView.”
Port Properties
You can view summary information about a specific port in a device.
To view properties for a port in a modular device, click on the plus sign of a device to
display the slots for that particular device. Click on the plus sign of a slot to display the
ports for that particular device. Right-click on a device and select Properties from the
pop-up menu that appears.
To view properties for a port in a non-modular device, click on the plus sign of a device
to display the ports for that particular device. Right-click on a device and select
Properties from the pop-up menu that appears.
The Device Port Properties window displays information about the port such as the
number of the port, whether the port is enabled or disabled, and the load sharing state
of the port. The main section of the window presents the same information you can
view in the ExtremeView applet for the port.
For more details about this display, see Chapter 10 “Using ExtremeView.”
EPICenter Software Installation and User Guide
331
Real-Time Statistics
332
EPICenter Software Installation and User Guide
12 Network Topology Views
This chapter describes how to use the EPICenter Topology View applet for:
• Viewing EPICenter Topology maps
• Creating new topology views
• Adding, moving and deleting map elements (nodes and links)
• Setting display properties for individual maps or a complete topology view
• Modifying the layout of a topology map
• Displaying the alarm browser, telnet window, real-time statistics, a front panel view,
VLAN Manager, ExtremeWare Vista, or the Properties dialog for a specific node on
the map
Overview of EPICenter Topology Views
EPICenter’s Topology applet allows you to view your network (EPICenter-managed
devices and the links between devices) as a set of maps. These maps can be organized
into sets of submaps that allow you to represent your network as a hierarchical system
of campuses, buildings, floors, closets, or whatever logical groupings you want. You can
also create additional topology views (sets of maps) so you can create several different
representations of your network for different purposes.
For views with the Auto Populate View option enabled, the Topology applet
automatically adds device nodes as they are added to EPICenter’s device inventory. It
also adds any links that exist between the device nodes, and organizes them into
EPICenter Software Installation and User Guide
333
Network Topology Views
submaps as appropriate. You can customize the resulting maps by moving elements,
adding new elements, such as links, “decorative” (non-managed) nodes, and text, and
customizing the device nodes themselves. The Default view, which appears when you
first access the Topology applet, is auto-populated with the devices currently in
EPICenter’s inventory.
NOTE
Links can only be discovered and auto-populated between Extreme Networks devices
that have the Extreme Discovery Protocol (EDP) enabled. Links cannot be discovered
on non-Extreme Networks devices, on Extreme Networks devices with EDP disabled, or
on devices running the following versions of ExtremeWare: versions prior to 4.1.19b2,
version 5.x, or version 6.0.x. Links can be discovered on devices with EDP enabled
running ExtremeWare 4.1.19 b2, 4.1.20, or 4.1.21, or ExtremeWare 6.1 or later. EDP is
enabled by default on these Extreme Networks devices.
In addition, from a managed device node on the map, you can invoke other EPICenter
functions such as the alarm browser, Telnet, real-time statistics, a front panel view, the
VLAN Manager, or ExtremeWare Vista for the selected device, or view device properties
from a Properties window.
Maps are initially created in a layout based on information in EPICenter’s device
inventory about the devices and their connectivity. You can customize the layouts into
hierarchical views using cut and paste, or by deleting devices from a map and then
adding them to a different map. You can also add and remove “decorative” nodes
(nodes that aren’t discovered or managed by EPICenter) and links.
Displaying a Network Topology View
Click the Topology button in the EPICenter Navigation Toolbar to display the main
Topology View page, as shown in Figure 114.
NOTE
If you have not yet performed a Discovery (i.e. there are no devices in EPICenter’s
Inventory database) the map will be blank.
334
EPICenter Software Installation and User Guide
Displaying a Network Topology View
Figure 114: The Topology View
Submap node
Information
Hyper node
Device nodes
panel
View name
Text node
L2 cloud node
Links
Decoration node
A View is a unique, named hierarchy of maps, consisting of a root map and optional
submaps, depending on the topology of the network. The current View name is
displayed in the pull down field at the left of the icon bar.
A Map is a collection of nodes and links.
The top portion of the left-hand panel displays the Map Hierarchy Tree. This starts at
the root map and shows the hierarchy of submaps in the current topology view. The
current map name is highlighted.
The bottom portion of the left-hand panel is the Map Element Description panel, that
displays information about the currently selected map element if one (and only one) is
selected. Otherwise, the panel is empty.
EPICenter Software Installation and User Guide
335
Network Topology Views
The main panel displays the currently selected map in the current topology view. Only
one view and map can be displayed at a time.
Map Elements
The following elements can appear on a map:
Device Nodes. Device nodes represent the managed devices found in EPICenter’s
Inventory data base.
Figure 115: Example of device nodes, including an unknown device type
A device node shows the following information:
• The name of the device as it is kept in the Inventory database (this can be hidden
using View or Map properties).
• An optional, user-supplied annotation for the node.
• A small icon representing the specific device or device product line, if the device is
of a known type, or an “unknown” device icon (a circle with a question mark) as
shown in Figure 115. (This can be hidden using View or Map properties.)
• The device’s IP address.
• The device status, indicated by the color of the icon border.
— A green border indicates that the device is up.
— A red border indicates that the device is down.
Each managed device known to EPICenter can only appear once in each topological
view.
336
EPICenter Software Installation and User Guide
Displaying a Network Topology View
Submap Nodes. A submap node represents a child map of the current map.
Figure 116: Example of a submap node
The submap node icon shows the following information:
• The name of the node (submap), which can be edited. By default, it is given the
subnet address/subnet mask as the name.
• A submap icon, as shown in Figure 116.
A submap node does not provide any additional status information.
L2 Cloud Nodes. An L2 cloud map node provides connectivity between devices when
the details of the connectivity cannot be determined. For example, if there is a hub
between two devices, the Topology applet will place an L2 cloud between the devices.
L2 clouds are created automatically as needed.
Figure 117: Example of an L2 cloud node
The L2 cloud node icon shows the following information:
• The name of the node (cloud), which can be edited. By default, it is named L2C.
• A cloud icon, as shown in Figure 117. (This can be hidden using View or Map
properties.)
An L2 cloud node does not provide any status information.
NOTE
You cannot add L2 cloud nodes; they are placed automatically by EPICenter as required
by device connectivity. You can remove them, but they may be replaced automatically by
EPICenter if still needed.
EPICenter Software Installation and User Guide
337
Network Topology Views
There may be situations where EPICenter creates an L2 cloud that is not really
necessary. For example:
• An L2 cloud may be created as devices are added to the map, but when the final
topology is known, the L2 cloud is no longer necessary.
• When one end of a link is moved, EPICenter will represent this as two links —one
link that is down (the old endpoint port) and a new link that is up (the new
endpoint). It will also determine that these two links share the same endpoint, so
there must be a hub between these ports and the device at the other end. Thus,
EPICenter will create an L2 cloud to represent the hub.
In either of these cases, you can use the Discover Links command to remove
unnecessary links and L2 clouds. See “Discovering Links Between Devices” on page 354
for more information on the Discover Links function.
Hyper Nodes. A hyper node represents a link termination when the actual terminating
node (device or cloud) is present on another map. Thus, a hyper node will show the
same information as the node it represents (except for the optional node annotation):
Figure 118: Example of hyper node icons representing a device and an L2 cloud
A hyper node icon shows the following information:
• The name of the device or cloud node that this hyper node represents (this can be
hidden using View or Map properties).
• An optional, user-supplied annotation for a device hyper node. This is a different
annotation than will appear in the device node that this hyper node represents.
• A hyper node icon, as shown in Figure 118.
• The device IP address, for a device hyper node.
• The device status, for a device hyper node, as indicated by the color of the icon
border:
— A green border indicates that the device is up
— A red border indicates that the device is down
An L2 cloud hyper node does not show any status information.
338
EPICenter Software Installation and User Guide
Displaying a Network Topology View
NOTE
You cannot add, cut, or delete hyper nodes; they are placed and removed automatically
by EPICenter as required by device connectivity.
Decorative Nodes. A decorative map node can be created by the user to represent any
other type of node that is not discovered or managed by EPICenter, such as a server or
workstation.
Figure 119: Example of a decorative node
A decorative node shows the following information:
• The name or description of the node, which can be edited
• A decorative node icon, as shown in Figure 119. (This can be hidden using View or
Map properties.)
Text Nodes. A text map node is a single-line text field that can be placed anywhere in
a network map. It can be used to create a title for the map, additional annotations for
other map elements, comments, and so on.
Links. A link represents connectivity between nodes in the map. Links can be
automatically detected on Extreme Networks devices with EDP enabled.
NOTE
For third-party devices or Extreme Networks devices with EDP disabled or not
supported, you can manually add links to the map to represent connectivity between
devices. However, these links will always have unknown status, will not display endpoint
or utilization information, and will not be updated when the map topology changes. The
behavior of links described in the following paragraphs does not apply to
manually-added links.
When a discovered link connects two devices on the same map, the link will be
annotated with the port number, or slot and port number for each of the endpoints, as
shown in Figure 120.
EPICenter Software Installation and User Guide
339
Network Topology Views
Figure 120: Example of a gigabit link showing endpoint connectivity and Up status
When one of the endpoints is within another submap, the annotation will include the
device name or IP address of the device that contains the endpoint within the submap.
Whether the IP address or device name is used depends on the setting of the Device
Tree UI property in the Administration applet—the one that appears first is used.
When the endpoint of a discovered link is not known (the link terminates in a L2 cloud)
the unknown port is indicated with a question mark.
NOTE
If there are mode than 400 nodes on a map, link annotations are not displayed.
If there are multiple links running between two devices, each link is shown individually
as long as there are 25 links or less. If more than 25 links connect two devices, they are
represented as a composite link. For a composite link, the link annotation provides the
total number of links in the composite and the number of links in each applicable status
category (up, down, partially up, or unknown).
A link also shows the following information:
The width of the link line indicates the link type:
• A thick line indicates a gigabit link
• A thin line indicates a 10/100 link
• A very thick line indicates a composite link.
The color of the link line indicates the link status:
• A green line indicates that the link is up
• A red line indicates that the link is down
• A yellow line may be displayed for composite or load-shared links:
— For a composite link, yellow indicates that some of the links in the composite are
up, and some are down or unknown.
340
EPICenter Software Installation and User Guide
Displaying a Network Topology View
— For links that are members of a load shared group, yellow indicates that one or
more load-shared links are down. All links in the group will be displayed as
yellow if one or more of the links in the group is down.
• A grey line indicates that the link status is unknown.
A broken line (when viewing VLANs) indicates that the selected VLAN does not exist
or may be misconfigured at one of the endpoints.
If RMON statistics are enabled for the map, then link utilization (as a percentage of link
capacity) will be displayed for each port on a link between devices that have RMON
enabled in the device. The utilization is updated at the nominal RMON rate as set in the
switch—typically every 30 seconds. The default is that RMON statistics are not enabled
for a map. To enable the display of RMON statistics, see “Setting Map Properties” on
page 369.
NOTE
If RMON statistics are not enabled in the switch, then no statistics will be displayed,
even if you enable the display of RMON statistics for the map.
Manipulating Map Elements
Map elements (nodes and links) can be resized, cut to a clipboard, pasted, deleted and
added. There are a number of ways to invoke these actions:
• Select a command from one of the menus in the Topology View menubar
• Select a command from a pop-menu enabled with a right-cursor click on the map
background
• Select a command icon from the Topology View toolbar
• Use one of the Topology applet keyboard short cuts, or (under Windows NT or
Windows 2000) through the regular Windows mouse and cursor actions and
keyboard shortcuts
For example, you can resize an individual node by selecting the node and doing one of
the following:
• Use the cursor to grab one of the resize handles that appear when the node is
selected, and drag the handle to resize the node
• Select the Inflate Nodes or Deflate Nodes command from the Map Menu
EPICenter Software Installation and User Guide
341
Network Topology Views
• Use the keyboard shortcuts ([Alt]+I or [Alt]+D) for those commands (see the sections
“Inflating the Map Nodes” and “Deflating the Map Nodes” on page 365).
Map Element Description Panel
When you select a map node or link with the cursor, the panel below the Map
Hierarchy Tree displays information about the node or link.
Map Nodes
For map nodes the information panel displays the following:
• Name: The node name—can be edited for submap nodes, L2 cloud nodes,
decoration and text nodes. Cannot be edited for device nodes and device hyper
nodes.
• Annotation: an optional identifier for device nodes and device hyper nodes
• Type: The type of node (Device, Submap Node, L2 Cloud, Decoration Node, Text
Node, or Hyper Node)
• Status: The node status (Up, Down, or None)
• IP: IP address for a Device node, n/a for any other node type
• MAC: MAC address for a Device node, n/a for any other node type
• Vendor: Device vendor name for a Device node, n/a for any other node type
• Product: Product name for a Device node, n/a for any other node type
• Device: Device name obtained from the sysName variable for a Device node, n/a for
any other node type
• VLANs/Ports list: If the Display VLANs option is enabled, displays the VLANs
configured on the device. Appears for Device Nodes and Device Hyper Nodes only.
Link Nodes
For individual links, the information panel displays the following information:
• Status: The status of the link—up, down, partially up (for load-shared links only) or
unknown. Partially up indicates that one or more of the links in the load shared
group is down. In this case, all other links in the load-shared group are considered
partially up.
• Type: The link type (speed) —10/100, 1000, or unknown
342
EPICenter Software Installation and User Guide
Manipulating Topology Views and Maps
• Load shared: Whether the link is load shared (yes or no)
In addition, for each link endpoint, the following information is displayed:
• Node: The name of the node that contains the endpoint
• Device: The name of the device represented by the endpoint node
• Port: The device port or slot and port to which the link connects, if known
• Utilization: The utilization percentage, if RMON is enabled on the device and if
RMON statistics are enabled for this map. The default is that RMON statistics are
not enabled for a map. This is updated regularly, typically every 30 seconds
• Total errors: The total errors, if RMON is enabled on the device and if RMON
statistics are enabled for this map. This is updated regularly, typically every 30
seconds
• VLANs/Ports list: Displays the VLANs configured on that port.
Composite Link Nodes
For composite links, the information panel displays the following information:
• Status: The overall status of the composite link— up, down, partially up, or
unknown. Partially up indicates that some links in the composite are up, some are
down.
• Link count: The number of individual links in the composite link.
• Links Status: The number of links up, partially up, down and unknown.
In addition, for each link endpoint, the following information is displayed:
• Endpoint 1 and Endpoint 2: The name of each endpoint node
• Endpoint 1 device and Endpoint 2 device: The device type or each endpoint node
• A table showing the endpoint ports (or slot and port) for each individual link in the
composite link, along with the link status and whether the link is load shared. You
may need to move the right side boundary of the panel to see the last two columns.
Manipulating Topology Views and Maps
You can create new topology views or move elements around on existing maps in a
number of ways. The Topology View applet provides a number of ways to invoke the
various commands and functions:
EPICenter Software Installation and User Guide
343
Network Topology Views
• A series of pull-down menus. All commands and functions can be accessed from
these menus
• A set of icons that represent a commonly-used subset of the functions available
• A pop-up menu you can invoke by clicking the right mouse button on any
unoccupied area of the map background
• A pop-up menu you can invoke by right-clicking on a Device map node
• Keyboard shortcuts for some functions
The various methods you can use to perform a command are described under each
command or function.
Creating a New View or a New Map
The Default map contains all the network devices known to EPICenter, arranged based
on EPICenter’s internal algorithms (see the discussion on page 346 in the section
“Displaying a Network Topology View”). However, it is often convenient to create
views based on other criteria, such as physical location, departmental organization, and
so on. The Topology applet lets you create additional views that organize your network
elements in any way you wish.
Creating a New View
You can create a new view (and its Root Map) by selecting New View from the New
menu.
A Create New View dialog box opens, as shown in Figure 121.
344
EPICenter Software Installation and User Guide
Manipulating Topology Views and Maps
Figure 121: Creating a new View
• Enter a name for the view.
• Select the Auto populate view option to add the devices currently in the EPICenter
inventory database to the new View. Submaps, L2 clouds and hyper nodes will be
created as needed. In addition, as new devices are added to EPICenter, they will also
be added to the view. If you do a Discovery after you have created a view with the
auto populate option enabled, all new discovered devices will be added to the
view.See “Node Placement Criteria in an Auto Populate View” on page 346 for
detailed information.
• Uncheck the Display device names checkbox to hide device names on the maps.
The default is to display the names.
• Uncheck the Display node icons checkbox to use plain boxes to indicate map nodes
instead of icons representing specific device types. The default is to use device icons.
• Set the Map Node Font Size to change the size of the font used for map node labels
(names, annotations, IP addresses and so on). The default is a 12 point font.
If your map will contain a large number of nodes, you may need to eliminate the device
names and node icons from the display, and reduce the font size in order to fit all the
map elements onto a map with adequate spacing.
When you click OK, a new root map is displayed. If the Auto populate view option is
not selected, a new blank root map is displayed. If Auto populate view is selected,
nodes, submaps and other map elements are created based on the current EPICenter
inventory. The new view name appears in the View field at the left of the icon bar.
Each newly-created map inherits the current view’s properties for display node names,
display node icons, and map node font size.
EPICenter Software Installation and User Guide
345
Network Topology Views
Displaying a View
You can display the Default view or any other views you have created by selecting the
View name from the pull down list in the View field.
Renaming a View
You can rename the view by clicking in the View field and typing over the view name.
Click away from the View field to commit the change.
Node Placement Criteria in an Auto Populate View
When you do a Discovery or add a device in the Inventory applet, the newly added
devices are placed into the default topology view (named “Default”). If you have
created other maps with the Auto Populate View feature enabled, those views are also
populated with the newly added devices. Device connectivity and the map hierarchy is
determined by the information learned from the EPICenter database.
For views with the Auto Populate View option enabled, EPICenter places devices on the
Root Map or into submaps based on the following criteria:
• Devices with IP Forwarding enabled are always placed on the Root Map
• Devices without IP Forwarding enabled are placed in submaps based on the subnet
mask associated with the IP interface used by EPICenter to manage the device. In
the Default view, submaps are named based on the subnet IP address plus the
subnet mask: for example, 10.205.0.0/16, 10.205.0.0/24, and so on.
Both Extreme and third-party devices are placed using these rules. For Extreme devices,
you can find the subnet mask and IP Forwarding status by looking at the device in the
VLAN applet. For third-party devices, you must query the device itself if you want to
determine these settings.
Within a map, the Topology Manager attempts to optimize the layout to minimize node
and link overlap. If there are more than 400 links in a single map, the Topology
Manager does not put labels (annotations) on the links. It displays a warning telling
you that link labels will not appear.
If there are more than 400 nodes to be placed in a single map, the Topology Manager
displays a warning that computing the default layout may take a significant amount of
time (see Figure 122). You can then choose to have the nodes laid out in a simple
row/column grid.
346
EPICenter Software Installation and User Guide
Manipulating Topology Views and Maps
Figure 122: Map layout warning for placement of more than 400 nodes
If you want to proceed with the default (optimized) layout, check the Default Map
Layout checkbox. Even though the default layout may take a long time, it only needs to
be done once, and produces a more optimal layout. To specify a grid layout (which may
result in overlapping links) check the Grid Map Layout checkbox. To bypass the layout
process, check cancel.
Figure 124 shows an example of a the default layout for a 405 node map. Figure 124
shows the same nodes in a grid layout.
EPICenter Software Installation and User Guide
347
Network Topology Views
Figure 123: Example of a default layout for a 410 node map
348
EPICenter Software Installation and User Guide
Manipulating Topology Views and Maps
Figure 124: Example of a grid layout
Creating a New Submap
You can create a new map by doing one of the following:
• Select New Map from the New menu
• Click the “Create new map” icon on the icon bar:
A new submap node appears on the map, and a New Map entry appears in the map
hierarchy tree, as shown in Figure 125.
EPICenter Software Installation and User Guide
349
Network Topology Views
Figure 125: Adding a new map
To give the submap a different name, select the submap node, and change the name in
the name field in the Information panel. The change will take effect when you click
away from the submap node.
You can also change the name of any map (including the Root Map) by clicking slowly
twice on the name in the Map Tree Hierarchy. This puts you into an edit mode where
you can change the name.
When editing the map name in either location, you can cancel the edit with the [Esc]
key, as long as you have not yet committed it.
You can commit the change with the [Enter] key, or by clicking in a different panel from
the one where you are editing.
Adding Elements to the Map
You can add a variety of elements to your map: device nodes, submap nodes, links,
decorative nodes, and text “nodes”.
350
EPICenter Software Installation and User Guide
Manipulating Topology Views and Maps
Adding a Device Node
You can add device nodes to your map by doing one of the following:
• Select New Device Map Node from the New menu
• Right-click on the map background to display the pop-up menu, then select New
Device Map Node
• Click the “Create new device map” node icon on the icon bar:
A pop-up window appears with a list of all devices currently known to EPICenter, that
are not already used somewhere in this view. A count of devices in the list is displayed
at the top of the window. If all devices known to EPICenter are already placed in this
view, a message window informs you of that fact.
To add a device node to the map, select the device and click OK.The device node will
appear on the map, identified by the information from EPICenter’s inventory database.
If the device has known links to other devices already on the map, or on other submaps
within the same view, those links will also be placed on the map. An L2 cloud node or a
hyper node, may also be placed on the map, if required for connectivity between the
devices.
If all devices known to EPICenter are already placed in this view (on any of the maps in
the view) the pop-up window will inform you of that fact.
L2 Cloud Nodes and Hyper Nodes. You cannot add L2 cloud nodes and you cannot
add or remove hyper nodes to or from your map; they are added automatically if the
connectivity between device nodes requires it.
Adding a Decorative Node
You can add a decorative node to your map by doing one of the following:
• Select New Decorative Map Node from the New menu
• Right-click on the map background to display the pop-up menu, then select New
Decorative Map Node
A decorative map node is a node that can be used to represent any component of your
network that is not recognized or managed by EPICenter.
You can change the node name by selecting the node, and editing the contents of the
name field in the Information panel. The change will take effect when you click away
from the submap node.
EPICenter Software Installation and User Guide
351
Network Topology Views
Adding a Text Node
You can add a text node to your map by doing one of the following:
• Select New Text Map Node from the New menu
• Right click on the map background to display the pop-up menu, then select New
Text Map Node
A text map node can be used to annotate your map, such as to create a title for the map.
Adding a Map Link
There may be situations where you want to represent a link between devices when a
“real” link cannot be detected by EPICenter. This may be the case if EDP is disabled on
a device, if the device is a non-Extreme Networks device, or if EDP is not supported by
the version of ExtremeWare running on the device. In these cases you can add a link
between nodes on your map by doing the following:
• Select New Map Link from the New menu
A link is added to your map, as shown in Figure 126.
Figure 126: Adding a link to your map
352
EPICenter Software Installation and User Guide
Manipulating Topology Views and Maps
To attach the link between two map nodes:
1 Select one of the red triangles, then wait until a move cursor appears
2 Drag and drop one end of the link onto one of the node you want to connect
3 Do the same with the other end of the link
After the link is connected, you can specify endpoint for the link. To specify the end
points:
1 Select the link
2 In the Information panel, select the port for the endpoint from the list in the Port
field for first device
3 Select the port for the other endpoint from the list in the Port field for second device,
as shown in Figure 127
Figure 127: Specifying ports for a new link connection
EPICenter Software Installation and User Guide
353
Network Topology Views
There are a number of restrictions that apply to the behavior of manually-created links:
• These links appear only on the map where they were created—they will not exist
between the same devices in any other view.
• These links are NOT update when the status or end-point of the real link it
represents is changed. If, due to such a change, the real link is discovered by
EPICenter (for example, the endpoint is moved to a device where EDP is enabled) a
new link is created on the map in addition to the manually-created link.
• If the device to which a manually-created link attaches is cut from the map, the link
must be manually recreated when the device is pasted back.
Discovering Links Between Devices
EPICenter will eventually discover new links between devices or rediscover links you
have deleted from the map if they are real existing links that are up. However, if you
want to have EPICenter discover new links immediately, instead of waiting for the next
polling cycle, you can use the Discover Links command.
You can also use Discover Links to remove links that no longer exist. Since EPICenter
cannot distinguish between a link that no longer exists and a link that is down, when a
link is moved, EPICenter will continue to show the obsolete link as a down link. The
Discover Links command will remove these.
To have EPICenter rediscover all existing links between devices, do the following:
• Select Discover Links from the New menu
EPICenter will add or update the links that exist between the devices on your map, and
will remove any links whose connectivity or status it cannot determine. It will also
eliminate any L2 clouds that are no longer needed.
NOTE
If there is a existing link that is down when you do a Discover Links, EPICenter will
remove that link, since it cannot discover links from which it cannot get status. However,
if you have auto-populate turned on for the map, the real link will be added back to the
map once the link comes back up.
354
EPICenter Software Installation and User Guide
Manipulating Topology Views and Maps
Editing the Map
You can edit your topology views in a number of ways, including changing the names
of the views and maps, and cutting, pasting, or deleting map elements.
Renaming a Topology View
You can change the name of a view (including the Default view) by doing one of the
following:
• Select Rename View from the Edit menu
• Click once on the view name in the view name field
Either of these actions puts you into an edit mode where you can directly change or
replace the contents of the field.
Deleting a View
To delete the entire current view, select Delete View from the Edit menu. You will be
asked to confirm that you want to delete the entire view. This function deletes the
currently displayed view, including all of its maps.
Once the view is deleted, the next remaining view is displayed, if there are any other
views.
NOTE
You can use this command to delete the Default view. However, if you do this, it will be
difficult to recreate the view and its submaps.
Renaming a Map
You can change the name of the current map by doing one of the following:
• Select Rename Map from the Edit menu
• Click twice on the Map name in the Map Hierarchy Tree
Either of these actions puts you into an edit mode where you can change or replace the
name in the Map Hierarchy Tree.
You can also change the name of the map in the Map Properties window, as discussed
in “Setting Map Properties” on page 369.
EPICenter Software Installation and User Guide
355
Network Topology Views
Deleting a Submap
To delete a submap, you must first display the submap you want to delete, and delete
all the elements on the map. You can then delete the submap by selecting Delete Map
from the Edit menu. You can also delete a submap by clicking the submap node on its
parent map.
You will be asked to confirm that you want to delete the map.
NOTE
A submap must be empty before you can delete it.
You cannot use the Delete Map command to delete the Root Map.
To delete the Root map you must delete the entire View with the Delete View
command.
Cutting Map Nodes
You can cut selected device, decorative, or text nodes from the map in order to paste
them in another location.
• You can cut a submap node as long as it is empty
• You cannot cut a hyper node. A hyper node will be removed automatically as
appropriate, if all nodes on the current map that have links to that node, are
removed
• L2 cloud nodes can be cut, but cannot be pasted.
To cut one or more nodes, do the following:
1 Select the nodes you want to cut. You can select multiple nodes by dragging the
cursor to rubber-band the selection, or by using Shift-click (hold down the shift key
while clicking the cursor on the nodes you want to select).
2 Cut the nodes by doing one of the following:
— Select Cut Map Nodes from the Edit menu
— Click the “Cut nodes from map” icon on the icon bar
— Right-click on the map background to display the pop-up menu, then select Cut
Map Nodes
— Enter [Alt]+X from the keyboard
356
EPICenter Software Installation and User Guide
Manipulating Topology Views and Maps
NOTE
You are NOT asked to confirm this action: if you cut a node by mistake, you will just
need to paste it back again to the map.
To remove nodes from the map without provision for pasting them, use the Delete Map
Nodes command.
Pasting Nodes onto a Map
Once you have cut one or more nodes, you can paste them onto another map by doing
one of the following:
• Select Paste Map Nodes from the Edit menu
• Click the “Paste” icon on the icon bar
• Right-click on the map background to display the pop-up menu, then select New
Device Map Node
• Enter [Alt]+V from the keyboard
These commands will only be available if there are cut nodes currently on the clipboard.
If nodes are pasted partially or completely on top of one another, you can use the
Layout Map command (see “Map Layout” on page 361) to rearrange them.
NOTE
Cutting and pasting nodes does NOT preserve manually-created links between the
nodes. Links that are automatically discovered may be recreated after the nodes are
pasted, but links that were created manually must be recreated manually.
NOTE
If an L2 cloud node was among those you selected to cut, it may not necessarily be
pasted back with the other nodes. Another L2 cloud is created only if EPICenter
determines that it is necessary for representing device connectivity.
EPICenter Software Installation and User Guide
357
Network Topology Views
Deleting Nodes from the Map
You can delete selected device, decorative, or text nodes from the map, as opposed to
cutting them for later pasting.
• You can delete a submap node as long as it is empty
• You cannot delete hyper nodes. A hyper node is deleted automatically when the
actual node it represents is deleted
• L2 cloud nodes are deleted when they are no longer needed. You can also delete
them manually
To delete one or more nodes, do the following:
1 Select the nodes you want to delete. You can select multiple nodes by using
Shift-click (hold down the shift key and click the cursor on the node you want to
select).
2 Delete the nodes by doing one of the following:
— Select Delete Map Nodes from the Edit menu
— Right-click on the map background to display the pop-up menu, then select
Delete Map Nodes
CAUTION
You will NOT be asked to confirm that you want to delete the nodes. If you delete nodes
accidently, you will need to add them again to the map.
Deleting Links from the Map
You can remove one or more links from the map using the Delete Map Links
command.
To delete one or more links, do the following:
1 Select the links you want to delete. You can select multiple links by using Shift-click
(hold down the shift key and click the cursor on the link you want to select).
2 Delete the links by doing one of the following:
— Select Delete Map Links from the Edit menu
— Right-click on the map background to display the pop-up menu, then select
Delete Map Links
358
EPICenter Software Installation and User Guide
Manipulating Topology Views and Maps
CAUTION
Active links that were created automatically by EPICenter will be recreated automatically
on the next polling cycle as long as the endpoints they linked are still present on the
map. The only links that can be permanently deleted are manually-created links or links
that cease to exist.
CAUTION
Links that have been deleted cannot be pasted. Manual links must be recreated
manually.
Selecting All Nodes in a Map
You can select all the nodes in a map by doing one of the following:
• Select Select All Map Nodes from the Edit menu
• Enter [Alt]+A from the keyboard
NOTE
To move a multiple-node selection as a group, hold down the shift key while dragging to
preserve the multiple-node selection.
Setting View Properties
You can change the properties you set when you created a new view (or change the
properties of the Default view) using the View Properties... function. To display the
View Properties window, do one of the following:
• Select View Properties... from the View menu
• Right-click on the map background to display the pop-up menu, then select View
Properties...
The View Properties window appears, as shown in Figure 128.
EPICenter Software Installation and User Guide
359
Network Topology Views
Figure 128: Setting View properties for the current view
To change the properties for the current view, do the following:
• Select the Auto populate view option to add the devices currently in the EPICenter
inventory database to the View. Submaps, L2 clouds and hyper nodes will be created
as needed. In addition, as new devices are added to EPICenter, they will also be
added to the view. If you do a Discovery after you have created a view with the auto
populate option enabled, all new discovered devices will be added to the view.See
“Node Placement Criteria in an Auto Populate View” on page 346 for detailed
information.
• Uncheck the Display device names checkbox to hide device names on the maps.
Check the checkbox to show the device names.
• Uncheck the Display node icons checkbox to use plain boxes to indicate map nodes
instead of icons representing specific device types. Check the checkbox to display
node icons.
• Set the Map Node Font Size to change the size of the font used for map node labels
(names, annotations, IP addresses and so on). The default is a 12 point font.
• Check the Update map properties checkbox to cause these settings to override any
individual map settings for all current maps in this view. If you do not check this,
exisitng maps will retain the current values of their map properties.
360
EPICenter Software Installation and User Guide
Manipulating Topology Views and Maps
NOTE
Once you change these settings, any new (future) maps you create within this view will
inherit the changed view property settings, regardless of the setting for the Update Map
Properties property.
Map Viewing Functions
EPICenter’s Topology applet provides a number of ways to view and manipulate the
layout of a topology map.
The size and layout of map nodes is saved at every map operation (except for the map
zoom level).
Map Layout
You can drag map nodes around on the map yourself, or you can have EPICenter lay
out the map nodes for you. To have EPICenter do the map layout, do one of the
following:
• Select Layout Map from the Map menu
• Click the “Layout” icon on the icon bar
• Click with the right mouse button on the map background to display the pop-up
menu, then select Layout Map
• Enter [Alt]+L from the keyboard
This calculates a default map layout, optimizing for node and link placement to
minimize overlap. If necessary, the Topology Manager may create a layout that is larger
than the visible window area. In this case, scroll bars allow you to view different parts
of the map.
If there are a large number of nodes, the Topology Manager gives you the option of
using a grid layout instead of the default layout. See “Node Placement Criteria in an
Auto Populate View” on page 346 for more information on how layouts are determined.
Figure 129 shows the visible portion of the default layout produced for a map with
approximately 100 nodes.
EPICenter Software Installation and User Guide
361
Network Topology Views
Figure 129: Default map layout optimized to minimize node and link overlap.
You can use the Expand Map and Compress Map commands to increase or decrease
the space between nodes in the map. You can also move map nodes by selecting them
and dragging them to the location where you want them placed.
Laying Out a Map in Window
If the default map layout creates a map that is larger than the visible area of the
Topology Manager window, you can have the Topology Manager attempt to optimize
the map layout within the visible area of the window. To have EPICenter optimize the
map layout within the current window, do one of the following:
• Select Layout Map In Window from the Map menu
• Click with the right mouse button on the map background to display the pop-up
menu, then select Layout Map in Window
362
EPICenter Software Installation and User Guide
Manipulating Topology Views and Maps
• Enter [Alt]+M from the keyboard
Figure 130 shows the same nodes as shown in Figure 129, but laid out to fit within the
visible area of the window.
Figure 130: Map layout produced by Layout Map in Window command
Fitting a Map in the Window
If the default map layout is larger than the visible area of the Topology Manager
window, you can have the Topology Manager shrink the map to fit into the visible area
of the window. To have EPICenter shrink the map layout to fit within the current
window, do one of the following:
• Select Fit Map In Window from the Map menu
EPICenter Software Installation and User Guide
363
Network Topology Views
• Click with the right mouse button on the map background to display the pop-up
menu, then select Fit Map in Window
• Enter [Alt]+W from the keyboard
This function does not attempt to optimize the layout for node or link overlap. To
attempt to optimize the layout, use the Layout Map in Window command. Figure 131
shows the effects of using the Fit Map in Window command on the map layout shown
in Figure 129.
Figure 131: Map layout produced by Layout Map in Window command
Expanding the Map
The Expand Map function increases the length of the links between map nodes without
changing the size of the nodes. To expand the current map, do one of the following:
364
EPICenter Software Installation and User Guide
Manipulating Topology Views and Maps
• Select Expand Map from the Map menu
• Enter [Alt]+E from the keyboard
Because this command affects map links, nodes that do not have links are not moved.
Compressing the Map
The Compress Map function decreases the length of the links between map nodes
without changing the size of the nodes. To compress the current map, do one of the
following:
• Select Compress Map from the Map menu
• Enter [Alt]+S from the keyboard
Because this command affects map links, nodes that do not have links are not moved.
Inflating the Map Nodes
The Inflate Nodes function increases the size of some or all of the nodes on the current
map, without changing the spacing between the nodes.
By default (if you do not select any specific nodes) the command will inflate all nodes
on the current map. If you select one or more nodes, the command will inflate just the
nodes you’ve selected. You can select multiple nodes by using Shift-click (hold down
the shift key and click the cursor on the node you want to select).
To inflate the selected nodes, do one of the following:
• Select Inflate Nodes from the Map menu
• Enter [Alt]+I from the keyboard
Deflating the Map Nodes
The Deflate Nodes function decreases the size of some or all of the nodes on the current
map, without changing the spacing between the nodes.
By default (if you do not select any specific nodes) the command will deflate all nodes
on the current map. If you select one or more nodes, the command will deflate just the
EPICenter Software Installation and User Guide
365
Network Topology Views
nodes you’ve selected. You can select multiple nodes by using Shift-click (hold down
the shift key and click the cursor on the node you want to select).
To deflate the selected nodes, do one of the following:
• Select Deflate Nodes from the Map menu
• Enter [Alt]+D from the keyboard
Zooming In
The Zoom In function expands the entire map, both the size of the nodes as well as the
spacing between them. To zoom in the current map, do one of the following:
• Select Zoom Map In from the Map menu
• Click the In icon on the icon bar
• Enter [Alt] and the [Plus] from the numeric keypad on the keyboard
Unlike the other map manipulation commands, the zoom level is not saved with the
map.
Zooming Out
The Zoom Out function shrinks the entire map, both the size of the nodes as well as the
spacing between them. To Zoom Out the current map, do one of the following:
• Select Zoom Map Out from the Map menu
• Click the Out icon on the icon bar
• Enter [Alt] and the [Minus] from the numeric keypad on the keyboard
Unlike the other map manipulation commands, the zoom level is not saved with the
map.
Unzooming the Map
The Unzoom Map function restores the map to the size it was prior to any Zoom In or
Zoom Out actions. To “unzoom” the map, do one of the following:
• Select Unzoom Map from the Map menu
• Enter [Alt]+R from the keyboard
366
EPICenter Software Installation and User Guide
Manipulating Topology Views and Maps
Undoing Your Map Edits
You can undo your last ten map layout and sizing actions one by one using the Undo
Map Edit function. Each Undo Map Edit action undoes your previous editing action. To
undo the most recent edit, do one of the following:
• Select Undo Map Edit from the Map menu
• Enter [Alt]+U from the keyboard
This command does not undo delete, cut or paste of map elements. It stores only the
last ten map layout and sizing actions.
Printing a Map
You can print the current map using the Print Map function. To print a map, display the
map you want to print and then do one of the following:
• Select Print Map from the Map menu
• Click the Print icon on the icon bar
• Enter [Alt]+P from the keyboard
Printing a large map can be very memory-intensive, and can take a significant amount
of time.
NOTE
Landscape mode and plotters are not supported.
Finding a Map Node
If your map has a large number of nodes, it may be difficult to quickly find a specific
node you’re interested in seeing. The Find Map Node function lets you select a node
from the list of all nodes in the current view, and will then find and “select” that node.
To find a node, do one of the following:
• Select Find Map Node... from the Map menu
• Right-click on the map background to display the pop-up menu, then select Find
Map Node...
• Enter [Alt]-F from the keyboard
EPICenter Software Installation and User Guide
367
Network Topology Views
You are presented with a list of all the nodes in the current view (see Figure 132). The
list includes the name of the node, the IP address, the node type, and the map where it
can be found. The total number of nodes in the list is displayed at the top of the
window.
Figure 132: Finding a node in the current view
• To find a node, select the node and click the Find button.
This will display the appropriate submap, if necessary, and highlight the node you have
selected.
The Find Map Node window will continue to be displayed until you dismiss it with the
Close button. You can move around among different maps and views while the Find
Map Node window is displayed.
If you change views while the Find Map Node window is displayed, the list of devices
will no longer be correct. To update the list to reflect the current view, click the Refresh
button.
368
EPICenter Software Installation and User Guide
Manipulating Topology Views and Maps
Setting Map Properties
There are a number of properties you can set for the current map, such as the
background color or image, node background color and style, node and link text color,
and whether RMON statistics should be enabled for the devices on this map.
To display the Map Properties window, do one of the following:
• Select Map Properties... from the Map menu
• Right-click on the map background to display the pop-up menu, then select Map
Properties...
The Topology Map Properties window will appear, as shown in Figure 133.
Figure 133: Setting Map Properties for the current map
In this window you can do the following:
• To change the name of the map, modify the name in the Name field
• To select a background image for the map, select the image you want from the
drop-down list in the Background Image field
• To change the height and width (in pixels) for the background image, enter the
number of pixels in the Background Image Width or Background Image Height
field
• To select the coordinates (in pixels) where the upper left hand corner of the
background image should be placed, enter the number of pixels in the Background
Image X or Background Image Y field
EPICenter Software Installation and User Guide
369
Network Topology Views
• To change the map background color, click the color bar icon labeled Map
Background Color. This displays a color selection window where you can select the
color you want. You can select a color using color swatches, or by specifying HSB or
RGB values. The current color is displayed in the small box to the right of the color
bar icon.
• To change the node background color for non-transparent map nodes, click the color
bar icon labeled Node Background Color. This displays a color selection window
where you can select the color you want. You can select a color using color swatches,
or by specifying HSB or RGB values. The current color is displayed in the small box
to the right of the color bar icon.
NOTE
Device nodes that display the node icon use a transparent background color. Thus,
the node background color setting is ignored for these nodes. The background color
affects only submap nodes, device hyper nodes, and device nodes that do not
display a device icon.
• To set the color used to label nodes, click the color bar icon labeled Node Text Color.
This displays a color selection window where you can select a color by using color
swatches, or by specifying HSB or RGB values. The current color is displayed in the
small box to the right of the color bar icon.
• To set the color of the text used to label links, click the color bar icon labeled Link
Text Color. This displays a color selection window where you can select a color
using color swatches, or by specifying HSB or RGB values. The current color is
displayed in the small box to the right of the color bar icon. The default is black.
• To use a gradient node background color (the color is shaded from light to dark to
light), click the checkbox labeled Node Gradient Background. To turn the gradient
off, so that the node background will be a uniform solid color, click in the checkbox
to remove the check mark. The default is to use a gradient background.
• Set the Map Node Font Size to change the size of the font used for map node labels
(names, annotations, IP addresses and so on). The default is a 12 point font.
• Uncheck the Display device names checkbox to hide device names on the maps.
Check the checkbox to show the device names. The default is to display device
names.
• Uncheck the Display node icons checkbox to use plain boxes to indicate map nodes
instead of icons representing specific device types. Check the checkbox to display
node icons. The default is to display device icons.
370
EPICenter Software Installation and User Guide
Displaying VLAN Information
• To select whether RMON statistics should be enabled for this map, click the
checkbox labeled Rmon Statistics. When RMON statistics are on for a map, the
percent utilization will be displayed for links.
RMON statistics can be enabled separately for each map in the view. The default is to
have RMON statistics disabled for the map.
NOTE
It is possible to disable RMON statistics for the Topology applet as a whole, so that
the Rmon Statistics checkbox will not have any effect. This is done setting RMON
properties on the Server Properties page of the Administration applet.
Adding Map Background Images
You can add images of your own to use as background images for topology maps by
placing them in the BackgroundImages directory in the EPICenter server installation.
Both.gif and .jpg image types are supported.
Background images are kept in the directory
<epicenter_install_dir>\extreme\gifs\topology.BackgroundImages
where <epicenter_install_dir> is the root directory of your EPICenter server
installation (by default epc4_0 in the Windows operating environment, or /opt/epc4_0
on a Solaris system).
Displaying VLAN Information
The Topology applet can provide information on the VLANs configured on the switches
in a map. VLAN information is not displayed by default.
You can view VLAN information in several ways within the Topology View applet:
• By VLAN, which highlights all devices and links on the current map with ports in a
selected VLAN.
• By device, which displays a list of VLANs configured on the selected device node.
VLAN information for links is always displayed in the Map Element Description Panel
whenever a link is selected, regardless of the VLAN Display mode.
EPICenter Software Installation and User Guide
371
Network Topology Views
To enable the VLAN information display for devices on a map, do one of the following:
• Click the VLANs icon in the Topology applet Toolbar.
• Select Display from the menu bar, and then select VLAN information. This is a
toggle menu item; select it once to display VLAN information, select it again to
remove the VLAN information display.
When you enable the VLAN information display, a drop down field appears in the
applet Toolbar that lists all the VLANs configured for devices on the map.
• To view VLAN information by VLAN on the current map, select the VLAN from the
drop-down list. The links and devices that are involved in the VLAN are highlighted
on the map, devices and links not in the VLAN are dimmed. Figure 134 shows the
VLAN display for a single node on the map.
Figure 134: Displaying VLAN information
372
EPICenter Software Installation and User Guide
Device Information Views
If a link is displayed as a broken line, this means that a VLAN with the selected
name does not exist on one of the ports in that link. This typically indicates a
misconfiguration. However, it is possible that a compatible VLAN with a different
name exists on the other port, and no misconfiguration exists. For example, you
could have an untagged VLAN vlan1 on one port, and untagged VLAN vlan2 on the
other port. Thus when you select either vlan1 or vlan2 the link is displayed as a
broken line, but traffic will flow successfully between the two VLANs.
• To view the VLANs configured on a device, select the device node on the map. The Map
Element Description panel on the left-hand side of the window displays information
about the VLANs configured on a selected device node. For more detailed
information about the VLANs on a device, you can right-click on the device and
select Device VLANs from the pop-up menu that appears. See “Device VLANs” on
page 375 for more information.
NOTE
If you a large number of VLANs configured on the device, it could take a while to
display the VLANs. Do not deselect the node while this is in progress.
• To view VLANs configured on a link, select the link. VLAN configuration information
for the devices on both sides of the link is displayed in the Map Element Description
panel. (Note that this information is always displayed for links, even if you do not
have the VLAN Display option selected.)
Device Information Views
You can view a variety of information about the devices represented by the nodes on
the map. By selecting a function from the Tools menu, or from the Device pop-up menu,
you can invoke displays of information kept by EPICenter for the selected device.
Device Alarms
The Device Alarms function runs the EPICenter Alarm System applet and displays the
Alarm Browser function to show the alarms for the selected device.
To view the Device Alarms display for a selected node, select the node and do one of
the following:
• Select Device Alarms from the Tools menu
EPICenter Software Installation and User Guide
373
Network Topology Views
• Right-click on the Device map node, then select Device Alarms from the pop-up
menu that appears
This starts the Alarm System applet in a new window. The Alarm System displays the
Alarm Log Browser and displays the alarms for the device associated with the selected
Device map node.
See Chapter 5, for details on using this feature.
Device Browse
The Device Browse function runs the ExtremeWare Vista switch management interface
for the selected device.
To run ExtremeWare Vista for a selected node, select the node and do one of the
following:
• Select Device Browse from the Tools menu
• Right-click on the Device map node, then select Device Browse from the pop-up
menu that appears
This starts the ExtremeWare Vista login page in a new window.
Refer to the ExtremeWare Software User Guide for more information on using
ExtremeWare Vista.
Device Statistics
The Device Statistics function runs the EPICenter Real-Time Statistics applet, and
displays port statistics for the selected device.
To view the Device Statistics display for a selected node, select the node and do one of
the following:
• Select Device Statistics from the Tools menu
• Right-click on the Device map node, then select Device Statistics from the pop-up
menu that appears
This starts the Real-Time Statistics applet in a new window, and displays port statistics
for the device associated with the selected Device map node.
See Chapter 11, for details on using this feature.
374
EPICenter Software Installation and User Guide
Device Information Views
Device Telnet
The Device Telnet function opens an EPICenter telnet window that is connected to the
selected device.
To open a telnet session for a selected device, select the appropriate device node and do
one of the following:
• Select Device Telnet from the Tools menu
• Right-click on the Device map node, then select Device Telnet from the pop-up
menu that appears
This starts a telnet session for the device in a new window.
See Chapter 7, for details on using this feature.
Device View
The Device View function runs the EPICenter ExtremeView applet, and displays the
device front-panel image and device information for the selected device.
To view the Device View for a selected node, select the node and do one of the
following:
• Select Device View from the Tools menu
• Right-click on the Device map node, then select Device View from the pop-up menu
that appears
This starts the ExtremeView applet in a new window and displays the front-panel
image and information for the device associated with the selected Device map node.
See Chapter 10, for details on using this feature.
Device VLANs
The Device VLANs function runs the VLAN Manager applet, and displays the VLAN
configurations for the selected device.
To view VLAN configuration information for a selected device, select the appropriate
device node and do one of the following:
• Select Device VLANs from the Tools menu
EPICenter Software Installation and User Guide
375
Network Topology Views
• Right-click on the Device map node, then select Device VLANs from the pop-up
menu that appears
This starts the VLAN Manager in a new browser window, showing information for the
selected device.
See Chapter 13, for details on using this feature.
Device Properties
The Device Properties function opens the Device Properties window and displays the
properties of the selected device.
To display properties for a selected device, select the appropriate device node and do
one of the following:
• Select Device Properties from the Tools menu
• Right-click on the Device map node, then select Device Properties from the pop-up
menu that appears
This opens a properties window for the selected device.
For information about the Device Properties window, see Chapter 4.
376
EPICenter Software Installation and User Guide
13 Using the VLAN Manager
This chapter describes how to use the VLAN Manager for:
• Viewing enterprise-wide, tagged and untagged VLAN information for Extreme
(Summit and BlackDiamond) switches managed by the EPICenter software
• Adding new tagged or untagged VLANs to Extreme devices, adding ports to those
VLANs, and modifying IP addresses
• Deleting VLANs
• Modifying VLANs
• Adding and deleting protocol filters
Overview of Virtual LANs
A Virtual LAN is a group of location- and topology-independent devices that
communicate as if they were on the same physical local area network (LAN). Extreme
Networks switches have a VLAN feature that enables you to construct broadcast
domains without being restricted by physical connections.
The VLAN Manager creates and manages VLAN for Extreme Networks devices only. It
does not handle other third-party devices, even though third-party devices can be
managed through the Inventory Manager.
If you run the EPICenter client with Administrator or Manager access, you can:
• Create and delete VLANs
EPICenter Software Installation and User Guide
377
Using the VLAN Manager
• Add or remove ports from existing VLANs
• Modify a VLAN’s IP address
• Enable/disable IP Forwarding
• Create and modify the protocol filters used to filter VLAN traffic
Extreme Networks switches can support a maximum of 3000 VLANs. VLANs on
Extreme Networks switches can be created according to the following criteria:
• Physical port
• 802.1Q tag
• Protocol sensitivity using Ethernet, LLC SAP, or LLC/SNAP Ethernet protocol filters
• A combination of these criteria
In the EPICenter system, a VLAN is defined uniquely by the following:
• Name
• 802.1Q tag (if defined)
• Protocol filters applied to the VLAN
As a result, multiple switches are shown as members of the same VLAN whenever all
the above are the same.
For a more detailed explanation of VLANs, see the ExtremeWare Software User Guide.
Displaying a VLAN
When you click the VLAN icon in the EPICenter Navigation Toolbar, the VLAN
Manager window is displayed, as shown in Figure 135.
378
EPICenter Software Installation and User Guide
Displaying a VLAN
Figure 135: VLAN Manager top-level view By VLAN, showing devices organized by
VLAN
The VLANs currently known to the EPICenter database are displayed in the
Component Tree on the left. The panel on the right shows summary information about
each VLAN.
NOTE
You must add switches to the EPICenter database through Discovery or by using the
Add function in the Inventory Manager. Until you add a switch to the database, you
cannot use EPICenter create any VLANs on that switch.
Information about VLAN configurations is obtained when a switch is added to the
database.
EPICenter Software Installation and User Guide
379
Using the VLAN Manager
The VLAN Manager can display information either by VLAN (showing all the switches
with ports that are members of a specific VLAN) or by switch (showing the VLANs that
have members on a specific switch).
• Select the By VLAN button to display VLANs at the first level of the Component
Tree. Listed under each VLAN is every switch that has the VLAN defined on it (see
Figure 135).
When the top level of the tree (the VLANs node) is selected, the right hand panel
displays a list of all VLANs configured on the Extreme Networks switches included
to the EPICenter database. The All VLANs display includes:
• Name—The VLAN name
• Tag—The VLAN tag value (if any) or “Untagged”
• Protocol—The protocol filter configured for the VLAN
Select an individual VLAN to view a summary of the configuration of the switches
and ports that are members of that VLAN.
• Select the By Switch button to display switches at the first level of the Component
Tree. Listed under each switch is every VLAN that is defined on the switch, as
shown in Figure 136.
When the top level of the tree (the Switches node) is selected, the right hand panel
displays a list of the Extreme Networks switches known to the EPICenter database
on which VLANs are configured.
380
EPICenter Software Installation and User Guide
Displaying a VLAN
Figure 136: VLAN Manager view By Switch, showing VLANs organized by device
The Devices view includes
• Name—The switch name
• Type—An icon representing the switch type.
Select an individual switch to list the VLANs that are configured on that switch.
Viewing VLANs on a Switch
To view all VLANs configured on an individual switch, select the switch in the
Component Tree of the By Switch view.
Figure 137 shows an example of the All VLANs on Switch view.
EPICenter Software Installation and User Guide
381
Using the VLAN Manager
Figure 137: VLAN topology shown by switch
The following information is displayed for each VLAN on the selected switch:
• Name—VLAN name
• Tag—VLAN tag
• Protocol—Protocol filter for the VLAN
• VLAN IP Addr—VLAN IP address
• VLAN IP Mask—VLAN IP Mask
• Ports—Ports on this switch in the VLAN
382
EPICenter Software Installation and User Guide
Displaying a VLAN
Viewing Switches in a VLAN
To view all devices configured with a specific VLAN, select the VLAN in the
Component Tree of the By VLAN view.
Figure 138 shows an example of the Devices in VLAN view.
Figure 138: VLANs present on the selected switch
Put info here about what is shown for each switch in the selected VLAN:
• Name—Device name
• Type—An icon representing the device Type
• VLAN IP Addr—IP address of the VLAN
• VLAN IP Mask—IP Mask for the VLAN
• Ports—Ports on this switch in the VLAN
EPICenter Software Installation and User Guide
383
Using the VLAN Manager
Viewing VLAN Member Ports
You can display details about the component ports of a VLAN by selecting a VLAN and
switch in the tree on the left. You can do this from either the By VLAN or By Switch
view. Once you have selected a VLAN and switch (or switch and VLAN) the panel on
the right displays detailed information about the ports in the selected VLAN and
switch, as shown in Figure 139.
Figure 139: VLAN member ports on a selected switch
The port details include the following information about each port:
• Port—The port number
• Type—The port type, shown as an icon. Different icons are used to represent the
port types:
10/100Mbps (
100Base-FX (
384
)
)
EPICenter Software Installation and User Guide
Displaying a VLAN
100Base-T/TX (
1000BASE-X (
)
)
Tagged ports are shown with a small orange tag (
)
Load-shared ports are indicated with a small green S (
)
• Speed—The port speed
• Duplex—The Duplex setting (Full or Half)
• State—The port state (Enabled or Disabled)
• Status—The port status (Ready or Active)
• Tagging—Whether the port is tagged or untagged
Viewing Device Information from Pop-up Menus
From a device entry in the Component Tree (in either the By Switch or By VLAN view)
you can select a VLAN or a device and right-click to display a pop-up menu. The
contents of the pop-up menu depend on the component you have selected:
• In the By VLAN view, select a VLAN and right-click to access the Modify VLAN
Membership command.
• In the By VLAN view, select a device and right-click to display a menu containing
the Modify VLAN Membership, Alarms, Browse, Statistics, Telnet, EView, and
Properties commands.
• In the By Switch view, select a device and right-click to display a menu containing
the Alarms, Browse, Statistics, Telnet, EView, and Properties commands.
• In the By Switch view, select a VLAN and right-click to access the Modify VLAN
Membership command.
The Modify VLAN Membership command lets you modify the VLAN membership of
the VLAN selected in the Component Tree. You cannot modify IP Forwarding behavior
or search for device connections.The Properties command displays the attributes for a
specific device group, device, slot, or port. The Alarms, Browse, Statistics, Telnet, and
EView commands perform the same functions as the applets in the Navigation Toolbar
to the left of the page, but with information displayed for the selected device.
EPICenter Software Installation and User Guide
385
Using the VLAN Manager
Modify VLAN Membership
The Modify VLAN Membership command lets you modify the VLAN membership of
the VLAN selected in the Component Tree. You cannot modify IP Forwarding behavior
or search for device connections. See “Modifying a VLAN from the Component Tree
Menu” on page 397 for details on using this command.
Alarms
The Alarms function runs the EPICenter Alarm System and displays the Alarm Browser
function to show the alarms for the selected device.
To view the Alarms display for a selected device:
• Right-click on the device, then select Alarms from the pop-up menu that appears
This starts the Alarm System applet in a new window. The Alarm System displays the
Alarm Log Browser and displays the alarms for the selected device.
See Chapter 5 for details on using this feature.
Browse
The Device Browse function runs the ExtremeWare Vista switch management interface
for the selected device.
To run ExtremeWare Vista for a selected device:
• Right-click on the device, then select Browse from the pop-up menu that appears
This starts the ExtremeWare Vista login page in a new window.
Refer to the ExtremeWare Software User Guide for details on using ExtremeWare Vista.
Statistics
The Device Statistics function runs the EPICenter Real-Time Statistics applet and
displays port statistics for the selected device.
To view the Device Statistics display for a selected device:
• Right-click on the device, then select Device from the pop-up menu that appears
This starts the Real-Time Statistics applet in a new window and displays port statistics
for the selected device.
386
EPICenter Software Installation and User Guide
Displaying a VLAN
See Chapter 11 for details on using this feature.
Telnet
The Telnet function opens an EPICenter telnet window that is connected to the selected
device.
To open a telnet session for a selected device:
• Right-click on the device, then select Telnet from the pop-up menu that appears
This starts a telnet session for the device in a new window.
See Chapter 7 for details on using this feature.
EView
The EView function runs the EPICenter ExtremeView applet and displays the device
front-panel image and device information for the selected device.
To view the EView for a selected device:
• Right-click on the device, then select EView from the pop-up menu that appears
This starts the ExtremeView applet in a new window and displays the front-panel
image and information for the selected device.
See Chapter 10 for details on using this feature.
Properties
The Properties function lets you view the attributes for a selected device. The Device
Properties window has three tabs at the top of the window:
• Device
• VLAN
• STP
Each tab displays the name of the device and a status “light” which shows the status of
the device as detected by EPICenter.
The Device Tab. The Device tab displays information about the device such as its IP
address, MAC address, and boot time. The main section of the window presents the
EPICenter Software Installation and User Guide
387
Using the VLAN Manager
same information you can view in the Inventory Manager for the device. If the device is
an Extreme device, the ExtremeWare software running in the switch provides
comprehensive status information.
The VLAN Tab. The VLAN tab lists the VLANs configured on the device.
The STP Tab. The STP tab lists the Spanning Tree domains (STPDs) configured on the
device. There may be more than one entry per STPD if the domain includes multiple
VLANs.
For more details about the Device Properties window, see“Device Properties” on
page 124 in Chapter 4.
Adding a VLAN
Users with Administrator or Manager access can create VLANs on the Extreme
Networks switches managed by the EPICenter software. If you have Monitor access
only, you can not use this function.
To add a new VLAN, do the following:
1 Click the Add button in the VLAN Manager Toolbar.
The Add VLAN dialog box, Properties & Ports page is displayed, as shown in
Figure 140.
388
EPICenter Software Installation and User Guide
Adding a VLAN
Figure 140: Add VLAN dialog, Properties and Ports page
2 Enter a descriptive name for the VLAN. The name must begin with a letter followed
by up to 31 characters. See the ExtremeWare Software User Guide for details on VLAN
naming.
3 Select an entry from the pull-down Protocol Filter list. This selection determines
what protocol (if any) is used to determine membership in this VLAN. If you do not
want to specify a protocol, select ANY. This means the filtering rules will match all
unfiltered protocols.
4 If the VLAN is to be tagged, enter a 802.1Q tag value in the Tag field. The tag value
can be a number between 2 and 4095. By entering a tag number, you enable tagging
for this VLAN. Enter the text “untagged” or 0 (zero) to indicate that the VLAN is to
be untagged.
5 To add a port to the VLAN, first select the switch from the Available Switches list.
This displays a list of ports on the switch that are available to be included in the
VLAN.
NOTE
The Available Ports list does not include ports configured as slave load sharing
ports.
EPICenter Software Installation and User Guide
389
Using the VLAN Manager
6 Select one or more ports from the Available Ports list.
7 Click Tagged to add the port as a tagged port. Click Untagged to add the port as an
untagged port.
If this is an untagged VLAN, you are not able to add a tagged port.
If you add a port untagged, EPICenter must remove it from any other VLAN that
includes the port as an untagged member and that uses the same protocol as the
VLAN to which you are adding the port. EPICenter will warn you and let you
confirm that this is what you want.
You can add a switch to a VLAN as a unit—just select the switch without selecting
any ports, and click Tagged or Untagged to add the switch to the VLAN.
8 To remove a port from the VLAN, select the port from the Ports in VLAN list, and
then click Remove.
9 After you add a device and port to the VLAN, you can use the Connect Device
button to determine whether that port can connect to the other members of the
VLAN.
• Select the device you want to check.
• Click the Connect Device button.
If EPICenter can find a path from the device and port to another member of the
VLAN, it opens a Connection Information window that displays information about
the path, as shown in Figure 141.
390
EPICenter Software Installation and User Guide
Adding a VLAN
Figure 141: Connection Information window
If additional ports or devices and ports must be added to create a path, EPICenter
lists the ports needed, and offers to add them to the VLAN.
• Click Yes to add the ports.
• Click No to close the Connection Information window without adding the ports.
If EPICenter cannot find a path, it displays an error window.
10 When you have finished adding ports to the VLAN, click Apply to implement the
changes.
The VLAN is created on the switches whose ports are members of the new VLAN.
Once you have added a VLAN, you can specify an IP address and mask for the VLAN
on each switch, and also enable or disable IP Forwarding.
1 Select the IP Forwarding tab at the top of the Add VLAN window.
The IP Forwarding page is displayed, as shown in Figure 142.
EPICenter Software Installation and User Guide
391
Using the VLAN Manager
Figure 142: Add VLAN dialog, IP Forwarding page
2 Select a switch from the table of switches.
3 Enter an IP address and IP mask. Click the Enable IP Forwarding check box to
enable IP forwarding for this VLAN on the switch.
4 Click Apply to implement the changes.
5 Click Close to exit the window.
Deleting a VLAN
Users with Administrator or Manager access can delete VLANs from Extreme Networks
switches managed by the EPICenter software. If you have only Monitor access, you
cannot use this function.
To delete a VLAN, follow these steps:
1 Click the Delete button in the VLAN Manager Toolbar.
The Delete VLAN dialog is displayed, as shown in Figure 143.
392
EPICenter Software Installation and User Guide
Modifying a VLAN
Figure 143: The Delete VLAN page
2 Select the VLAN you want to delete.
3 Click Delete.
The VLAN is deleted from all the switches on which it exists.
4 Click Close to exit the window.
Modifying a VLAN
Users with Administrator or Manager access can modify the properties of a VLAN, and
add and remove ports from the VLAN. If you have only Monitor access, you can not
use this function.
You can start the Modify VLAN process in two ways:
• Click the Modify icon in the VLAN Manager toolbar.
Using this method you can modify both the VLAN membership (devices and ports)
and properties (tag and protocol filter) and modify the IP Forwarding behavior. You
can also search for device connections between devices in the VLAN.
EPICenter Software Installation and User Guide
393
Using the VLAN Manager
If you select a VLAN before you click the Modify button, the Modify VLAN window
will contain information on the VLAN you selected. If you do not select a VLAN
beforehand, you can select one from within the Modify VLAN window.
See “Modifying a VLAN from the Toolbar” on page 394 for details.
• Select a VLAN in the Component Tree, right-click to display the pop-up menu, and
select Modify VLAN Membership.
Using this method you can modify only the VLAN membership of the VLAN
selected in the Component Tree. You cannot modify IP Forwarding behavior or
search for device connections. See “Modifying a VLAN from the Component Tree
Menu” on page 397 for details.
Modifying a VLAN from the Toolbar
To start the Modify VLAN process from the Toolbar, follow these steps:
1 Click the Modify button in the VLAN Manager Toolbar.
The Modify VLAN dialog, Properties & Ports page is displayed, as shown in
Figure 144.
Figure 144: The Modify VLAN dialog, Properties and Ports page
394
EPICenter Software Installation and User Guide
Modifying a VLAN
2 Select a VLAN from the drop-down list in the VLAN Name field.
The current values for the VLAN are displayed.
NOTE
The Ports in VLAN list does not display SummitLink ports, because you cannot
modify them.
3 To change the Protocol Filter selection, select a different entry from the pull-down
Protocol Filter list.
4 To change the VLAN tag, type a new value into the Tag field.
To disable tagging for the VLAN, type “untagged” or 0 (zero) into the Tag field.
5 To remove a port from the VLAN, select the port in the Ports in VLAN list, and click
Remove.
6 To add a port to the VLAN, first select the switch from the Available Switches list.
This displays a list of ports on the switch that are available to be included in the
VLAN.
NOTE
The Available Ports list does not include ports configured as slave load sharing
ports.
7 Select one or more ports from the Available Ports list.
8 Click Tagged to add the ports as a tagged ports. Click Untagged to add the ports as
an untagged ports.
If this is an untagged VLAN, you cannot add a tagged port. The tagged button will
be greyed out in this case.
If you add a port untagged, EPICenter must remove it from any other VLAN that
includes the port as an untagged member and that uses the same protocol as the
VLAN to which you are adding the port. EPICenter will warn you and let you
confirm that this is what you want.
You can add a switch to a VLAN as a unit—just select the switch without selecting
any ports, and click Tagged or Untagged to add the switch to the VLAN.
9 After you add a device and port to the VLAN, you can use the Connect Device
button to determine whether that port can connect to the other members of the
VLAN.
EPICenter Software Installation and User Guide
395
Using the VLAN Manager
• Select the device you want to check.
• Click the Connect Device button.
If EPICenter can find a path from the device and port to another member of the
VLAN, it opens a Connection Information window that displays information about
the path, as shown in Figure 141.
If additional ports or devices and ports must be added to create a path, EPICenter
lists the ports needed, and offers to add them to the VLAN.
• Click Yes to add the ports.
• Click No to close the Connection Information window without adding the ports.
If EPICenter cannot find a path, it displays an error window.
10 When you have finished adding and removing ports, click Apply to implement the
changes.
If all ports of a switch are removed from the VLAN, the VLAN is deleted from that
switch.
If a port on a new switch is added to the VLAN, then the VLAN is created on that
switch.
11 To modify the IP address and mask for a VLAN on a switch, and to enable or
disable IP Forwarding, select the IP Forwarding tab at the top of the Add VLAN
window.
The IP Forwarding page is displayed, as shown in Figure 142.
396
EPICenter Software Installation and User Guide
Modifying a VLAN
Figure 145: The Modify VLAN dialog, IP Forwarding page
12 Select a switch from the table of switches.
13 Change the IP address and IP mask as appropriate. Click the Enable IP forwarding
check box to enable or disable IP forwarding for this VLAN on the switch.
14 Click Apply to implement the changes.
15 Click Close to exit the window.
Modifying a VLAN from the Component Tree Menu
To start the Modify VLAN process for a VLAN in the Component Tree, follow these
steps:
1 Select a VLAN in the Component Tree.
2 Right-click to display the pop-up menu, and select Modify VLAN Membership.
The Modify Membership of VLAN dialog opens, as shown in Figure 146.
EPICenter Software Installation and User Guide
397
Using the VLAN Manager
Figure 146: Modify Membership of VLAN window
3 To add a port to the VLAN, first select the switch in the Component Tree on the left.
The Resource Table displays a list of ports on the selected switch that are available to
be included in the VLAN.
NOTE
The list of port resources does not include ports configured as slave load sharing
ports.
4 Select one or more ports from the port resources list.
5 Click Add Tagged to add the port as a tagged port. Click Add Untagged to add the
port as an untagged port.
If this is an untagged VLAN, you cannot add a tagged port. The tagged button will
be greyed out in this case.
NOTE
If you add a port untagged, EPICenter automatically removes it from any other VLAN
that includes the port as an untagged member and that uses the same protocol as
the VLAN to which you are adding the port.
398
EPICenter Software Installation and User Guide
Adding and Deleting Protocol Filters
You can add a switch to a VLAN as a unit—just select the switch without selecting
any ports, and click Add Tagged or Add Untagged to add the switch to the VLAN.
6 To remove ports from the VLAN, select one or more ports in the Current VLAN Port
Members list, and click Remove.
7 To remove all ports from the VLAN, click Remove All.
8 When you are finished making changes, click OK. To cancel all changes, click
Cancel.
Adding and Deleting Protocol Filters
Users with Administrator or Manager access can view, add, and delete protocol filter
definitions. If you have Monitor access, you can view filter definitions, but not add or
delete them.
To view, delete, or add protocol filter definitions, do the following:
1 Click Protocol Filters in the VLAN Manager.
The View/Delete page of the Protocol Panel dialog box is displayed, as shown in
Figure 147.
Figure 147: Protocol Panel dialog box, View/Delete page
.
EPICenter Software Installation and User Guide
399
Using the VLAN Manager
This page shows all the protocol filters configured within the EPICenter database.
Any filters that are in use by a VLAN are indicated with an asterisk (*) in the In Use
column.
2 To delete a protocol filter, select a filter in the list, and click Delete.
This deletes the protocol filter from all Extreme Networks switches managed by the
EPICenter software, as well as from the EPICenter database.
NOTE
If a filter is in use by a VLAN, you cannot delete it.
3 Click Close to exit the window.
To add a protocol filter, follow these steps:
1 Click the Add tab at the top of the Protocol Panel dialog box to display the Add
Protocol page, as shown in Figure 148.
Figure 148: Protocol Panel dialog box, Add Protocol page
.
2 Enter a descriptive name for the Protocol. The name must begin with a letter
followed by up to 31 characters. See the ExtremeWare Software User Guide for details
on naming.
3 Select a protocol type from the pull-down list in the type column.
4 Type a corresponding four-digit hexadecimal filter value in the value field.
5 Repeat steps 3 and 4 to enter up to six type-value pairs.
400
EPICenter Software Installation and User Guide
Adding and Deleting Protocol Filters
6 When you have finished entering the definition, click Add to add the new protocol
filter to the EPICenter database.
NOTE
The protocol filter is now available to be used on any switch, but is not created on
any switches at this time. The protocol filter is created on a switch only when you
create or modify a VLAN to use the new protocol filter on that switch. The database
acts as a collective store for network data without needing to replicate it on every
switch.
7 Click Close to exit the window.
EPICenter Software Installation and User Guide
401
Using the VLAN Manager
402
EPICenter Software Installation and User Guide
14 The Spanning Tree Monitor
This chapter describes how to use the EPICenter Spanning Tree Monitor module for:
• Viewing the configuration and status of STP domains
• Viewing the status and configuration of VLANs associated with an STP domain
• Viewing the status and configuration of devices and ports associated with an STP
domain
NOTE
In order for the EPICenter server to acquire information about a device’s STPD
configuration, that device must be running ExtremeWare 6.2.2 or later. Prior to version
6.2.2, the ExtremeWare SNMP agent did not provide Spanning Tree information.
Overview of the Spanning Tree Monitor
The EPICenter Spanning Tree Monitor module displays information about STP domains
at the domain, VLAN, device, and port levels.
STP is a bridge-based mechanism for providing fault tolerance on networks. In the
Extreme Networks implementation of STP, a switch can be partitioned into multiple
virtual bridges. Each virtual bridge can run an independent Spanning Tree instance,
called a Spanning Tree Domain (STPD). Each STP domain has its own root bridge and
active path. After an STPD is created, one or more VLANs can be assigned to it,
depending on the mode of the ports.
EPICenter Software Installation and User Guide
403
The Spanning Tree Monitor
The default switch configuration includes a single STP domain called s0. The default
VLAN is a member of STPD s0.
STP ports can run in one of three modes:
• 802.1D mode. which conforms to the IEEE 802.1D standard.
• Extreme Multiple Instance Spanning Tree Protocol (EMISTP) mode, an Extreme
implementation of STP that allows a port to belong to multiple STP domains. This is
the default on Extreme switches.
• Enhanced Per-VLAN Spanning Tree Protocol (PVST+) mode, an STP implementation
widely deployed on many vendors’ switches, that is interoperable with 802.1Q
spanning tree.
A physical port can belong to multiple STPDs through membership in multiple VLANs,
if the port is in EMISTP mode. In addition, a single VLAN can span multiple STPDs.
STP configuration must be done through the EPICenter Telnet applet or through the
ExtremeWare command line interface. The STP monitor displays summary and detailed
STP configuration information about the devices being managed by the EPICenter
server. It allows you to view STP configuration information network-wide rather than
only device by device as is the case through the ExtremeWare CLI.
The EPICenter server receives STP topology information through traps from the SNMP
agent in the switch, and through polling. Not all STP-related changes generate
traps—for example, updating the root port and path cost for the previous root when the
root changes. The EPICenter server relies on device polling to detect these types of
changes. However, device polling by default is only done every 90 minutes, so if you
want STP status updated more frequently, you may want to group your STP devices
into their own device group and change the polling interval to a more appropriate
interval.
For more details on STP, see the ExtremeWare Software User Guide.
404
EPICenter Software Installation and User Guide
Displaying STP Domain Information
Click the STP button in the EPICenter Navigation Toolbar to run the Spanning Tree
Monitor module. The STP Domains window appears, as shown in Figure 149.
Figure 149: STP Domains view
This view, displayed when the root node of the Component Tree is selected, shows
information about the STP domains configured on the devices managed by the
EPICenter server that are running ExtremeWare 6.2.2 or later.
Under the root node the Component Tree displays all the STP domains identified by the
EPICenter server. The VLANs included in the domain are listed as subcomponents of
the domain. The VLANs in turn show the devices with ports that are members of the
VLAN within the domain.
EPICenter Software Installation and User Guide
405
The Spanning Tree Monitor
NOTE
Devices running earlier versions of ExtremeWare may also have Spanning Tree
domains configured and enabled, but the EPICenter server is unable to obtain
information about these domains.
The information presented for each STP domain includes:
• Name: The name of the STP domain.
• Tag: The 802.1Q tag of one of the wholly-contained VLANs in the domain.
• Root: The device name, IP address, or MAC address of the device configured as the
designated root of this STP domain. If STP is disabled for this domain, this field is
blank.
• Root Max Age: The maximum allowable age for STP information learned by the root
for this domain. If this age is reached, the current information is discarded and the
Spanning Tree is recalculated. Value is in seconds.
• Root Hello Time: The interval between transmission of Configuration BPDUs by the
root for this domain. Value is in seconds.
• Root Forward Delay: The forward delay time being used by the root for this
domain. The forward delay is the time that a bridge remains in the learning and
listening states, not forwarding data. Value is in seconds.
• VLANs: The number of VLANs participating in this domain.
• Devices: The number of devices participating in this domain.
• Ports: The total number of ports participating in this domain, if the domain is
enabled.
NOTE
If an untagged STP domain spans multiple switches and is configured with different
tags on different switches, it may appear as separate STP domains in EPICenter’s STP
Monitor.
406
EPICenter Software Installation and User Guide
Displaying STP VLAN Configurations
Select a specific STP domain in the Component Tree to view summary information
about the VLANs in the selected domain. When you select an STP domain, the STP
VLAN view appears, as shown in Figure 150.
Figure 150: STP VLANs view
This view shows information about the VLANs in the selected domain.
The information presented for each VLAN in the domain includes:
• Name: The name of the VLAN.
• Devices: The number of devices participating in this VLAN for this domain.
• Ports: The number of ports participating in this VLAN in this domain, if the domain
is enabled. This will be zero if the STP domain is disabled on the bridge.
EPICenter Software Installation and User Guide
407
The Spanning Tree Monitor
The panel at the bottom of this view shows summary information about the STP
domain in which these VLANs are included.
Displaying STP Device Configurations
Select a specific STP VLAN in the Component Tree to view summary information about
the devices in the selected VLAN that participate in the STP domain. When you select a
VLAN, the STP Devices view appears, as shown in Figure 151.
Figure 151: STP Devices view
This view shows information about the devices participating in the selected VLAN
within this domain.
The information presented for each device includes:
• Name: The name of the device.
408
EPICenter Software Installation and User Guide
• State: The state of STP on this domain (enabled or disabled). If disabled, most of the
remaining fields are zero.
• Configured Tag: The 802.1Q tag of one of the VLANs in the domain, as configured
by the user.
• Root: Indicates whether this device is currently the STP root bridge for this domain
(Yes or No).
• Root Port: The port with the best path to the root bridge. It this device is the root
bridge, this will be zero.
• Root Path Cost: The cost of the path from this bridge to the root bridge. If this
device is the root bridge, the cost will be zero.
• Designated Bridge: Indicates whether this device is a designated bridge (transmits
configuration BPDUs to other bridges on any of its ports).
• Priority: The bridge priority of this bridge for this STP domain.
• Max Age: The maximum allowable age for STP information as determined by the
root for this domain. If this age is reached, the current information is discarded and
the Spanning Tree is recalculated. Value is in seconds.
• Hello Time: The interval between transmission of Configuration BPDUs by the root
for this domain. Value is in seconds.
• Forward Delay: The actual forward delay time as determined by the root for this
STP domain. Value is in seconds.
• Hold Time: The time during which no more than two configuration BPDUs can be
transmitted by this node. Value is in seconds.
• Last Topology Change: The time, in seconds, since the last topology change was
detected by this bridge for this STP domain.
• Ports: The number of ports on this bridge participating in this VLAN in this domain,
if the domain is enabled. This will be zero if the STP domain is disabled on the
bridge.
The panel at the bottom of this view shows summary information about the STP
domain and VLAN with which these devices are associated.
EPICenter Software Installation and User Guide
409
The Spanning Tree Monitor
Displaying STP Port Information
Select a device in the Component Tree to view information about the ports on the
device that are members of the selected VLAN and STP domain. When you select a
device, the STP Ports view appears, as shown in Figure 152.
Figure 152: STP Ports view
This view shows information about ports on the selected device that are participating in
an enabled STP domain. The information presented for each port includes:
• Port: The device and port number.
• STP State: Whether STP is enabled or disabled on this port.
• State: The state of the port: Disabled, Blocking, Listening, Learning, or Forwarding
• Mode: The port mode (802.1D, PVST or EMISTP).
• Priority: The port priority of this port in this STP domain.
410
EPICenter Software Installation and User Guide
• Port Cost: This port’s contribution to the cost of the path from this port to the root
bridge for this STP domain.
• Designated Cost: The total cost of the path from this port (the Designated Port) to
the root bridge for this STP domain.
• Link: The switch and port at the other side of the link.
The panel at the bottom of this view shows summary information about the STP
domain, VLAN and device with which these ports are associated.
NOTE
If the domain is disabled, the port table will be empty.
Viewing STP Domain Properties from Pop-Up
Menus
You can right-click on a STP Domain entry or a VLAN entry in the Component Tree to
display the Properties command.
• To view properties for an STP Domain, right-click on an STP Domain name, then
click Properties.
• To view properties for a VLAN, right-click on a VLAN name, then click Properties.
• To view properties for a device, right-click to display a menu containing Alarms,
Browse, Eview, Statistics, Telnet, VLANs, and Properties commands.
STP Properties
The STP Properties window displays the following information:
• Name: The name of the STP domain.
• Tag: The 802.1Q tag of one of the wholly-contained VLANs in the domain.
• Root: The device name, IP address, or MAC address of the device configured as the
designated root of this STP domain. If STP is disabled for this domain, this field is
blank.
EPICenter Software Installation and User Guide
411
The Spanning Tree Monitor
• Root Max Age: The maximum allowable age for STP information learned by the root
for this domain. If this age is reached, the current information is discarded and the
Spanning Tree is recalculated. Value is in seconds.
• Root Hello Time: The interval between transmission of Configuration BPDUs by the
root for this domain. Value is in seconds.
• Root Forward Delay: The forward delay time being used by the root for this
domain. The forward delay is the time that a bridge remains in the learning and
listening states, not forwarding data. Value is in seconds.
• Number of VLANs: The number of VLANs participating in this domain.
• Number of Devices: The number of devices participating in this domain.
• Number of Ports: The total number of ports participating in this domain, if the
domain is enabled.
Click OK to close the window.
VLAN Properties
The VLAN Properties window displays the following information:
• Name: The VLAN name
• Tag: The VLAN tag value (if any) or “Untagged”
• Protocol: The protocol filter configured for the VLAN
Click OK to close the window.
The Device Pop-Up Menu
When you right-click on a device in the Component Tree, the pop-up menu contains
Alarms, Browse, Eview, Statistics, Telnet, VLANs, and Properties commands.
Alarms
The Alarms function runs the EPICenter Alarm System and displays the Alarm Browser
function to show the alarms for the selected device.
To view the Alarms display for a selected device:
• Right-click on the device, then select Alarms from the pop-up menu that appears
412
EPICenter Software Installation and User Guide
This starts the Alarm System applet in a new window. The Alarm System displays the
Alarm Log Browser and displays the alarms for the selected device.
See Chapter 5 for details on using this feature.
Browse
The Device Browse function runs the ExtremeWare Vista switch management interface
for the selected device.
To run ExtremeWare Vista for a selected device:
• Right-click on the device, then select Browse from the pop-up menu that appears
This starts the ExtremeWare Vista login page in a new window.
Refer to the ExtremeWare Software User Guide for details on using ExtremeWare Vista.
EView
The EView function runs the EPICenter ExtremeView applet and displays the device
front-panel image and device information for the selected device.
To view the EView for a selected device:
• Right-click on the device, then select EView from the pop-up menu that appears
This starts the ExtremeView applet in a new window and displays the front-panel
image and information for the selected device.
See Chapter 10 for details on using this feature.
Statistics
The Device Statistics function runs the EPICenter Real-Time Statistics applet and
displays port statistics for the selected device.
To view the Device Statistics display for a selected device:
• Right-click on the device, then select Device from the pop-up menu that appears
This starts the Real-Time Statistics applet in a new window and displays port statistics
for the selected device.
See Chapter 11 for details on using this feature.
EPICenter Software Installation and User Guide
413
The Spanning Tree Monitor
Telnet
The Telnet function opens an EPICenter telnet window that is connected to the selected
device.
To open a telnet session for a selected device:
• Right-click on the device, then select Telnet from the pop-up menu that appears
This starts a telnet session for the device in a new window.
See Chapter 7 for details on using this feature.
VLANs
The VLANs function runs the EPICenter VLANs applet and displays the VLANs
currently known to the EPICenter database.
To view the VLANs for a selected device:
• Right-click on the device, then select VLANs from the pop-up menu that appears
This starts the VLAN applet in a new window and displays the VLANs currently know
to the EPICenter database.
See Chapter 13 for details on using this feature.
Properties
The Properties function lets you view the attributes for a selected device. The Device
Properties window has three tabs at the top of the window:
• Device
• VLAN
• STP
Each tab displays the name of the device and a status “light” which shows the status of
the device as detected by EPICenter.
The Device Tab. The Device tab displays information about the device such as its IP
address, MAC address, and boot time. The main section of the window presents the
same information you can view in the Inventory Manager for the device. If the device is
an Extreme device, the ExtremeWare software running in the switch provides
comprehensive status information.
414
EPICenter Software Installation and User Guide
The VLAN Tab. The VLAN tab lists the VLANs configured on the device.
The STP Tab. The STP tab lists the Spanning Tree domains (STPDs) configured on the
device. There may be more than one entry per STPD if the domain includes multiple
VLANs.
For more details about the Device Properties window, see“Device Properties” on
page 124 in Chapter 4.
EPICenter Software Installation and User Guide
415
The Spanning Tree Monitor
416
EPICenter Software Installation and User Guide
15 The ESRP Manager
This chapter describes how to use the EPICenter ESRP Manager applet for:
• Viewing the status of ESRP-enabled VLANs and the ESRP-enabled switches in those
VLANs
Overview of the ESRP Manager
The Extreme Standby Router Protocol (ESRP) is a feature of ExtremeWare that allows
multiple switches to provide redundant layer 3 routing services, as well as layer 2
redundancy, to users. The ESRP Manager displays the status of ESRP-enabled VLANs
and the ESRP-enabled switches in those VLANs. You can view a summary status for all
the ESRP-enabled VLANs being monitored by EPICenter. You can also view detailed
information for an individual ESRP-enabled VLAN and the switches in those VLANs.
NOTE
This chapter does not discuss ESRP functionality in any detail. For more information
about ESRP, see the ExtremeWare Software User Guide, versions 6.0 or later.
To start the ESRP Manager applet, click the ESRP button in the EPICenter Navigation
Toolbar. The ESRP Manager applet appears, initially displaying a summary status of the
ESRP-enabled VLANs known to EPICenter, as shown in Figure 153.
EPICenter Software Installation and User Guide
417
The ESRP Manager
Figure 153: ESRP Manager showing summary ESRP-enabled VLAN status
This display shows a summary of the ESRP configuration for each ESRP-enabled
VLAN.
The information displayed is as follows:
• VLAN Name—The name of the ESRP-enabled VLAN.
• Master Switch—The name, if known, or MAC address of the switch currently
designated as the Master switch. If this switch is being managed by EPICenter (is
included in EPICenter’s Inventory database) the name will appear. If the switch is
not known to EPICenter, the MAC address will appear.
• IP Address—The IP address of the ESRP-enabled VLAN. If the master switch is not
known to EPICenter, this will be “N/A.”
• Group—The ESRP group to which this ESRP-enabled VLAN belongs in a broadcast
domain that contains multiple instances of ESRP (multiple ESRP groups). The names
of the ESRP-enabled VLANs participating in the same group must be identical.
418
EPICenter Software Installation and User Guide
Viewing ESRP Detail Information
• Election Algorithm—The ESRP election algorithm in use for this VLAN. The
election algorithm determines the order of precedence of the election factors used to
determine the ESRP Master. The election factors are:
— Ports: the number of active ports (the switch with the highest number takes
priority)
— Track: whether the switch is using ESRP tracking (a switch using tracking has
priority)
— Priority: a user-defined priority number between 0 and 254 (a higher number has
higher priority)
— MAC: the switch MAC address (a higher-number address has priority)
The election algorithm can be one of the following:
— ports_track_priority_mac (the default): This algorithm considers active ports
first, then tracking, then priority, then the MAC address to determine the ESRP
Master. This is the only algorithm supported for ExtremeWare releases prior to
version 6.0
— track_ports_priority_mac
— priority_ports_track_mac
— priority_track_ports_mac
— priority_mac_only: only considers priority and the MAC address
See the ExtremeWare Software User Guide, version 6.1 or later, for details.
NOTE
The ESRP election algorithm must be identical on all switches in an ESRP group. If
it is not, serious problems may arise.
• Hello Timer—This is the interval, in seconds, for exchanging keep-alive packets
between the ESRP switches for this ESRP-enabled VLAN. Also known as the ESRP
timer. The default is 2 seconds.
Viewing ESRP Detail Information
You can display detailed ESRP information for the switches in an individual
ESRP-enabled VLAN by clicking on the VLAN name in the Component Tree in the
EPICenter Software Installation and User Guide
419
The ESRP Manager
left-hand panel of the window. This displays a status window similar to the one shown
in Figure 154.
Figure 154: ESRP detail for an individual ESRP-enabled VLAN
ESRP trap events will also be recorded in the EPICenter Event Log, which you can view
using the EPICenter Event Log Report (see Chapter 17 ). ESRP state change traps will be
recorded in the EPICenter Alarm Log (see Chapter 5 ).
NOTE
ESRP Traps are not implemented in ExtremeWare versions 4.x or 5.x. Thus, for
switches running those versions of ExtremeWare, state changes and other ESRP
updates will only be reflected after the next device polling interval.
Note that an ESRP-enabled VLAN can be monitored by EPICenter as long as at least
one of its ESRP-enabled switches is managed by EPICenter (i.e. is included in
420
EPICenter Software Installation and User Guide
Viewing ESRP Detail Information
EPICenter’s device database). If there are other ESRP-enabled switches in that VLAN,
their ESRP status will also be displayed in the ESRP Manager, even if they are not being
managed by EPICenter.
The Detailed ESRP Information view displays the following information:
• Switch Name—The name of the switch, if known. (If the switch is not being
managed by EPICenter, this field will contain “N/A.”)
• MAC—The MAC address of this switch.
• State—The current state of the switch—Master or Slave.
• Priority—A user-defined value, between 0 and 254, which can be used by the ESRP
election algorithm in determining which switch is the Master switch. The default is
0.
• To Master—The number of times this switch has transitioned to become a Master.
• To Slave—The number of times this switch has transitioned to become a Slave.
NOTE
The number of Master and Slave transitions cannot be obtained from versions of
ExtremeWare prior to version 6.1.6. For switches running earlier versions of
ExtremeWare, the display defaults to “N/A.”
NOTE
If some of the ESRP-enabled switches in an ESRP-enabled VLAN are not managed
by EPICenter, the ToMaster and ToSlave values for those switches will not be
updated until the next device polling interval.
• Active Ports—The number of active ports in this ESRP-enable VLAN.
• Tracked Ports—The number of tracked ports that are currently active.
• Tracked Routes—The number of tracked IP routes that are currently active.
• Tracked Pings—The number of tracked ping responders that are responding
successfully.
EPICenter Software Installation and User Guide
421
The ESRP Manager
NOTE
The number of Tracked Pings cannot be obtained from versions of ExtremeWare
prior to version 6.1.6. For switches running earlier versions of ExtremeWare, the
display defaults to zero.
422
EPICenter Software Installation and User Guide
16 Administering EPICenter
This chapter describes how to use the Administration applet for the following:
• Changing your own user password, for users without Administration access
• Adding and deleting EPICenter users
• Setting and modifying user permissions for both the EPICenter and ExtremeWare
software
• Configuring the EPICenter server as a RADIUS client or a RADIUS server for user
authentication
• Enabling or disabling EPICenter Syslog receiver functionality
• Modifying EPICenter server properties to change settings such as polling rates,
time-outs, port assignments and other similar settings
• Configuring EPICenter for a distributed server configuration
Overview of User Administration
In order to log in to the EPICenter server and use its management features, you must
have a user name and password. An EPICenter administrator can create and modify
EPICenter user accounts, passwords, and account permissions through the
Administration applet. Individual users, regardless of their access permissions, can
change their own password using the Administration applet.
The EPICenter server and its Remote Authentication Dial In User Service (RADIUS)
server can be used for user authentication, both for EPICenter server access and
EPICenter Software Installation and User Guide
423
Administering EPICenter
Extreme Networks switch access. The Administration applet provides an interface for
configuring the RADIUS server.
Finally, the Administration applet provides an interface that allows an EPICenter
administrator to modify a number of properties that affect the performance and
configuration of the EPICenter server. These properties are stored in the EPICenter
database along with other EPICenter data.
Controlling EPICenter Access
The EPICenter server provides three levels of access to EPICenter functions:
• Monitor — users who can view status information and statistics.
• Manager — users who can modify device parameters as well as view status
information and statistics.
• Administrator — users who can create, modify and delete user accounts as well as
perform all the functions of a user with Manager access.
The EPICenter server provides two default users:
• “admin” with Administrator access
• “user” with Monitor access
The two default users do not initially have passwords. All other user names must be
added and enabled by an Administrator user.
Regardless of your access level, you can run the Administration applet and change your
own password. Users with Administrator access can add and delete users and assign
user access levels.
NOTE
The EPICenter user accounts are separate from the Extreme switch user accounts. You
can configure both through the EPICenter software, or you can have switch access
independently of the EPICenter software.
ExtremeWare Software Access
Through the EPICenter software, two levels of access to Extreme switches can be
enabled:
424
EPICenter Software Installation and User Guide
Starting the EPICenter Client for the First Time
• User — users who can view device status information and statistics, but cannot
modify any parameters.
• Administrator — users who can modify device parameters as well as view status
information and statistics.
These permissions enable access to Extreme Networks switches through Telnet or
ExtremeWare Vista. The use of the RADIUS server avoids the need to maintain user
names, passwords, and access permissions in each switch, and instead centralizes the
configuration in one location in the EPICenter server.
The EPICenter RADIUS Server
The EPICenter software incorporates a basic RADIUS server for user authentication.
RADIUS provides a standard way for the EPICenter software and Extreme Networks
switches to handle user authentication, permitting the unification of the Extreme
Networks CLI, ExtremeWare Vista, and EPICenter user authentication. The EPICenter
server can be configured to act either as a RADIUS server or a RADIUS client. RADIUS
authentication is disabled by default.
ExtremeWare versions 4.1 and later support the RADIUS server for authentication and
can act as RADIUS clients.
Setting EPICenter Server Properties
The server properties interface allows an EPICenter administrator to modify a number
of parameters that affect server performance and function. These include
communication parameters such as polling intervals, time-outs, port usage, number of
retries, setting Scalability mode, and a number of other parameters.
Starting the EPICenter Client for the First Time
The two default users, admin and user, do not initially have passwords.
It is strongly recommended that you log in the first time with the user name admin,
and immediately change the admin password. You can then add other users with
Manager, Monitor, or Administrator access.
To run the EPICenter client interface for the first time:
EPICenter Software Installation and User Guide
425
Administering EPICenter
1 Launch the EPICenter client.
The EPICenter Login page appears.
2 Select or enter the host name or IP address and port of the EPICenter server.
3 Type the user name admin in the User field.
4 Leave the Password field empty.
5 Click Login. The Network Summary Report page appears.
6 Click Admin in the Navigation Toolbar to access the Administration functions of the
EPICenter server.
The User Administration page appears, as shown in Figure 155. The only users are
“admin” and “user.”
Figure 155: User Administration window
426
EPICenter Software Installation and User Guide
Starting the EPICenter Client for the First Time
Changing the Admin Password
To change the Admin password:
1 Click the tab at the top of the page to display the User Administration page, if
necessary.
2 Select the user admin in the User list.
3 Click Modify.
The Edit User window appears, as shown in Figure 156.
Figure 156: Edit User window
4 Type a new password in the Password field.
5 Type the password again in the Verify Password field.
6 Click OK.
The new admin password is stored in the EPICenter database. You cannot change the
EPICenter access level for this user.
EPICenter Software Installation and User Guide
427
Administering EPICenter
You can, however, change the ExtremeWare account access. The default for the
EPICenter user “Admin” is Administrator. See the information under “Adding or
Modifying User Accounts” for details on the ExtremeWare account access levels.
Adding or Modifying User Accounts
To add users to the EPICenter database, or to modify EPICenter user account access,
follow these steps:
1 Login to the ExtremeWare EPICenter as a user with Administrator access.
2 Click Admin in the Navigation Toolbar.
3 Click the User Administration tab at the top of the page to display the User
Administration page, if necessary.
4 To add a user, click Add. To change a user’s access or password, select the user
name and click Modify.
The New User window (or Edit User window) appears (Figure 157).
Figure 157: New User and Edit User windows
428
EPICenter Software Installation and User Guide
Adding or Modifying User Accounts
5 For a new user, type a user name into the Name field.
6 Type a new password into the Password field.
7 Type the password again into the Verify Password field.
8 Select the appropriate EPICenter Account Access level:
• Administrator access allows the user to add, edit and delete user accounts, as
well as view status information and statistics and modify device parameters.
• Manager access allows the user to view status information and statistics and
modify device parameters.
• Monitor access allows the user to view status information and statistics.
• Disabled provides no access privileges (the user will not be able to log in to the
EPICenter), but keeps the user account information in the EPICenter database.
9 Select the appropriate ExtremeWare Account Access level:
• Administrator access allows the user to modify device parameters as well as
view status information and statistics.
• User access allows the user to view device status information and statistics, but
cannot modify any parameters.
• No Access provides no access privileges, but keeps the user account information
in the EPICenter database.
10 Click OK.
The new user information is stored in the EPICenter database.
NOTE
A change to a user account does not take effect until the next time the user logs in.
Deleting Users
To delete a user, follow these steps:
1 Log in to the ExtremeWare EPICenter as a user with Administrator access.
2 At the About ExtremeWare EPICenter window, click Admin in the Navigation
Toolbar.
The User Administration page appears.
EPICenter Software Installation and User Guide
429
Administering EPICenter
3 Click the User Administration tab at the top of the page to display the User
Administration page, if necessary.
4 Select the user name you want to delete and click Delete.
NOTE
You cannot delete the user name admin.
A confirmation window appears.
5 Click Yes.
This removes all information about this user account from the EPICenter database.
NOTE
To remove all access privileges for a user without removing the user account from the
EPICenter database, use the Modify User function and change the Account Access to
Disabled.
Changing Your Own User Password
If you are a user with Manager or Monitor access, you can change your own password
at any time after you have logged in to the ExtremeWare EPICenter. To do so, follow
these steps:
1 Click Admin in the Navigation Toolbar.
The Change Password window appears, as shown in Figure 158.
430
EPICenter Software Installation and User Guide
Changing Your Own User Password
Figure 158: Change Password window
The window shows your user name, and your EPICenter and RADIUS Account
Access levels, but you cannot change them.
2 Type your new password in the Password field.
3 Type the password again in the Verify Password field.
4 Click Apply.
Your new password is stored in the EPICenter database.
NOTE
The change does not take effect until the next time you log in.
EPICenter Software Installation and User Guide
431
Administering EPICenter
RADIUS Administration
If you have Administrator access, you can enable EPICenter as a RADIUS server or
RADIUS client, and change its port or the RADIUS secret. By default RADIUS
authentication is disabled.
Enabling the RADIUS server means that Extreme switches can act as RADIUS clients,
authenticating users against the RADIUS server’s database of users, as administered
through the EPICenter. Thus, even if a user accesses the switch directly through Telnet
or a browser, the RADIUS server will provide the authentication service.
Disabling the RADIUS server means that it will not be available for authenticating
users. In this case, each Extreme switch must maintain its own list of users and access
permissions, and users will need to remember a (possibly different) login and password
for every switch.
If you have enabled the EPICenter RADIUS server, authentication activity is logged to
the file radius_log.txt, found in the EPICenter root install directory.
• To change the EPICenter server RADIUS configuration, click the RADIUS tab at the
top of the page.
The RADIUS Administration page appears, as shown in Figure 159.
RADIUS Server Configuration
To configure EPICenter as a RADIUS server, follow these steps:
432
EPICenter Software Installation and User Guide
RADIUS Administration
Figure 159: Radius Administration page
1 Click the Enable EPICenter as a RADIUS Server button in the RADIUS
Configuration panel at the top of the page.
This enables the fields in the Server Configuration panel.
2 Enter the RADIUS server’s shared secret in the RADIUS Secret field.
This string is basically a shared key by which the RADIUS server and its clients
recognize each other, and which they use for secure transmission of user passwords.
NOTE
If you change the secret in the RADIUS server, you must also change it in any of the
RADIUS clients (Extreme switches) that use the RADIUS server for user
authentication.
EPICenter Software Installation and User Guide
433
Administering EPICenter
3 The default port used for the RADIUS server is 1645. To change the server port,
enter the port number in the RADIUS Port field.
NOTE
If you change the RADIUS server port, you must make sure that the ports used in
any RADIUS clients (Extreme switches that use this RADIUS server for user
authentication) match the port you enter for the server.
4 To disable RADIUS response messages, uncheck the Enable RADIUS Response
Messages checkbox. This prevents the RADIUS server from sending a response
message when authentication fails. Check the box to enable these messages. This is
enabled by default.
5 Click Apply to have the configuration changes take effect.
RADIUS Client Configuration
To enable EPICenter as a RADIUS client, do the following:
1 Click the Enable EPICenter as a RADIUS Client button at the top of the page.
This enables the fields in the Client Configuration panel.
2 Fill in the fields (server name or IP address, port, and shared secret) for the primary
and secondary RADIUS servers as appropriate.
It is recommended, but not required, that both a primary and a secondary RADIUS
server be available for authentication.
3 Click Apply to have the configuration changes take effect.
Disabling RADIUS for EPICenter
To disable the use of RADIUS authentication, do the following:
1 Click the Disable RADIUS button at the top of the page.
2 Click Apply to have the configuration changes take effect.
434
EPICenter Software Installation and User Guide
Server Properties Administration
Server Properties Administration
If you have Administrator access, you can modify the values of a number of properties
that affect the function and performance of the EPICenter server.
1 Click the Server Properties tab at the top of the page.
The Server Properties Configuration page appears, as shown in Figure 160.
Figure 160: Server Properties Configuration page, initial properties list
2 Select a set of properties from the drop-down menu field at the top of the central
panel. You can select among five sets of properties:
— Devices
— Scalability
EPICenter Software Installation and User Guide
435
Administering EPICenter
— SNMP
— Topology
— Other
The Server Properties Configuration page displays the properties in that set.
3 Type a new value into the field for the property you want to change, or click a
check-box to turn on or off an option. The specific properties and their meanings are
discussed in the following sections.
4 Click the Apply button to cause your changes to take effect.
You can undo your changes in one of two ways:
— Click the Reset button to restore the values that the displayed properties held
when you first entered this page.
— Click the Reset to Defaults button to restore the values to the EPICenter server
default values (the values in effect immediately after installation).
5 For some changes, you will need to restart the EPICenter server for the changes to
take effect. A pop-up dialog will inform you that this is necessary.
Click OK to dismiss the dialog box, and then shut down and restart the EPICenter
server.
See Chapter 3 for information on how to shut down and restart the EPICenter server.
Devices Properties
When you select Devices from the drop-down menu field at the top of the properties
panel, you can set the following properties:
• Telnet Login Timeout Period: The length of time, in milliseconds, after which a
CLI/Telnet login request to a switch should time out. The default is 10000
milliseconds (10 seconds), the range is 1 to 30 seconds (1000 to 30000 ms).
• Device HTTP Port: The port that the EPICenter server will use to communicate with
an Extreme switch’s web server to run ExtremeWare Vista. Default is port 80.
• Device Telnet Port: The port that the EPICenter server will use to telnet to a switch.
Default is port 23.
• Upload/Download Timeout Period (ms): The length of time, in milliseconds, after
which a configuration upload or download operation should time out. If some
devices have a large number of VLANs, the timeout may need to be increased to
allow an upload or download operation to complete successfully without timing out.
436
EPICenter Software Installation and User Guide
Server Properties Administration
• Syslog Server settings:
— Enable Syslog Server (Port: 514) (checkbox): A check specifies that the EPICenter
server can function as a Syslog receiver to receive Syslog messages. Port 514 is
the port used for remote syslog communication from a switch. Uncheck the
checkbox to disable syslog server functionality. The default is enabled.
NOTE
For Solaris, you must stop the Solaris Syslog server before you can enable
EPICenter’s syslog server. To stop the server in Solaris, enter the command
/etc/init.d/syslog stop. In EPICenter, you can restart the Syslog server by
disabling and then re-enabling it.
On the device side, remote logging must be enabled, and the switch must be
configured to log to the EPICenter server. The default on Extreme switches is for
logging to be disabled. You must use the EPICenter Telnet applet or the
ExtremeWare CLI to configure your switches. To enable remote logging, enter the
command:
enable syslog
To configure the EPICenter server as a Syslog server, enter the command:
config syslog <EPICenter IP address> <facility>
You must enter the IP address of the EPICenter server, and a facility level, which
can be local0 through local7. See the ExtremeWare Software User Guide or the
ExtremeWare Software Command Reference Guide for more information on these
commands.
You can also include a severity in the config syslog command, which will
filter log messages before they are sent to the EPICenter Syslog server. The
EPICenter Syslog server will in turn filter the incoming messages based on the
severity you set using the Accept SysLog messages with Min Severity setting
described previously.
To configure remote logging on multiple devices, you can run these commands as
a macro in the EPICenter Telnet module.
— Accept SysLog messages with Min Severity: The minimum severity level of
messages to be logged in a switch Syslog file. All messages with Severity equal to
or higher than the setting you select will be logged. For example, if you select
2:Critical, then messages of severity 2 (Critical), 1 (Alert), and 0 (Emergency) will
be logged. The default is 6: Information.
EPICenter Software Installation and User Guide
437
Administering EPICenter
• Save Changed Configurations Only (checkbox): A check specifies that device
configurations should be uploaded by the Configuration Manager Archive feature
only when the device configuration has changed (the default). Uncheck the checkbox
to specify that switch configurations should always be uploaded at the scheduled
archive time.
• Poll Devices Using Telnet (checkbox): A check enables regular CLI/Telnet polling of
ExtremeWare 4.1 devices (the default). Uncheck the checkbox to disable CLI/Telnet
polling. This disables ESRP polling as well as EDP polling.
• Save Switch Password for Vista Login (checkbox): A check specifies that the
ExtremeView module should save the switch password in the EPICenter database
for use when logging into a switch using ExtremeWare Vista. If you disable
(uncheck) this property, you will be required to login to each switch in order to view
Configuration and Statistics information in the ExtremeView applet. The default is
enabled (passwords will be saved).
Scalability Properties
Select Scalability from the drop-down menu field at the top of the properties panel to
set the EPICenter server into Scalable mode (or reset it into regular mode) and to
modify the number of concurrent operations the EPICenter server can run.
Manipulating the thread pool size, default thread allocation size, number of SNMP
sessions, and the number of traps and syslog messages EPICenter processes per minute
lets you configure the EPICenter server to provide better performance based on the
amount of server resources (number and speed of processors, amount of memory)
available. Changing these values should not normally be necessary unless you are
managing a very large number of devices (more than 1000 devices).
If you are managing more than 1000 devices, it is recommended that you run the
EPICenter server on a system with a 1 GHz or faster processor, and at least 1 GHz of
physical memory. For such a configuration, you may also be able to improve the
performance of the EPICenter server by changing the parameters below.
NOTE
Changing the scalability properties on a system without suitable hardware could actually
decrease the performance of the EPICenter server.
To see the effects of the current scalability settings, run the Server State Summary
Report in the Reports applet.
438
EPICenter Software Installation and User Guide
Server Properties Administration
• Thread Pool Size: This specifies the maximum number of threads available.
Increasing this number may improve overall performance. For managing more than
1000 devices, it is recommended that you increase this to 50. The default is 20.
• Thread Default Alloc Size: This specifies the default number of threads allocated for
a process request. Increasing this size may allow processes to complete more quickly.
For managing more than 1000 devices, it is recommended that you increase this to
25. The default is 10.
• Maximum Number of SNMP Sessions: Specifies the maximum number of
concurrent SNMP sessions the server will run. Increasing this number may improve
throughput from device polling. For managing more than 1000 devices, it is
recommended that you increase this to 25. The default is 10.
• Traps per Device in 1/2 Minute: This specifies the maximum number of traps that
can be receivedfrom an individual device in 28 seconds. If more than this number of
traps are received within a 28 second interval, the excess traps are dropped.
• Total Traps Accepted per Minute: This specifies the maximum total number of traps
that EPICenter can receive from all managed devices in 55 seconds. If more than this
number of traps are received within a 55 second interval, the excess traps are
dropped. When managing more than 1000 devices, increase this to 500. The default
is 275, the maximum you can set is 500.
• Syslog Messages per Device in 1/2 Minute: This specifies the maximum number of
syslog messages that can be received from an individual device in 28 seconds. If
more than this number of traps are received within a 28 second interval, the excess
messages are ignored.
• Total Syslog Messages Accepted per Minute: This specifies the maximum number
of syslog messages that EPICenter can receive in one minute from all managed
devices. If more than this number of messages are received within a one-minute
interval, the excess messages are ignored. When managing more than 1000 devices,
you should increase this to 500. The default is 275, the maximum you can set is 500.
NOTE
You should not change the values for traps and syslog messages accepted unless the
EPICenter server reports dropping lots of traps. Run the Server State Summary Report
in the Reports applet to view the current performance metrics.
SNMP Properties
When you select SNMP from the drop-down menu field at the top of the properties
panel, you can set the following properties:
EPICenter Software Installation and User Guide
439
Administering EPICenter
• Poll Interval: The interval, in milliseconds, between SNMP polls of a switch to fetch
basic device status information. The default is 300000 msecs (five minutes). The
range is 5000 to 3600000 msecs (five seconds to one hour).You can disable all SNMP
polling by setting this property to zero.
NOTE
This Poll Interval is not the same as the Device Polling Interval you can set through
the Inventory Manager. The Device Polling Interval controls the frequency of polling
for detailed device information such as software version, bootrom version, and so on.
The polling interval set in the Administration applet controls only the basic SNMP
status information necessary to ensure SNMP reachability, and is typically performed
relatively frequently.
• Timeout Period: The length of time to wait for an SNMP poll request to complete, in
milliseconds, before timing out. The default is 2000 msecs (two seconds). The range
is one to 10 seconds (1000-10000 msecs).
This setting determines the time-out interval only for the first unsuccessful SNMP
request; once a request times out, subsequent requests will time out more slowly,
based on an exponential time-out back-off algorithm, until it reaches the maximum
number of retries.
• Number of Retries: The number of SNMP requests that should be attempted before
giving up, for a request that has timed out.
• EPICenter Trap Receiver Port: The port on which EPICenter expects to receive traps.
Default is port 10550.
• Enable Edge Port Polling (checkbox): A check in this box indicates that edge port
polling is enabled. Edge port polling is a background process the polls all ports
identified as edge ports for a variety of information including FDB information, IP
and MAC addresses, prot status and port names. Edge ports are identified
automatically and are distinguished from uplink ports based on the number of MAC
addresses detected on the port (a port with five or fewer MAC addresses is
considered an edge port). The default is enabled.
• Edge Port Poll Interval (hours): The minimum interval (in hours) between polls of
an individual edge port. The longer the interval, the less performance overhead the
EPICenter server will endure due to edge port polling, but the longer port
information will go without being refreshed. The default is 12 hours. If you set an
interval that is shorter than the time it takes to poll all the edge ports, then the actual
interval may be longer than the interval you specify here.
440
EPICenter Software Installation and User Guide
Server Properties Administration
Topology Properties
Select Topology from the drop-down menu field at the top of the properties panel to set
properties that affect the collection and display of RMON statistics in the Topology
applet.
• Enable Topology RMON Statistics Data Collection (checkbox): A check in this box
enables the collection of RMON statistics in the Topology applet. The default is
enabled, which means that RMON statistics will be collected for all devices that have
RMON enabled in the device. To disable the collection of RMON Statistics, uncheck
the checkbox. If this option is disabled, then no RMON statistics will be displayed
on any maps, regardless of the setting of the Display RMON Statistics
• Display RMON Statistics in new Maps by Default (checkbox): The display of
RMON statistics on a map can be enabled or disabled for individual maps through a
checkbox option in the Topology Map Properties window for each map. This server
property specifies the default state of the RMON statistics display checkbox (labeled
RMON Statistics) in the Topology Map Properties window.
A check in this box specifies that by default the RMON Statistics option in the Map
Properties window will be enabled. Thus, by default, RMON statistics will be
displayed for all maps unless they are specifically disabled for an individual map. To
disable the RMON statistics display for an individual map, you can uncheck the
RMON Statistics option in the Map Properties window for that map.
This option is disabled by default, meaning that the corresponding option in the Map
Properties will be disabled by default.
NOTE
If Topology RMON statistics data collection is disabled, then this display option will
have no effect.
Other Properties
When you select Other from the drop-down menu field at the top of the properties
panel, you can set the following properties:
• DNS Lookup Timeout Period: The time-out period, in milliseconds, when
performing DNS lookup operations for hosts found through DLCS or when
importing (in the Grouping applet) from an NT Domain Controller. The default is
1000 milliseconds (one second).
• Session Timeout Period: The non-activity time-out period, in milliseconds, after
which the user is required to re-login to the EPICenter server. The default is 600,000
EPICenter Software Installation and User Guide
441
Administering EPICenter
milliseconds (ten minutes). You can disable the time-out by setting the property to
-1.
• ServiceWatch URL: The URL for accessing ServiceWatch, to allow it to be launched
from the EPICenter navigation toolbar, and to run in the main EPICenter applet
window.
For example, if ServiceWatch is running on a system named “tampico” at port 2000,
you would enter http://tampico:2000 as the ServiceWatch URL. You must then
restart the EPICenter server to activate the ServiceWatch integration.
• IP QoS Rule Precedence: The starting value that the EPICenter server will use for
setting precedence in the Policy Manager applet. This is an integer between 1 and
25,000. The default value is 10,000.
Setting this value lets you ensure that policies created by EPICenter will have higher
precedence than policies created through the ExtremeWare CLI. It is also useful in
distinguishing between policies created through the CLI and those created through
the EPICenter Policy Manager applet.
• Client Port: The TCP port number that a client will use to connect to the EPICenter
server. The default is 0, meaning that the server will use any available port. You can
use this setting to specify a fixed port number that the EPICenter server will use. For
example, if the EPICenter server is behind a firewall, you may need to provide a
fixed port number to allow clients to connect thought the firewall.
• Update Type Library on Server: This function updates the EPICenter type library,
which is a repository of images and other information about Extreme Networks
devices.
• Device Tree UI: A setting that specifies how devices are identified in the Component
Tree and in selected other locations. You can choose to have the component tree
show the device name only, the device name followed by the IP address in
parentheses, of the device IP address followed by the device name in parentheses.
The default is device name followed by the device IP address.
Distributed Server Administration
If you have Administrator access, a Distributed Server license, and you have multiple
EPICenter servers installed on your network, you can configure these servers to operate
in a distributed server mode.
Distributed Server mode allows multiple EPICenter servers, each managing their own
sets of devices, to be designated as a server group, and to communicate status between
442
EPICenter Software Installation and User Guide
Distributed Server Administration
the servers in the group. One server acts as a Server Group Manager, and the other
servers act as server group members.
Each server in the server group is updated at regular intervals with a list of other
servers, and with network summary and status information from the other servers in
the group. In distributed server mode, the EPICenter home page contains a status
information from the other servers in the group in addition to the standard Network
Summary report.
NOTE
The Distributed Server functionality is a separately-licensed feature of the EPICenter
software. If you do not have a Distributed Server license, only Single Server mode is
enabled. You will not be able to select either of the Server Group settings.
1 Click the Distributed Server tab at the top of the page.
The Distributed Server Administration page appears, as shown in Figure 161.
EPICenter Software Installation and User Guide
443
Administering EPICenter
Figure 161: Distributed Server Administration page
Initially, the EPICenter server is configured as a single server. In single server mode, the
server does not communicate with any other EPICenter servers. If you have a
Distributed Server license, you can change its configuration to act as a server group
member or as the server group master.
Configuring a Server Group Member
To configure your EPICenter server as a server group member:
1 Click the Server Member button in the Server Group Type panel at the top of the
page.
This enables the fields in the Server Group Member panel.
444
EPICenter Software Installation and User Guide
Distributed Server Administration
2 Enter the host name or IP address of the server that acts as the group manager in the
Server Group Manager field.
3 Enter the port number to be used to communicate with the Server Group Manager.
This port should match the HTTP port configured for the EPICenter server acting as
the server group manager. The default is port 80.
4 Enter the shared secret in the Secret field.
This string is a shared key by which the cooperating EPICenter servers recognize
each other, and which they use for secure transmission of server data. The default
shared secret is the string secret.
NOTE
If you change the secret for one EPICenter server, you must also change it for all of
the other servers in the group.
5 Click Apply to have the configuration changes take effect.
Configuring a Server Group Manager
To function as the EPICenter Server Group Manager, the server must have a host name
that is configured through DNS.
To enable this EPICenter server as a server Group Manager, do the following:
1 Click the Server Manager button in the Server Group Type panel at the top of the
page.
This enables the fields in the Server Group Manager panel.
2 Enter the shared secret in the Secret field.
This string is a shared key by which the cooperating EPICenter servers recognize
each other, and which they use for secure transmission of server data. The default
shared secret is the string secret.
NOTE
If you change the secret in one EPICenter server, you must also change it in all of
the other servers in the group.
EPICenter Software Installation and User Guide
445
Administering EPICenter
3 Enter the polling interval in milliseconds. This determines the frequency with which
the Server Manager communicates information to the other server members of the
EPICenter server group. The default is 600,000 milliseconds (ten minutes)
4 Add the other members of the server group to the server list:
a Click Add to open the Add Server dialog box.
b Enter the host name or IP address of the member server in the server field. A
server member does not need to have a DNS-translatable host name.
c
Enter the port used to communicate with the server member. This must match
the HTTP port configured for the member server
d Click OK to add this server to the list, or Cancel to cancel the operation.
Servers added to this list must be configured as server group members with this
server as the Server Group Manager.
5 To delete a member server from the list, select the server and click Delete.
6 Click Apply to have the configuration changes take effect.
446
EPICenter Software Installation and User Guide
17 Dynamic Reports
This chapter describes how to use the EPICenter Reports capability for:
• Viewing predefined Network Summary Reports from the Home EPICenter page
• Viewing predefined EPICenter status reports from the Dynamic Reports
• Creating new reports by writing Tcl scripts
Overview of EPICenter Reports
The EPICenter software provides several sets of HTML-based reports that provide
information about the devices managed by the EPICenter server. There are two types of
these reports:
• A Network Summary Report, available on the main EPICenter “Home” page,
displayed when you first log in through the EPICenter client.
• EPICenter Dynamic Reports, available separately from the main EPICenter client, or
as an applet accessed from the client.
The Network Summary Report provides summary statistics about the status of the
devices being managed by the EPICenter server. This report can also be accessed from
the Dynamic Reports Main page.
EPICenter Dynamic Reports are a separate feature from the main EPICenter user
interface. If you use a browser-based client, the reports can be accessed directly from the
initial EPICenter Start-up page without logging in to the Java client interface. The
Reports module can also be accessed from the EPICenter Navigation toolbar.
EPICenter Software Installation and User Guide
447
Dynamic Reports
The EPICenter dynamic reports are HTML pages that do not require Java capability,
and thus can be accessed from browsers that do not have the ability to run the full
EPICenter user interface. This means reports can be loaded quickly, even over a dial-up
connection, and it also provides the ability to print the reports.
EPICenter’s HTML reports are always displayed in a browser window, even if you are
running the stand-alone client. See“Browser Requirements for Reports” on page 36 in
Chapter 2 for supported browsers.
Network Summary Report
The Network Summary Report provides an at-a-glance summary of the status of the
devices the EPICenter server is monitoring. The main report page, as shown in
Figure 162, appears when you first log into the EPICenter client, and when you click the
Home button at the top of the Navigation Toolbar.
448
EPICenter Software Installation and User Guide
Network Summary Report
Figure 162: Network Summary Report page
If there are statistics that indicate problems (such as devices not responding, or alarms
generated within the last twenty-four hours) the cell containing that statistic is
displayed in yellow.
To view a detail report for a particular summary statistic, click the number in the
right-hand column of the summary display.
For example, you can click the value in the right-hand column of the Devices Managed
by the Server row to display a Device Reports summary listing, showing the device
groups currently configured in the EPICenter server.
From the Device Reports summary you can click one of the Device Group names to
display a Device Summary report similar to that shown in Figure 163.
EPICenter Software Installation and User Guide
449
Dynamic Reports
Figure 163: Network Summary Detail report
The only statistic in the Network Summary Report that does not provide its own detail
report is the Devices Up statistic.
This report illustrates a number of features that are common to all the Summary Detail
reports. In these reports, you can do the following:
• Click a column heading to sort on the contents of that column. For example, to sort
by IP address, click on the Device IP Address link at the top of the first column.
• Click a link at the bottom of the report page to view additional report information.
Most of the Network Summary Reports provide additional detailed reports.
• To return to the main Network Summary Report, you must return to the client
application. If you are in the client application and you want to return to the main
450
EPICenter Software Installation and User Guide
Network Summary Report
Network Summary Report, click the Home button at the top of the Navigation
Toolbar.
The following sections describe the reports available from the Network Summary
Report.
Devices Managed by the Server
This report provides a summary status of all the device groups and devices known to
the EPICenter server, organized by device group or device type. This is also known as
the Device Inventory Report, and can be accessed from the Device Inventory link on
the main Reports pages, or from the To Device Inventory Reports link on the Devices
Not Responding report. See “Device Inventory Report” on page 462.
When you click the number in the right-hand column, a Device Reports summary is
displayed. From the Device Reports summary, you can display device group or device
status.
Device Group Summary
The Devices by Group table displays the following information:
• Device Group—Name of the device group
• Description—Description (optional) associated with the device group
• Quantity—Number of devices that belong to this device group
Select a Device Group or All Devices to display the Device Summary report for the
devices in the group.
The Device Summary report displays the following information about each device:
• Group—EPICenter Device Group to which it belongs (this is displayed only if you
select All Devices)
• Name—Name of the device from the sysName variable
• IP Address—IP address of the device
Click the IP address to display a table with detailed configuration and status
information. This is the same information you can view in the Inventory applet.
• Type—Type of device
• Location—Device location from the sysDescr variable
• MAC—MAC address of the device
EPICenter Software Installation and User Guide
451
Dynamic Reports
• Serial Number—Device serial number
• Current Image—Software version currently running on the device, if known
Click the heading of a column to sort on the contents of that column.
Click the link Back to Device Reports to return to the Device Reports summary to
select a different Device Group.
Device Summary
The Devices by Type table displays the following information:
• Device Type—Type of device
• Quantity—Number of devices known to EPICenter
Select a device or All Devices to display the Device Summary report.
The Device Summary report displays the following information about each device:
• Group—EPICenter Device Group to which it belongs
• Name—Name of the device from the sysName variable
• IP Address—IP address of the device
Click the IP address to display a table with detailed configuration and status
information. This is the same information you can view in the Inventory applet.
• Type—Type of device (this is displayed only if you select All Devices)
• Location—Device location from the sysDescr variable
• MAC—MAC address of the device
• Serial Number—Device serial number
• Current Image—Software version currently running on the device, if known
Click the heading of a column to sort on the contents of that column.
Click the link Back to Device Reports to return to the Device Reports summary to
select a different Device Group.
Devices Not Responding
This report provides a summary status of the devices known to the EPICenter server
that are currently not responding. It shows the following information for each device:
452
EPICenter Software Installation and User Guide
Network Summary Report
• Device IP Address—IP address of the device
• Device Name—Name of the device from the sysName variable
• Device Description—Device description from the sysDescr variable
• Device Location—Device location from the sysLocation variable
• Device Status—A red or yellow status “light”
Red indicates the device is not responding to the EPICenter polls.
Yellow indicates the device is responding but is reporting a fan or power supply
error.
Click the heading of a column to sort on the contents of that column.
Click the To Device Inventory Reports link at the bottom of the page to view Device
Inventory Reports. See “Device Inventory Report” on page 462 for more information.
Click the To Device Status Reports link at the bottom of the page to view Device Status
Reports. See “Device Status Report” on page 465 for more information.
Critical Alarms Defined
This report provides a summary of alarms defined as having a severity level of Critical
or Major. It shows the following information for each alarm:
• Alarm Name—Name of the alarm
• Category—Alarm category of which this alarm is a member
• Enabled—Whether the alarm is currently enabled or disabled
• Severity—Severity level of the alarm (Critical or Major)
Click the heading of a column to sort on the contents of that column.
See Chapter 5 for more information on alarm definitions, categories, and other alarm
topics.
Critical Alarms for Last 24 Hours
A summary of critical alarms that have occurred in the last 24 hours. It shows the
following information.
• Alarm Name—Name of the alarm
EPICenter Software Installation and User Guide
453
Dynamic Reports
• Category—Category that the alarm is classified under
• Source IP—IP address of the device that generated the alarm
• Time (Local Time Zone)—Time the alarm occurred (based on the local time zone of
the EPICenter server)
• Event Number—Event ID of the alarm (assigned by the EPICenter server when the
alarm is received)
• Severity—Severity level of the alarm
Click the heading of a column to sort on the contents of that column.
You can view the complete Alarm Log report, showing all EPICenter alarms, from the
Reports module. See “Alarm Log Report” on page 470.
See Chapter 5 for more information on alarm definitions, categories, and other alarm
topics.
Unacknowledged Critical Alarms
A summary of critical alarms that have occurred in the last 24 hours that have not been
acknowledged. It shows the following information.
• Alarm Name—Name of the alarm
• Category—Category that the alarm is classified under
• Source—IP address of the device that generated the alarm
• Device Name—Name of the device from the sysName variable
• Time (Local Time Zone)—Time the alarm occurred (based on the local time zone of
the EPICenter server)
• Event Number—Event ID of the alarm (assigned by the EPICenter server when the
alarm is received)
• Severity—Severity level of the alarm
Click the heading of a column to sort on the contents of that column.
You can view the complete Alarm Log report, showing all EPICenter alarms, from the
Reports module. See “Alarm Log Report” on page 470.
See Chapter 5 for more information on alarm definitions, categories, and other alarm
topics.
454
EPICenter Software Installation and User Guide
Network Summary Report
SNMP Unreachable Alarms
A summary of SNMP Unreachable alarms that have occurred in the last 24 hours. It
shows the following information.
• Alarm Name—Name of the alarm
• Category—Category that the alarm is classified under
• Source—IP address of the device that generated the alarm
• Device Name—Name of the device from the sysName variable
• Time (Local Time Zone)—Time the alarm occurred (based on the local time zone of
the EPICenter server)
• Event Number—The event ID of the alarm (assigned by the EPICenter server when
the alarm is received)
• Severity—Severity level of the alarm
Click the heading of a column to sort on the contents of that column.
You can view the complete Alarm Log report, showing all EPICenter alarms, from the
Reports module. See “Alarm Log Report” on page 470.
See Chapter 5 for more information on alarm definitions, categories, and other alarm
topics.
Invalid Login Alarms
A summary of Invalid Login alarms that have occurred in the last 24 hours. It shows
the following information.
• Alarm Name—Name of the alarm
• Category—Category that the alarm is classified under
• Source—IP address of the device that generated the alarm
• Device Name—Name of the device from the sysName variable
• Time (Local Time Zone)—Time the alarm occurred (based on the local time zone of
the EPICenter server)
• Event Number—Event ID of the alarm (assigned by the EPICenter server when the
alarm is received)
• Severity—Severity level of the alarm
EPICenter Software Installation and User Guide
455
Dynamic Reports
Click the heading of a column to sort on the contents of that column.
You can view the complete Alarm Log report, showing all EPICenter alarms, from the
Reports module. See “Alarm Log Report” on page 470.
See Chapter 5 for more information on alarm definitions, categories, and other alarm
topics.
Authentication Failure Alarms
A summary of Authentication Failure alarms that have occurred in the last 24 hours. It
shows the following information.
• Alarm Name—Name of the alarm
• Category—Category that the alarm is classified under
• Source—IP address of the device that generated the alarm
• Device Name—Name of the device from the sysName variable
• Time (Local Time Zone)—Time the alarm occurred (based on the local time zone of
the EPICenter server when the alarm is received)
• Event Number—Event ID of the alarm (assigned by the EPICenter server when the
alarm is received)
• Severity—Severity level of the alarm
Click the heading of a column to sort on the contents of that column.
You can view the complete Alarm Log report, showing all EPICenter alarms, from the
Reports module. See “Alarm Log Report” on page 470.
See Chapter 5 for more information on alarm definitions, categories, and other alarm
topics.
VLANs Report
Summary information on all VLANs being managed by the EPICenter server. This
report is the same as the VLAN Summary Report you can access from the Reports
module. See “VLAN Summary Report” on page 466 for a description of this report.
456
EPICenter Software Installation and User Guide
Dynamic Reports
Dynamic Reports
A number of predefined reports present information from the EPICenter software
database. The predefined reports include:
• Network Summary Report (described in the previous section)
• Server State Summary Report
• Device Inventory Report
• Slot Inventory Report
• Device Status Report
• VLAN Summary Report
• Interface Report
• Resources to Attribute Map
• User to Host Mapping
• Alarm Log Report
• Event Log Report
• System Log Report
• Configuration Management Log Report
The content for the first four reports (Device Inventory, Slot Inventory, Device Status,
and VLAN Summary) are generated by Tcl scripts. The remaining five reports (Device
Interface, Alarm Log, Event Log, System Log, and Configuration Management Log) are
generated by Java-based code.
The Java-based reports can be sorted, filtered, and paginated, but they cannot be
customized. The Tcl-based reports can be customized, and can serve as models for new
reports. You can create your own reports by writing Tcl scripts that generate HTML
code. See “Creating New Reports” on page 474 for details.
You can access the EPICenter software Dynamic Reporting capability in one of two
ways:
• By clicking the Reports button in the EPICenter software Navigation Toolbar
• By launching your Web browser and logging in directly from the EPICenter Start-up
page
To log in directly from the EPICenter software Start-up page, follow these steps:
EPICenter Software Installation and User Guide
457
Dynamic Reports
1 Launch your Web browser.
2 Enter the following URL:
http://<host>:<port>/
In the URL, replace <host> with the name of the system where the EPICenter server
is running. Replace <port> with the TCP port number that you assigned to the
EPICenter Web Server during installation.
NOTE
If you used the default web server port, 80, you do not need to include the port
number.
The EPICenter Start-up page appears.
3 Click View Reports in the left-hand panel of the Start-up page.
The EPICenter Login page appears.
4 Enter your user name and password, and click Login. Use the same user name and
password as you use to log in to the EPICenter system.
The Dynamic Reports module is displayed. The main page includes a brief
description of the predefined reports that are available.
Viewing Predefined EPICenter Reports
To view a predefined report, click the Reports button in the Navigation Toolbar, or a
number in the right-hand column of the display summary.
To go to the main EPICenter user interface from the Network Summary Report page,
click the “About EPICenter” link at the bottom of the list. This displays the About
EPICenter page.
To exit from EPICenter, click the Logoff button in the Navigation Toolbar. This returns
you to the EPICenter Start-up page.
Report Filtering
Five of the reports provide a filtering capability that lets you select the information that
should appear in the report. This filtering capability lets you construct a two-part
458
EPICenter Software Installation and User Guide
Viewing Predefined EPICenter Reports
conditional statement based on the values of relevant variables in the EPICenter
database.
The following reports provide filtering:
• Interface Report
• Alarm Log
• Event Log
• Sys Log
• Config Mgmt Log
These reports provide a set of fields at the bottom of the report similar to the ones
shown in Figure 164.
Figure 164: Report filter specification
To create a filter, follow these steps:
1 In the first field, select the variable to use in the filter. The variables from which you
can choose are based on the column headings in the report, and depend on the type
of report you are viewing.
2 In the second field, select a comparison operator. You can choose from the following
comparison operators:
— > (greater than)
— < (less than)
— <= (greater than or equal)
— >= (less than or equal)
— != (not equal)
— = (equal)
— starts with
EPICenter Software Installation and User Guide
459
Dynamic Reports
— ends with
— contains
If the variable values are strings, then the comparisons are taken to indicate alphabetic
order, where greater than indicates later in later in the alphabet (for example, the letter
B is greater than A).
3 In the third field, select the value you want to compare the variable against. If the
variable takes a string as its value, enter a string. If the variable is numeric, enter an
integer.
NOTE
You can use the browser Copy and Paste functions to copy a specific value from the
current report into the comparison field.
4 In the fourth field, you can indicate whether the second condition should be used.
To use a second condition to your filter, choose one of the logical operators And or
Or. Specify And to include a row in the report only if both conditions are true. Select
Or to include the row if either one (or both) of the conditions are true.
If you do not want to include a second condition, select NIL to indicate that the second
clause should be ignored.
5 Click Filter to generate the report based on the filter you have specified.
Click Remove Filter to remove the filter definition and generate an unfiltered report.
Server State Summary Report
The Server State Summary Report displays statistics about configured servers, SNMP
activity, thread and SNMP session pools, database activity, the ports used by the
EPICenter server, and EPICenter licenses. The report provides the following
information.
The first table in the report shows the status of the servers known to EPICenter and
whether they are enabled or disabled, and running or stopped:
• TFTP Server
• Syslog Server
• Radius Server
The second table in the report provides the number of operations that have occurred in
the last minute, the last hour, and the last day (24 hours) for the following operations:
460
EPICenter Software Installation and User Guide
Viewing Predefined EPICenter Reports
• SNMP Queries—Number of SNMP queries performed by the EPICenter server
• Database Commits—Number of database commits performed by the EPICenter
server
• Client Requests—Number of data requests to the EPICenter server performed by all
connected clients
• Trap Requests—Number of trap PDUs received by the EPICenter server
• Syslog Messages—Number of syslog message received by the EPICenter server
The third table in the report shows scalability statistics for the thread pool and the
SNMP session pool:
Thread Pool Statistics
• Pool Size—Thread pool size for the threads that are used to perform server
operations (for example, reading data from a device or configuring the devices)
• Default Allocation Size—Number of threads used to perform a single operation (for
example, running a Telent macro across a number of devices)
• Currently In Use—Number of threads currently in use
• Maximum In Use at Once—Maximum number of threads that are in use at one time
• Total # of Requests—Total number of times a thread is requested to perform an
operation in the server
• Total # of Wait For Thread—Total number of times the server has to wait for a
thread to become available
• Percentage Wait per Request—Percentage of total wait versus total request for
threads
SNMP Session Pool Statistics
• Pool Size—Maximum number of allowed SNMP access sessions to the devices
• Default Allocation Size—Not applicable
• Currently In Use—Number of SNMP access sessions currently in use
• Maximum In Use at Once—Not applicable
• Total # of Requests—Total number of times an SNMP object is requested to perform
an operation in the server
• Total # of Wait For Thread—Total number of times the server has to wait for an
SNMP object to become available
EPICenter Software Installation and User Guide
461
Dynamic Reports
• Percentage Wait per Request—Percentage of total wait versus total number of
requests for SNMP objects
The fourth table in the report shows the ports currently in use by the EPICenter server.
• Web Server—Port currently used by the EPICenter web server.
• Trap Receiver—Port currently used by the EPICenter server to receive traps
• Radius Server—Port currently used by the RADIUS server
• Telnet—Port currently used for Telnet
• Database—Port currently used for EPICenter database communication
• Web Server Admin—Port currently used EPICenter web server administration
The Web Server, Trap Receiver, Radius and Telnet ports can be changed through the
Administration applet, if you have administrator-level access to EPICenter. See
Chapter 16 for more information.
If you are running under Windows NT or Windows 2000, you can use the Port
Configuration Utility, accessible from the Programs menu, to change the database port.
See Appendix B for details on the utility.
The fifth table in the report shows the status of licenses (licensed or not licensed) that
are supported by the EPICenter server:
• EPICenter Server—License for the EPICenter server
• Unlimited Nodes—License to have unlimited nodes
• Distributed Server—License for the Distributed Server
• Policy—License for the EPICenter Policy Manager
• Voice Over IP—License for Voice Over IP (If you have a license for Voice Over IP,
you will see this row in the table.)
There are no further detailed reports available from this report.
Device Inventory Report
To view a Device Inventory Report, click the Device Inventory link in the left-hand
panel.
462
EPICenter Software Installation and User Guide
Viewing Predefined EPICenter Reports
The Device Inventory Report displays basic status and identification information for the
device groups and devices known to EPICenter. The initial display presents summaries
at the Device Group and the device level.
Device Group Summary
The Devices by Group table displays the following information:
• Device Group—Name of the device group
• Description—Description of the group as kept in the EPICenter device inventory
• Quantity—Number of devices in the group
Select a Device Group or All Devices to display the Device Summary report for the
devices in the group.
The Device Summary report displays the following information about each device:
• Group—EPICenter Device group to which it belongs (this is displayed only if you
select All Devices)
• Name—Name of the device from the sysName variable
• IP Address—IP address of the device
Click the IP address to display a table with detailed configuration and status
information. This is the same information you can view in the Inventory applet.
• Type—Type of device
• Location—Device location from the sysDescr variable
• MAC—MAC address of the device
• Serial Number—Device serial number
• Current Image—Software version currently running on the device, if known
Click the heading of a column to sort on the contents of that column.
Device Summary
The Devices by Type table displays the following information:
• Device Type—Type of device
• Quantity—Number of devices known to EPICenter
Select a device or All Devices to display the Device Summary report.
EPICenter Software Installation and User Guide
463
Dynamic Reports
The Device Summary report displays the following information about each device:
• Group—EPICenter Device Group to which it belongs
• Name—Name of the device from the sysName variable
• IP Address—IP address of the device
Click the IP address to display a table with detailed configuration and status
information. This is the same information you can view in the Inventory applet.
• Type—Type of device (this is displayed only if you select All Devices)
• Location—Device location from the sysDescr variable
• MAC—MAC address of the device
• Serial Number—Device serial number
• Current Image—Software version currently running on the device, if known
Click the heading of a column to sort on the contents of that column.
Slot Inventory Report
To view a Slot Inventory Report, click the Slot Inventory link in the left-hand panel.
The Slot Inventory Report displays basic status and identification information for the
slots and module cards known to EPICenter. The initial display presents a summary of
module card types and empty slots. This includes the following information:
• Card Types—Type of module cards and empty slots known to EPICenter
• Quantity—Number of modules of a certain type, all module cards, and the number
of empty slots known to EPICenter
Card Summary Report
Select a Card Type or All Cards to display the Card Summary report for the modules
known to EPICenter.
The Card Summary report displays the following information about each module:
• Device Group—Name of the device group
• Device Name—Name of the device from the sysName variable
• Device Address—IP address of the device
464
EPICenter Software Installation and User Guide
Viewing Predefined EPICenter Reports
• Device Location—Device location from the sysDescr variable
• Card Type—Type of module card (this is displayed only if you select All Cards)
• Slot Name—Number or letter of the slot where the module card is installed
• Card Serial Number—Module card serial number
Click the heading of a column to sort on the contents of that column.
Empty Slots Report
Select Empty Slots to display the Empty Slots summary report for the empty slots
known to EPICenter.
The Empty Slots summary report displays the following information about the empty
slots:
• Device Group—Name of the device group
• Device Name—Name of the device from the sysName variable
• Device Address—IP address of the device
• Device Location—Device location from the sysDescr variable
• Empty Slots—Number or letter of the empty slot(s) on the device
Click the heading of a column to sort on the contents of that column.
Device Status Report
To view a Device Status Report, click the Device Status link in the left-hand panel. This
displays the device status and failure log for all devices known to EPICenter.
The initial display presents a summary at the Device Group level. This includes the
following information:
• Group—Name of the device group
• Description—Description of the group as kept in the EPICenter device inventory
• Alarms Generated—Total alarms for all devices in the device group
• Devices Up—Number of devices in the group that are up
• Devices Not Responding—Number of devices in the group that are not responding
Select a Device Group to display the Device Status Report for the devices in the group.
EPICenter Software Installation and User Guide
465
Dynamic Reports
The Device Status report displays the following information:
• Device Group—Name of the device group
• Device Name—Name of the device from the sysName variable
• IP—IP address of the device
• Status—A green, yellow, or red status “light”
Green indicates the device is up and OK.
Yellow indicates the device is responding but is reporting fan, temperature, or power
supply errors.
Red indicates that the device is unreachable.
• Last Failure (Local Time Zone)—Time at which the most recent device failure
occurred (based on the local time zone of the EPICenter server)
• Down Period (d:h:m:s)—Length of time the device was unreachable, reported in
days:hours:minutes:seconds
• Boot Time (Local Time Zone)—Time when the device was last booted (based on the
local time zone of the EPICenter server)
• Alarms in last 24 hours—Number of alarms in the last 24 hours from this device
If the number of alarms is greater than zero, you can click on the number to display
a summary of the alarms that have occurred for this device.
Click the heading of a column to sort on the contents of that column.
VLAN Summary Report
To view a VLAN Summary Report, click the VLAN Summary link in the left-hand
panel. This displays a report of the VLANs known to EPICenter. The information
reported includes:
• VLAN Name—Name of the VLAN
• Tag—802.1Q tag, if any
• Protocol—Protocol used to filter packets for this VLAN
• Device List—IP addresses of devices with QoS profiles configured for this VLAN
Select a VLAN to display the VLAN Details report for a VLAN.
The VLAN Details report displays the following information:
466
EPICenter Software Installation and User Guide
Viewing Predefined EPICenter Reports
• Device Name—Name of the device that the VLAN is a member of
• IP Address—IP address of the device that the VLAN is a member of
• VLAN IP—IP address assigned to the VLAN
• Tagged Ports—List of 802.1Q tagged ports
• Untagged Ports—List of untagged ports
• # Tagged Ports—Number of tagged ports
• # Untagged Ports—Number of untagged ports
• #10/100 Ports—Number of 10/100 ports
• # Gig Ports—Number of Gigabit ports
• # Active Ports—Number of active ports
• # Failed Ports—Number of failed ports
See Chapter 13 for more information on VLANs.
Interface Report
To view a device interface report, click the Interface Report link in the left-hand panel.
This displays a report on the status of every port known to EPICenter. The information
reported for each interface includes:
• IP Address—IP address of the interface
• Port—Port number of the interface
• Port Name—Port name of the interface
• AdminStatus—Interface administrative status (enabled/disabled)
• OperStatus—Operational status of the interface (ready/active)
• Configured Speed/Type—Nominal (configured) speed of the interface
• Actual Speed/Type—Actual speed of the interface
• Edge/Uplink—Edge or uplink port interface
Since the EPICenter server may be aware of many hundreds of ports, the interface
information is displayed in groups of 25 ports per page. You can navigate among the
pages using any of the following methods:
• Clicking the Previous and Next links
• Selecting a page number from the at the top of the report
EPICenter Software Installation and User Guide
467
Dynamic Reports
• Clicking the First or Last links to display the first or last page in the report
The list of ports is sorted initially by IP address. Click the heading of a column to sort
the report based on the contents of that column. For example, to sort by operational
status, click on the OperStatus heading.
You can filter the ports that are displayed by constructing a conditional filter using the
fields at the bottom of the page. This lets you construct a two-clause filter statement in
the form shown in Figure 165.
Figure 165: Device Ports filter specification
You can filter on any of the variables shown in the report.
Resource to Attribute Mapping Report
The Resource to Attribute Mapping Report displays a list of all the resources that
include the specified attribute. Click the Resource to Attribute Mapping link in the
left-hand panel to display the attribute selection field. Then select an attribute from the
pull-down list, as shown in Figure 166.
468
EPICenter Software Installation and User Guide
Viewing Predefined EPICenter Reports
Figure 166: Attribute specification for Resource to Attribute Mapping report
The pull-down list shows a set of system-defined attributes used by the Policy Manager,
along with any attributes you have added to resources through the Grouping Manager.
The system-defined attributes (IP, UDP Any, TCP Any, TCP Permit-Established Any, IP
Any, L4 Port, and IP Address) have static definitions and are used internally by the
EPICenter Policy Manager.
User-defined attributes are created within the Grouping Manager, either by adding
them to a resource through the user interface, or by importing them.
For the attribute you select in the pull-down menu, the report displays the following
information:
• Resource Type—Type of the resource (such as device, user, host, or group)
• Resource Name—Name of the resource that includes the selected attribute
• Attribute Value—Value of the attribute associated with the resource
User to Host Mapping Report
The User to Host Mapping Report displays a list of any user and host mappings that
are currently defined, along with the primary IP address of the host. User-host
mappings can be created in the Grouping Manager, and can also be created
automatically if the Dynamic Link Context System (DLCS) is enabled on your Extreme
devices. Click the User to Host Mapping link in the left-hand panel to display the
attribute selection field.
The report displays the following information:
EPICenter Software Installation and User Guide
469
Dynamic Reports
• User Name: User name
• Host Name: Name of the host mapped to the user
• Host IP Address: Primary IP address of the host
Alarm Log Report
To view an Alarm Log Report, click the Alarm Log link in the left-hand panel. This
displays a report of all the entries in the EPICenter Alarm Log. The information
reported includes:
• Time—Time the alarm occurred (local time of the EPICenter server)
• Name—Name of the alarm
• Severity—Severity level of the alarm
• Source—IP address of the device that generated the alarm
• Category—Category that the alarm is classified under
• Ack’ed (acknowledged)—Whether the alarm has been acknowledged (1 is
acknowledged, 2 is not acknowledged)
• Event #—Event ID of the alarm (assigned by the EPICenter server when the alarm is
received)
• Message—Message associated with the alarm
The alarm information is displayed in groups of 25 alarm events per page. You can
navigate among the pages using any of the following methods:
• Clicking the Previous and Next links.
• Selecting a page number from the at the top of the report.
• Clicking on the First or Last links to display the first or last page in the report.
The report is sorted initially by the Time that the alarm occurred. Click the heading of a
column to sort on the contents of that column.
You can filter the alarms that are displayed by constructing a conditional filter using the
fields at the bottom of the page. This lets you construct a two-clause filter statement in
the form shown in Figure 167.
470
EPICenter Software Installation and User Guide
Viewing Predefined EPICenter Reports
Figure 167: Alarm Log filter specification
You can filter on any of the variables shown in the report.
For more details on the meaning of these variable, see Chapter 5.
Event Log Report
To view an Event Log Report, click the Event Log link in the left-hand panel. This
displays a report of all the entries in the EPICenter Event Log. The information reported
includes:
• Event #—Event ID of the event (assigned by the EPICenter server when the event is
received)
• Count—Number of consecutive events (if the same trap occurs at the same time and
is received multiple times, only one event is created and the count displays the
number of traps)
• Time—Time the event occurred (local time of the EPICenter server)
• Source—IP address of the device that generated the event
• Type—Event type (for example, SNMP Trap)
• Varbinds—Variable data transmitted with a trap
The event information is displayed in groups of 25 events per page. You can navigate
among the pages using any of the following methods:
• Clicking the Previous and Next links
• Selecting a page number from the at the top of the report
• Clicking the First or Last links to display the first or last page in the report
Click the heading of a column to sort on the contents of that column.
EPICenter Software Installation and User Guide
471
Dynamic Reports
You can filter the events that are displayed by constructing a conditional filter using the
fields at the bottom of the page, as shown in Figure 168. This lets you construct a
two-clause filter statement.
Figure 168: Event Log filter specification
You can filter on any of the variables shown in the report.
You can use the browser Copy and Paste functions to copy a specific value from the
current report into the comparison field. This is particularly useful if you want to filter
on a specific Varbinds value.
System Log Report
To view a System Log Report, click the Sys Log link in the left-hand panel. This creates
a report of all of the entries in the System Log. The information displayed includes the
following:
• Event #—Event ID of the syslog entry (assigned by the EPICenter server when the
syslog is received)
• Time—Time the syslog is received by EPICenter (local time of the EPICenter server)
• Source—IP address of the device that generated the syslog entry
• Facility—Syslog facility field
• Severity—Syslog severity field
• Message—Syslog message
The event information is displayed in groups of 25 events per page. You can navigate
among the pages using any of the following methods:
• Clicking the Previous and Next links
• Selecting a page number from the at the top of the report
472
EPICenter Software Installation and User Guide
Viewing Predefined EPICenter Reports
• Clicking the First or Last links to display the first or last page in the report
Click the heading of a column to sort on the contents of that column.
You can filter the events that are displayed by constructing a conditional filter using the
fields at the bottom of the page, as shown in . This lets you construct a two-clause filter
statement.
Figure 169: System Log filter specification
Configuration Management Log Report
To view a Configuration Management Log Report, click the Config Mgmt Log link in
the left-hand panel. This creates a report of all the entries in the Configuration
Management Log. The information displayed includes the following:
• Time—Time when the activity occurred (local time of the EPICenter server) .
• Device—IP Address of the device.
• Activity—Activity that occurred, such as uploading a configuration file, updating a
software image, and so on. The actual entries will be abbreviated in form similar to
“Get Cfg From Device” or “Put Cfg To Device.”
• Status—Status of the activity (Success or Failed).
• File—Name of the file involved in the upload or download.
• Descr—Description of the problem for a failed activity.
Click the heading of a column to sort on the contents of that column.
You can filter the management activity events that are displayed by constructing a
conditional filter using the fields at the bottom of the page, as shown in Figure 170. This
lets you construct a two-clause filter statement.
EPICenter Software Installation and User Guide
473
Dynamic Reports
Figure 170: Configuration Management Log filter specification
You can filter on any of the variables in the report.
Printing EPICenter Reports
Unlike the other EPICenter applets, you can print EPICenter reports using your
browser’s print function. To print a report, place the cursor in the pane where the port
is displayed, and use the browser’s Print button, or the Print command from the File
menu, to initiate the print.
Creating New Reports
The EPICenter software allows you to customize the existing EPICenter dynamic
reports, and to define new reports. Because the reports use HTML and Tcl, you can
incorporate the new or modified reports into the running EPICenter server without
requiring a restart. In addition, the EPICenter software includes features that aid in
debugging user changes.
All the files needed to create or modify reports can be found in the directory
<epicenter_install_dir>/user/reports, where <epicenter_install_dir> is the
directory where the EPICenter software resides (by default epc4_0 in the Windows
operating environment, or /opt/epc4_0 on a Solaris system). There are two
subdirectories under the reports directory:
• The html directory contains the HTML files displayed by the EPICenter server. The
HTML files in the reports directory have the following functions:
474
EPICenter Software Installation and User Guide
Creating New Reports
— index.html sets up the various frames for the browser display. It references
menu.html to define the menu on the left-hand side, and body.html for the
content in the main panel of the window.
— menu.html defines the menu items for the predefined reports, and includes links
to the html files that generate the reports. This is a generated file. You can use
this file in a customized report, but it is not user-modifiable.
— body.html defines the content that appears in the main panel of the window
when the Reports feature is requested, either from the EPICenter software
Start-up window, or from the icon on the Navigation Toolbar. Modify this file if
you want to change or add to the list of Reports and their descriptions.
— color1.html defines the color of the bar at the top of the main content window.
This is a generated file. You can use this file in a customized report, but it is not
user-modifiable.
— epistylesheet.css contains the style definitions used in the menu and main
body frames.
— reportstylesheet.css contains the style definitions used in the reports
themselves. To change the look of all reports, you can modify this stylesheet.
— The remaining files, such as device_summary.html, and vlan_summary.html,
define a number of the actual reports available from the Reports module.
Note that some of the reports (the Interface Report and the four Log reports) are
not user-modifiable, and are not included in the HTML directory.
• The tcl directory contains the following:
— The Tcl methods available for creating new reports
— The source code for the existing reports
The information presented in the remainder of this chapter assumes you have a
reasonably thorough understanding of both HTML and Tcl scripting.
Creating or Modifying a Report
You can modify an EPICenter report HTML file in any HTML editor, such as Microsoft
FrontPage.
You can modify the existing HTML files to change the look and feel of the report, your
icons, etc. The vlan_summary.html file is a good example.
EPICenter Software Installation and User Guide
475
Dynamic Reports
<html>
<head>
<meta http-equiv="Content-Type" content="text/html; charset=iso-8859-1">
<title>EPICenter - Vlan Reports</title>
<LINK REL=STYLESHEET HREF="reportstylesheet.css" TYPE="text/css">
</head>
<BODY bgcolor="#ffffff" marginwidth="20" marginheight="0" leftmargin="20"
topmargin="0">
<TABLE border="0" cellspacing="0" cellpadding="0" height="120px">
<TR valign="bottom"><TD>
<H2>Vlan Reports</H2>
</TD></TR>
<TR valign="top"><TD>
Information is available about the following vlans in EPICenter:<br>
Report generated on <extr>clock format [clock seconds]</extr></TD></TR>
<TR valign="bottom"><TD><P><img src="images/green.gif" width=650px
height=3px></P>
</TD></TR>
</TABLE>
<BR>
<!-- xxxxxxxxxxxxxxxxxxxxxxxxx -->
<p><font size="3"><extr>ShowVlanSummaryList</extr></font></p>
<p><font size="3"></font> </p>
<p><font size="3"></font> </p>
</body>
</html>
The vlan_summary.html file is just like a standard HTML file with one exception: it has
a new pair of tags, <extr> ... </extr> which are specific to the EPICenter report
server. The EPICenter report server treats everything defined between these tags as Tcl
476
EPICenter Software Installation and User Guide
Creating New Reports
code. The report server executes this code dynamically when it generates the report
(upon a user request through the browser).
You can use any standard Tcl constructs between these tags, and you can also use
methods defined in the “extr” package (extr.tcl). extr.tcl defines a set of methods
to obtain information from the EPICenter software database. Appendix C defines a
number of database views that contain information that may be useful in creating
reports.
In addition, you can define new methods in any Tcl file in the
<epicenter_install_dir>/user/reports/tcl directory, and use those methods
inside the HTML file within the <extr> and </extr> tags.
A number of reports have been defined for use as examples. Look at the various HTML
files to understand how <extr> tags are used within HTML files.
Look at the methods defined in the file user/reports/tcl/examples.tcl for details
on using these methods to generate the data that will become a part of the generated
report. Some utility methods have been provided in commands.tcl to help parse the
result that comes back from the EPICenter software API.
In general, the Tcl methods defined here will generate well-formatted HTML.
Everything between the <extr> and </extr> tags is replaced by HTML code generated
by the embedded Tcl code. Using this method, you can generate lots of new reports
quickly, and without disrupting the EPICenter software server.
Adding a User-Defined Report to the Reports Menu
To add a new user-defined report to the report menu, simply place the HTML file into
the <epicenter_install_dir>/user/reports/html/userdefined directory. The
EPICenter server automatically creates a link on the Reports menu for files in the
userdefined directory. It will use the report file names as the report names. They will
appear below the heading User Defined Reports at the bottom of the left-hand panel of
the Reports page.
The file names must conform to two restrictions:
• They must use .html as the extension. .htm is not supported.
• The file name may not contain spaces.
If you want to create a set of hierarchical reports, you can create a subdirectory under
the userdefined directory to contain subordinate HTML files that should not have a
direct link from the Reports menu.
EPICenter Software Installation and User Guide
477
Dynamic Reports
NOTE
If you put files into the userdefined directory that were originally in the
<epicenter_install_dir>/user/reports/html directory, be sure you also copy the
report stylesheet (reportstylesheet.css) into the userdefined directory.
Debugging
The EPICenter software provides a mechanism that you can use to debug any Tcl
procedures you write.
Debugging is done in the Tcl shell that is shipped with the EPICenter software. You do
not need to view your reports through a browser to debug them.
To debug Tcl code you have created or modified, follow these steps:
1 Run <epicenter_install_dir>/tcl/bin/tclsh83d.exe to invoke the Tcl shell.
2 Change to the <epicenter_install_dir>/user/reports/tcl directory.
3 Execute the command source extrdebug.tcl within the Tcl shell.
This sets up the Tcl packages required, and also establish a connection with the
database using the EPICenter software external API.
4 Now, run the command extr::ExecuteExtrCommand which parses your Tcl code
and displays the resulting HTML file.
ExecuteExtrCommand takes the following arguments:
— The name of the HTML file that will generate the report.
— A string containing the parameter that should that should be available to the
HTML file. The values for the parameters can be obtained in the various Tcl
methods using extr::GetSessionParam
You must ensure that the appropriate environment variables are set to allow access to
Tcl. These should be set as follows:
For Windows NT, set variables as follows:
TCL-LIBRARY=<epicenter_install_dir>/tcl/lib/tcl8.3
PATH=$PATH:<epicenter_install_dir>/tcl/bin
For Solaris, set the LD_LIBRARY_PATH variable as follows:
478
EPICenter Software Installation and User Guide
Creating New Reports
LD_LIBRARY_PATH=<epicenter_install_dir>/tcl/lib/tcl8.3
Useful Methods for Debugging
The GetfromDB, ExecuteExtrCommand and GetSessionParam methods are defined as
follows:
#####################################################################
# extr::GetFromDB
#
Used to make any SQL query to the database through the
#
Epicenter server. The result is a SQL result table,
#
formatted within HTML tags.
#
# Arguments
#
A string representing an SQL query.
# An optional callback function that is executed for each row of data
# Returns
#
The result table of an SQL query embedded in HTML tags.
#
#####################################################################
#####################################################################
# extr::ExecuteExtrCommand
#
This is the public method typically used during debugging.
#
When a user wants to run an HTML file through the reporting
#
engine, to generate dynamic html, s/he calls this method.
#
Users will need to use this method only during debugging.
#
# Arguments
#
filePath
This is the fully specified path of where to
#
find the HTML file that has embedded <extr> tags.
#
params
A string containing params and their values that
#
should be available to the procedures in the HTML files.
#
The parameters are specified as in HTML. i.e. the param
#
is a string of type "param1=value1¶m2=value2"
#
# Returns
#
The result of executing the command. Typically this is parsed HTML.
#
#####################################################################
#####################################################################
# extr::getSessionParam
#
Used in reports to get the value of a specific parameter
EPICenter Software Installation and User Guide
479
Dynamic Reports
#
that was passed into the reporting system.
#
This method, along with GetFromDB form the two most
#
commonly used routines by users of the reporting system.
#
The params passed into ExecuteExtrCommand are available
#
through this method.
#
# Arguments
#
param
A param name. This should be one of the params
#
that was passed into ExecuteExtrCommand.
# Returns
#
The value of the parameter. Returns "" if param was not defined.
#
#####################################################################
480
EPICenter Software Installation and User Guide
A Troubleshooting
This appendix describes how to:
• Resolve problems you may encounter that are related to the EPICenter server
• Resolve problems you may encounter while using the EPICenter client application
Troubleshooting Aids
If you are having problems with EPICenter, there are several things you can do to help
prevent or diagnose problems.
Using the Stand-alone Client Application
To enable debugging and log the output to a file in the stand-alone client application,
you can run the EPICenter client in debug mode.
In Windows NT/2000, enter one of the following commands at the prompt in a
command window or in the Run field.
If you have both server and client installed on the same system:
c:\epc4_0\runclient.exe DEBUG DEBUG > <logfile>
If you have the client only installed:
c:\epc4_0_client\runclient.exe DEBUG DEBUG > <logfile>
EPICenter Software Installation and User Guide
481
In Solaris, enter the one of the following commands at a command prompt.
If you have both server and client installed on the same system:
/opt/epc4_0/runclient DEBUG DEBUG >& <logfile>
If you have the client only installed:
/opt/epc4_0_client/runclient DEBUG DEBUG >& <logfile>
<logfile> is the name of the log file to be created. If you installed the client on a
different drive and directory, make the appropriate substitutions. Optionally, piping
output to “tee,” if you have it available, allows you to see the logs on the console as
well as logging the data into the file.
Be sure to use different log file names if you are running multiple clients on the same
machine.
Using the Browser-based Client (Windows Only)
NOTE
After a problem occurs, prior to pointing the browser to the EPICenter server, it is
recommended that you clear all browser cache information, including disk cache, and
close and re-open the browser.
If you are using the browser-based client, please try to duplicate the problem with the
Java Console enabled in Internet Explorer. Look at the Java Console window and
copy/paste (using [Ctrl]+C and [Ctrl]+V on Windows NT/2000) the contents into a text
file. If a problem occurs, Extreme Networks customer support may require the Java
Console output.
In addition, you can run the client in a debug mode in the browser:
1 Start the client with the URL http://<host>:<port>/everest/debug.
2 After you enter your login information, but before the main EPICenter page is
displayed, a page with debug settings is displayed.
3 Select Info for “Client Debug Level”
4 Click Submit Query.
This enables more detailed information to be logged.
482
EPICenter Software Installation and User Guide
EPICenter Client
Enable the Java Console
To facilitate problem diagnosis, you can attempt to duplicate the problem with the Java
Console enabled. To enable the Java Console, do the following:
1 From the Windows Start menu, select Programs, then Java Plug-in Control Panel
and launch the Control Panel.
2 On the Basic page, click the Show Java Console check box.
3 Click Apply.
The next time you launch the EPICenter client, the Java Console will start automatically.
NOTE
Running with the Java Console displayed may affect the performance of the EPICenter
client.
There is limited space for Java Console messages; once the console log file is filled, no
more messages will be recorded. If you are trying to duplicate a problem, clear the Java
Console log file periodically by clicking the Clear button at the bottom of the window.
You can close the Java Console by clicking the Close button at the bottom of the
window. However, once it is closed, it can only be restarted by closing and restarting
the browser.
EPICenter Client
Problem: Client is unable to connect to the EPICenter server.
Verify that the EPICenter Server process is running.
Verify that the server is running on the specified port. You can try to connect to the
server’s HTTP port using a browser. If the server is running and you are using the
correct port, the EPICenter main page will be displayed.
If you are running the client on the same system as the EPICenter server, you can also
use the Port Configuration utility to determine the port on which the EPICenter server
is running.
EPICenter Software Installation and User Guide
483
To run the Port Configuration utility, go to the Windows Start menu, and select
Programs, then EPICenter 4.0, then Port Configuration.
For more information on the Port Configuration utility, see Appendix B.
Problem: Colors in client interface are incorrect (Windows NT or Windows 2000).
The Color Palette must be set for 65536 colors (or True Color). If your display is set for
only 256 colors, the colors in the left-hand panel (the Navigation Toolbar) and the
EPICenter applets themselves may be incorrect.
To change the color palette, double-click the Display icon in the Control Panel, select
the Settings tab, and use the drop-down list in the Color Palette field to select the
appropriate setting.
Problem: After running for a while, the display disappears in some applets
(Windows, browser only).
Under some conditions in the browser client, the Java Plug-in can run out of memory. If
you are running with the Java Console enabled, you may see “Out of Memory” errors
recorded in the console log file. To alleviate this problem, you can grant the plug-in
more memory through the Java Plug-in Control Panel.
1 From the Windows Start menu, run the Java Plug-in Control Panel.
The Plug-in Control Panel should appear with the Basic page displayed.
2 In the Java RunTime Parameters field, enter the following without any embedded
spaces:
-Xmxnnnm
nnn is the maximum number of megabytes of virtual memory available to the plug-in.
For example, entering -Xmx128m allows the plug-in to use up to 128 MBytes of virtual
memory, and should prevent out-of-memory problem.
Problem: Browser does not bring up the Login page.
Verify the version of the browser you are using. See the system requirements in Chapter
1 or see the EPICenter Release Note and Quick Start Guide shipped with the software.
Problem: Browser client software loads and allows login, but data is missing or other
problems arise.
Clear your browser’s cache, exit the browser, and restart it. This frequently clears up
miscellaneous start-up problems in the client.
484
EPICenter Software Installation and User Guide
EPICenter Database
In Internet Explorer, clear cache by selecting Internet Options under the Tools Menu,
then clicking Delete Files under the Temporary Internet Files section of the General
tab.
Problem: Cannot cut, paste or print from the browser-based client, or save to the local
file system.
As of EPICenter 4.0 the browser-based client no longer supports cut/paste/print or
save from the browser-based client. These functions are supported only in the
stand-alone client application.
EPICenter Database
Problem: DBBACKUP utility will not run if LD_LIBRARY_PATH variable is not set
correctly
In order for DBBACKUP to run, the LD_LIBRARY_PATH environment variable must
include the path <install_dir>/database (by default, /opt/epc_30/database). There
are some needed .so files in that directory. (10051)
Problem: Database server will not restart after incorrect shut down
If the EPICenter server is shut down incorrectly, the database may be left in an invalid
state. In this case, an “Assertion failed” error may occur when attempting to restart the
server.
To recover the database in Windows NT or Windows 2000, do the following:
1 Open a DOS command window.
The following commands assume you have accepted the default installation location,
c:\epc4_0. If you have installed EPICenter in a different location, substitute the
correct installation directory in the commands below.
2 Go to the EPICenter install directory:
cd c:\epc4_0
3 Add the EPICenter database directory to your path:
set path=c:\epc4_0\database;%path%
4 Execute the following command:
database\dbeng7.exe -f basecamp.db
EPICenter Software Installation and User Guide
485
5 Watch the output from this command. If the database program indicates it cannot
recover the database, delete the database log:
del basecamp.log
and try executing the previous command again:
database\dbeng7.exe -f basecamp.db
6 If the database is successfully recovered, restart the server.
If the database cannot be recovered, you will need to restore the database from a
backup. See Appendix E for instructions on restoring the database from a backup.
To recover the database in Solaris, do the following:
1 Open a shell window (csh is used for the following example).
The following commands assume you have accepted the default installation location,
opt/epc4_0. If you have installed EPICenter in a different location, substitute the
correct installation directory in the commands below.
2 Go to the EPICenter install directory:
cd /opt/epc4_0
3 Make sure the LD_LIBRARY_PATH environment variable is set to the EPICenter
directory installation directory:
setenv LD_LIBRARY_PATH /opt/epc4_0/database
4 Execute the following command:
database/dbeng7.exe -f basecamp.db
5 Watch the output from this command. If the database program indicates it cannot
recover the database, delete the database log:
rm basecamp.log
and try executing the previous command again:
database/dbeng7.exe -f basecamp.db
6 If the database is successfully recovered, restart the server.
If the database cannot be recovered, you will need to restore the database from a
backup. See Appendix E for instructions on restoring the database from a backup.
486
EPICenter Software Installation and User Guide
EPICenter Server Issues
EPICenter Server Issues
Problem: Cannot talk to a specific switch.
Verify that the switch is running ExtremeWare software version 2.0 or later.
Ping the switch’s IP address to verify availability of a route. Use the ping command
from a MS DOS or Solaris command shell.
Verify that the read and write community strings used in the EPICenter match those
configured on the switch.
Problem: ExtremeWare CLI or ExtremeWare Vista changes are not reflected in
EPICenter.
Verify that the switch is running ExtremeWare software version 2.0 or later.
From the Inventory Manager, click Sync to update the information from the switch.
This refreshes the switch specific data, validates the SmartTrap rules, and ensures that
the EPICenter server is added as a trap receiver (Extreme switches only).
If the problem persists, verify that the EPICenter workstation has been added in the list
of trap destinations on the given switch:
1 Telnet to the switch.
2 Log in to the switch.
3 Type show management to verify that the system running the EPICenter is a trap
receiver.
An Extreme switch can support a maximum of 6 trap destinations in ExtremeWare 2.0,
and up to 16 trap destinations with ExtremeWare 4.1 or greater. If EPICenter is not
specified as a trap destination, then no SmartTraps are sent, and the data is not
refreshed. If you need to remove a trap receiver, use the command:
config snmp delete trapreceiver <ipaddress>
For details, see the ExtremeWare Software User Guide.
EPICenter Software Installation and User Guide
487
Problem: Need to change polling interval, SNMP request time-out, or number of
SNMP request retries.
You can change the default values for the SNMP polling interval, the SNMP request
time-out, or the number of SNMP request retries, through the Administration applet,
Server Properties page. You must stop and restart the EPICenter server to have your
changes take effect.
See Chapter 16 for information on the EPICenter Administration applet. See Chapter 3
for instructions on stopping and starting the EPICenter server.
Problem: Need to change the Telnet or HTTP port numbers used to communicate
with managed devices.
You can change the port numbers for all managed switches through the Administration
applet, Server Properties page. You must stop and restart the EPICenter server to have
your changes take effect.
See Chapter 16 for information on the EPICenter Administration applet. See Chapter 3
for instructions on stopping and starting the EPICenter server.
Problem: Telnet polling messages can fill up a device’s syslog file.
For switches running older versions of ExtremeWare (prior to 6.0), the EPICenter server
uses telnet polling to get EDP topology and ESRP information. However, each telnet
login and logout message is logged to the switch’s log file, and will eventually fill up
the log.
You can disable EDP and ESRP logging through the EPICenter Administration applet,
Server Properties page. This will also avoid the syslog messages.
See Chapter 16 for information on the EPICenter Administration applet. See Chapter 3
for instructions on stopping and starting the EPICenter server.
Problem: Traps may be dropped during a trap “storm.”
The EPICenter server limits its processing of traps in order to be able to reliably handle
trap storms from a single or multiple devices. EPICenter limits its trap processing to 20
traps every 28 seconds from an individual device, and a total of 275 traps every 55
seconds system-wide. Any traps that occur beyond these limits will be discarded, but
will be noted in the log.txt file.
488
EPICenter Software Installation and User Guide
VLAN Manager
Exceeding the first limit (>20 traps in 28 seconds) is rare, and should be considered
abnormal behavior in the managed device. If you are managing a large number of
devices, you may reach the total (275) limit in normal circumstances. If you are
managing more than 1000 devices, it is recommended that you increase the total
number of traps to 500.
The trap processing limits can be changed through server properties in the
Administration applet. See Chapter 16 for more information on setting EPICenter server
properties.
Problem: Under Solaris, an error occurs when attempting to enable the EPICenter
Syslog server function.
By default, Solaris runs its own Syslog server. This causes an error “Syslog Server
unable to start: Address already in use” when you attempt to enable the EPICenter
syslog server. You must first stop the Solaris syslog server in order to have EPICenter
act as a Syslog receiver. To stop the Solaris Syslog server, use the command:
/etc/init.d/syslog stop
VLAN Manager
Problem: Multiple VLANs have the same name.
A VLAN is defined by the name, its tag value, and its protocol filter definition.
EPICenter allows multiple VLANs of the same name if one of the defining
characteristics of one VLAN is different from the other.
Problem: Multiple protocols have the same name.
EPICenter allows multiple protocols of the same name if one of the defining
characteristics of one protocol is different from the other.
Problem: Created a new protocol in VLAN Manager, but the protocol does not appear
on any switch.
When a new protocol is created, it is stored in the EPICenter database. EPICenter only
creates the protocol on a switch when the new protocol is used by a VLAN on that
switch.
EPICenter Software Installation and User Guide
489
Problem: Can only access one of the IP addresses on a VLAN configured with a
secondary IP address.
EPICenter does not currently support secondary IP addressing for a VLAN.
Problem: Configuration fails when attempting to configure a VLAN with a modified
protocol definition.
EPICenter does not have a mechanism to modify protocols. When a VLAN is
configured through EPICenter to use a protocol that does not exist on the switch, the
protocol is first created on the switch. However, if a protocol with the same name but a
different definition already exists on the switch, the operation will fail.
Problem: An untagged port has disappeared from its VLAN.
Check to see if the port has been added as an untagged port to a different VLAN. In
EPICenter, adding an untagged port to a VLAN automatically removes the port from its
previous VLAN if the port was untagged, and the new and old VLANs used the same
protocol. You should receive a warning message when this happens, which lets you
proceed with the auto-deletion or cancel the operation. This is different behavior from
the ExtremeWare CLI, where you must first delete the port from the old VLAN before
you can add it to the new VLAN.
Alarm System
Problem: Device is in a fault state that should generate a trap or syslog message, and
an alarm is defined to detect it, but the alarm does not appear in the EPICenter
Alarm Log.
There are several possible reasons this can occur. Check the following:
• Make sure that the alarm is enabled.
• Check that the device is in your alarm scope.
• Check that SNMP traps are enabled on the device.
• For a non-Extreme Networks device, make sure you have set EPICenter as a trap
receiver on the device (see Chapter 8).
• For an RMON alarm, make sure you have RMON enabled on the device.
490
EPICenter Software Installation and User Guide
Alarm System
• For Syslog messages, make sure that you have the EPICenter Syslog server enabled,
and that remote logging is enabled on the device with EPICenter set as a Syslog
receiver.
• The number of traps being received by the EPICenter server may exceed the number
of traps it can handle in a given time period, resulting in some traps being dropped
(see the item on dropping traps on page 488). You can change the limits for the
number of traps the server should accept (per minute and per 1/2 minute) in the
Administration applet. See Chapter 16 for more information on setting EPICenter
server properties.
Problem: The “Email to:” and “Short email to:” fields are greyed-out in the Actions
tab of the New Alarm Definition dialog.
You need to specify an e-mail server in order to send e-mail. Click the Settings... button
next to the Email to field to set up your mail server.
Problem: An RMON rule is defined to monitor a counter variable, and to cause an
alarm when the counter exceeds a certain value. The counter has exceeded the
threshold value but no alarm has occurred.
There are several things to check:
• Make sure the RMON rule and the alarm definition are set up correctly
• If the value of the counter was already above the threshold value when you set up
the RMON rule, and you have the Sample Type set to Absolute, no alarm will ever
be generated. This because the value must fall below the Falling Threshold value
before the before another Rising Threshold trap will be sent, and this will never
occur. You should consider using the Delta Sample Type instead.
Problem: When creating an RMON rule in the RMON Rule Configuration window,
the MIB variable I want to use is missing from the list of variables displayed when I
click “Lookup...”
The MIB Variable list displays only the MIBs shipped with the EPICenter software. In
addition, within those MIBs the variable list will not display variables that are indexed
by an index other than (or in addition to) ifIndex. You can still use variables that do not
appear in the Lookup... list, but you must type the complete OID into the MIB Variable
field, in numeric notation. If the variable is a table variable, you will need to append the
specific index and apply the variable to each target device, one at a time.
EPICenter Software Installation and User Guide
491
Problem: A program specified as an action for an alarm (in the Run Program field)
does not get executed. It includes output to the desktop among its functions.
If you are running the EPICenter server as a service, you must specifically tell it to
allow output to the desktop. To do this you must stop and restart the EPICenter server,
as follows:
1 In the Services properties window, select EPICenter 4.0 Server and click Stop. (To
find the Services window, from the Start menu select Settings, then Control Panel,
the double-click the Services icon).
2 When the EPICenter 4.0 Server service has be stopped, select it again and click
Startup.... This displays a pop-up window where you can specify start-up options.
3 In the lower part of the window, in the Log On As: area, click the box labeled Allow
Service to Interact with Desktop. Then click OK.
After the EPICenter server restarts, the program you have specified as an alarm action
should execute correctly.
To specify a batch file that does output to the desktop, you must specify the “.bat” file
within a DOS “cmd” command, as follows:
cmd /c start <file.bat>
where <file.bat> is the batch file you want to run.
Problem: Email alarm actions generate too much text for a text pager.
You can use the “Short email to:” option to send an abbreviated message appropriate
for a text pager or cell phone. The short email provides only very basic alarm
information. See Chapter 5 for more details on using the email options as an alarm
action.
Problem: Alarm action that executes a script does not run to completion.
Check to determine if a command in the script has failed. If one command in the script
fails, the rest of the script will not be executed. This is expected behavior.
492
EPICenter Software Installation and User Guide
ESRP Manager
If you want to execute multiple script commands regardless of individual command
failure, you must catch the exception thrown in each command. For example, a script
action:
catch {do Command1}
catch {do Command2}
will execute Command2 even if command1 fails. For detailed information on how to
use the Tcl script, consult the Tcl man pages or Help file at http://www.tcl.tk.
ESRP Manager
Problem: None of the member VLANs of an ESRP group are appearing in the ESRP
Manager applet.
Make sure that all members of the ESRP group use the same election algorithm. If there
is an election algorithm mismatch between any of the ESRP-enabled switches in any of
the ESRP-enabled VLANs in the ESRP group, this causes a misconfiguration scenario,
and ESRP will not function. As a result, none of the members of the ESRP group will
appear in the ESRP Manager applet.
Problem: Some of the switches in an ESRP-enabled VLAN are missing from the
ESRP Manager applet.
Make sure that the Hello Timer (ESRP Timer) is set to the same interval for all
ESRP-enabled switches. If there is a timer mismatch, ESRP will not function correctly,
and the ESRP Manager applet will not be able to detect ESRP switch neighbors that are
not being managed by the EPICenter software.
Problem: Devices running ExtremeWare 4.x are not being polled for ESRP
information.
The EPICenter server uses Telnet polling to add and update ESRP information for
devices running ExtremeWare 4.x. If you have the “Poll devices using Telnet” option
disabled in the Administration applet, no ESRP information will be obtained for these
devices. You can enable telnet polling through the Server Properties page in the
Administration applet. See Chapter 16 for more information.
EPICenter Software Installation and User Guide
493
Inventory Manager
Problem: Discovery returns an error if more than 10,000 IP addresses are specified for
a discovery operation.
Discovering more than 10,000 IP addresses can consume too much memory in the
EPICenter server. As a result, the server does not allow more than 10,000 IP addresses
to be discovered at once. If you need to discover more than 10,000 devices, you must
split your discovery into multiple operations.
Problem: Multiple switches have the same name.
This is because the sysName of those switches is the same. Typically, Extreme Networks
switches are shipped with the sysName set to the type of the switch “Summit48,”
“Summit1i,” “Alpine3808,” and so on, depending on the type of switch.
You can change the way names are displayed through a sever property in the
Administration applet. You can display devices in the Component Tree by name or by
IP address and name. See Chapter 16 for more information on setting EPICenter server
properties.
Problem: Discovery does not display the MAC address for some devices in discovery
results list. In addition, may not add the device to inventory (primarily happens with
workstations).
If the MAC address is not found in the first instance of ifPhysAddress, it is not
displayed in the discovery results table. However, when the device is selected to be
added to the EPICenter inventory, the Inventory applet searches all the ifPhysAddress
entries for the device, and will use the MAC address found in this manner. If no MAC
address is found in any ifPhysAddress entry, the device will not be added to the
EPICenter database.
Problem: Attempted to add a switch in the Inventory Manager after rebooting the
switch, and received an “SNMP not responding” error.
If a switch has recently been powered on, it may take some time (a number of minutes)
before the device is completely initialized. This will be especially true of chassis devices
with many blades, or devices with a large number of VLANs configured on the device.
It the device has not completed its initialization, the Inventory Add process may return
an error. You can simply wait until the device has finished initializing and try the Add
function again.
494
EPICenter Software Installation and User Guide
ExtremeView
ExtremeView
Problem: For a device selected under Status, the Device Information panel shows
incorrect information, and the device image is not displayed correctly.
This can be caused by a device IP address that is in conflict with another device on the
network (a duplicate IP address). Remove the problem device from the EPICenter
inventory, and add it in again with the correct IP address.
Problem: While looking at a device in ExtremeView, the device view was suddenly
replaced by the top-level ExtremeView page.
This will happen if another EPICenter user removes the device from the database while
you are viewing it. If you are running with the Java Console enabled you may see an
error message indicating the device has been removed (as long as your console log has
not been filled up).
Problem: When device information is not displayed completely (for example, only a
generic image is displayed) no messages explaining the problem seems to appear.
These types of messages for ExtremeView are displayed as error messages in the Java
Console error log. These messages are really informational errors, but must be
displayed as errors in order to appear under the normal Java Console settings. To see
these messages, you must be running the Java Console (see “Enable the Java Console”
on page 483). Also, there must still be room left in the console log, as it stops displaying
messages when it fills up.
Problem: After initiating a switch reboot from the switch configuration page in
ExtremeView, the browser times out with an error (browser client only).
You can initiate a switch reboot from the Switch configuration page in the ExtremeView
applet However, because the switch is rebooting, it does not respond to the browser’s
forms submission, and the browser will time out and report an error (Error: 504) instead
of refreshing the configuration page. Once the switch has successfully finished
rebooting, you can select it again in the Component Tree and the page will refresh
correctly.
EPICenter Software Installation and User Guide
495
Grouping Manager
Problem: Cannot import users from NT Domain Controller
The EPICenter Server must be running with permissions that enable it to get user
information from a Domain Controller. To verify and change permissions for the Web
Server, do the following:
1 From the Start menu, highlight Settings, pull right, and click on the Control Panel.
This displays the Control Panel folder.
2 Double-click on Services to display the Services Properties window.
3 In the Services properties window, select EPICenter 4.0 Server and click Stop. (To
find the Services window, from the Start menu select Settings, then Control Panel,
the double-click the Services icon).
4 When the EPICenter 4.0 Server service has be stopped, select it again and click
Startup.... This displays a pop-up window where you can specify start-up options.
5 In the lower part of the window, in the Log On As: area, enter the account name and
password for a user who has the appropriate permissions to access the Domain
Controller.
6 Click OK to restart the Web Server service to have the new user logon take effect.
Printing
Problem: When printing a topology map from the browser client, or a printing report,
the browser can appear to freeze.
Printing a report or a topology map can cause the browser utilization to become very
high (approaching 100%) and can spool a very large amount of memory. There is no
current solution other than to wait, and the process will eventually finish.
Topology
Problem: In Map Properties, changed the node background color, but only some of
the node backgrounds changed.
The background color affects submap nodes, device hyper nodes and device or
decorative nodes that do not display the device icon (either because the icon display is
496
EPICenter Software Installation and User Guide
STP Monitor
turned off or the nodes have been reduced in size to where the icon cannot be
displayed). For device nodes and decorative nodes with the device icon displayed, the
background color is transparent, and the background color setting is ignored.
Problem: A link has been moved, but the old link still appears as a down or
unknown link. In addition, if just one end of the link has been moved, an L2 cloud
node is added between the two endpoint devices.
When a previously “up” link disappears, the EPICenter server cannot tell if whether it
is down or has been physically moved, so it changes its status to down (or unknown).
EPICenter will detect the new link and add it as an up link, but it will not remove the
old link. If only one end of the link is moved, EPICenter detects two links (one up and
one down) that share the same endpoint on one side of the link. It interprets this to
mean that there is a hub between the two endpoint devices, and represents this as an L2
cloud.
To remove non-existent links and extraneous L2 clouds, you can use the Discover Links
command in the Topology applet. This command will remove all down links and
extraneous L2 clouds. Note that this command will also remove existing links that are
down, but EPICenter will rediscover and add back those links when they come back up.
Problem: The Discover Links command removed legitimate links that were down.
The EPICenter server cannot discover a link if the link is down. Therefore, when it
rediscovers links it will only discover up links (or partially up links in the case of
composite links). However, down links will automatically reappear when they come up
again. You can also use the Discover Links command again after the down links have
come back up.
STP Monitor
Problem: There are multiple STP nodes with the same name.
The EPICenter server identifies an STP domain by its name and tag. If you see multiple
STP domains in EPICenter, you may have a misconfiguration where the same STP
domains are configured with different tags on different switches.
EPICenter Software Installation and User Guide
497
Reports
Problem: After viewing reports, added a user-defined report, but it doesn’t appear in
the list of reports on the main reports page.
The Reports page updates the list of reports when the page is loaded. To update the list,
Refresh the page.
498
EPICenter Software Installation and User Guide
B EPICenter Utilities
This appendix describes several utilities and scripts shipped with the EPICenter
software:
• The DevCLI utility, that can be used to add, modify, delete, and sync devices and
device groups; and can be used to modify device configuration information from the
EPICenter database using the devcli command
• The Inventory Export scripts, that can be used to extract information from the
EPICenter inventory and output it to the console or to a file
• The SNMPCLI utility, that can be used to inspect the contents of device MIBs
• The Port Configuration utility, a Windows-only utility that you can use to change the
ports used by the EPICenter server
• The AlarmMgr utility, used to display alarm information from the EPICenter
database. Results can be output to a file.
• The FindAddr utility, used to find IP or MAC addresses within a set of devices or
ports (specified individually or as device or port groups). Results can be output to a
file.
• The TransferMgr utility, used to upload or download device configurations, or to
download new software versions.
• The VlanMgr utility, used to create, reset, and delete VLANs.
• The ImportResources utility, used to import resources into the Grouping Manager
from an external source such as an LDAP or NT Domain Controller directory.
EPICenter Software Installation and User Guide
499
The DevCLI Utility
The DevCLI utility allows you to add, modify, and remove devices and device groups
from an EPICenter database using a command line statement, rather than through the
EPICenter client user interface. You can add devices and device groups individually or
in groups, and you can specify arguments such as community strings and login and
passwords for both the EPICenter server and the devices. You can modify device and
device group settings as well as device configurations. You can specify a list of devices
in a file and have them added in a single operation.
The DevCLI is useful for updating the EPICenter inventory database quickly when
large numbers of devices or device groups are added, modified or removed, or if
changes occur frequently. It can also be useful when you want to duplicate the device
inventory and device group configurations across multiple installations of the
EPICenter server.
Using the DevCLI Commands
The utility is located in the root EPICenter install directory, by default \epc4_0 or
/opt/epc4_0 (in a UNIX environment).
The DevCLI utility supports the following four commands:
• devcli add <options> to add a device or device group.
To add device 10.205.0.99 to the EPICenter database on the local host, using the
default device user name and password, enter the following command at the
prompt:
devcli add -u admin -a 10.205.0.99
To add a device group to the EPICenter database with the name “Device Group 1,”
enter the following command at the prompt :
devcli add -u admin -g “Device Group 1”
• devcli mod <options> to modify a device or device group.
To modify the password on device 10.205.1.51 to use an empty string, enter the
command :
devcli mod -u admin -a 10.205.1.51 -d ““
500
EPICenter Software Installation and User Guide
The DevCLI Utility
NOTE
If you are running the DevCLI on a Windows platform, enter forward slashes to
separate empty double quotes to ensure the command executes correctly. For
example, to use the previous command in a Windows environment, enter the
command: devcli mod -u admin -a 10.205.1.51 -d \"\"
To modify the name of a device group from “Device Group 1” to “New Device
Group,” enter the following command at the prompt:
devcli mod -u admin -g “Device Group 1” -m “New Device Group”
• devcli del <options> to remove a device or device group.
To remove device 10.205.0.99 from the EPICenter database, enter the command:
devcli del -u admin -a 10.205.0.99
To remove a device group named “New Device Group” from the EPICenter
database, enter the command :
devcli del -u admin -g “New Device Group”
• devcli sync <options> to manually update device configurations.
To manually update the device configurations for device 10.205.0.99, enter the
command:
devcli sync -u admin -a 10.205.0.99
To manually update the configurations for the default device group, enter the
command:
devcli sync -u admin -g Default
NOTE
You can type either sync or syn when you use the devcli sync command.
These commands support a set of options for specifying device information such as
passwords and community strings, device group information such as device group
names and member devices, as well as information about the EPICenter server, such as
host name or IP address, port, and user name and password. You can also specify
multiple IP addresses in a file to have them added or removed as a group, as long as
they all use the same user name, password, and community strings.
EPICenter Software Installation and User Guide
501
Table 10 specifies the options you can use with these commands:
Table 10: DevCli command options
Option
Value
Default
-a
Device IP address. This option can be specified more
than once.
None
-c
Cisco enable password.
“”
-d
Device password.
“”
-e
Device group description.
None
-f
Input file name for IP addresses. This specifies an ascii
file that contains a list of IP addresses, one per line. No
other information can be included in this file.
None
This option can be specified more than once.
-g
Device group to which devices should be added. Case
sensitive. The device group must already exist.
Default
-h
Input file name for device groups. This specifies an ascii
file that contains a list of device group descriptions, one
per line. A device group description may be included by
enclosing both the device group name and the device
group in double quotes. The quotes sever to delimit the
two values.
None
This option can be specified more than once.
-i
Device poll interval, in minutes
0
-l
(Letter l) User name to use for device login
admin
-m
New device group name. Use this command when you
are modifying a device group
None
-n
EPICenter server port number
80
-p
EPICenter user password
“”
-r
Read community string (only needed for adding devices;
not needed for deleting them).
public
-s
EPICenter server hostname or IP address
localhost
-u
EPICenter user name
502
EPICenter Software Installation and User Guide
The DevCLI Utility
Table 10: DevCli command options (continued)
Option
Value
Default
-w
Write community string (only needed for adding devices;
not needed for deleting them).
“private”
Options such as the user login names and passwords and community strings, apply to
all devices specified in the command. You can specify multiple devices in one command
as long as they use the same options. If you have devices with different access
parameters, you must add or delete them in separate commands. The exception is when
removing devices or device groups, you do not need to specify community strings, so
you can remove multiple devices in a single command even it their community strings
are different.
Most options default to the values equivalent to those used by default on Extreme
Networks devices or in the EPICenter software.
You can specify only one EPICenter server (database) in a command. If you want to add
the same devices to multiple EPICenter databases, you must use a separate command
for each server. The command by default adds or removes devices from the EPICenter
database running on the local host at port 80.
DevCLI Examples
The following examples illustrate the usage of these commands.
• To add a device with IP address 10.205.0.99 to the EPICenter database running on
server snoopy on port 81, with EPICenter login “master” and password “king,” enter
the following command:
devcli add -u admin -a 10.205.0.99 -s snoopy -n 81 -u master -p king
• To add two devices (10.205.0.98 and 10.205.0.99) to the EPICenter database on the
local host, with read community string “read” and write community string “write,”
enter the following command:
devcli add -u admin -a 10.205.0.98 -a 10.205.0.99 -r read -w write
• To add multiple device groups specified in the file “devGroupList.txt” to the
EPICenter database, enter the following command:
devcli add -u admin -h devGroupList.txt
The file devGroupList.txt must be a plain ASCII text file containing one device
group name and one description (if applicable) per line, such as:
EPICenter Software Installation and User Guide
503
“Device Group 2”
Building B
dg4
“Marketing”
If a line has multiple words delimited by white space and the words are not
enclosed in double quotes, the whole line is interpreted as a device group name
without a device group description. If the device group name consists of multiple
words delimited by white space, and you want to specify a device group
description, you must use double quotes to enclose both the device group name and
the device group description.
• To modify the membership of a device group named “Engineering Device Group” to
remove any existing devices from the device group and add four new devices
(10.205.0.91, 10.205.0.92, 10.205.0.93, and 10.205.0.94) to the device group, enter the
following command:
devcli mod -u admin -g “Engineering Device Group” -a 10.205.0.91
-a 10.205.0.92 -a 10.205.0.93 -a 10.205.0.94
• To delete a set of devices specified in the file “devList.txt” with device login
“admin2” and password “purple,” enter the following command:
devcli del -u admin -f devList.txt -l admin2 -d purple
The file devList.txt must be a plain ASCII text file containing only IP addresses and
only one IP address per line, such as:
10.205.0.95
10.205.0.96
10.205.0.97
If more than one IP address is specified per line, only the first IP address is used.
• To delete two device groups (“Building A” and “Building C”) from the EPICenter
database, enter the following command:
devcli del -u admin -g “Building A” -g “Building C”
• To manually update the configurations of two devices (10.205.0.91 and 10.205.0.93),
enter the command:
devcli sync -u admin -a 10.205.0.91 -a 10.205.0.93
Inventory Export Scripts
There are three scripts you can run to export information about the devices or occupied
slots known to the EPICenter inventory. The scripts let you export information on
devices known to a single EPICenter installation, on slots known to a single EPICenter
504
EPICenter Software Installation and User Guide
Inventory Export Scripts
installation, or on devices known to multiple EPICenter servers. The information will be
output in comma-separated (CSV) format suitable for importing into a spreadsheet.
• For a device report, the information reported includes the device name and type, IP
address, location, serial and board numbers. If you use the Distributed server
version of this report, the name of the EPICenter server that manages the device will
also be included.
• For a slot report, it includes the device name and IP Address, slot number, slot name
and slot type, and the serial number of the blade in the slot.
Using the Inventory Export Scripts
The three scripts are located in the EPICenter user\scripts\bin directory under the
EPICenter install directory (by default \epc4_0 under Windows, or /opt/epc4_0 under
Solaris). You must have the user\scripts\bin directory as your current directory in
order to run these scripts.
There are three inventory export scripts you can use:
• inv.bat <options> (Windows), or inv.sh <options> (Solaris) exports device
information from the EPICenter database.
To export device information to file devinfo.csv under Windows, enter the
command:
cd epc4_0\user\scripts\bin
inv.bat -o devinfo.csv
Under Solaris, enter the command:
cd epc4_0/user/scripts/bin
inv.sh -o devinfo.csv
• slots.bat <options> (Windows), or slots.sh <options> (Solaris) exports slot
information from the EPICenter database.
To run the command as user “user1,” and export slot information to file
slotinfo.csv under Windows, enter the command:
cd epc4_0\user\scripts\bin
slots.bat -u user1 -o slotinfo.csv
Under Solaris, enter the command:
cd epc4_0/user/scripts/bin
slots.sh -u user1 -o slotinfo.csv
EPICenter Software Installation and User Guide
505
• msinv.bat <options> (Windows), or msinv.sh <options> (Solaris) exports device
information from the databases of multiple EPICenter servers. You must provide a
list of EPICenter servers in a file.
To export device information from the databases of EPICenter servers listed in file
servers.txt (in the scripts\config directory) to file alldevinfo.csv, without
prompting for a password under Windows, enter the command:
cd epc4_0\user\scripts\bin
msinv.bat -d -o alldevinfo.csv -s ..\config\servers.txt
Under Solaris, enter the command:
cd epc4_0/user/scripts/bin
msinv.sh -d -o alldevinfo.csv -s ../config/servers.txt
The server file defaults to the file servers.txt in the user\scripts\config
directory. You can edit this file to include the names or IP addresses of the servers
where the EPICenter server and databases are running. You can also provide your
own file. The format of the file entries are:
<servername or IP>:<port>
For example:
iceberg:80
10.2.3.4:81
Table 11 specifies the options you can use with these commands:
Table 11: Inventory script command options
Option
-d
Value
Default
None
If -p option not present, prompts
for password
If present, the command will use the default
EPICenter password (“”) and will not prompt
for a password.
-n
EPICenter server port number
80
-o
Name of file to receive output. If you don’t
specify a path, the file will be placed in the
current directory (user\scripts\bin).
output written to console (stdout)
-p
EPICenter user password
“”
-u
EPICenter user name
admin
506
EPICenter Software Installation and User Guide
Inventory Export Scripts
Table 11: Inventory script command options (continued)
Option
Value
Default
-s
For the msinv.bat and msinv.sh commands
only: Name (and path) of file containing
EPICenter server list
<epc_install_dir>\user\scripts\
config\servers.txt under Windows,
<epc_install_dir>/user/scripts/
config/servrs.txt under Solaris
NOTE
The inv.bat, inv.sh, slot.bat, and slot.sh scripts retrieve information only from an
EPICenter server that runs on the same machine as the scripts.
Inventory Export Examples
The following examples illustrate the usage of these commands.
• To export slot information to the file slotinventory.csv from the EPICenter
database whose login is “admin123” and password is “sesame” under Windows,
enter the following command:
slots.bat -u admin123 -p sesame -o slotinventory.csv
Under Solaris, enter the following command:
slots.sh -u admin123 -p sesame -o slotinventory.csv
This will not prompt for a password, and will output the results to the specified file.
• To export device information to the console, after prompting for a password under
Windows, enter the following command:
inv.bat
Under Solaris, enter the following command:
inv.sh
This command will login with the default user name (admin), will prompt for the
password, and will output the results to the console.
• To export device information to the console, using the default login and default
password under Windows, enter the following command:
inv.bat -d -o output.csv
Under Solaris, enter the following command:
inv.sh -d -o output.csv
EPICenter Software Installation and User Guide
507
This command will login using the default user name (admin) and the default
password, and will output the results to the file output.csv in the user\scripts\bin
directory.
• To export device information from the EPICenter databases on the multiple servers
under Windows, edit the servers.txt file in the user\scripts\config directory,
then enter the following command:
msinv.bat -d -o devices.csv -s serverlist2.txt
Under Solaris, edit the servers.txt file in the user/scripts/config directory, then
enter the following command:
msinv.sh -d -o devices.csv -s serverlist2.txt
This command logs in to each of the EPICenter servers specified in the file
serverlist2.txt, using the default login and password, and output the device
information from these servers to the file devices.csv. The devices.scv file is created
in the user\scripts\bin directory.
The SNMPCLI Utility
The SNMPCLI utility provides three basic SNMP query capabilities, that can be used to
access the values of MIB objects kept by the SNMP agents of the devices you are
managing. Accessing these variable may be helpful in diagnosing problems with a
device or its configuration, if its behavior as seen through the EPICenter software is not
as expected.
Use of this utility assumes you are familiar with SNMP MIBs, and can determine the
OID the variable you want to retrieve, as well as the meaning of the results that are
returned.
Using the SNMPCLI Utility
The three scripts are located in the EPICenter user\scripts\bin directory under the
EPICenter install directory (by default \epc4_0 under Windows, or /opt/epc4_0 under
Solaris). You must have the user\scripts\bin directory as your current directory in
order to run these scripts.
The SNMPCLI utility supports the following three commands:
• snmpcli snmpget <options> returns the value of a specified OID.
508
EPICenter Software Installation and User Guide
The SNMPCLI Utility
For example, to get the value of the object (the variable
extremePrimaryPowerOperational in the Extreme Networks MIB) whose OID is
.1.3.6.1.4.1.1916.1.1.1.10.0 on the device at 10.205.0.99, enter the following
command:
snmpcli snmpget -a 10.205.0.99 -o .1.3.6.1.4.1.1916.1.1.1.10.0
• snmpcli snmpnext <options> returns the value of the next OID (subsequent to the
OID you specify) in the MIB tree.
For example, you can use this command to get the value of the object whose OID is
.1.3.6.1.4.1.1916.1.1.1.10.0 on the device at 10.205.0.99, by entering the
following command:
snmpcli snmpnext -a 10.205.0.99 -o .1.3.6.1.4.1.1916.1.1.1.10
• snmpcli snmpwalk <options> returns the value of the entries in a table.
For example, to get the value of the entries in the extremeFanStatusTable, which
is OID .1.3.6.1.4.1.1916.1.1.1.9 on the device at 10.205.0.99, enter the following
command:
snmpcli snmpget -a 10.205.0.99 -o .1.3.6.1.4.1.1916.1.1.1.9
Table 12 specifies the options you can use with these commands:
Table 12: SnmpCli command options
Option
Value
Default
-a
Device IP address. This option can be specified more
than once. This option is required.
None
-o
Object Identifier (OID) of the MIB object whose value
you want to retrieve, or that is the starting point for the
values you want. This option is required.
None
-r
Read community string
public
-t
Timeout value for SNMP request, in milliseconds.
500 ms
SNMPCLI Examples
The following examples illustrate the usage of these commands.
• To retrieve the values of the extremePrimaryPowerOperational and
extremeRedundantPowerStatus variables for the Extreme Networks device with IP
EPICenter Software Installation and User Guide
509
address 10.205.0 99, with read community string “purple” and a timeout of 1000 ms,
enter the following command:
SnmpCli snmpget -a 10.205.0.99 -r purple -t 1000 -o
.1.3.6.1.4.1.1916.1.1.1.10.0 -o .1.3.6.1.4.1.1916.1.1.1.11.0
This returns the following:
IP Address: 10.205.0.99
Read community string: purple
Timeout(ms): 1000
OUTPUT:
OID: .1.3.6.1.4.1.1916.1.1.1.10.0 ;
OID: .1.3.6.1.4.1.1916.1.1.1.11.0 ;
VALUE: 1
VALUE: 1
• To retrieve the values from the extremeFanStatusTable variables for the Extreme
Networks device with IP address 10.205.0.99, with the default read community string
(public) and a default timeout, enter the following command:
SnmpCli snmpwalk -a 10.205.0.99 -o .1.3.6.1.4.1.1916.1.1.1.9
This returns the following:
IP Address: 10.205.0.99
Read community string: public
Timeout(ms): 500
OUTPUT:
OID: .1.3.6.1.4.1.1916.1.1.1.9.1.1.1
OID: .1.3.6.1.4.1.1916.1.1.1.9.1.1.2
OID: .1.3.6.1.4.1.1916.1.1.1.9.1.1.3
OID: .1.3.6.1.4.1.1916.1.1.1.9.1.2.1
OID: .1.3.6.1.4.1.1916.1.1.1.9.1.2.2
OID: .1.3.6.1.4.1.1916.1.1.1.9.1.2.3
;
;
;
;
;
;
VALUE:
VALUE:
VALUE:
VALUE:
VALUE:
VALUE:
1
2
3
2
2
2
Port Configuration Utility
The Port Configuration utility is a stand-alone utility that runs on the Windows NT 4.0
or Windows 2000 platform.
The EPICenter Port Configuration utility provides a way for an EPICenter administrator
to change some of EPICenter’s logical TCP/IP port numbers, in the event that there are
conflicts between these port numbers and those used by other software products
running on the same system. Because these port conflicts may prevent EPICenter from
running, the port configuration capability needs to be accessible outside of EPICenter.
510
EPICenter Software Installation and User Guide
Port Configuration Utility
The Port Configuration application runs on the same system as the EPICenter Database
Server and Web Server.
You can run the utility from the Programs menu. You do not need to shut down the
EPICenter services (Web Server or database) in order to change the port configurations.
However, the new configurations will not take effect until you restart the affected
server(s).
To run the Port Configuration utility, do the following:
1 Run the program from the Windows Start menu:
Select Programs, then EPICenter 4.0, then Port Configuration.
The EPICenter Port Configuration window appears, as shown in Figure 171.
Figure 171: EPICenter Port Configuration Utility
2 Type in new port values for the ports you want to change.
You can use the standard Windows Cut, Copy, and Paste functions from the Edit
menu, or use the keyboard shortcuts ([Ctrl]+X, [Ctrl]+C, and [Ctrl]+V) to move
values among the fields.
The Apply button is enabled when there is text in some edit field.
3 Click Apply to record the settings you have entered.
Click the Reset button for a specific port to reset that port to its default value. The
Reset button for a field is enabled when the corresponding values in the “Current
port value” field is something other than the default.
EPICenter Software Installation and User Guide
511
Click Done when you have finished making and applying changes. Any new text in
the edit fields, that has not been applied, is discarded.
The utility checks to see if it can open the requested new port number(s). If the new
port number is in use, the utility reports this fact and asks if you want to keep the
new value anyway.
4 To have the new port settings take effect, restart the server(s) whose ports you have
changed.
Changes do not take effect until the corresponding service is stopped and restarted.
However, after applying the new values, the entries under “Current port value” are
updated. This information can be misleading if you have not yet restarted the
corresponding services. In particular, if you dismiss and re-run the Port
Configuration utility before you restart the affected services, the “Current port
value” fields will reflect the changed values which are not yet in effect.
If the servers are running as system services, you can restart your system, or stop
and restart the servers using the Services utility from the Windows Control Panel.
If the EPICenter servers are not running as NT system services, you must manually
stop and restart the servers.
The AlarmMgr Utility
The Alarm Manager utility (AlarmMgr) enables you to access EPICenter alarm
information and output the results to a command window or to a file. This command
provides a command-line version of part of the functionality available in the EPICenter
Alarm Manager applet.
Using the AlarmMgr Command
The AlarmMgr utility is located in the EPICenter bin directory,
<EPICenter_install_dir>/bin. By default this is epc4_0\bin in Windows, or
/opt/epc4_0/bin in a UNIX environment.
This command includes options for specifying EPICenter server access information and
alarm filtering parameters.
The syntax of the command is as follows:
AlarmMgr -user <EPICenter username> <options>
512
EPICenter Software Installation and User Guide
The AlarmMgr Utility
The EPICenter user name is required. All other parameters are optional.
The basic command displays information about the last 300 alarms in the EPICenter
database. By using filtering options, you can display information about selected alarms.
You can specify a time period of interest as well as characteristics of the alarms you
want to include.
You can select alarms based on criteria such as the alarm name, severity, category,
source (the IP address or IP address and port that generated the alarm) and whether the
alarm has been acknowledged. You can combine many of these criteria so that only
alarms that meet all your criteria will be included in the results. For example, you may
want to display only critical alarms from a specific device, or all alarms in a specific
category that are not acknowledged.
Table 13 specifies the options you can use with this command:
Table 13: AlarmMgr command options
Option
Value
Default
-user <username>
EPICenter user name. This option is required.
None
-password <password>
EPICenter user password. If the password is blank,
do not include this argument.
No
password
-host <hostname | IP
address>
EPICenter server hostname or IP address
localhost
-port <port>
EPICenter server port number
80
-h <N>
Display alarms that occurred
within the last N hours
-d <N>
Display alarms that occurred N
days ago
-y
Display alarms that occurred
yesterday
EPICenter Software Installation and User Guide
These
options are
mutually
exclusive
and may not
be combined
Last 300
alarms
513
Table 13: AlarmMgr command options
Option
Value
-c <category>
Display alarms that occur for a
specific category. Category
specification is case insensitive.
Must be quoted if category name
includes spaces or other
delimiters.
-s <severity>
Display alarms that occur for a
specific severity. Severity
specification is case insensitive.
Default
When these
options are
combined, an
alarm must
meet all
criteria to be
included in
the results.
Each of
these options
may be
specified
only once.
All
categorie
s
All
severity
levels
-dip <IP address>
Display alarms that occur for a
specific device as specified by IP
address.
All
devices
-p <port>
Display alarms that occur for a
specific port on the device
specified with the -dip option.
All ports
-an <alarm name>
Display alarms that occur for a
specific alarm. Alarm name
specification is case insensitive.
Must be quoted if alarm name
includes spaces or other
delimiters.
All
alarms
-a
Display all acknowledged alarms.
All
alarms
-u
Display all unacknowledged
alarms.
-f <file specification>
Name of file to receive output. If you do not specify
a path, the file is placed in the current directory. If
the file already exists, it is overwritten.
Comman
d window
(stdout).
-help
Displays syntax for this command
None
• You can specify only one EPICenter server (database) in a command. If you want to
display alarms from multiple EPICenter databases, you must use a separate
command for each server.
• The options for specifying the relevant time period (-h, -d, and -y) are mutually
exclusive and cannot be combined.
• You can specify filter options such as an alarm name or device (IP address) only
once per command. If you want to display information for a several values of a filter
514
EPICenter Software Installation and User Guide
The AlarmMgr Utility
option, such as several alarm names, devices, severity levels, etc., you must execute
an AlarmMgr command for each value of the filter option. For example, to display
alarms for two different devices, you must execute two AlarmMgr commands.
• If you specify multiple filter options, they are combined in the manner of a logical
AND. This means that an alarm entry must meet all the specified criteria to be
included in the command results.
• The options for specifying the relevant time period are mutually exclusive and
cannot be combined.
• You should not combine the -a and -u options (for acknowledged and
unacknowledged alarms). This combination indicates you want to display alarms
that are both acknowledged and unacknowledged. However, there are no alarms
that meet this criteria since an alarm cannot be both. To display both alarms that are
acknowledged and alarms that are unacknowledged, do not specify either option.
AlarmMgr Output
The output from the AlarmMgr command is displayed as tab-delimited ascii text, one
line per alarm. Each line contains the following information:
• ID: Event ID of the alarm (assigned by the EPICenter server when the alarm is
received)
• Name: Name of the alarm
• Category: Category that the alarm is classified under
• Severity: Severity level of the alarm
• Source: IP address of the device that generated the alarm
• Time: time the alarm occurred, reported as Greenwich Mean Time
• Message: Message associated with the alarm
• Acked: Whether the alarm has been acknowledged (true or false)
AlarmMgr Examples
The following examples illustrate the usage of these commands.
• To display the last 300 alarm log entries in the EPICenter database running on the
local server, as user admin with the default password, enter the following command:
AlarmMgr -user admin
EPICenter Software Installation and User Guide
515
• To display the last 300 alarm log entries in the EPICenter database running on server
snoopy on port 81, with EPICenter login “master” and password “king,” enter the
following command:
AlarmMgr -host snoopy -port 81 -user master -password king
• To display all alarm log entries for the alarm named FanFailed in the local EPICenter
database that occurred yesterday and are unacknowledged, enter the following
command:
AlarmMgr -user admin -y -u -an “Fan Failed”
• To find all alarm log entries that were generated from port 12 on device 10.2.3.4, and
place the results in the file device1.txt enter the following command:
AlarmMgr -user admin -dip 10.2.3.4 -p 12 -f device1.txt
The FindAddr Utility
Using the Find Address command (FindAddr) you can specify a Media Access Control
(MAC) or Internet Protocol (IP) network address, and a set of network devices (or ports
on a device) to query for those addresses. The command returns a list of the devices
and ports associated with those addresses, and output the results to the command
window or to a file.
This command provides a command-line version of the functionality available in the
EPICenter IP/MAC Address Finder applet.
Using the FindAddr Command
The FindAddr utility is located in the EPICenter bin directory,
<EPICenter_install_dir>/bin. By default this is epc4_0\bin in Windows, or
/opt/epc4_0/bin in a UNIX environment.
This command includes options for specifying EPICenter server access information, the
address to be located, and a search domain (an individual device and ports, or a device
or port group).
The syntax of the command is as follows:
FindAddr -user <EPICenter username> <address options> <search domain
options> <other options>
516
EPICenter Software Installation and User Guide
The FindAddr Utility
The EPICenter user name is required. You must also include at least one search address
specification, and a search domain specification.
The FindAddr command returns a list of MAC and IP addresses and the devices and
ports associated with those addresses.
Table 14 specifies the options you can use with this command:
Table 14: FindAddr command options
Option
Value
Default
-user <username>
EPICenter user name. This option is required.
None
-password <password>
EPICenter user password. If the password is blank,
do not include this argument.
No
password
-host <hostname | IP
address>
EPICenter server hostname or IP address.
localhost
-port <port>
EPICenter server port number.
80
Do not specify this after the -dip option or it will be
taken as a search domain specification.
-f <file specification>
Name of file to receive output. If you do not specify
a path, the file is placed in the current directory. If
the file already exists, it is overwritten.
Comman
d window
(stdout)
-help
Displays syntax for this command.
None
Search address options:
-all
Display all addresses located in
the search domain.
-mac <mac_address>
Locate the specified MAC address.
The address must be specified as
six two-digit hexadecimal values
separated by colons
(xx:xx:xx:xx:xx:xx). You can
specify a wildcard address by
specifying asterisks instead of the
last three values (for example,
21:14:18:*:*:*).
At least one
of these
options is
required.
None
The -mac
and -ip
options may
be combined.
This option may be repeated.
-ip <IP address>
Locate the specified IP address.
This option may be repeated.
EPICenter Software Installation and User Guide
517
Table 14: FindAddr command options
Option
Value
Default
Search domain options:
-dg <device group>
Defines the search domain to
include the specified device group.
-pg <port group>
Defines the search domain to
include the specified port group.
At least one
of -dip, -dg,
or -pg must
be provided.
None
These
options may
be repeated
and
combined.
-dip <IP address>
Defines the search domain to
include the device specified by the
IP address.
-port <port>
Defines the search domain to include one or more
ports on the device specified by the -dip option.
Multiple ports can be specified separated by
commas. Slot and port are specified as slot:port.
For example, 1:2,2:3
All ports
on the
device
Important: If used, this option must immediately
follow the -dip option to which it applies.
• You can specify only one EPICenter server (database) in a command. If you want to
search devices from the inventory databases of multiple EPICenter servers, you must
use a separate command for each server.
• You can specify multiple IP and MAC addresses as search items by repeating the -ip
or -mac options.
— For MAC addresses, you can specify a wildcard for the last three values in the
address (such as 10:11:12:*:*:*).
— Wildcards are not supported for IP addresses. To search for multiple IP addresses,
you can use the -all option, or include multiple -ip options.
— You can specify both an IP address and a MAC address as search addresses in
one command.
• You can specify each search domain option multiple times.
— Wildcards are not supported for device IP addresses. To include multiple devices
in the search domain, you can specify a device group that contains the devices, or
specify multiple -dip options.
— To restrict the search domain to one or more ports on a device, specify the -port
option immediately after the -dip option. If you place it anywhere else in the
command, it will be taken as the server port specification.
518
EPICenter Software Installation and User Guide
The FindAddr Utility
— You can specify individual devices, device groups, and port groups in a single
command.
FindAddr Output
The output from the FindAddr command is displayed as tab-delimited text, one line per
address. Each line contains the following information:
• Both the MAC address and the corresponding IP address.
• The switch and port to which the address is connected.
• The user (name) currently logged in at that address, if applicable.
The output also tells you the total number of addresses found, and lists any switches in
the search domain that were unreachable.
FindAddr Examples
The following examples illustrate the usage of these commands.
• To display all addresses that can be accessed through devices in the Default device
group, from the local EPICenter database (with default user, password and port),
enter the following command:
FindAddr -user admin -all -dg Default
• To display all addresses that can be accessed through device 10.20.30.40, ports
5,6,7,8, in the EPICenter database running on server snoopy on port 81, with
EPICenter login “master” and password “king,” enter the following command:
FindAddr -host snoopy -port 81 -user master -password king -dip
10.20.30.40 -port 5,6,7,8 -all
Note that the second -port option immediately follows the -dip option. It must be
placed in this position to specify ports as the search domain.
• To search for MAC addresses beginning with 00-01-03, and write the results to the
file “info.txt,” with the Default device group as the search domain, enter the
following command:
FindAddr -user admin -mac 00:01:03:*:*:* -dg Default -f info.txt
If the file does not already exist, it will be created, by default in the EPICenter bin
directory.
EPICenter Software Installation and User Guide
519
The TransferMgr Utility
The Transfer Manager utility (TransferMgr) allows you to upload configuration
information from a device to a file, and to download configuration information and
ExtremeWare software images to Extreme devices.
This command provides a command-line version of some of the functionality available
in the EPICenter Configuration Manager applet.
Using the TransferMgr Command
The TransferMgr utility is located in the EPICenter bin directory,
<EPICenter_install_dir>/bin. By default this is epc4_0\bin in Windows, or
/opt/epc4_0/bin in a UNIX environment.
This command includes options for specifying EPICenter server access information, the
transfer function to be performed (upload, download, incremental download, or
ExtremeWare image download), the device on which to perform the operation on, and
the file location on the server.
The syntax of the command is as follows:
TransferMgr -user <EPICenter username> -upload -dip <device address>
<upload location options>
TransferMgr -user <EPICenter username> -download <filename>
-dip <device address>
TransferMgr -user <EPICenter username> -incremental <filename>
-dip <device address>
TransferMgr -user <EPICenter username> -software <filename>
-dip <device address> {primary | secondary}
The EPICenter user name, one of the four transfer options, and a device IP address are
required. Other options are optional.
520
EPICenter Software Installation and User Guide
The TransferMgr Utility
Table 15 specifies the options you can use with this command:
Table 15: TransferMgr command options
Option
Value
Default
-user <username>
EPICenter user name. This option is
required.
None
-password <password>
EPICenter user password. If the password
is blank, do not include this argument.
No password
-host <hostname | IP
address>
EPICenter server hostname or IP address
localhost
-port <port>
EPICenter server port number
80
-help
Displays syntax for this command
None
-upload
Upload configuration from the device
specified with the -dip option.
None
-dip <IP address>
IP address of device from which
configuration should be uploaded. This
option is required, and may be repeated.
None
-ft <string>
Text string to be appended to device IP
address to create a file name (in the
format xx_xx_xx_xx.string).
<ipaddress>.txt
-fl <directory>
Directory or path below the configs
directory where the upload file should be
placed. <tftp_root> is the location of your
TFTP server. By default, <tftp_root> is
<EPICenter_install_dir>\user\tftp.
<tftp_root>\config
s
-a
Place upload file into the archive directory
(<tftp_root>\configs\<year>\<month>\<day>
\ <ipaddress>_<time>.txt
<tftp_root>\config
s\<ipaddress>.txt
Upload configuration:
(xx_xx_xx_xx.txt)
This option may not be combined with the
-fl and -ft options.
EPICenter Software Installation and User Guide
521
Table 15: TransferMgr command options
Option
Value
Default
-download <filename | path
and filename>
Download configuration from the specified
file to the device specified with the -dip
option. The specified file must be located
in or below the <tftp_root>\configs
directory. By default, <tftp_root> is
<EPICenter_install_dir>\user\tftp.
None
-dip <IP address>
IP address of device to which configuration
should be downloaded. This option is
required. It may not be repeated.
None
Download configuration:
Download Incremental configuration:
-incremental <filename>
Download an incremental configuration
from the specified file to the device
specified with the -dip option. The specified
file must be located in the
<tftp_root>\baselines directory. By default,
<tftp_root> is
<EPICenter_install_dir>\user\tftp.
None
-dip <IP address>
IP address of device to which configuration
should be downloaded. This option is
required. It may not be repeated.
None
Download ExtremeWare software image:
-software <filename | path
and filename>
Download a software image from the
specified file to the device specified with
the -dip option. The specified file must be
located in the <tftp_root>\images directory.
By default, <tftp_root> is
<EPICenter_install_dir>\user\tftp.
None
Important: Make sure the software version
is compatible with the switch to which you
are downloading.
-dip <IP address>
IP address of device to which the image
should be downloaded. This option is
required. It may not be repeated.
None
-primary
Download to the primary image location.
Current location
-secondary
Download to the secondary image location.
522
EPICenter Software Installation and User Guide
The TransferMgr Utility
• You can specify only one EPICenter server (database) in a command. If you want to
upload or download to or from devices managed by multiple EPICenter servers, you
must use a separate command for each server.
• Configuration and image files are all stored in subdirectories of the EPICenter TFTP
root directory, which is by default <EPICenter_install_dir>\user\tftp. You can
change the location of the TFTP root directory by using the Server function of the
EPICenter Configuration Manager applet.
• Standard ExtremeWare software images as shipped by Extreme Networks are
provided in the directory <EPICenter_install_dir>\user\tftp\images directory
(by default epc4_0\user\tftp\images in the Windows operating environment, or
/opt/epc4_0/user/tftp/images on a Solaris system).
NOTE
Make sure the software version you download is compatible with the switch. If you
download an incompatible version, the switch may not function properly.
• For uploading, you can specify multiple devices in one command. For the download
options (-download, -incremental, and -software) you can specify only one device
per command. If you want to download to multiple devices, you must execute
multiple TransferMgr commands.
TransferMgr Examples
The following examples illustrate the usage of these commands.
• To upload configuration information from device 10.20.30.40, enter the following
command:
TransferMgr -user admin -upload -dip 10.20.30.40
This will place the device configuration information in the file 10_20_30_40.txt in
the configs directory under the TFTP root directory (by default
epc4_0/user/tftp/configs).
• To upload and archive configuration information from device 10.20.30.40 managed
by the EPICenter server running on host snoopy on port 81, with EPICenter login
“master” and password “king,” enter the following command:
TransferMgr -host snoopy -port 81 -user master -password king -upload -a
-dip 10.20.30.40
Assuming the default location for the TFTP root directory, and assuming that this
command was executed on July 24, 2001 at 10:02 AM, this will place the device
EPICenter Software Installation and User Guide
523
configuration information in the file
epc4_0\user\tftp\configs\2001\07\24\10_20_30_40_1002.txt.
• To download version 6.1.8 b11 of the ExtremeWare to an i-series device, enter the
following command:
TransferMgr -user admin -software v618b11.xtr -dip 10.20.30.40
The VlanMgr Utility
The VLAN Manager utility (VlanMgr) allows you to create and delete VLANs. These
commands configure the VLANs on the specified switches as well as adding the VLAN
information to the EPICenter database.
Using the VlanMgr Command
The VlanMgr utility is located in the EPICenter bin directory,
<EPICenter_install_dir>/bin. By default this is epc4_0\bin in Windows, or
/opt/epc4_0/bin in a UNIX environment.
This command includes options for specifying EPICenter server access information, the
operation to be performed (create, modify or delete), the name of the VLAN, and the
devices in the VLAN with their configuration options.
The syntax of the command is as follows:
VlanMgr -user <EPICenter username> -create <VLAN name> -dip
<IP address> <other options> {-dip <IP address> <other options>} ...
VlanMgr -user <EPICenter username> -modify <VLAN name> -dip
<IP address> <other options> {-dip <IP address> <other options>} ...
VlanMgr -user <EPICenter username> -delete <VLAN name>
The EPICenter user name and one of the main options (-create, -modify, or -delete)
are required. The -dip option is required for a create or modify command. Other
options are optional.
524
EPICenter Software Installation and User Guide
The VlanMgr Utility
Table 16 specifies the options you can use with this command:
Table 16: VlanMgr command options
Option
Value
Default
-user <username>
EPICenter user name. This option is required.
None
-password <password>
EPICenter user password. If the password is blank,
do not include this argument.
No
password
-host <hostname | IP
address>
EPICenter server hostname or IP address
localhost
-port <port>
EPICenter server port number
80
-help
Displays syntax for this command
None
-create <VLAN name>
Create a new VLAN of the specified name.
None
-dip <IP address>
IP address of device to add to VLAN. This option
may be repeated.
None
-port <ports>
Ports to be added to VLAN as
untagged ports on the device
specified by the preceding -dip
option.
No
untagged
ports
-tagport <ports>
Ports to be added to the VLAN as
tagged ports on the device
specified by the preceding -dip
option.
Create a new VLAN:
These
options must
immediately
follow the
-dip option to
which they
apply.
Each option
may be
specified
once per -dip
option.
No tagged
ports
-ipf
Enable IP forwarding for this VLAN
on the specified device.
-ip <IP address>/<subnet
mask>
Set an IP address and submask
for this VLAN on the specified
device. Format is xx.xx.xx.xx/nn
No ip
address
-tag <number>
Set a tag value for the VLAN.
Untagged
-protocol <protocol
name>
Set protocol filter.
ANY
EPICenter Software Installation and User Guide
IP
forwarding
disabled
525
Table 16: VlanMgr command options
Option
Value
Default
-modify <VLAN name>
Reset the configuration of the specified VLAN to
the options specified in this command.
None
-dip <IP address>
IP address of device to be included in the VLAN.
This option may be repeated.
None
-port <ports>
Ports to be included in the VLAN
as untagged ports on the device
specified by the preceding -dip
option. If this option is not
included, any untagged ports
configured on this device will be
removed from the VLAN.
These
options must
immediately
follow the
-dip option to
which they
apply.
No
untagged
ports
-tagport <ports>
Ports to be included in the VLAN
as tagged ports on the device
specified by the preceding -dip
option. If this option is not
included, any tagged ports
configured on this device will be
removed from the VLAN.
Each option
may be
specified
once per -dip
option.
No tagged
ports
-ipf
Enable IP forwarding for this VLAN
on the specified device. If this
option is not included, IP
forwarding will be disabled on this
device.
IP
forwarding
disabled
-ip <IP address>/<subnet
mask>
Set an IP address and submask
for this VLAN on the specified
device. Format is xx.xx.xx.xx/nn. If
this option is not included, the
VLAN will be reconfigured without
a VLAN IP address.
No IP
address
-tag <number>
Set a tag value for the VLAN. This can be a value
between 2 and 4095. If this option is not included,
the VLAN will be reset to an untagged VLAN.
Untagged
-protocol <protocol
name>
Set protocol filter. If this option is not included, the
protocol will be reset to ANY.
ANY
Modify VLAN configuration:
526
EPICenter Software Installation and User Guide
The VlanMgr Utility
Table 16: VlanMgr command options
Option
Value
Default
Delete the specified VLAN from all switches on
which it is configured.
None
Delete VLAN:
-delete <VLAN name>
• You can specify only one EPICenter server (database) in a command. If you want to
create, modify or delete VLANs for devices managed by multiple EPICenter servers,
you must use a separate command for each server.
• To create a VLAN on multiple switches, use multiple -dip options in a single
command.
• The -modify option effectively recreates a VLAN with only the options specified in
the command. Any options not specified are reset to their defaults, and only devices
specified with a -dip option in the modify command will be included in the VLAN.
WARNING!
Only the devices that are explicitly included in a VlanMgr modify command will be
included in the modified VLAN. Any devices in the original VLAN that are not
specified in the modify command will be removed from the VLAN as a result of the
modify command. Any options that are not explicitly specified will be reset to their
defaults.
For example, suppose you have untagged VLAN Test1 that includes ports 2, 3,and 4
on device 10.20.30.40. To add ports 1 and 2 on device 10.20.30.50 to the VLAN, you
can use the -modify command, but the command must specify both -dip
10.20.30.50 -port 1,2 and -dip 10.20.30.40 -port 2,3,4. If you do not
include device 10.20.30.40 in the command, that device and its ports will be removed
from the VLAN.
VlanMgr Output
The VlanMgr command displays output indicating the progress of the command as it
configures the VLAN.
VlanMgr Examples
The following examples illustrate the usage of these commands.
EPICenter Software Installation and User Guide
527
• To create untagged VLAN test1 consisting of untagged ports 2-5, on the switch with
IP address 10.20.30.01, and add it to the EPICenter database running the local server
with the default administrator name and password, enter the following command:
VlanMgr -user admin -create test1 -dip 10.20.30.01 -port 2,3,4,5
This VLAN will be created with no 802.1Q tag, protocol ANY, no IP address
assigned, and IP forwarding disabled.
• To create a tagged VLAN test2 with tag 53, protocol IP, on two switches with tagged
ports, IP forwarding enabled, and an IP address for the VLAN on each switch, enter
the following command:
VlanMgr -user admin -create test2 -dip 10.201.20.35 -tagport 10,11 -ipf
-ip 10.201.20.100/24 -dip 10.201.20.36 -tagport 11,12,13,14,15 -ipf -ip
10.201.20.102/24 -tag 53 -protocol ip
This creates the VLAN on switch 10.205.0.35 with member ports 10 and 11, VLAN IP
address 10.201.20.100 and VLAN mask 255.255.255.0, and on switch 10.205.0.36 with
member ports 11, 12, 13, 14 and 15, VLAN IP address 10.201.20.102 and mask
255.255.255.0.
• To add port 12 on switch 10.201.20.35 to VLAN test2, leaving the configuration
otherwise unchanged, enter the following command:
VlanMgr -user admin -modify test2 -dip 10.201.20.35 -tagport 10,11,12
-ipf -ip 10.201.20.100/24 -dip 10.201.20.36 -tagport 11,12,13,14,15 -ipf
-ip 10.201.20.102/24 -tag 53 -protocol ip
Note that this includes all the specifications of the original create command, with the
addition of port 12 to the first -tagport option. This is necessary to preserve the
VLAN configuration.
Specifying only the changes you want to make will not have the desired results. The
command VlanMgr -user admin -modify test2 -dip 10.201.20.35 -tagport
12 will result in an error because no VLAN tag is specified, and it is illegal to add a
tagged port to an untagged VLAN.
The command VlanMgr -user admin -modify test2 -dip 10.201.20.35
-tagport 12 -tag 53 (adding just the tag specification) will successfully add port
9 to the VLAN as a tagged port, but will remove all the other ports on that switch,
change the protocol to ANY, disable IP forwarding, and will remove switch
10.205.0.36 from the VLAN.
• To remove ports 14 and 15 on switch 10.201.20.36 from VLAN test2, enter the
following command:
528
EPICenter Software Installation and User Guide
The ImportResources Utility
VlanMgr -user admin -modify test2 -dip 10.201.20.35 -tagport 10,11 -ipf
-ip 10.201.20.100/24 -dip 10.201.20.36 -tagport 11,12,13 -ipf -ip
10.201.20.102/24 -tag 53 -protocol ip
• To remove switch 10.201.20.36 from VLAN test2, enter the following command:
VlanMgr -user admin -modify test2 -dip 10.201.20.35 -tagport 10,11 -ipf
-ip 10.201.20.100/24 -tag 53 -protocol ip
This command recreates the VLAN only on switch 10.201.20.35.
The ImportResources Utility
The ImportResources utility allows you to import user and host resource definitions,
and groups containing those resources, from a source external to the EPICenter system.
You can import from an NT Domain server, an NIS server, or an LDAP directory. You
can also import host and user resource definitions from a tab-delimited text file.
This utility performs the same function as the Import feature in the Grouping Manager.
See “Importing Resources” in Chapter 8 for details on this feature.
Using the ImportResources Command
The ImportResources utility is located in the EPICenter bin directory,
<EPICenter_install_dir>/bin. By default this is epc4_0\bin in Windows, or
/opt/epc4_0/bin in a UNIX environment.
This command includes options for specifying EPICenter server access information, the
operation to be performed (create, modify or delete), the name of the VLAN, and the
devices in the VLAN with their configuration options.
Importing from a File. To import data from a text file, you define the resources you
want to import in a tab-delimited text file. See “Importing from a File” in Chapter 8 for
details.
Importing from an LDAP Directory. Importing from an LDAP directory uses an
import specification file that defines the following:
• The information you want to extract from the directory.
• How to map that data to groups, resources, and attributes in the EPICenter
Grouping module.
EPICenter Software Installation and User Guide
529
The specification file must be named LDAPConfig.txt, and must reside in the
EPICenter user/import directory. See “Importing from an LDAP Directory” in
Chapter 8 for details.
Importing from an NT Domain Controller or NIS Server. Importing from an NT
Domain Controller or NIS server is always done from the Domain Controller or NIS
server that is serving the domain for the system running the EPICenter server. The type
of system you are running will determine where the EPICenter server looks for the
information. See “Importing from an NT Domain Controller or NIS Server” in Chapter 8
for details.
The syntax of the ImportResources command is as follows:
ImportResources -user <EPICenter username> -s <source name>
[-f <file name>| -ldap | -domain ]
The EPICenter user name and one of the import type options (-f, -ldap, or -domain)
are required.
Table 17 specifies the options you can use with this command:
Table 17: ImportResources command options
Option
Value
Default
-user <username>
EPICenter user name. This option is
required.
None
-password <password>
EPICenter user password. If the password
is blank, do not include this argument.
No password
-host <hostname | IP address>
EPICenter server hostname or IP address
localhost
-port <port>
EPICenter server port number
80
-help
Displays syntax for this command
None
-s <Source name>
A name that will identify the source of the
imported resources. This name is used to
create a group under which all the
resources imported in this operation are
placed.
None
-f <file name>
The name of a tab-delimited text file that
contains the data to be imported. See
“Importing from a File” in Chapter 8 for
details.
None
530
EPICenter Software Installation and User Guide
The ImportResources Utility
Table 17: ImportResources command options
Option
Value
Default
-ldap
Specifies that the information to be
imported is from an LDAP directory.
Requires a specification file named
LDAPConfig.txt, that resides in the
EPICenter user/import directory. See
“Importing from an LDAP Directory” in
Chapter 8 for details.
None
-domain
Specifies that the information to be
imported is from an NT Domain Controller
server or a Solaris NIS server. See
“Importing from an NT Domain Controller
or NIS Server” in Chapter 8 for details.
None
ImportResources Examples
The following examples illustrate the usage of these commands.
• To import resources from a tab-delimited file named importdata.txt into a source
group named ImportedUsers in the EPICenter database running the local server with
the default administrator name and password, enter the following command:
ImportResources -user admin -s ImportedUsers -f importdata.txt
• To import resources from an LDAP directory from a LDAP server into a source
group named CorpUsers in the EPICenter database running on host snoopy on port
81, with EPICenter login “master” and password “king,” enter the following
command:
ImportResources -host snoopy -port 81 -user master -password king
-s CorpUsers -ldap
This requires a configuration file named LDAPConfig.txt to be present in the
EPICenter user/import directory.
• To import resources from an NT Domain server into a source group named
NewUsers in the EPICenter database running the local server with the default
administrator name and password, enter the following command:
ImportResources -user admin -s NewUsers -domain
This imports user data from the NT domain controller that is serving the domain
where the EPICenter server resides.
EPICenter Software Installation and User Guide
531
532
EPICenter Software Installation and User Guide
C EPICenter Database Views
This appendix describes the most useful views in the EPICenter database for the
purpose of creating Tcl scripts for use in Reports or as Alarm actions.
The variables in these views can be accessed using the methods defined in the file
extr.tcl found in the <epicenter_install_dir>/user/reports/tcl directory, where
<epicenter_install_dir> is the directory where the EPICenter software resides. They
can also be used by external applications.
Device Report View
Table 18: EPICenter Database Device Report View
Extreme_Device_Report
Extreme_Device_Report is a database view that has one row for each device that is being
managed by the EPICenter server. Some of the columns in the view contain Extreme specific
information. If a device is not an Extreme device, the Extreme specific columns contain
empty values, such as an empty string.
Column Name
Column
Type
device_id
integer
A database unique id identifying a device.
column can be used as the primary key.)
enterprise_oid
integer
The enterprise id, e.g. 1916 for extreme networks.
EPICenter Software Installation and User Guide
Description
(This
533
Column Name
Column
Type
Description
system_oid
string
The partial system oid, e.g. “1916.2.7” for Summit 24.
device_group_name
string
The EPICenter device group name of the device
group in which this device belongs to.
device_type_name
string
The type of the device, e.g. “BlackDiamond 6808”
ip
string
The IP address of the device, e.g. “10.205.0.1”.
mac
string
The MAC address of the device, e.g.
“00:e0:2b:00:5e:00”.
sysName
string
The sysName of the device.
sysDescription
string
The sysDescription of the device.
sysLocation
string
The sysLocation of the device.
sysContact
string
The sysContact of the device.
read_write_community
string
The read/write SNMP community string.
read_only_community
string
The read-only SNMP community string.
clilogin
string
The CLI/Telnet login name of the device.
clipassword
string
The CLI/Telnet password for the above login.
status
string
The status of the device: “operational”, “marginal”, or
“not responding”.
boot_time
string
The boot time of the device in GMT, e.g. “2000-11-13
21:05:28”.
hardware_id
string
The vendor specific hardware id of the device (not all
device have a hardware id).
reserved
string
Reserved field, only used by a Cisco device to store
Cisco specific information.
ip_forwarding
string
“true” if the device is a router, “false” otherwise.
current_software
string
The software version of the device.
The following columns are Extreme specific:
primary_image
534
string
The primary software image version on the device,
e.g. “4.1.9 (2)”.
EPICenter Software Installation and User Guide
Device Report View
Column Name
Column
Type
secondary_image
string
The secondary software image version on the device,
e.g. “6.1.5b20”.
boot_rom
string
The version of the device’s boot rom, e.g. “7.2”.
image_after_reboot
string
The image to use after a switch reboot: “primary”,
“secondary”, “neither”, or “unknown”.
board_number
string
The hardware board number.
other_numbers
string
Other hardware board numbers.
serial_numbers
string
The serial number of the device.
fan_status
string
The status of all fans on the device, e.g. “fan 1 OK;
fan 2 OK; fan 3 OK”.
selected_configuration
string
The currently selected configuration on the device:
“primary” or “secondary”.
power_status
string
The status of the primary power supply of the device:
“fan/temperature alarm”, “not present”, “OK”, “failed”,
or “unknown”.
rps_status
string
The status of the redundant power supply of the
device: “fan/temperature alarm”, “not present”, “OK”,
“failed”, or “unknown”.
voltage
string
The voltage of the power supplied to the device: “110
AC”, “220 AC”, “48 DC”, or “unknown”.
temperature
integer
The current operating temperature of the device in
centigrade, e.g. 48.
default_gateway
string
The default gateway of the device, e.g. “10.205.0.1”.
EPICenter Software Installation and User Guide
Description
535
Interface Report View
Table 19: EPICenter Database Interface Report View
Extreme_Interface_Report
Extreme_Interface_Report is a database view that has one row for each interface that is
being managed by the EPICenter server. Some of the columns in the view contain Extreme
specific information. For interface that is not on an Extreme device, the Extreme specific
columns are empty, such as an empty string.
Column Name
Column
Type
device_id
integer
A database unique id identifying a device. (This
column and the ifIndex column below can be used
as the primary key.)
ifIndex
integer
The ifIndex of the interface. (This column and the
device_id column above can be used as the primary
key.)
ifType
integer
The ifType of the interface.
ifPhysicalAddress
string
The ifPhysicalAddress (MAC address) of the
interface.
ifDescription
string
The ifDescription of the interface.
port_name
string
The ifAlias of the interface.
configured_media
string
The configured media information of the interface,
e.g. “100BaseTX, full duplex”.
actual_media
string
The actual media information of the interface, e.g.
“10BaseTX, half duplex”.
auto_negotiation
string
The status of auto negotiation of the interface: “true”
or “false”.
admin_status
string
The admin status of the interface: “enabled” or
“disabled”.
operation_status
string
The operational status of the interface: “active”,
“ready”, or “failed”.
Description
The following columns are Extreme specific:
536
EPICenter Software Installation and User Guide
Database Event Log View
Column Name
Column
Type
IP_Address
string
The IP address of the device, to which this interface
belongs to, e.g. “10.205.0.31”.
port_number
string
The Extreme specific representation for the interface,
e.g. “1:3” or “12”.
redundant_media
string
Specify which media is active, for interfaces without
any redundant media, the value is always “primary”.
For interfaces with redundant media, the value can
be either “primary or redundant”.
algorithm
string
When the interface is in load-sharing mode, specify
the port sharing algorithm: “none”, “port based”,
“address based”, “round robin”, or “unknown”.
member_port_number
string
When the interface is in port sharing mode, specify
all members of the port sharing group, e.g. “1:1, 2:1,
2:2, 2:3”.
unsignedIPInt
integer
The IP address number of the device, to which the
interface belongs. This is the same IP address as in
the IP_Address column, except that the address is
represented using a unsigned 32-bit integer: e.g. the
IP Address “10.205.0.1” is represented as
181207041.
edge
string
Whether the port is classified as an “Edge” or
“Uplink” port.
Description
Database Event Log View
Table 20: EPICenter Database Event Log View
Event_Log_View
Event_Log_View is a database view that shows the EPICenter alarm event log, but making the
data from each column into a human readable format.
EPICenter Software Installation and User Guide
537
Column Name
Column
Type
event_log_id
integer
An unique id for the event log entry. (This column
can be used as the primary key.)
event_timeticks
integer
The time when the event happened. This time is
shown as milliseconds since 1970-01-01 00:00:00
GMT.
event_time
string
The time when the event happened. This is the
same time as the event_timeticks column except that
the time is shown as a string. E.g. “2000-10-21
14:20:21 GMT”
event_source
string
The IP (and the ifIndex, if appropriate) of the source,
from which the event is generated. E.g.
“10.205.0.31”, “10.205.0.31, port 2:1”, or “10.205.0.2,
ifIndex 10”.
event_type
string
The type of the event, e.g. “SNMP Trap: Cold Start”
event_ip
string
The IP address of the source, from which the event
is generated. E.g. “10.205.0.31”
event_generic
integer
For SNMP trap based event, this is the generic field
of the trap.
event_specific
integer
For SNMP trap based event, this is the specific field
of the trap.
event_enterprise
string
For SNMP trap based event, this is the enterprise
field of the trap.
event_varbinds
string
For SNMP trap based event, this is the varbinds of
the trap.
unsignedIPInt
integer
The IP address number of the device, from which the
event originates. This is the same IP address as in
the event_ip column, except that the address is
represented using a unsigned 32-bit integer: e.g. the
IP Address “10.205.0.1” is represented as
181207041.
event_count
integer
The number of consecutive traps of the same type
and source received for this event.
538
Description
EPICenter Software Installation and User Guide
Database Alarm Log View
Database Alarm Log View
Table 21: EPICenter Database Alarm Log View
Alarm_Log_View
Alarm_Log_View is a database view that shows the EPICenter alarm log, but making the data
from each column into a human readable format.
Column Name
Column
Type
alarm_time
integer
The time when the event happened. This time is
shown as milliseconds since 1970-01-01 00:00:00
GMT. This time is unique for all alarm logs. (This
column can be used as the primary key.)
alarm_name
string
The name of the alarm definition, to which this alarm
instance belongs.
alarm_category
string
The alarm category as defined in the alarm
definition.
source
string
The IP (and the ifIndex, if appropriate) of the source,
from which the event that triggered the alarm is
generated. E.g. “10.205.0.31”, “10.205.0.31, port
2:1”, or “10.205.0.2, ifIndex 10”.
severity
string
The severity of the alarm as defined in the alarm
definition.
msg
string
The alarm message as defined in the alarm
definition.
acked
byte
A byte value in hexadecimal representation
specifying whether the alarm is ack’ed or not, 00 –
not ack’ed; 01 – ack’ed.
event_log_id
integer
The event log id of the event that triggers the alarm.
unsignedIPInt
integer
The IP address number of the device, from which the
event that triggers the alarm originates. This is the
same IP address as in the event_ip column, except
that the address is represented using a unsigned
32-bit integer: e.g. the IP Address “10.205.0.1” is
represented as 181207041.
EPICenter Software Installation and User Guide
Description
539
540
EPICenter Software Installation and User Guide
D Event Types for Alarms
This appendix describes the events that can be detected through the EPICenter Alarm
System:
• SNMP traps
• RMON Rising and Falling traps
• EPICenter events
Unless stated otherwise, events defined below are applicable to all MIB-2 devices
managed by the EPICenter server.
SNMP Trap Events
Table 22: SNMP Trap Events
Event
Definition
Authentication Failed
This trap indicates that a SNMP request with an
invalid community string is issued to the device.
ExtremeWare
Version
All
BGP Backward Transition The BGPBackwardTransition Event is generated
when the BGP FSM moves from a higher numbered
state to a lower numbered state.
6.1.9 or later
BGP Established
6.1.9 or later
EPICenter Software Installation and User Guide
The BGP Established event is generated when the
BGP FSM enters the ESTABLISHED state.
541
Table 22: SNMP Trap Events
ExtremeWare
Version
Event
Definition
BGP Prefix Max
Exceeded
Extreme Networks proprietary trap. This trap
indicates that the number of prefixes received over
this peer session has reached the maximum
configured limit.
6.2.2 or later
BGP Prefix Reached
Threshold
Extreme Networks proprietary trap. This trap
indicates that the number of prefixes received over
this peer session has reached the threshold limit.
6.2.2 or later
Cold Start
This trap indicates that the device is rebooted by
power recycling. Extreme switches always send out
this trap after a reboot.
All
CPU Utilization Falling
Threshold
Extreme Networks proprietary trap. CPU Utilization
Falling Trap is generated when the
extremeCpuAggregateUtilization falls below 80% of
the extremeCpuUtilRisingThreshold.
6.2 or later
CPU Utilization Rising
Threshold
Extreme Networks proprietary trap. CPU Utilizations
Rising trap is generated when the value of
extremeCpuAggregateUtilization touches/crosses
extremeCpuUtilRisingThreshold.
6.2 or later
Dsx1 Line Status Change Extreme Networks proprietary trap. Indicates that the 6.1.8b66
DS1 line status change for the specified interface
has been detected.
Dsx1 Loss of Master
Clock
Extreme Networks proprietary trap. Indicates that the 6.1.8b66
wanDsx1LossOfMasterClock event for the specified
interface has been detected.
Dsx1 No Loss of Master
Clock
Extreme Networks proprietary trap. Indicates that the 6.1.8b66
wanDsx1NoLossOfMasterClock event for the
specified interface has been detected.
Dsx3 Line Status Change Extreme Networks proprietary trap. Indicates that the 6.1.8b66
T3 line status change for the specified interface has
been detected.
Dsx3 Loss of Master
Clock
Extreme Networks proprietary trap. Indicates that the 6.1.8b66
wanDsx3LossOfMasterClock event for the specified
interface has been detected.
Dsx3 No Loss of Master
Clock
Extreme Networks proprietary trap. Indicates that the 6.1.8b66
wanDsx3NoLossOfMasterClock event for the
specified interface has been detected.
EDP Neighbor Added
Extreme Networks proprietary trap. A new neighbor 6.1 or later
has been discovered through the Extreme Discovery
Protocol (EDP).
542
EPICenter Software Installation and User Guide
Table 22: SNMP Trap Events
ExtremeWare
Version
Event
Definition
EDP Neighbor Removed
Extreme Networks proprietary trap. No EDP updates 6.1 or later
have been received from this neighbor within the
configured timeout period, and this neighbor entry
has been aged out by the device.
EGPNbrLoss
An EGP neighbor for which the device is an EGP
None
peer is down and the peer relationship no longer
exists. An Extreme Networks switch never sends out
this trap.
ESRP State Change
Extreme Networks proprietary trap. This trap
indicates that the ESRP state (master or slave) of a
VLAN has changed on the device.
6.0 or later
Fan Failed
Extreme Networks proprietary trap. This trap
indicates one or more of the cooling fans inside the
device has failed. A fan OK trap will be sent once
the fan has attained normal operation. This trap is
sent repetitively every 30 seconds until all the fans
are back to normal condition.
All
Fan OK
Extreme Networks proprietary trap. This trap
indicates that a fan has transitioned out of a failure
state and is now operating correctly.
All
Health Check Failed
Extreme Networks proprietary trap. The CPU
HealthCheck has failed
6.1.5 or later
Invalid Login
Extreme Networks proprietary trap. This trap
All
indicates that a user attempted to login to console or
by telnet but was refused access due to incorrect
user name or password. The trap is issued after
three consecutive failure of log in.
Link Down
This trap indicates that a port becomes inactive from All
previous active state.
Link Up
This trap indicates that a port becomes active from
previous inactive state.
All
OSPF Interface
Authentication Failure
An ospfIfAuthFailure trap signifies that a packet has
been received on a non-virtual interface from a
router whose authentication key or authentication
type conflicts with this router’s authentication key or
authentication type.
6.1.9 or later
EPICenter Software Installation and User Guide
543
Table 22: SNMP Trap Events
ExtremeWare
Version
Event
Definition
OSPF Interface Config
Error
An ospfIfConfigError trap signifies that a packet has
been received on a non-virtual interface from a
router whose configuration parameters conflict with
this router’s configuration parameters. Note that the
event optionMismatch should cause a trap only if it
prevents an adjacency from forming.
6.1.9 or later
OSPF Interface Receive
Bad Packet
An ospfIfRxBadPacket trap signifies that an OSPF
packet has been received on a non-virtual interface
that cannot be parsed.
6.1.9 or later
OSPF Interface State
Change
An ospfIfStateChange trap signifies that there has
been a change in the state of a non-virtual OSPF
interface. This trap should be generated when the
interface state regresses (e.g., goes from Dr to
Down) or progresses to a terminal state (i.e.,
Point-to-Point, DR Other, Dr, or Backup).
6.1.9 or later
OSPF LSDB Approaching An ospfLsdbApproachingOverflow trap signifies that
Overflow
the number of LSAs in the router’s link-state
database has exceeded ninety percent of
ospfExtLsdbLimit.
6.1.9 or later
OSPF LSDB Overflow
An ospfLsdbOverflow trap signifies that the number
of LSAs in the router’s link-state database has
exceeded ospfExtLsdbLimit.
6.1.9 or later
OSPF Max_Age LSA
An ospfMaxAgeLsa trap signifies that one of the LSA 6.1.9 or later
in the router’s link-state database has aged to
MaxAge.
OSPF Neighbor State
Change
An ospfNbrStateChange trap signifies that there has
been a change in the state of a non- virtual OSPF
neighbor. This trap should be generated when the
neighbor state regresses (e.g., goes from Attempt or
Full to 1-Way or Down) or progresses to a terminal
state (e.g., 2-Way or Full). When an neighbor
transitions from or to Full on non-broadcast
multi-access and broadcast networks, the trap
should be generated by the designated router. A
designated router transitioned to Down will be noted
by ospfIfStateChange.
544
6.1.9 or later
EPICenter Software Installation and User Guide
Table 22: SNMP Trap Events
ExtremeWare
Version
Event
Definition
OSPF Originate LSA
An ospfOriginateLsa trap signifies that a new LSA
has been originated by this router. This trap should
not be invoked for simple refreshes of LSAs (which
happens every 30 minutes), but instead will only be
invoked when an LSA is (re)originated due to a
topology change. Additionally, this trap does not
include LSAs that are being flushed because they
have reached MaxAge.
6.1.9 or later
OSPF TX_Retransmit
An ospfTxRetransmit trap signifies than an OSPF
packet has been retransmitted on a non- virtual
interface. All packets that may be retransmitted are
associated with an LSDB entry. The LS type, LS ID,
and Router ID are used to identify the LSDB entry.
6.1.9 or later
OSPF Virtual Interface
Authentication Failure
An ospfVirtIfAuthFailure trap signifies that a packet
has been received on a virtual interface from a
router whose authentication key or authentication
type conflicts with this router’s authentication key or
authentication type.
6.1.9 or later
OSPF Virtual Interface
Config Error
An ospfVirtIfConfigError trap signifies that a packet
has been received on a virtual interface from a
router whose configuration parameters conflict with
this router’s configuration parameters. Note that the
event optionMismatch should cause a trap only if it
prevents an adjacency from forming.
6.1.9 or later
OSPF Virtual Interface
Receive Bad Packet
An ospfVirtIfRxBadPacket trap signifies that an
OSPF packet has been received on a virtual
interface that cannot be parsed.
6.1.9 or later
OSPF Virtual Interface
State Change
An ospfVirtIfStateChange trap signifies that there
has been a change in the state of an OSPF virtual
interface. This trap should be generated when the
interface state regresses (e.g., goes from Pointto-Point to Down) or progresses to a terminal state
(i.e., Point-to-Point).
6.1.9 or later
OSPF Virtual Interface TX An ospfVirtIfTxRetransmit trap signifies than an
Retransmit
OSPF packet has been retransmitted on a virtual
interface. All packets that may be retransmitted are
associated with an LSDB entry. The LS type, LS ID,
and Router ID are used to identify the LSDB entry.
6.1.9 or later
EPICenter Software Installation and User Guide
545
Table 22: SNMP Trap Events
ExtremeWare
Version
Event
Definition
OSPF Virtual Neighbor
State Change
An ospfVirtNbrStateChange trap signifies that there
has been a change in the state of an OSPF virtual
neighbor. This trap should be generated when the
neighbor state regresses (e.g., goes from Attempt or
Full to 1-Way or Down) or progresses to a terminal
state (e.g., Full).
Overheat
Extreme Networks proprietary trap. This trap
All
indicates that the on board temperature sensor has
reported an overheat condition. This indicates the
temperature has reached the Overheat threshold.
The switch will continue to function until it reaches
its shutdown threshold. The system will then
shutdown until the unit has sufficiently cooled such
that operation may begin again. A cold start trap will
be issued when the unit has come back on line. This
trap is sent repetitively every 30 seconds until the
temperature goes back to normal.
Ping Probe Failed
Generated when a probe failure is detected when
6.1.9 or later
the corresponding pingCtlTrapGeneration object is
set to probeFailure(0) subject to the value of
pingCtlTrapProbeFailureFilter. The object
pingCtlTrapProbeFailureFilter can be used to specify
the number of successive probe failures that are
required before this notification can be generated.
Ping Test Completed
Generated at the completion of a ping test when the 6.1.9 or later
corresponding pingCtlTrapGeneration object is set to
testCompletion(4).
Ping Test Failed
Generated when a ping test is determined to have
failed when the corresponding
pingCtlTrapGeneration object is set to testFailure(1).
In this instance pingCtlTrapTestFailureFilter should
specify the number of probes in a test required to
have failed in order to consider the test as failed.
6.1.9 or later
Power Supply Failed
Extreme Networks proprietary trap. This trap
indicates that one or more sources of power have
failed. Presumably a redundant power-supply has
taken over. This trap is sent repetitively every 30
seconds until all the power supplies are back to
normal condition.
All
546
6.1.9 or later
EPICenter Software Installation and User Guide
Table 22: SNMP Trap Events
ExtremeWare
Version
Event
Definition
Power Supply OK
Extreme Networks proprietary trap. This trap
All
indicates that one or more previously bad sources of
power have come back to life without causing the
device to restart.
Redundant Power Supply Extreme Networks proprietary trap. This trap
All
Failed
indicates that the attached redundant power supply
device is indicating an alarm condition. This trap is
sent repetitively every 30 seconds until the
redundant power supply is back to normal condition.
Redundant Power Supply Extreme Networks proprietary trap. This trap
OK
indicates that the attached redundant power supply
device is no longer indicating an alarm condition.
All
SLB Unit Added
Extreme Networks proprietary trap. This trap
indicates that the server load balancer has activated
a group of virtual servers that it normally would not
activate. This may be due to the failure of another
server load balancer.
6.1 or later
SLB Unit Removed
Extreme Networks proprietary trap. This trap
6.1 or later
indicates that the server load balancer has
deactivated a group of virtual servers that it normally
has active. This indicates that something is wrong in
the server load balancer; for example, its ping check
may be failing.
STP New Root
Extreme Networks proprietary trap. This trap
indicates that the sending agent has become the
new root of the Spanning Tree; the trap is sent by a
bridge soon after its election as the new root, e.g.,
upon expiration of the Topology Change Timer
immediately subsequent to its election.
STP Topology Change
Extreme Networks proprietary trap. A
6.2.2 or later
topologyChange trap is sent by a bridge when any of
its configured ports transitions from the Learning
state to the Forwarding state, or from the Forwarding
state to the Blocking state. The trap is not sent if a
newRoot trap is sent for the same transition.
Slot Change
Extreme Networks proprietary trap. This trap
indicates that the value of the
extremeSlotModuleState for the specified
extremeSlotNumber has changed.
EPICenter Software Installation and User Guide
6.2.2 or later
All
547
Table 22: SNMP Trap Events
ExtremeWare
Version
Event
Definition
Smarttrap
Extreme Networks proprietary trap. This trap
indicates that the value of one of the object
identifiers (or the value of an object below that in the
MIB tree) defined in the
extremeSmartTrapRulesTable has changed, and
hence a new entry has been created in the
extremeSmartTrapInstanceTable. Such a trap is sent
at most once every thirty seconds if one or more
entry was created in the last thirty seconds.
Warm Start
Trap indicates that the device has been rebooted
without power recycling. An Extreme Networks
switch never sends out this trap.
All
None
RMON Rising Trap Events
This trap indicates that the value of the MIB variable being monitored has risen to or
above the rising threshold value. RMON rules need to be configured on a device for it
to send out this trap. See “Threshold Configuration” in Chapter 5 for more information.
RMON Falling Trap Events
This trap indicates that the value of the MIB variable being monitored has fallen to or
below the falling threshold value. RMON rules need to be configured on a device for it
to send out this trap. See “Threshold Configuration” in Chapter 5 for more information.
EPICenter Events
An EPICenter event is generated by the EPICenter server based on the results of its
periodic polling. In some cases, an EPICenter event may result from the same condition
that could generate an SNMP or other trap. An EPICenter event has the advantage that
it guarantees that the condition will be detected (by polling) even if the corresponding
trap is missed.
548
EPICenter Software Installation and User Guide
RMON Falling Trap Events
Table 23: EPICenter Events, Detected Through Polling
Event
Definition
Configuration Upload Failed
The EPICenter server generates this event when it fails to
upload configuration information from a device. This event
occurs ONLY when the upload is attempted from
EPICenter, not if it was attempted from Telnet,
ExtremeWare Vista or any other method.
Configuration Upload OK
The EPICenter server generates this event when it
successfully uploads configuration from a device. This
event occurs ONLY when the upload is done from
EPICenter, not from Telnet, ExtremeWare Vista or any
other method.
Device Policy Configuration
The EPICenter server generates this event when it
encounters a problem configuring policies on a device
using ACL and QoS.
Device Reboot
The EPICenter server generates this event for a device
when it detects a device reboot (cold start or warm start).
Unlike the cold start or warm start SNMP trap, EPICenter
generates this event by polling the device.
Device Warning from EPICenter
For Extreme Networks devices only. The EPICenter
server generates this event in one of two situations:
Fan Failed
EPICenter Software Installation and User Guide
•
If the server detects and infinite loop while walking the
device’s SNMP MIB (may occur with ExtremeWare
4.1.19b2)
•
If the device has a bad serial number reported through
SNMP (may occur with ExtremeWare 6.2.1 on the
BlackDiamond 6816).
For Extreme Networks devices only. The EPICenter
server generates this event for an Extreme device when it
detects, via polling, a transition from fan OK to fan failed
condition on the device. Unlike the SNMP Fan Failed trap
event, this event is generated only once, based on a state
transition. As an alternative, you can detect a Fan Failed
condition by using the SNMP Fan Failed trap, which will
be generated every 30 seconds until the condition is
corrected.
549
Table 23: EPICenter Events, Detected Through Polling
Event
Definition
Overheat
For Extreme Networks devices only. The EPICenter
server generates this event for an Extreme device when it
detects a transition from normal temperature to overheat
condition on the device. Unlike the SNMP overheat trap
event, this event is based on a state transition, and will
be generated only once. As an alternative, you can detect
an Overheat condition by using the SNMP Overheat trap,
which will be generated every 30 seconds until the
condition is corrected.
Power Supply Failed
For Extreme Networks devices only. The EPICenter
server generates this event if the device reports a power
supply failure.
SNMP Unreachable
The EPICenter server generates this event when it fails to
communicate with a device following a previously
successful communication. In other words, this event is
generated when the state of communication with the
device transitions from reachable to unreachable.
SNMP Reachable
The EPICenter server generates this event when the
state of communication with the device transitions from
unreachable to reachable.
Syslog Flood
The EPICenter server generates this event if the server
receives syslog messages at a rate that exceeds the
user-defined limit set in the Administration applet via the
Scalability Properties. See “Server Properties
Administration” on page 435 in Chapter 16 for more
information.
550
EPICenter Software Installation and User Guide
E EPICenter Backup
This appendix describes the following:
• The EPICenter Alarm Log and Event Log backup files
• The DBVALID command-line database validation utility
• The DBBACKUP command-line database backup utility
EPICenter Log Backups
Both the EPICenter Event Log and Alarm Log files are kept in tables in the EPICenter
database. These tables can contain approximately 50,000 entries.
The EPICenter server checks once every 24 hours to determine is either of these logs has
reached its maximum size. When one reaches its maximum, EPICenter moves the oldest
10% of the entries to a backup file, and clears those entries from the table.
The backup files are created in the directory <install_dir>/user, where
<install_dir> is the root directory of the EPICenter install, by default epc4_0.
• The Alarm Log is backed up to the file Alarm_Log.txt
• The Event Log is backed up to the file Event_Log.txt
EPICenter Software Installation and User Guide
551
Each primary backup file is in turn backed up to a secondary file when it reaches its
maximum size of approximately 30MB.
• Alarm_Log.txt is backed up to the file Alarm_Log.sav
• Event_Log.txt is backed up to the file Event_Log.sav
The primary file is then emptied.
When the primary file becomes full for the second time, the secondary backup file will
be overwritten with the new contents of the primary backup file.
If you want to maintain a complete set of log file backups over time, you should save
the *_Log.txt and *_Log.sav files periodically.
Database Utilities
Sybase database validation and backup utilities are shipped with the EPICenter
software.
The Validation utility validates all indexes and keys on some or all of the tables in the
database. The Validation utility scans the entire table and looks up each record in every
index and key defined on the table. This utility can be used in combination with regular
backups to give you confidence in the security of the data in your database.
The Backup utility makes a backup copy of all data in the database, except for user
names and passwords, which are kept in separate files. Backing up your database
regularly will ensure that you will not need to re-enter or recreate all the switch, VLAN,
Topology, and Alarm information in the event that the database is corrupted or
destroyed.
Both database utilities are found in the <install_dir>\database directory.
<install_dir> is the directory where you installed the EPICenter software. Substitute
the name of the actual directory for <install_dir> when you run these commands.
NOTE
In the Solaris environment, you must ensure that the EPICenter database path is set in
the LD_LIBRARY_PATH environment variable. This should be set to
<install_dir>/database where <install_dir> is the root directory of the EPICenter
install, for example opt/epc4_0.
552
EPICenter Software Installation and User Guide
The Validation Utility
The Validation Utility
The Validation utility validates all indexes and keys on some or all of the tables in the
database. Access the Validation utility from the MS DOS or Solaris command line using
the dbvalid command. This convention also allows incorporation into batch or
command files.
Using the DBVALID Command-line Utility
To validate the EPICenter database running under Windows NT, use the command:
<install_dir>\database\dbvalid -c
“uid=dba;pwd=sql;dbf=<install_dir>\basecamp.db”
Under Solaris, use the command:
<install_dir>/database/dbvalid -c
“uid=dba;pwd=sql;dbf=<install_dir>/basecamp.db”
This example assumes a database user ID of dba, with password sql. These are the
defaults used when the database server is installed through the EPICenter installation
process. If you have changed your database user ID and password, substitute your
actual user ID and password in the command.
<install_dir> is the directory where the EPICenter software is installed. Substitute
the actual directory name in the command.
This operation should report no errors. If there are errors, the system should be stopped
and a backup database copied into place. See “Installing a Backup Database” on
page 556. If there are no backups, the EPICenter software must be re-installed.
Syntax:
dbvalid [switches]
Table 24: dbvalid Command Switches
Switch
Description
-c “keyword=value; ...”
Supply database connection
parameters
EPICenter Software Installation and User Guide
553
Database Connection Parameters
These are the parameters for the -c command-line switch. If the connection parameters
are not specified, connection parameters from the SQLCONNECT environment variable
are used, if set.
Table 25: Database Connection Parameters for dbvalid Utility
uid=<user name>
The user name used to login to the database. Default is
dba. The user ID must have DBA authority.
pwd=<password>
The password used to login to the database. Default is
sql.
dbf=<database_file>
The name of the file that stores the data. This is the file to
be validated.
The connection parameters are separated by semicolons, and the entire set must be
quoted. For example, under Windows NT, the following validates the EPICenter,
connecting as user ID dba with password sql:
<install_dir>\database\dbvalid -c
“uid=dba;pwd=sql;dbf=<install_dir>\basecamp.db”
The Backup Utility
The Backup utility makes a backup copy of all data in the database, except for user
names and passwords. Access the Backup utility from the MS DOS or Solaris command
line using the dbbackup command. This convention also allows incorporation into batch
or command files.
The DBBACKUP Command-line Utility
To back up the EPICenter database running under Windows NT, use the command:
<install_dir>\database\dbbackup -c
“uid=dba;pwd=sql;dbf=<install_dir>\basecamp.db” <backup_dir>
554
EPICenter Software Installation and User Guide
The Backup Utility
Under Solaris, use the command:
<install_dir>/database/dbbackup -c
“uid=dba;pwd=sql;dbf=<install_dir>/basecamp.db” <backup_dir>
This example assumes a database user ID of dba, with password sql. These are the
defaults used when the database server is installed through the EPICenter installation
process. If you have changed your database user ID and password, substitute your
actual user ID and password in the command.
<install_dir> is the directory where the EPICenter software is installed. Substitute
the actual directory name in the command.
<backup_dir> is the directory where the backup copy of the database should be stored.
Substitute an actual directory name in the command.
This command generates a backup of the database in the specified backup directory.
The backup consists of two files, basecamp.db and basecamp.log. All database files are
backed up. These files should be saved so they can be used to replace the original files
in the event of a problem.
Syntax:
dbbackup [switches] directory
Table 26: dbbackup Command Switches
Switch
Description
-c “keyword=value; ...”
Supply database connection parameters
-y
Replace files without confirmation
Database Connection Parameters
These are the parameters for the -c command-line switch. If the connection parameters
are not specified, connection parameters from the SQLCONNECT environment variable
are used, if set.
Table 27: Database Connection Parameters for dbbackup Utility
uid=<user name>
The user name used to login to the database. Default is dba.
The user ID must have DBA authority.
pwd=<password>
The password used to login to the database. Default is sql.
EPICenter Software Installation and User Guide
555
Table 27: Database Connection Parameters for dbbackup Utility
uid=<user name>
dbf=<database_file>
The user name used to login to the database. Default is dba.
The user ID must have DBA authority.
The name of the file that stores the data. This is the file to be
backed up.
The connection parameters are separated by semicolons, and the entire set must be
quoted. For example, under Windows NT, the following backs up the EPICenter
database basecamp.db, connecting as user ID dba with password sql:
<install_dir>\database\dbbackup -c
“uid=dba;pwd=sql;dbf=<install_dir>\basecamp.db” c:\tmp
Installing a Backup Database
The backup database is named basecamp.db, and is kept in the directory you specified
when you ran the dbbackup command (c:\tmp in the example).
To replace a damaged database with the backup copy, follow these steps:
1 Shut down the EPICenter software following the instructions for your operating
system in the EPICenter Software Installation and User Guide.
2 Move or delete the old copy of basecamp.db found in the EPICenter installation
directory.
3 Copy the backup copy of basecamp.db to the EPICenter installation directory.
4 Restart the EPICenter software following the instructions in the EPICenter Software
Installation and User Guide for your operating system environment.
556
EPICenter Software Installation and User Guide
Index
Numerics
1d mode, STP
802.1Q tag
404
378, 389
A
About EPICenter page
access levels
Ack button
Actions tab
activation key
Active Ports (ESRP)
Add All button
in Add Relationship to Group
in Add Resources
Add Attribute to Resource button
Add button
in Add Attribute to Resource
in Add Relationship to Group
in Add Resource
in Alarm Category
in Alarm Definition
in Discovery
in Grouping Manager
in Grouping Manager search
in Inventory Manager
in IP/MAC Address Finder
in Threshold Configuration
in VLAN Manager
Add/Modify Condition button
adding
alarm category
alarm definition
CPU Utilization rule
devices
map background images
EPICenter Software Installation and User Guide
76
28, 424
130
146
38, 41, 48
421
253
248
245
247,
91,
278,
133,
256
253
248
152
140
102
251
260
105
279
158
388
136
152
140
158
105
371
adding (cont.)
nodes to a map
protocol filters
relationships to resource
resource as child
RMON rule
user accounts
VLANs
address range
in Discovery
in IP/MAC Address Finder
Admin button
Admin port
Administration page
Administrator
adding users
changing password
default password
deleting a user account
distributed server configuration
ExtremeWare access
modifying users
server properties configuration
Administrator access
EPICenter
ExtremeWare
alarm actions
E-mail
execute script
forward trap
run program
short email
sound alert
Alarm Browser
from Configuration Manager
from ExtremeView applet
351
400
250
246
158
428
388
99
278
79
42, 49
426
428
427
425
429
443
425
428
435
28, 424
425
146
147
148
147
148
147
146
129
185
303
557
Alarm Browser (cont.)
from Inventory Manager
from Real-Time Statistics applet
from STP Monitor
from Telnet applet
from topology map
from VLAN Manager
Alarm button
79,
Alarm Definition tab
alarm events
Extreme proprietary traps
from EPICenter
128,
RMON falling threshold
RMON rising threshold
SNMP traps
128,
Syslog messages
Alarm Log Browser
Alarm Log Detail View
Alarm Log report
Alarm System
AlarmMgr utility
29,
alarms
acknowledging
actions
Basic parameters
categories
configuring EPICenter as Syslog receiver
CPU utilization rule display
CPU utilization threshold configuration
creating a filter
132,
Default category
defining
defining scope
definition examples
deleting
detail view
133,
E-mail alarm action
EPICenter event type
Event Type definition
execute script action
falling threshold configuration
156,
falling threshold, predefined RMON rules
falling threshold for CPU utilization rules
filtering
forward trap action
Port Utilization rule
predefined
128,
predefined RMON event configuration
rising threshold configuration
156, 157,
rising threshold for CPU utilization rules
rising threshold, predefined RMON rules
RMON event types
RMON rule definition
RMON rule display
RMON threshold configuration
run program action
scope
558 - Index
96
327
412
229
373
386
129
138
128
141
141
141
141
141
130
133
470
23
512
130
146
141
152
172
156
155
136
152
138
144
149
131
134
147
141
141
148
160
167
164
134
147
166
138
166
160
163
166
141
159
155
155
148
144
alarms (cont.)
setting up e-mail
short email alarm action
sound alert action
startup condition for RMON alarms
startup condition for threshold alarms
startup condition for CPU utilization
Sync in Threshold Configuration
Syslog messages
Temperature threshold rule
threshold rule target configuration
Topology Change rule
unacknowledging
variables
writing Tcl scripts for alarm actions
All Device Groups page
All ESRPs view
Apply button
architecture of EPICenter software
Archive button (Configuration Manager)
archiving configuration settings
Attribute Name field
Attribute Type field
attributes of resources
DLCS ID type
245,
generic type
244,
IP/subnet type
244,
Attributes tab
Authentication Failure Alarms report
Auto populate view
placement algorithm
190,
237,
255,
255,
255,
345,
148
147
146
161
156
164
171
141
166
167
166
131
143
174
90
418
86
30
192
190
257
257
242
257
257
257
255
456
360
346
B
background image in Topology
background map image
Basic alarm parameters
browser
requirements for reports
requirements for use as client
buttons
Ack
Add (Add Attribute)
Add (Add Resources)
Add (Alarm Category)
Add (Alarm Definition)
Add (Discovery)
Add (Grouping Manager search)
Add (Grouping Manager)
Add (Inventory Manager)
Add (IP/MAC Address Finder)
Add (Relationship to Group)
Add (Threshold Configuration)
Add (VLAN Manager)
Add All (Add Resources)
Add All (Relationship to Group)
Add Attribute to Resource
Add/Modify Condition
369
369
141
247,
91,
278,
133,
36
36
84
130
256
248
152
140
102
260
251
105
279
253
158
388
248
253
245
136
EPICenter Software Installation and User Guide
buttons (cont.)
Admin
79
Alarm
79, 129
Apply
86
Archive (Configuration Manager)
190, 192
By Switch
380
By VLAN
380
Clone (IP/MAC Address Finder)
276, 282
Close
86
Config
79
Config (Configuration Manager)
180
Connect Device
395
Create new device
351
Create new map
349
Cut nodes from map
356
Default (Inventory Manager)
91
Delete (Alarm Category)
153
Delete (Alarm Definition)
152
Delete (Alarm System)
131
Delete (Inventory Manager)
91, 115
Delete (IP/MAC Address Finder)
276, 282
Delete (Threshold Configuration)
170
Delete (VLAN Manager)
392
Delete alarms with specified conditions
131
Destroy
242, 245
Detail
133
Discover (Device Discovery dialog)
101
Discover (Inventory Manager)
91
Download (Configuration Manager)
194
ESRP
79, 417
EView
79, 286
Export (IP/MAC Address Finder)
276, 282
Export Local (IP/MAC Address Finder)
282
Export Local (IP/MAC Finder)
276
Filter
135
Find (Grouping Manager)
242, 249, 258
Find (IP/MAC Address Finder)
277
Find (Telnet)
230
Find (Topology)
368
Find IP/MAC
79, 273
Groups
79, 238
Home
78, 448
Import
242, 264
Increment (Configuration Manager)
196
Inventory
79, 89
Layout
361
Logoff
80
Modify (Alarm Category)
152
Modify (Alarm Definition)
151
Modify (in VLAN Manager)
394
Modify (Inventory Manager)
91, 109
Modify (Threshold Configuration)
169
New (Discovery)
101
New (Grouping Manager)
242
Paste nodes into map
357
Play (Telnet)
221
Policy
80
EPICenter Software Installation and User Guide
buttons (cont.)
Print Map
Protocol Filters
Query
Remove (Add Attribute)
Remove (Add Resources)
Remove (Discovery)
Remove (Grouping Manager)
250,
Remove (IP/MAC Address Finder)
278,
Remove (Relationship from Group)
Remove All (Add Resources)
Remove All (IP/MAC Address Finder)
Remove All (Relationships from Group)
Remove Attribute from Resource button
Remove Condition(s)
133,
Repeat
Reports
ReRun (IP/MAC Address Finder)
276,
Reset
Reset (Grouping Manager search)
RT Stats
79,
Save
249, 253, 254,
ServiceWatch
Settings... (Alarm Definition)
Stop (Telnet)
STP
Submit (IP/MAC Address Finder)
Sync (Inventory Manager)
91,
Sync (Threshold Configuration)
Telnet
79,
TFTP (Configuration Manager)
Topology
79,
Unack
Upgrade (Configuration Manager)
199,
Upload (Configuration Manager)
Variables... (Alarm Definition)
Versions (Configuration Manager)
VLAN
VLANs (Topology)
WildCard (IP/MAC Address Finder)
Zoom map in
Zoom map out
By Switch button
By VLAN button
367
399
261
258
249
101
254
279
253
249
279
253
245
137
221
79
282
86
261
313
257
80
148
221
79
279
116
171
218
211
334
131
202
187
148
207
79
372
278
366
366
380
380
C
categories for alarms
152
changing password
for Administrator
427
user
430
children of resource
241
Children tab
247
client
browser requirements (Windows only)
36
installing
52
installing stand-alone application (Solaris)
55
installing stand-alone application (Windows) 54
Index - 559
client (cont.)
starting for first time
system requirements
client, installed application
Clone button
Clone button (IP/MAC Address Finder)
Close button
columns
resizing
sorting
Command-line utilities
community string
for discovery
in trap receiver setup
Component Tree
device status indicator
displaying subcomponents
icons
resizing
composite link (Topology)
Compress Map menu selection
Config button
configuration files
archiving
download incremental
downloading
Configuration Management Log report
Configuration Manager
Alarm browser command
Archive button
Archive command
archiving configuration files
Browse command (ExtremeWare Vista)
Device statistics command
Download button
Download command
download image to device
download image to slot
download incremental configuration
download saved configuration
EView command
Increment button
Increment command
Properties command
right-click pop-up menu
scheduled device upload
software version specification
Telnet command
TFTP button
Upgrade button
Upgrade command
Upload button
Upload command
uploading device configuration
Versions button
VLANs command
Connect Device button
560 - Index
425
35
67
276
282
86
84
84
29
100
173
81, 82
83
82
82
84
340, 343
365
79, 180
190
196
194
473
24, 179
185
190, 192
183
190
186
186
194
183
199
202
196
194
186
196
184
185
182
190
207
186
211
199, 202
184
187
183
187
207
187
395
conventions
notice icons, About This Guide
18
text, About This Guide
18
copy (Telnet)
220, 225
CPU Utilization
alarm event generation
165
event configuration rules
155
falling threshold configuration
164
Rising Threshold configuration
157
rising threshold configuration
163
rule definition
163
rule display
156
rule target configuration
167
Sample Type
164
Startup Alarm
164
Create new device button
351
Create new map button
349
creating
alarm definitions
138
alarm threshold event rules
158
device groups
107
incremental configuration file
198
new device node (Topology)
351
new topology map
349
new topology view
344
resources
243
search task (IP/MAC Address Finder)
277
VLANs
388
Critical Alarms Defined report
453
Critical Alarms report
453
Cut Map Nodes menu selection
356
Cut nodes from map button
356
cutting map nodes
356
D
database backup utility
554
database TCP port
41, 49
database validation utility
552
dbbackup utility
554
dbvalid utility
552
decorative node
339
Default alarm category
152
Default button (Inventory Manager)
91
Default device group
90
Deflate Nodes menu selection
366
Delete alarms with specified conditions button 131
Delete button
in Alarm Category
153
in Alarm Definition
152
in Alarm System
131
in Inventory Manager
91, 115
in IP/MAC Address Finder
276, 282
in Threshold Configuration
170
in VLAN Manager
392
Delete Map menu selection
356
Delete Map Nodes menu selection
358
Delete View menu selection
355
EPICenter Software Installation and User Guide
deleting
a user account
429
alarm category
153
alarm definition
152
alarm threshold rule
170
alarms
131
device groups
115
map elements
358
map links
358
map view
355
protocol filters
400
submaps
356
VLANs
392
Destroy button
242, 245
Detail button
133
Detailed ESRP Information view
421
Detailed Task View (IP/MAC Address Finder) 280
DevCLI utility
29
device
download incremental configuration
196
download saved configuration
194
in Grouping Manager
235
modifying information
109
scheduled configuration global
192
scheduled configuration upload
190
uploading configuration from
187
Device Alarms... menu selection
373
Device Browse... menu selection
374
Device Discovery set up window
99
device groups
88, 237
creating
107
default
90
deleting
115
modifying
111
Device Inventory report
451, 462
device node
336
Device Properties menu selection
376
Device Statistics menu selection
374
device status
ExtremeView
286
Inventory Manager display
92
obtaining
88
SmartTraps
89
SNMP
88
Device Status report
465
Device Summary report
449, 451, 452
Device Telnet menu selection
375
Device View menu item
375
Device VLANs menu selection
375
Devices Not Responding report
452
dialog boxes
85
drop-down menu fields
85
list box fields
85
page tabs
85
selecting multiple items in a list
86
text fields
85
Discover button
EPICenter Software Installation and User Guide
in Inventory Manager
91
Discover button (Device Discovery dialog)
101
Discovery
23, 88, 98
Add button
102
address range
99
community string
100
subnet mask
100
Discovery Results window
101
display mode, real-time statistics
319
distributed server administration
configuring server group manager
445
configuring server group member
444
distributed server administration
443
distributed server mode
28
Distributed Server summary report
75
domains, STP
403
download
ExtremeWare software image, device
199
ExtremeWare software image, slot
202
incremental configuration
196
saved device configuration
194
Download button (Configuration Manager)
194
drop-down menu fields
85
E
election algorithm (ESRP)
E-mail
alarm action
alarm action (short e-mail)
setting up for alarms
EMISTP mode
EPICenter
architecture
client installation
components
configuring server as trap receiver
feature summary
logging in
navigating applications
server components
EPICenter Telnet
from ExtremeView applet
from Inventory Manager
from Real-Time Statistics applet
from STP Monitor
from topology map
from VLAN Manager
ESRP
active ports
All ESRPs view
detailed information view
election algorithm
Hello timer
Master switch
priority
state
ToMaster
419
147
147
148
404
30
52
29
173
22
73
77
34, 64
25
304
97
328
414
375
387
421
418
421
419
419
418
421
421
421
Index - 561
ESRP (cont.)
ToSlave
TrackedActivePorts
TrackedIPRoutes
TrackedPings
ESRP button
ESRP Manager
evaluation copy
license
updating to full license
event configuration
CPU utilization rule display
CPU utilization rules
other SNMP traps
RMON rule example
RMON rules
rule target
Event Log report
EView button
Execute script alarm action
Expand Map menu selection
Export button
Export Local button
Extreme switch
obtaining device status information
support in EPICenter
updating status
ExtremeView
from Configuration Manager
from Inventory Manager
from Real-Time Statistics applet
from STP Monitor
from Telnet applet
from topology map
from VLAN Manager
switch configuration information
switch statistics
switch status
ExtremeWare requirements
for IP/MAC Address Finder
ExtremeWare software image
downloading to device
downloading to slot
specifying current version
ExtremeWare Vista
from Configuration Manager
from ExtremeView applet
from Inventory Manager
from Real-Time Statistics applet
from STP Monitor
from Telnet applet
from topology map
from VLAN Manager
421
421
421
421
79, 417
27, 417
37
44
154
156
155
172
168
155
167
471
79, 286
148
365
276, 282
276, 282
88
31
116
25, 285
186
98
328
413
229
375
387
293
297
287
274
199
202
207
186
303
97
328
413
229
374
386
F
falling threshold
CPU utilization
562 - Index
164
falling threshold (cont.)
for predefined RMON events
RMON events
file import
in Grouping Manager
Filter button
filtering
in reports
resources
filtering alarms
Find Address Tasks List window
Find button
in Grouping Manager
in IP/MAC Address Finder
in Telnet applet
in Topology
Find IP/MAC button
Find Map Node... menu selection
FindAddr utility
Fit Map in Window menu selection
Forward trap alarm action
167
160
265
135
458
242, 248
134
275
242, 249, 258
277
230
368
79, 273
367
29, 516
363
147
G
Get Java PlugIn link,
global scheduled configuration
Grouping Manager
predefined groups
Source Name field
groups
definition of
predefined
Groups button
71
192
24, 235
236
265
235
236
79, 238
H
heartbeat check
Hello Timer (ESRP)
Home button
host groups
HTTP port
hyper node
caveats
31
419
78, 448
237
42, 49, 55, 57
338
351
I
Import button
242,
import sources
importing resources
from NIS
importing resources
from file
from LDAP directory
264,
from NIS
from NT Domain controller
264,
ImportResources utility
Increment button (Configuration Manager)
incremental configuration file
individual errors graph
264
237
264
263
265
266
272
272
529
196
198
312
EPICenter Software Installation and User Guide
Inflate Nodes menu selection
365
installing the client
52
installing the server
as a service (Windows)
42
under Solaris
44
under Windows
39
instlic utility
under Solaris
52
under Windows
44
Interface report
467
Invalid Login Alarms report
455
Inventory button
79, 89
Inventory Export script
29
Inventory Manager
23
adding devices
105
Discovery
98
Inventory Manager page
89
IP address
finding with IP/MAC Address Finder
273
modifying for a VLAN
396
IP forwarding
disabling
396
enabling
396
IP forwarding tab
391
IP/MAC Address Finder
25
Add button
278, 279
creating a search task
277
Delete button
276
ExtremeWare requirements
274
Remove All button
279
Remove button
278, 279
search results
281
Submit button
279
Target Domains list
278
tasks list
276
Tasks List Summary
275
WildCard button
278
L
L2 cloud node
caveats
Launch EPICenter link
Layout button
Layout Map In Window menu selection
Layout Map menu selection
LDAP directory, importing from
license key
activation key
adding or updating
licensing
obtaining a permanent license
obtaining an evaluation license
upgrading (adding modules)
upgrading (evaluation to permanent)
link (topology)
composite link
deleting
EPICenter Software Installation and User Guide
337
351
71
361
362
361
264, 266
40, 48
38
44, 52
37
38
37
38
38
339
340, 343
358
list box fields
logging in
Login page
Logoff button
85
73
73, 426
80
M
macro status
221
macros (Telnet)
record/play
219
Start Record command
227
Stop Record command
227
Manager access
28, 424
Map
auto populate
345, 346, 360
creating
349
deleting submap
356
Expand Map
365
fit Map in Window
363
Layout Map In Window
362
renaming
355
map element description panel
335, 342
map elements
composite link
340
decorative node
339
device node
336
hyper node
338
L2 cloud node
337
link
339
submap node
337
text node
339
map hierarchy tree
335
map nodes
adding
351
cutting
356
deleting
358
laying out
361
map properties
369
background image
369
link text color
370
map name
369
node gradient background
370
node text color
370
RMON statistics
371
Map Properties... menu selection
369
Map, topology
335
Master switch
418
MIB variables
in RMON rules
160
in RMON threshold configuration
159
Modify button
in Alarm Category
152
in Alarm Definition
151
in Inventory Manager
91, 109
in Threshold Configuration
169
in VLAN Manager
394
Index - 563
modifying
alarm category
alarm definition
alarm threshold rule
device groups
device information
IP address for VLAN
map properties
user accounts
VLANs
Monitor access
152
151
169
111
109
396
369
428
393
28, 424
Query button
navigating EPICenter applications
Navigation Toolbar
Network Summary report
73,
New button
in Discovery
in Grouping Manager
New Decorative Map Node menu selection
New Device Map Node menu selection
New Map Link menu selection
New Map menu selection
New Text Map Node menu selection
New View menu selection
NIS, importing from
264,
NT Domain Controller, importing from
264,
77
78
448
101
242
351
351
352
349
352
344
272
272
P
564 - Index
414
228
387
389
400
395
400
399
404
Q
N
page tabs
passwords
changing for Administrator
default
users changing
paste (Telnet)
Paste Map Nodes menu selection
Paste nodes into map button
Play button
Policy button
polling
Port Configuration utility
port groups
creating
ports
changing configuration
correcting conflicts
in Grouping Manager
port types in VLAN Manager
removing from VLAN
STPD membership
predefined alarms
predefined groups
Print Map button
Print Map menu selection
Printing
Priority (ESRP)
Properties
from STP Monitor
from Telnet applet
from VLAN Manager
protocol filters
adding
changing in VLAN
deleting
Protocol Filters button
PVST+ mode
85
427
425
430
220, 225
357
357
221
80
89
510
236
243
510
510
235
384
390, 395, 399
404
128, 138
236
367
367
86
421
261
R
RADIUS
client configuration
configuring shared secret
disabling
enabling server
enabling server response messages
server
server administration
server port configuration
RADIUS Administration tab
Real-Time Statistics
25,
from Configuration Manager
from ExtremeView applet
from Inventory Manager
from STP Monitor
from Telnet applet
from topology map
from VLAN Manager
graph preferences
319,
individual errors graph
total errors graph
utilization graph
related publications, About This Guide
Relationship tab
relationships of resources
238,
Relationships tab
Release Notes
Remote Authentication Dial In User Service
(RADIUS)
Remove All button
in Add Relationship to Group
in IP/MAC Address Finder
Remove Attribute from Resource button
Remove button
in Add Attribute to Resource
in Add Relationship to Group
in Discovery
in Grouping Manager
in IP/MAC Address Finder
278,
remove children from a group
remove resource from results list
434
433
434
432
434
425
432
434
432
311
186
303
97
413
230
374
386
321
312
312
312
19
254
241
251
17
28
249
253
279
245
258
253
101
254
279
250
249
EPICenter Software Installation and User Guide
Remove Condition(s) button
133,
removing a child resource
Rename Map menu selection
Rename View menu selection
Repeat button
Repeat Delay field
Repeating check box
reports
Alarm Log report
Authentication Failure Alarms report
browser requirements for
Configuration Management Log report
creating user-defined
Critical Alarms Defined report
Critical Alarms report
Device Inventory report
451,
Device Status report
Device Summary report
449, 451,
Devices Not Responding report
Distributed Server summary
Event Log report
filtering
Interface report
Invalid Login Alarms
Network Summary
Network Summary report
printing
Resource to Attribute Mapping report
Server State Summary report
Slot Inventory report
SNMP Unreachable Alarms report
System Log report
Unacknowledged Critical Alarms report
User to Host Mapping report
viewing from stand-alone client
VLAN Summary report
VLANs report
Reports button
ReRun button
276,
Reset button
in Grouping Manager search
resizing
columns in status display
Component Tree
resource
adding as child
adding relationships
attributes
237,
children
Children tab
definition of
deleting
filtering
relationships
238,
Relationships tab
removing as a child
resource details display
EPICenter Software Installation and User Guide
137
250
355
355
221
221
221
27
470
456
36
473
474
453
453
462
465
452
452
75
471
458
467
455
73
448
474
468
460
464
455
472
454
469
69
466
456
79
282
86
261
84
84
246
250
242
241
247
235
245
242
241
251
250
240
resource (cont.)
Resource Results list
searching for
Select Resource to be Added panel
Resource Results list
Resource to Attribute Mapping report
resources
creating in Grouping Manager
description
240,
DLCS ID attribute type
245, 255,
filtering
generic attribute type
244, 255,
importing
IP/subnet attribute type
244, 255,
name
240,
source
type
240,
unique name
resynchronize (RMON)
rising threshold
CPU utilization
for predefined RMON events
RMON events
RMON
alarm event generation
configuration
event configuration rules
Falling Threshold configuration
156,
falling threshold, predefined events
MIB variables for rules
Port Utilization predefined rule
predefined rule definition
resynchronize
Rising Threshold configuration
156,
rising threshold for predefined events
rule definition
rule display
rule target configuration
Sample Type
Sample Type (predefined rule)
Startup Alarm
Startup Alarm for predefined rule
Temperature predefined rule
Topology change predefined rule
traps
128,
utilization on map links
RMON Statistics (Topology)
RT Stats button
79,
rule
CPU utilization threshold configuration
display, CPU utilization
display, RMON
predefined RMON event configuration
RMON configuration example
RMON threshold configuration
threshold target configuration
Run program alarm action
249
258
248
249
468
243
244
257
248
257
263
257
244
240
244
241
171
163
166
160
162
154
155
160
167
160
166
166
171
160
166
159
155
167
161
167
161
167
166
166
130
371
371
313
163
156
155
166
168
159
167
148
Index - 565
runclient command
in Windows
runserv command
in Solaris
in Windows
68
66
64
S
Sample Type
Absolute (for CPU Utilization
164
Absolute (predefined RMON)
167
Absolute (RMON)
161
Delta (for CPU Utilization)
164
Delta (RMON)
161
Save button
249, 253, 254, 257
scheduled configuration upload
190
scheduled configuration, global
192
scope for alarms
144
Scope tab
144
search results
Discovery
101
Grouping Manager query
261
IP/MAC Address Finder
281
search task (IP/MAC Address Finder)
277
Searching for a resource
258
Select All Map Nodes menu selection
359
Select Resources to be Added panel
248, 252
Server Hostname field
68
server installation
under Solaris
44
under Windows
39
server properties
425
administration of
435
Client Port
442
Default Map RMON Statistics
441
Device HTTP Port
436
Device Telnet Port
436
Device Tree UI
442
Devices properties
436
DNS Lookup Timeout Period
441
Edge Port Poll Interval
440
Enable Edge Port Polling
440
Enable RMON Display
441
Enable Syslog Server
437
EPICenter Trap Receiver Port
440
IP QoS Rule Precedence
442
Maximum Number of SNMP Sessions
439
Number of Retries
440
Other properties
441
Poll Devices Using Telnet
438
Poll Interval
440
Save Changed Configurations
438
Save Switch Password for Vista Login
438
Scalability properties
438
ServiceWatch URL
442
Session Timeout Period
441
SNMP properties
439
SysLog Message Min Severity
437
566 - Index
server properties (cont.)
Syslog Message per Device
Syslog Message per Minute
Telnet Login Timeout Period
Thread Default Alloc Size
Thread Pool Size
Timeout Period
Topology properties
Traps per device
Traps per Minute
Update Type Library on Server
Upload/Download Timeout Period
Server Properties tab
Server State Summary report
ServiceWatch button
setting
graph preferences (RT Stats)
map properties
server properties
Settings... button (Alarms)
Slot Inventory report
SmartTraps
SNMP
alarm event type
configuring trap events
default trap port number
total traps rate limit
traps
traps per device rate limit
SNMP Unreachable Alarms report
SNMPCLI utility
software architecture
software components
software licensing
Solaris
server installation
starting the server
stopping the server
uninstalling the server
uninstalling the stand-alone client
sorting columns
sound alert alarm action
Source Name field
source of resource
Spanning Tree domains
Stand-alone Utilities
Start Record (Telnet)
starting the client
browser-based (Windows only)
under Windows
starting the server
under Solaris
under Windows
Startup Alarm
for CPU Utilization
for predefined RMON rule
RMON
439
439
436
439
439
440
441
439
439
442
436
435
460
80
321
369
425, 435
148
464
30, 89
88
141
172
173
439
127, 130
439
455
29
30
29
37
44
66
66
60
61
84
146
265
240
403
29
227
69
67
66
64
164
167
161
EPICenter Software Installation and User Guide
State (ESRP)
421
statistics
display mode, real-time
319
graph preferences (RT Stats)
321
in ExtremeView
297
individual port real-time
317
multi-port real-time
313
real-time
311
Status/Detail Information panel
83
Stop button
221
Stop Record (Telnet)
227
stopping the server
under Solaris
66
under Windows
64
stopserv command
66
STP
1D mode
404
default domain
404
EMISTP mode
404
PVST+ mode
404
STP button
79
STP domains
403
STP Monitor
27
Alarm browser menu item
412
Browse menu item (ExtremeWare Vista)
413
Device menu
412
Device statistics menu item
413
displaying device configuration information 408
displaying port configuration information 410
displaying STP domain information
405
displaying VLAN configuration information407
EView menu item
413
Properties menu item
414
STP Properties menu
411
Telnet menu item
414
VLAN Properties window
412
VLANs menu item
414
STPD See Spanning Tree domains
submap node
337
Submit button
279
subnet mask
100
switch configuration information (EView)
293
switch polling
89
switch statistics (ExtremeView)
297
switch status (ExtremeView)
287
Sync button
89, 116
in Inventory Manager
91
in Threshold Configuration
171
Syslog
alarm event type
141
configuring EPICenter as Syslog receiver
172
enabling EPICenter Syslog server
437
messages in alarms
141
setting minimum severity for message
acceptance
437
total messages rate limit
439
System Log report
472
EPICenter Software Installation and User Guide
T
tagged ports
Target Domains list
Target tab
Tasks List Summary window
Tcl
writing scripts for alarm actions
Telnet applet
Alarms browser menu item
copy
Device statistics menu item
EPICenter Telnet
EView menu item
ExtremeWare Vista menu item
Find button
from Configuration Manager
from ExtremeView applet
from Inventory Manager
from Real-Time Statistics
from STP Monitor
from topology map
macro status
macros
paste
Properties menu item
Repeat Delay
Repeating check box
right-click pop-up menu
third-party devices
VLANs menu item
Telnet button
Telnet Connections list
terminology, About This Guide
text fields
text node
TFTP button (Configuration Manager)
TFTP server
enabling/disabling
setting root directory path
third-party device support
Telnet applet
Threshold Configuration page
Threshold Configuration tab
ToMaster (ESRP)
Topology applet
background image
By device display
By VLAN display
composite link
decorative node
device node
displaying VLAN information
Expand Map
Find Map Node window
Fit Map in Window
hyper node
L2 cloud node
390
278
167
275
174
25, 217
229
220, 225
230
218
229
229
230
186
304
97
328
414
375
221
219
220, 225
228
221
221
228
227
230
79, 218
219
18
85
339
211
211
211
31
227
154
154
421
369
371
371
340, 343
339
336
371
365
368
363
338
337
Index - 567
Topology applet (cont.)
Layout Map In Window
link
map
map background color
map element description panel
map hierarchy tree
map properties
node background color
renaming a view
setting view properties
submap node
text node
view
VLANs button
Topology button
Topology views
ToSlave (ESRP)
total errors graph
TrackedActivePorts (ESRP)
TrackedIPRoutes (ESRP)
TrackedPings (ESRP)
TransferMgr utility
traps
default trap port number
Extreme proprietary
RMON
setting EPICenter to receive
SNMP
total traps rate limit
traps per device rate limit
335,
79,
26,
29,
362
339
335
370
342
335
369
370
346
359
337
339
335
372
334
333
421
312
421
421
421
520
173
128
128, 130
173
127, 130
439
439
U
Unack button
131
Unacknowledged Critical Alarms report
454
Undo Map Edit menu selection
367
uninstalling the server
under Solaris
60
under Windows
58
uninstalling the stand-alone client
under Solaris
61
under Windows
59
unique name of resource
241
untagged ports
390
Unzoom Map menu selection
366
updating switch information
116
Upgrade button (Configuration Manager) 199, 202
upgrading
from a previous release
39
license (adding optional modules)
38
license (evaluation to permanent)
38
upload
device configuration
187
scheduled
190
Upload button (Configuration Manager)
187
568 - Index
users
EPICenter access
ExtremeWare access
adding
modifying
User Administration page
user groups
User to Host Mapping report
user-defined reports
users, adding
users, modifying
utilities
database backup
database validation
utilization graph
424
425
428
428
426
237
469
474
428
428
554
552
312
V
Variables... button (Alarms)
148
Versions button (Configuration Manager)
207
view (topology)
335
creating
344
renaming
346
setting properties
359
View Documentation link
72
View Properties
359
View Reports link
72
viewing by VLAN
383
Virtual LANs. See VLANs
VLAN button
79
VLAN Manager
27, 377
Add button
388
Alarm Browser command
386
By Switch button
380
By VLAN button
380
Connect Device button
395
Delete button
392
Device statistics command
386
ExtremeView command
387
ExtremeWare Vista command
386
from Configuration Manager
187
from Inventory Manager
98
from STP Monitor
414
from Telnet applet
230
from topology map
375
main page
379
Modify button
394
Modify VLAN Membership command 386, 397
Properties command
387
Protocol Filters button
399
right-click pop-up menu
385
Telnet command
387
VLAN Summary report
466
VlanMgr utility
29, 524
VLANs
383
802.1Q tag
378, 389
adding
388
adding protocol filters
400
EPICenter Software Installation and User Guide
VLANs (cont.)
adding tagged ports
adding untagged ports
Connect Device
definition of
deleting
deleting protocol filters
disabling IP forwarding
displaying
displaying in Topology applet
enabling IP forwarding
finding connections
from ExtremeView applet
from Real-Time Statistics applet
modifying
modifying IP address
modifying VLAN membership
protocol filters
remove a port
removing a port
viewing by switch
viewing member ports
VLANs button
VLANs report
390
390
395
378
392
400
396
380
371
396
395
304
329
393
396
397
378
390
395, 399
381
384
372
456
W
WildCard button
wildcards
in Discovery addresses
in IP/MAC Address Finder
Windows
server installation
starting browser-based client
starting the client
starting the server
stopping the server
uninstalling the server
uninstalling the stand-alone client
278
99
278
39
69
67
64
64
58
59
Z
Zoom
Zoom
Zoom
Zoom
map in button
Map In menu selection
map out button
Map Out menu selection
EPICenter Software Installation and User Guide
366
366
366
366
Index - 569
570 - Index
EPICenter Software Installation and User Guide