1
USER’s Manual
written by Valeri Petkov
E-mail: petkov@phy.cmich.edu
url: http://www.phy.cmich.edu/people/petkov/
Document created: February 2011
1
Disclaimer:
RAD is distributed as is: i.e. without any warranty, assumed or implied. The
entire risk as to the quality and performance of the program is with the User. The use of
RAD for any commercial purpose is prohibited.
Acknowledging RAD:
Any publication and/or presentation of results obtained using RAD should make
clear that RAD has been used and contain the following reference:
V. Petkov, “RAD, a program for analysis of X-ray diffraction data from amorphous
materials for personal computers” J. Appl. Crystallogr. 22 (1989) 387-89.
(a copy of the paper is attached for user’s convenience ).
Installing RAD:
WINDOWS XP/VISTA/7 Users:
Download & Run “Rad Setup Application”. Let it install the GTK-run
environment and libraries, as well as the program. The set-up application will create a
program folder/group associated with RAD-Gtk (see below) and place a RAD icon on the
screen. A subfolder with examples of RAD usage will also be created. Click on the RAD
icon to run the program. Before installing a newer version of RAD, always Un-install the
current version (to do it just click on Unistall…/see below).
Mac OSX Users:
First install the GTK working environment - GTK_Framework then install RAD
for Mac OSX "Intel" 10.4 or Mac OSX "Intel" 10.5 or Mac OSX "Intel" 10.6. RAD
icon will be put in “Applications” folder. To run RAD just click on the icon. Examples
coming with RAD will be put in folder: usr/share/rad/examples. Those may be moved
to any other folder if the user decides so.
Note, RAD requires a screen resolution/size of at least 1000 x 800 pixels. If it is less
than that some of the RAD functionalities described below may be lost. Also,
occasionally RAD may not “wish” to start just after being installed. As with other
applications – restart your computer and try again.
2
1. What is RAD ?
RAD takes x-ray diffraction (XRD) data and reduces it to an atomic pair/radial
distribution function (PDF/RDF). It has been used by the author (VP) and many research
groups all over the world for more than 20 years. It is based on rigorous XRD data
reduction procedures established back when XRD was born. Yet RAD is under constant
modification following the on-going development of XRD data collection procedures and
instrumentation. The author thanks Sebastien Le Roux for the invaluable
help in developing a user friendly (GTK-based) interface for RAD.
2. What is GTK+?
GTK+ is a toolkit for creating graphical user interfaces. GTK+ is written in C but
has bindings to many other popular programming languages such as C++, Python and
others.
3. What is XRD and atomic PDF/RDF analysis ?
XRD is used to determine the atomic-scale structure of materials. The technique
is based on the fact that the wavelength of x-rays is comparable in size to the distances
between atoms in condensed matter. So when a material exhibiting a long (i.e. at least
μm)-range, periodic atomic order, such as a single crystal or polycrystalline powder, is
irradiated with x-rays it acts as an extended periodic grating and produces a diffraction
pattern showing numerous sharp spots, called Bragg diffraction peaks. By measuring and
analyzing the positions and intensities of the Bragg peaks it is possible to determine the
spatial characteristics of the grating – i.e. to determine the three-dimensional (3D) atomic
arrangement in the crystalline material under study. This is the essence of the so-called
“crystal structure” determination by XRD [1]. Over the years the technique has been
perfected and applied successfully to a variety of crystalline materials – from simple
metals to complex proteins. X-ray diffraction can also be applied to study the structure of
materials where atoms are ordered only at short (i.e. less than a nm) to intermediate (tens
of nm)-range distances such as liquids, glasses, fine (nano)sized powders, polymers etc.
When irradiated with x-rays these materials act as quite imperfect gratings and produce
3
XRD patterns that are very diffuse in nature rendering traditional (Bragg-peaks based)
crystallography very difficult to apply. A combination of higher-energy x-ray diffraction
and atomic PDF/RDF data analysis [2] has proven to be very useful in cases like this.
The frequently used reduced atomic PDF/RDF, G(r), gives the number of atoms
in a spherical shell of unit thickness at a distance r from a reference atom as follows [2,3]:
G(r) = 4 r
where (r) and
o
o
[ (r)/ o-1]
(1)
are the local and average atomic number densities, respectively and r is the
radial distance. As defined, the PDF/RDF G(r) is a one-dimensional function that oscillates
around zero showing positive peaks at distances separating pairs of atoms, i.e. where the local
atomic density exceeds the average one. The negative valleys in the PDF/RDF G(r) correspond
to real space vectors not having atoms at either of their ends. With this respect the atomic PDF
resembles the so-called Patterson function that is widely applied in traditional x-ray
crystallography [1]. However, while the Paterson function is discrete and peaks at interatomic
distances within the unit cell of a crystal, the atomic PDF/RDF is a continuous function
reflecting all interatomic distances occurring in a material. This is a great advantage when
studying materials whose structure is difficult to be described in terms of extended periodic
lattices. The PDF G(r) is the Fourier transform of the experimentally observable total structure
function, S(Q), i.e.
qmax
G(r) = (2/ )
q[ S (q ) 1] sin( qr)dq,
(2)
q o
where q is the magnitude of the wave vector (q=4 sin / ), 2 is the angle between the
incoming and outgoing x-rays and
is the wavelength of the x-rays used. X-ray
diffraction usually employs the so-called Faber-Ziman type structure function, S(q),
related to only(!) the coherent part of the diffraction pattern, Icoh.(q ), as follows [2,3]:
S(q) = 1 + I coh. (q)
ci f i (q)
2
/
2
ci f i (q) ,
(3)
where ci and fi(q) are the atomic concentration and x-ray scattering factor respectively for
the atomic species of type i. Note f(q) is a function both of x-rays energy (E) and wave
vector q, i.e. f(q) = fo(q) + f’(q, E) + if”(q, E) where f’ and f” are the so-called anomalous
dispersion correction terms [1,2]. Also note, as defined, S(q) oscillates around one
and q[S(q)-1] – around zero. It should also be noted that for a material comprising n
4
atomic species a single diffraction experiment yields a total PDF/RDF, G(r), which is a
weighted sum of n(n+1)/2 partial PDFs/RDFs, G(rij), i.e.
G(r) =
(4).
wij Gij (r )
i, j
Here wij are weighting factors depending on the concentration and scattering power of the
atomic species as follows:
wij = cicjfi(q)fj(q)/ [
ci f i (q)]2
(5).
For practical purposes wij’s are often evaluated for q=0 [2,3].
4. How XRD data suitable for atomic PDF/RDF analysis are collected ?
Source of radiation: The Fourier transformation (see Eq. 2) should not be
terminated too early i.e. qmax should be at least 15-20 Å-1. Diffraction data at such high
wave vectors can be obtained using x-rays of a shorter wavelength, i.e. of higher energy.
X-rays of higher (than usual) energy can be delivered by synchrotron or laboratory
sources such as sealed x-ray tubes with a Mo (energy ~ 17 keV) or Ag (energy ~ 22 keV)
anodes. Note the energy of Cu Ka radiation is only about 8 keV and, hence, qmax may not
get higher than 8 Å-1 or so. Therefore, Cu Ka radiation is not suitable for higher-energy
XRD aimed at atomic PDF/RDF data analysis.
XRD data statistics and collection time: Whatever source of higher-energy x-rays
is used the XRD data should be collected with a very good statistical accuracy. That may
mean having at least 10,000 counts collected at any data point/diffraction angle [4]. To
achieve it XRD data may need to be collected much longer than in the case of more usual
applications such as Rietveld analysis. Thus when a sealed x-ray tube source and a single
point (e.g. scintillation) detector are employed the data collection may take tens of hours.
More powerful sources of x-rays (rotating anode generators and synchrotrons) and/or
large area detectors may reduce the XRD data collection time to minutes [5].
Experimental set-up (q-space) resolution: In general, structure studies on poorlyor completely non-periodic materials do not require experimental set-ups of very high
reciprocal (q-space) space resolution because of the inherently diffuse nature of the
respective XRD patterns. However, the reciprocal space resolution of the experimental
5
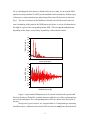
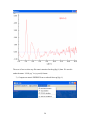
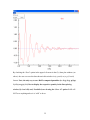
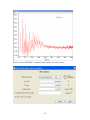
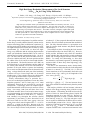
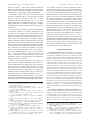
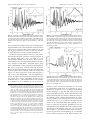
set up, including that of the detector, should not be too low either. As an example XRD
patterns for polycrystalline Si (NIST powder standard) collected with two different types
of detectors, a single point detector and an Image Plate (mar345) detector are shown in
Fig. 1. The lower resolution of the XRD data collected with an IP detector leads to an
extra broadening of the peaks in the XRD pattern and, hence, to a loss of information in
the higher-r region of the corresponding atomic PDF. This loss may be critical or not
depending on the degree of periodicity/crystallinity of the material studied.
Intensity, arb.u.
400
350
300
250
200
150
100
50
0
0
5
10
-1
15
20
Wave vector Q[Å ]
0.5
Atomic PDF G(r)
0.4
0.3
0.2
0.1
0.0
-0.1
-0.2
-0.3
-0.4
0
10
20
30
40
50
Radial distance r[Å]
Figure 1. Experimental XRD patterns for Si powder collected with a point (solid
line in red) and area IP/mar345 (symbols) detectors while the rest of the experimental setup was kept unchanged. The corresponding atomic PDFs are shown in the lower part of
the plot.
Background signal treatment: Air, sample holder etc. background-type scattering
should be kept to a minimum since atomic PDFs are based on only(!) the coherent/elastic
6
component of the XRD data (see Eq. 3). Remember: weaker background signal is
much easier to correct for !
Sample related but “unwanted” signal: X-rays are both scattered from and
absorbed inside materials via various processes [1,2]. The absorption of higher-energy xrays is relatively low and usually does not pose much of a problem in the XRD data
reduction process. The same is true for multiple scattering [2] of higher-energy x-rays.
Inelastic (Compton) scattering, however, may be very strong, especially at high wave
vectors [2]. If possible it should be eliminated from the experimental XRD data during
data collection by using energy-sensitive detectors [6]. Note analytical procedures for
computing Compton scattering and subtracting it from experimental XRD data are,
inevitably(!), based on various approximations and, therefore, may or may not work well
for every material. Fluorescent scattering from the sample should also be kept to a
minimum. This could be achieved either by using an energy-sensitive detector and/or
employing x-rays of energy below the absorption edge of the most strongly scattering
atomic species in the material under study.
In summary, a successful atomic PDF/RDF study requires an XRD experiment done
with a due care. Software like RAD can reduce virtually any XRD data set to an atomic
PDF/RDF but whether this “PDF/RDF” is a physically meaningful representation of the
atomic-scale structure of the material studied very much depends on the quality of
experimental XRD data !
5. Using RAD :
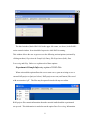
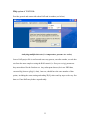
Click on the RAD icon. The following 3 program windows will open (see below).
One (labeled RAD in the upper left corner) is used to run/test RAD in an “expert mode”,
display system/program error messages etc. The second (labeled Curve toolboxes) is used
to display results computed by RAD, namely the corrected experimental data I(q), the
structure function S(q) and the atomic PDF/RDF G(r). Usually these two program
windows have a limited usage and so may be “collapsed/minimized in size” (but still
kept) active when RAD is running.
7
The third window (labeled RAD-Gtk in the upper left corner, see above) is the RAD’s
action control window. It too should be kept active while RAD is running.
This window allows the user to get access to the following actions/options (activated by
clicking on them): Experiment & Sample Info Entry; Edit Experiment (Info); Data
Processing and Help. Below we explain each of these options:
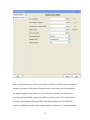
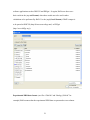
Experiment & Sample Info entry option of RAD-Gtk:
When activated this option allows the user to start a new, open an existing or save a
current RAD project or Quit (see below). RAD projects are text (xml format) files saved
with an extension “rpf”. The files may be opened/viewed with any text editor.
RAD project files contain information about the material studied and the experimental
set-up used. This information is needed to run the option Data Processing. Information
8
about the material include: the number of chemical species, the atomic number of each of
the species, the species concentration and the anomalous dispersion terms (f’ and f”) for
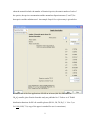
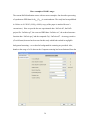
that species and the radiation used. An example Sample Description entry is given below.
It features one of the first applications of RAD on in-house (Mo Ka) XRD data for
Gd4Al3 metallic glass. Results from this study are published in: V. Petkov et al. "Radial
distribution functions for RE 4Al3 metallic glasses (RE=Pr, Gd, Tb, Dy)", J. Non- Cryst.
Sol. 108 (1989) 75 (a copy of the paper is attached for user’s convenience).
9
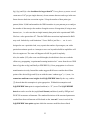
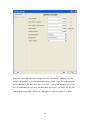
In this example (see above) we first enter the number of chemical species (2 in our
case) in the “Number of chemical species” data field (upper right corner; see above) and
hit Enter ! This is the only time the user should hit the Enter key ! This tells RAD to
open a “drop down list” menu button (second line from the top in the example window
shown above) that lists (consecutively) the chemical species in the material studied.
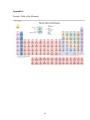
Then we enter the atomic number, Z, for species “1” – it is 13 for Al (see Appendix 1),
and the atomic concentration of Al – 0.43. Note the chemical composition of the metallic
glass in this example could be entered as: Gd4Al3, Gd57Al43, Gd0.57Al0.43 etc. Here we opt
for the last chemical formulation. The others would have been equally good. Users,
however, should be aware that depending on the choice of the chemical formula unit the
computed q[S(q)-1] and PDF/RDF G(r) would differ times a constant factor which
scales with the total number of atoms in the respective chemical/formula unit used [2,3].
RAD users: be consistent in your choices of the chemical formula unit for the
material you study! Stick to the same formula unit (e.g. Gd0.57Al0.43 ) when you use
the respective PDF/RDF data to extract atomic coordination numbers and/or
fit/compare the experimental PDF/RDFs with structure models.
In this example we/the user should also supply information about f’ (=0.056) and
f” (=0.051) for Al when Mo Ka radiation is used. Information for f’ and f” may be
obtained from the National Institute of Standards & Technology www site
http://www.nist.gov/physlab/data/xray_gammaray.cfm
or from literature sources (e.g. the f’ and f” values for Mo and Ag radiation as computed
by D. Cromer are given in Appendix 2 for RAD users’ convenience). Information about
the atomic scattering factors fo(q) for atomic species with Z=1 to Z=98 comes with RAD
10
so the user should not worry about it. Here is the place to note that RAD can handle XRD
data sets from materials composed of up to 10 atomic species with atomic numbers, Z,
from 1 to 98. Selecting “Atomic Species” 2 from the drop down list allows the user to
supply information about Gd, as exemplified below.
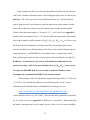
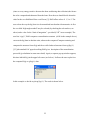
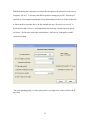
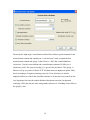
Next, by clicking on the “Experiment Description” button (left upper corner) the user is
allowed to supply information about the particular XRD experiment/set up; as shown
below.
11
Here we specify that x-rays with a wavelength λ=0.709 Ǻ (i.e. Mo Ka) has been used; the
sample was measured in flat plate reflection geometry; the detector was fast enough for
the signal coming from the sample (i.e. 0.2 μs dead time) and the x-ray radiation was
circularly polarized (which is typical for sealed x-ray tube sources). There has been no xray energy discrimination during the XRD data collection and, hence, the XRD data
contain a contribution coming from Compton/inelastic scattering (i.e. Compton scattering
12
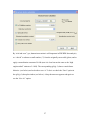
is “All in” the collected XRD data). The liner absorption factor μt for the particular
Gd0.57Al0.43 sample has turned out to be 0.675. Note μt can be measured (more precise
approach; see Appendix 4) or estimated [1, 2] from the material’s mass absorption
coefficient μ/ρ, density ρ and thickness (less precise approach). Also, here we supply
information about the material’s atom number density ρo (in this case = 0.0392 atoms/Ǻ3).
No sample cell/substrate has been used and so the data entry for substrate’s μt is zero.
Note RAD can also process data collected in flat plate transmission geometry or when the
sample has been inside a capillary. Also, x-rays could have been completely linearly
polarized (as with synchrotron sources) and Compton scattering could have been
eliminated during data collection (option Compton scattering “All out”). The user can
select between those options by clicking on the respective “drop down menus” in the
“Experiment description” window. When all the necessary sample and experiment
related information has been supplied, the user should click the “Apply” button (lower
right corner; see above). RAD will perform some checks on the consistency of the
Sample & Experiment Info provided by the user and may issue a warning message if a
problem is identified. Users are advised to pay full attention to RAD’s warning/error
messages. Experiment & Sample Info that has been entered and found error free is
considered “validated” and so can be saved as a “RAD project file” (in xml format) with
an extension “.rpf”. To save a project file the user should select the “Save” option (see
below).
13
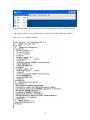
Again, RAD project files are text files; once saved on disk they may be opened/viewed
with any text editor. As an example, below is a print-out of the RAD project file for
Gd0.57Al0.43 we are discussing here:
14
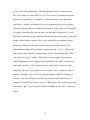
Experiment & Sample Info that has just been entered by the user or read from an
old/existing project file can be modified by selecting the “Edit Experiment” option (see
below) of the RAD-Gtk window.
Edit Experiment option of RAD-Gtk:
When selected (see above) it will allow the user “to walk” through the
“Experiment & Sample Info” forms, make changes, validate and eventually save the
modified Info.
Note Experiment & Sample Info changes are accepted and taken into account in
the XRD data processing/PDF calculations only after the “Apply” button has been hit and
the validation procedures completed with success (i.e. no RAD error/warning messages).
Data Processing option of RAD-Gtk: can be activated only if a “RAD project
file” has been created from scratch or read from disk, and validated.
This option allows the user to:
1) Correct an experimental XRD data set for background (e.g. air) & sample cell (e.g. empty
capillary) scattering, absorption and polarization, smooth the data (if necessary),
15
extend/extrapolate it (linearly) to q=0 wave vectors and put it in equidistant Δq steps. The
result is saved as a file (in x,y ascii format) of corrected XRD data. Such a file is needed
to compute the respective S(q).
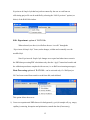
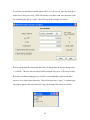
To do the correction the user activates the step “Raw data corrections” from the Data
processing RAD-Gtk option” and supplies the names of the files containing the XRD
intensities scattered from the sample (file GdAl.th in our example, see below) and
background/air (Backgr_GdAl.th in our example, see below). Note, in this example, the
sample was free standing and no support/cell scattering was present. Also, in this
example we decided to smooth the XRD data (“slightly”). Then we hit the ”Apply”
button (lower right corner; see below). RAD will read the experimental XRD data files
and report the number of data points in them as well as the value of the Bragg angle/wave
vector for the last XRD data point collected (see the right hand side of the example
below)
16
When the experimental XRD data sets are entered and corrections are done without any
problem (RAD notices problems reports about them), a separate pop-up window appears
(labeled I(q) in the up left corner; see below). It allows the user to view the experimental
sample & background XRD data sets and the corrected I(q) data.
Note, occasionally this, and other smaller-size RAD program windows, may appear
(pop-up) behind the main RAD program window and so remain “hidden” from the
user’s sight. Users: feel free to shift RAD windows around on the computer screen
to be able to see/access them in the most convenient (for you) way.
By checking the boxes “Raw data” and “Background” (see below)
the user can plot/view the experimental data he/she is analyzing. They appear in yet
another Data plotting window (see below).
17
If/when the user checks the “Corrected data” box (see below)
he/she can plot/view the corrected and extrapolated to q=0 data, I(q) – see below.
18
If the user is satisfied with the experimental XRD data corrections, he/she could check
the “Data” option in the upper left corner of the Data plot window (see below).
19
A drop-down menu (see above) will appear allowing the user to save the corrected data
I(q) or close the data plot window. If the “Save As” option is selected a new window
appears (see below). It allows the user to save the I(q) data in (x,y ascii format) (see the
screen-shot below). Note this data format has been chosen to be the working format
of RAD. In this example we save the corrected XRD data in a file – “GdAl.cor”
The user is free to select any file name/extension for the corrected XRD data. An option
is provided to save the data in (x,y,0,1 ascii format). This is a 4 column ascii file where
the third and forth columns are “zeros” and “ones”. This format is not used by RAD but
by other programs and is introduced just to make RAD’s output portable to third party
20
software applications such as DISCUS and PDFgui. So again, RAD users show save
their results in the (x,y ascii format) when those results are to be used in other
calculations to be performed by RAD. Use the (x,y,0,1 ascii format) if RAD’s output is
to be ported to DISCUS (http://discus.sourceforge.net/) or PDFgui
(http://www.diffpy.org/).
Experimental XRD data format: (see files “GdAl.th” and “Backgr_GdAl.th” for
example) RAD assumes that the experimental XRD data are presented as two columns
21
(2θ or q value vs intensity) in ascii format. RAD saves and uses the computed I(q), S(q)
and G(r) in the same (x,y ascii) format.
For example, below is what “GdAl.th” looks like when opened/viewed with any text
editor: just two columns of numbers. The first is the Brag angle (in 2θ), the second –
XRD intensity (in counts per second).
The number of data points (per file), experimental or RAD computed, may not be more
than 30,000. Also, a single experimental XRD intensity value and, therefore, computed
22
I(q), S(q) and G(r) value should not be larger than 106. Users, please, try not to exceed
count rates of 106 cps (per single detector), do not saturate detectors and so go in the nonlinear detector dead time correction regime ! Keep the number of data points (per
pattern) below 30,000 and normalize the XRD intensities in your patterns per second/per
the number of detectors/per the number of angular sectors of integration (if using an area
detector) etc, i.e. take care that no single intensity data point in the experimental XRD
files has a value greater than 106. Then the XRD data corrections implemented in RAD
may work. Indeed why such limitations ? Users: RAD is just like a…. car. A car is
designed to tow a particular load, carry a particular number of passengers, run with a
particular maximum speed etc. Attempts to run a car beyond its build-in capabilities will
blow its engine out. The same will happen to RAD. No good for anybody.
Also, the author (VP), after some careful thoughts, decided that it does not worth the
effort to try propagating “experimental/counting/statistical etc” errors from the raw XRD
data to I(q) then to S(q) and finally to PDF/RDF G(r). Error propagation via a Fourier
transformation is tricky. Instead the author suggests RAD users consider that all data
points of the derived S(q)s and G(r)s are with the same “random-type” (+/-) error, i.e.
assume/use uniform errors/weights in all S(Q)/PDF/RDF data. By the way, studies
[7] showed that this assumption is quite appropriate. Within this assumption each
S(Q)/PDF/RDF data point is assigned uniform(i.e.=”1”) error. The S(Q)/PDF/RDF
data then can be saved in the (x,y,0,1 ascii format) and directly used by PDFgui and
DUSCUS in structure refinements. The standard deviations of the structural parameters
resulted from those refinements will be based on the “one unit” errors in each of the
S(Q)/PDF/RDF data points against which the structure model has been refined.
23
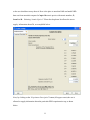
2) Compute a total structure factor S(q) from corrected XRD/I(q) data
To do it the user should activate the option “S(q) calculation” from the dropdown menu list of “Data processing” RAD-Gtk window (see above), and enter the name
of the file containing the corrected XRD data, I(q): (file GdAl.cor in our example, see
below). RAD reads the data file and reports that, in this case, it has 543 data points, the
last one being at Qmax = 16.802 Ǻ-1. Since Compton scattering is present in the XRD data
24
(since no x-ray energy sensitive detector has been used during data collection) the former
has to be computed and subtracted from the latter. Here the user should decide about the
value for the so-called Breit-Dirac recoil factor [2]. RAD offers values of 1, 2 or 3. The
user selects the way the I(q) data is to be normalized into absolute/electron units. At first
the so-called “high-angle method” may be selected (by checking the relevant box, see
above) and a value for the “limit of integration” - provided (12 Ǻ-1 in our example). The
user hits “Apply”, RAD computes a normalization constant (4.048 in the example above),
converts the I(q) data in absolute units, subtracts the computed Compton scattering and
computes the structure factor S(q) and the so-called reduced structure factor q(S(q)-1)
[2,3] (the attached JAC paper describing RAD gives description of the normalization
process/S(q) calculation in some more detail). Again, a separate pop-up window appears,
this time labeled S(q) in the upper left corner (see below). It allows the user to plot/view
the computed S(q) or q(S(q)-1) data.
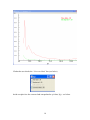
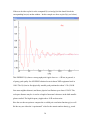
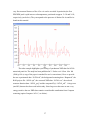
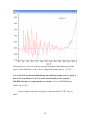
In this example we decide to plot q(S(q)-1). The result is shown below.
25
This q(S(q)-1) data is not of very good quality since it does not oscillate around zero (for
user’s convenience zero appears as a fine dotted line). Obviously some XRD data
corrections and/or I(q) data normalization have not been done in a precise enough way.
RAD provides an option to “correct” for some small residual errors in the I(q) data by
adding/subtracting a constant.
26
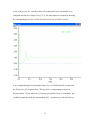
By “trial and error” (yes, human intervention is still important in PDF/RDF data analysis)
we “decide” to subtract a small number (-7) from the originally corrected I(q) data, and to
apply a normalization constant of 4.608 (note it is close but not the same as the “high
angle method” estimate of 4.048). The corresponding q(S(q)-1) shows a much better
behavior (see below) and we decide to save it. To do it we check the “Data” option in
the q(S(q)-1) data plot window (see below). A drop-down menu appears and again we
use the “Save As” option.
27
The user is free to select any file name/extension for the q(S(q)-1) data. We saved it
under the name “GdAl.qsq” in (x,y ascii) format.
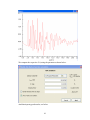
3) Compute an atomic PDF/RDF from a reduced factor q(S(q) -1)
28
To do it the user should activate the option “RDF G(r) calculation” from the drop-down
menu list of “Data processing” RAD-Gtk window (see above) and enter the name of the
file containing the q(S(q) -1) data: (file GdAl.qsq in our example, see below).
RAD reads the data file and reports that it has 543 data points, the last one being at Q max
= 16.802 Ǻ-1. Then we /the user tell(s) RAD to compute G(r) up to 25 Ǻ in steps of 0.02
Ǻ and use a moderate damping factor (0.005) to outweigh higher-q data points since
those are (very often) somewhat noisy. Then we/the user hit(s) “Apply”. A separate popup window appears, this time labeled G (r)/g(r) in the upper left corner (see below).
29
If the user decides to plot/view the computed G(r) or/and g(r) he/she should check the
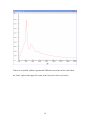
corresponding box(es) on that window. In this example we chose to plot G(r) (see below).
This PDF/RDF G(r) shows a strong unphysical ripple close to r ~ 0 Ǻ but, in general, is
of pretty good quality for a PDF/RDF obtained on an in-house XRD equipment back in
1988 ! The G(r) has its first physically sensible peak positioned at about 3.5 Ǻ (Gd-Gd
first atom neighbor distance) and shows physical oscillations up to about 15-20 Ǻ. This
real-space distance may be viewed as a length of structural coherence in the bulk metallic
glasses studied. The high-frequency ripples above 20 Ǻ are data noise.
Here the user has an option to compute the so-called pair correlation function g(r) as well.
He/she may use either the “experimental” value for the atomic number density ρ o stored
30
in the “RAD project file” (usually a more correct approach) or use an estimate for ρo
computed after the low-r slope of G(r) [2,3]. The latter option is activated by checking
the corresponding box in the “Radial distribution function calculation window”.
A g(r) computed using the experimental value of ρo = 0.039200 atoms/Ǻ we entered in
the RAD project file is shown above. This g(r) shows a strong unphysical peak at
distances below 1 Å but, otherwise, is of pretty good quality. Note, as it should be, g(r)
oscillates around one while the corresponding G(r) – around zero (see the plot below)
31
By checking the “Data” option in the upper left corner in the G(r) data plot window (see
above) the user can save the data shown in this window in (x,y ascii) or (x,y,0,1 ascii)
format. Note, the only way to save RAD’s computed quantities (i.e. I(q), S(q), q(S(q)1), G(r) or g(r)) is i) first to display the respective quantity in the Data plotting
window, ii) view it iii) and, if satisfied, save it using the “Save As” option. RAD will
NOT save anything unless it is “told” to do so.
32
Help option of RAD-Gtk:
Provides general and contact info about RAD and its authors (see below).
Analyzing multiple data sets (i.e. temperature, pressure etc. series):
Once a RAD project file is read/created users may process, one after another, several data
sets from the same sample re-using the RAD control (i.e. Data processing) parameters
they entered/used for the first data set. Any subsequent data set (be it raw XRD data,
corrected I(q) data or q(S(q)-1) data), however, should have the same number of data
points, including the same starting and ending 2θ/Q values and Δq steps as the very first
data set. If not RAD may behave unpredictably.
33
More examples of RAD’s usage:
The current RAD distribution comes with two more examples. One describes processing
of synchrotron XRD data for In0.33Ga0.67As semiconductor. The study has been published
in Petkov et al. PRL 83 (1999) p. 4089 (a copy of the paper is attached for user’s
convenience). Here we provide the raw experimental data: “InGaAs.th”, the RAD
project file: “InGaAs.rpf”, the corrected XRD data: “InGaAs.cor”, the reduced structure
function data: “InGaAs.qsq” and the computed G(r): “InGaAs.rdf”. An energy sensitive
(Ge solid state) detector has been used in this study which had resulted in negligible
background scattering – so no data for background/air scattering are provided. Also,
thanks to the usage of a Ge detector the Compton scattering has been eliminated from the
34
XRD data during data collection (see below that the option to be selected in such cases is
Compton “All out”). Users may start RAD, open the existing project file: “InGaAs.rpf”,
and look over the sample/experimental set-up information provide in it. Some of this info
is shown in the screen-shot above. In this example the step “Raw data corrections” is
trivial and we skip it. Here we will demonstrate the next step - the derivation of q(S(q);
see below. We/the user read(s) the corrected data: “InGaAs.cor” and applies a small
correction to them.
The corresponding q(S(q)-1) looks quite good to very high wave vectors of about 40 Ǻ-1;
see below.
35
When an atomic PDF/RDF is computed from it in the way shown below:
36
very fine structural features of In0.33Ga0.67As can be revealed. In particular, the first
PDF/RDF peak is split into two subcomponents, positioned at approx. 2.4 Ǻ and 2.6 Ǻ,
respectively (see below). They correspond to the presence of distinct Ga-As and In-As
bonds in this material.
The other example highlights a processing of synchrotron XRD data for SrTiO3
nanosized particles. The study has been published in V. Petkov et al. Chem. Mat. 18
(2006) p.814 (a copy of the paper is attached for user’s convenience). Here we provide
the raw experimental data: “SrTiO3.th”, the background scattering data: “Kapton.th”, the
RAD project file: “SrTiO3.rpf”, the corrected XRD data: “SrTiO3.cor”, the reduced
structure function data: “SrTiO3.qsq” and the computed G(r): “SrTiO3.rdf”. A large area
(mar345) detector has been used in this study. Since large area detectors are not x-ray
energy sensitive the raw XRD data contain a considerable contribution from Compton
scattering (option Compton “All in”; see below).
37
Users may start RAD, open the existing project file: “SrTiO3.rpf”, and look over the
sample/experimental set-up information provide in it. Some of this info is shown in the
screen-shot above. The step “Raw data corrections” is trivial and we again skip it. Here
we will demonstrate the next step - the derivation of q(S(q)-1); see below. We/the user
read(s) the corrected data: “SrTiO3.cor” and applies a small correction (-3) to them.
38
Then runs the “high-angle” normalization method first, obtains a good estimated for the
normalization constant and continues in a “trial and error” mode to obtain the best
normalization constant and q(S(q)-1) data. Here we “find” that a small additional
correction (-3) to the corrected data and a normalization constant of 0.0864 give a
satisfactory result. The respective q(S(q)-1) is given in the plot below. This q(S(q)-1)
behaves well up to q-values of about 22 Ǻ-1 but then shows an unphysical upturn, likely
due to an improper Compton scattering correction. Users often may see similar
unphysical behavior of their data. Possible solutions: re-do the data corrections from the
very beginning, look into the sample thickness/absorption correction, background
scattering, collect the data one more using another detector etc. If nothing works still save
the q(S(Q-1) data.
39
Then open the (x,y ascii) file with any text editor and chop-off the higher-q part of the
q(S(Q-1) that “misbehave”. In our case we chopped off the data above q ~ 22.5 Ǻ-1.
User’s: do NOT use distorted/misbehaving/not-oscillating around zero etc. q(S(q)-1)
data sets. If you still have to do it, be aware that the quality of the respective
PDF/RDF data may be compromised very seriously. Do extra PDF/RDF quality
checks (e.g. see [8]).
In this example we decide to use q(S(Q-1) data up to about 22.5 Ǻ-1 only; see
below.
40
We compute the respective G r) using the parameters shown below:
And obtain pretty good results; see below.
41
The examples above are just a glimpse of what RAD users may face in real life.
Indeed atomic PDF/RDF analysis is not so difficult as it looks in first sight. Sure some
time and persistence are necessary to become a successful RAD user. But isn’t the same
with any research effort ?
Good luck !
42
References:
[1] C. Giacovazzo et al., in “Fundamentals of x-ray crystallography”, (Oxford University
Press, 1998).
[2] H.P. Klug and L.E. Alexander, in “X-ray diffraction procedures for polycrystalline
and amorphous materials”, (John Wiley & Sons, 1974); T. Egami and S.J.L. Billinge in
“Underneath the Bragg peaks”
(Pergamon Press, Amsterdam, 2003);
Maerials Today 11 (2008) 28.
[3] D. A. Keen J. Appl. Cryst. 34 (2001) 172.
[4] B. Toby and T. Egami Acta Cryst. A 48 (1992) 336.
[5] P.J. Chupas et al. J. Appl. Cryst. 40 (2007) 463.
[6] V. Petkov et al. Phys. Rev. Lett. 83 (1999) 4089.
[7] E. Curis and S. Benazeth, J. Synchrotron Rad. 7 (2000) 262.
[8] V. Petkov and R. Danev, J. Appl. Cryst . 31 (1998) 609.
43
V. Petkov
Appendix 1:
Periodic Table of the Elements
44
Appendix 2:
Dispersion corrections to the atomic scattering factors for x-rays
Below are Δf” and Δf” anomalous dispersion corrections for Mo Ka and Ag Ka radiation
after D. Cromer Acta Cryst. 18 (1965) p. 17. Note Δf” and Δf” are much smaller than fo
which is pretty close to Z, the atomic number of the respective atomic species.
45
46
Appendix 3:
Atomic Number density definition
47
Appendix 4:
Linear absorption factor μt definition
When passing through a material with a linear absorption coefficient, μ, and
thickness, t, x-rays get attenuated/absorbed. The process can be quantified as
follows:
I(passed through sample) = Io(before sample).exp(-μt)
By measuring I and Io (see below) the linear absorption factor can be
obtained from
μt = - ln(I/Io)
Detector
-------------------------------------------------------------------------------------------Attachments:
VP’s papers featuring RAD and examples of RAD usage illustrated in this User’s manual.
48
VOLUME 83, NUMBER 20
PHYSICAL REVIEW LETTERS
15 NOVEMBER 1999
High Real-Space Resolution Measurement of the Local Structure
of Ga12x Inx As Using X-Ray Diffraction
V. Petkov,1 I-K. Jeong,1 J. S. Chung,1 M. F. Thorpe,1 S. Kycia,2 and S. J. L. Billinge1
1
Department of Physics and Astronomy and Center for Fundamental Materials Research, Michigan State University,
East Lansing, Michigan 48824-1116
2
Cornell High Energy Synchrotron Source, Cornell University, Ithaca, New York 14853
(Received 7 June 1999)
High real-space resolution atomic pair distribution functions PDFs from the alloy series Ga12x lnx As
have been obtained using high-energy x-ray diffraction. The first peak in the PDF is resolved as a
doublet due to the presence of two nearest neighbor bond lengths, Ga-As and In-As, as previously
observed using x-ray absorption fine structure. The widths of nearest, and higher, neighbor PDF peaks
are analyzed by separating the broadening due to static atom displacements from the thermal motion.
The PDF peak width is 5 times larger for distant atomic neighbors than for nearest neighbors. The
results are in agreement with model calculations.
PACS numbers: 61.66.Dk, 61.43.Dq, 61.72.Dd
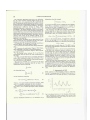
The average atomic arrangement of crystalline semiconductor alloys is usually obtained from the position and intensities of the Bragg peaks in a diffraction experiment [1],
and the actual nearest neighbor and sometimes next nearest neighbor distances for various pairs of atoms by XAFS
measurements [2]. In this Letter, we show how highenergy x-ray diffraction and the resulting high-resolution
atomic pair distribution functions PDFs can be used for
studying the local atomic arrangements in Ga12x Inx As alloys. We show that the first peak in the PDFs can be resolved as a doublet and, hence, the mean position and also
the widths of the Ga-As and In-As bond length distributions determined. The detailed structure in the PDF can
be followed out to very large distances and the widths of
the various peaks obtained. We use the concentration dependence of the peak widths to separate the broadening
due to static atom displacements from the thermal broadening. At large distances the static part of the broadening
is shown to be up to 5 times larger than it is for nearest
neighbor pairs. Using a simple valence force field model,
we get good agreement with the experimental results.
Ternary semiconductor alloys, in particular Ga12x Inx As, have technological significance because they allow
important properties, such as band gaps, to be tuned
continuously between the two end points by varying the
composition x. Surprisingly, there is no complete experimental determination of the microscopic structure of these
alloys. On average, both GaAs and InAs form in the
zinc-blende structure where Ga or In and As atoms occupy
two interpenetrating face-centered-cubic lattices and are
tetrahedrally coordinated to each other [1]. However,
both extended x-ray absorption fine structure (XAFS)
experiments [2] and theory [3] have shown that Ga-As
and In-As bonds do not take some average value but
0
remain close to their natural lengths of LGa-As
苷 2.437 Å
0
and LIn-As 苷 2.610 Å in the alloy. Because of the two
different bond lengths present, the zinc-blende structure of
Ga12x Inx As alloys becomes locally distorted. A number
0031-9007兾99兾83(20)兾4089(4)$15.00
of authors [2–5] have proposed distorted local structures,
but there have been limited experimental data available to
date. The fully distorted structure is a prerequisite as an
input for accurate band structure and phonon dispersion
calculations [6].
The technique of choice for studying the local structure
of semiconductor alloys has been XAFS [2,5]. However,
XAFS provides information only about the immediate
atomic ordering (first and sometimes second coordination
shells) and all longer-ranged structural features remain
hidden. To remedy this shortcoming, we have taken
the alternative experimental approach of obtaining highresolution PDFs of these alloys from high-energy x-ray
diffraction data.
The PDF is the instantaneous atomic density-density
correlation function which describes the local arrangement
of atoms in a material [7]. The PDF, G共r兲, is the sine
Fourier transform of the experimentally observable total
structure factor, S共Q兲, where Q is the magnitude of the
wave vector, given by
2 Z Qmax
G共r兲 苷
F共Q兲 sinQr dQ ,
(1)
p 0
with F共Q兲 苷 Q关S共Q兲 2 1兴. The total structure factor,
S共Q兲, is the normalized scattered intensity from the powder
sample.
PDF analysis yields the real local structure, whereas an
analysis of the Bragg scattering alone yields the average
crystal structure. Determining the PDF has been the approach of choice for characterizing glasses, liquids, and
amorphous materials for a long time [8]. However, its
widespread application to study crystalline materials has
been relatively recent [9]. Very high real-space resolution is required to differentiate the distinct Ga-As and InAs bond lengths present in Ga12x Inx As. High real-space
resolution is obtained by measuring S共Q兲 to a very high
value of Q (Qmax $ 40 Å21 ). An indium neutron absorption resonance rules out neutron measurements in the
© 1999 The American Physical Society
4089
VOLUME 83, NUMBER 20
PHYSICAL REVIEW LETTERS
Ga12x Inx As system. We therefore carried out x-ray powder diffraction measurements. To access Q values in the
vicinity of 40 50 Å21 it is necessary to use x rays with
energies $50 keV. The experiments were carried out at
the A2 24 pole wiggler beam line at Cornell High Energy
Synchrotron Source (CHESS), which is capable of delivering intense x rays of energy 60 keV. Six powder samples
of Ga12x Inx As, with x 苷 0.0, 0.17, 0.5, 0.67, 0.83, and
1.0, were measured. The samples were made by standard
methods and the details of the sample preparation will be
reported elsewhere [10]. All measurements were done in
symmetric transmission geometry at 10 K. The relative
intensities of the Bragg peaks compare well with those
expected from the crystal structure, suggesting that the
samples are free of any significant texture. Low temperature was used to minimize thermal vibration in the samples,
and hence to increase the sensitivity to static atomic displacements. A double crystal Si(111) monochromator was
used. Scattered radiation was collected with an intrinsic
germanium detector connected to a multichannel analyzer.
The elastic component was separated from the incoherent Compton scattering before data analysis [10]. Several diffraction runs were conducted with each sample, and
the resulting spectra averaged to improve the statistical accuracy. The data were normalized for flux, corrected for
background scattering, detector deadtime and absorption,
and divided by the average form factor to obtain the total structure factor, S共Q兲 [7,8,11], using the program RAD
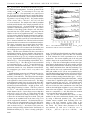
[10,12]. Experimental reduced structure factors, F共Q兲, are
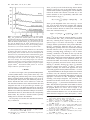
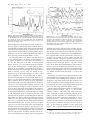
shown in Fig. 1. The corresponding reduced PDFs, G共r兲,
are shown in Fig. 2. The data for the Fourier transform
were terminated at Qmax 苷 45 Å21 beyond which the signal to noise ratio became unfavorable. This is a very high
momentum transfer for x-ray diffraction measurements.
For comparison, Qmax from a Cu Ka x-ray tube is less
than 8 Å21 .
Significant Bragg scattering (well-defined peaks) are immediately evident in Fig. 1 up to Q ⬃ 35 Å21 in the end
members, GaAs and InAs. This implies that the samples
have long range order and that there is little positional disorder (dynamic or static) on the atomic scale. The Bragg
peaks disappear at much lower Q values in the alloy data:
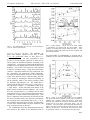
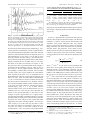
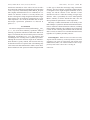
the samples are still long-range ordered but they have significant local positional disorder. At high-Q values, oscillating diffuse scattering is evident. This has a period of
2p兾2.5 Å21 and contains information about the shortest
atomic distances in Ga12x Inx As alloys seen as a sharp first
peak in G共r兲 at 2.5 Å (see Fig. 2). In the alloys, this peak
is split into a doublet as is clearly evident in Fig. 2; with
a shorter Ga-As bond and a longer In-As bond. This peak
is shown on an expanded scale in the inset to Fig. 3 for
all the compositions measured. We determined the positions of the two subcomponents of the first PDF peak,
i.e., the mean Ga-As and In-As bond lengths, and the results are shown in Fig. 3. Also shown is the room temperature result previously obtained in the XAFS study of
Mikkelson and Boyce [2]. There is clearly good agree4090
15 NOVEMBER 1999
FIG. 1. The reduced structure factor, F共Q兲, for Ga12x Inx As
measured at 10 K for various concentrations.
ment. The PDF-based bond lengths are shifted to smaller
lengths by about 0.012 Å since our data were measured
at 10 K, whereas the XAFS experiments were at room
temperature. The nearest neighbor peak is the only peak
which is sharp in the experimental PDFs, as can be seen
in Fig. 2. From the second-neighbor onwards the significant atomic displacements in the alloy samples result in
broad atom-pair distributions without any resolvable splitting. Model calculations show that this broadening is intrinsic and not due to any experimental limitations. The
PDF peak widths in Ga12x Inx As were quantified by fitting individual peaks using Gaussians convoluted with sinc
functions with FWHM 0.086 Å to account for the experimental resolution coming from the finite Qmax . At low r
this was accomplished by fitting individual peaks. At high
r where there is significant peak overlap a profile fitting
regression program was used [13]. The resulting meansquare Gaussian standard deviations are shown in Fig. 4.
One can see that the static contribution to the PDF peak
width on 2nd and higher neighbors is up to 5 times larger
than on the near neighbors. The peak width has a maximum at a composition x 苷 0.5 and affects the common
(As) more than the mixed (metal) sublattice.
In order to better understand these results, we have
modeled to the static and thermal disorder in the alloy
by using a Kirkwood potential [14]. The potential
contains nearest neighbor bond stretching force constants a and force constants b that couple to the
change in the angle between adjacent nearest neighbor bonds. We choose these parameters to fit the
end members [3] with aGa-As 苷 96 N兾m, aIn-As 苷
97 N兾m,
bGa-As-Ga 苷 bAs-Ga-As 苷 10 N/m,
and
VOLUME 83, NUMBER 20
PHYSICAL REVIEW LETTERS
FIG. 2. The reduced PDF, G共r兲, for Ga12x Inx As measured at
10 K for various concentrations.
bIn-As-In 苷 bAs-In-As 苷 6 N兾m. The additional angular force constant required in the alloy is taken
to be the geometrical mean, so that bGa-As-In 苷
p
共bGa-As-Ga bIn-As-In 兲. We have constructed a series
of cubic 512 atom periodic supercells in which the Ga
and In atoms are distributed randomly according to the
composition x. The system is relaxed using the Kirkwood
potential to find the displacements from the virtual crystal
positions. The volume of the supercell is also adjusted
to find the minimum energy. Using this strained static
structure, a dynamical matrix has been constructed, and
the eigenvalues and eigenvectors found numerically.
From this the Debye-Waller factors for all the individual
atoms in the supercell can be found and hence the PDF
of the model by including the Gaussian broadening of
all the subpeaks, which is the correct procedure within
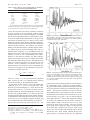
the harmonic approximation [15]. The model PDF is
plotted with the data in the inset to Fig. 3 and in Fig. 5.
The agreement at higher r is comparable to that in the
r range shown. All the individual peaks shown in the
figures consist of many Gaussian subpeaks. The overall
fit to the experimental G共r兲 is excellent, and the small
discrepancies in Fig. 5 between theory and experiment are
probably due to small residual experimental errors. Note
that in comparing with experiment, the theoretical PDF
has been convoluted with a sinc function to incorporate
the truncation of the experimental data at Qmax 苷 45 Å.
The technique discussed above could be extended using
a better force constant model with more parameters, but
does not seem necessary at this time.
The contributions from static displacements and thermal motion to the widths of the individual peaks in
15 NOVEMBER 1999
FIG. 3. Solid symbols: Ga-As and In-As
vs composition as extracted from the present
symbols: room-temperature XAFS results from
Split nearest neighbor PDF peak from the data
the model (solid lines).
bond lengths
PDFs. Open
Ref. 2. Inset:
(symbols) and
the reduced PDF act independently as expected and as
confirmed by our supercell calculations described in the
FIG. 4. Square of the PDF peak widths for far neighbors
(top panel) and nearest neighbors (lower panel) separated by
sublattice type. Symbols: values from the data. In the lower
panel the open symbols are for the Ga-As bond and the closed
symbols for the In-As bond. Solid lines: theory. See text
for details. The mean-square static and thermal distortions are
added. Here Me represents both the metals Ga and In, which
behave in the same way. Note that the scale in the lower panel
is expanded by a factor of 10 compared to the upper panel.
4091
VOLUME 83, NUMBER 20
PHYSICAL REVIEW LETTERS
15 NOVEMBER 1999
is a considerably larger width associated with the AsAs peak in Fig. 4 when compared to the Me-Me peak,
because the As atom is surrounded by four metal cations,
providing five distinct first-neighbor environments [4,5].
The theoretical curve in the lower panel of Fig. 4 is
predicted to be the same for the Ga-As and the In-As
bond length distribution, using the simplified approach.
The Kirkwood model seems adequate to describe the
experimental data at this time, although further refinement
of the error bars may require the use of a better potential
containing more parameters.
We would like to thank Rosa Barabash for discussions and help with the analysis of the static atom
displacements, and Andrea Perez and the support staff
at CHESS for help with data collection and analysis. This work was supported by DOE through Grant
No. DE FG02 97ER45651. CHESS is operated by NSF
through Grant No. DMR97-13424.
FIG. 5. Experimental (open circles) and theoretical (solid
line) PDFs for Ga12x Inx As for concentrations x 苷 0.5 and
x 苷 0.33.
previous paragraph. We therefore expect the squared
width D to be a sum of the two parts. The thermal part s
is almost independent of the concentration, and we fit s 2
by a linear function of the composition x between the two
end points in Fig. 4. To better understand the strain, it is
convenient to assume that all the force constants are the
same and independent of chemical species. Then it can
be shown [16] for any such model that
2
0
Dij
兲2 ,
(2)
苷 sij2 1 Aij x共1 2 x兲 共L0In-As 2 LGa-As
where the subscripts ij refer to the two atoms that
lead to a given peak in the reduced PDF. For the
Kirkwood model the Aij are functions of the ratio of
force constants b兾a only. It further turns out that the
Aij are independent of whether a site in one sublattice
is Ga or In, so we will just refer to that as the metal
site. By taking mean values from the force constants used
in the simulation we find that b兾a 苷 0.83, and that for
nearest neighbor pairs Aij 苷 0.0712. For more distant
pairs the motion of the two atoms becomes uncoupled so
that Aij 苷 Ai 1 Aj , and we find that for the metal site
Ai 苷 0.375 and for the As site Ai 苷 1.134. The validity
of the approximation of using mean values for the force
constants was shown to be accurate by calculating the
model PDF for all compositions as described above and
comparing to the prediction of Eq. (2) [16]. Equation (2)
shows good agreement with the data for near and far
neighbor PDF peaks, and for the different sublattices, over
the whole alloy range, as shown in Fig. 4, using only
parameters taken from fits to the end members. There
4092
[1] R. W. G. Wyckoff, Crystal Structures (Wiley, New York,
1967), Vol. 1, 2nd ed.
[2] J. C. Mikkelson and J. B. Boyce, Phys. Rev. Lett. 49, 1412
(1982); J. C. Mikkelsen and J. B. Boyce, Phys. Rev. B 28,
7130 (1983).
[3] Y. Cai and M. F. Thorpe, Phys. Rev. B 46, 15 879 (1992).
[4] J. L. Martins and A. Zunger, Phys. Rev. B 30, 6217
(1984); M. C. Schabel and J. L. Martins, Phys. Rev. B 43,
11 873 (1991).
[5] A. Balzarotti et al., Phys. Rev. B 31, 7526 (1985);
H. Oyanagi et al., Solid State Commun. 67, 453 (1988).
[6] A. Zunger et al., Phys. Rev. Lett. 65, 353 (1990).
[7] B. E. Warren, X-Ray Diffraction (Dover, New York,
1990).
[8] Y. Waseda, The Structure of Non-Crystalline Materials
(McGraw-Hill, New York, 1980).
[9] T. Egami, Mater. Trans. 31, 163 (1990); T. Egami, in
Local Structure from Diffraction, edited by S. J. L. Billinge
and M. F. Thorpe (Plenum, New York, 1998), p. 1.
[10] I-K. Jeong, F. Mohiuddin-Jacobs, V. Petkov, and S. J. L.
Billinge (unpublished).
[11] H. P. Klug and L. E. Alexander, X-ray Diffraction Proceedures for Polycrystalline Materials (Wiley, New York,
1974), 2nd ed.
[12] V. Petkov, J. Appl. Crystallogr. 22, 387 (1989).
[13] Th. Proffen and S. J. L. Billinge, J. Appl. Crystallogr. 32,
572 (1999).
[14] J. G. Kirkwood, J. Chem. Phys. 7, 506 (1939).
[15] Jean S. Chung and M. F. Thorpe, Phys. Rev. B 55, 1545
(1997); 59, 4807 (1999); M. F. Thorpe et al., in Local
Structure from Diffraction, edited by S. J. L. Billinge and
M. F. Thorpe (Plenum, New York, 1998), p. 157.
[16] J. S. Chung, R. I. Barabash, and M. F. Thorpe
(unpublished).
814
Chem. Mater. 2006, 18, 814-821
Atomic-Scale Structure of Nanocrystalline BaxSr1-xTiO3
(x ) 1, 0.5, 0) by X-ray Diffraction and the Atomic Pair
Distribution Function Technique
Valeri Petkov,*,† Milen Gateshki,† Markus Niederberger,‡ and Yang Ren§
Department of Physics, Central Michigan UniVersity, Mt. Pleasant, Michigan 48859,
Max-Planck Institute of Colloids and Interfaces, Potsdam D-14424, Germany, and
AdVanced Photon Source, Argonne National Laboratory, Argonne, Illinois 60439
ReceiVed September 23, 2005. ReVised Manuscript ReceiVed NoVember 13, 2005
The atomic-scale structure of nanocrystalline BaxSr1-xTiO3 (x ) 1, 0.5, 0) powders has been studied
using high-energy X-ray diffraction, Rietveld refinement, and the atomic pair distribution function
technique. The studies show that the materials are well-ordered at nanometer length distances. The threedimensional atomic ordering in Ba0.5Sr0.5TiO3 and SrTiO3 nanopowders may well be described by a
cubic structure of the perovskite type, similar to that occurring in the corresponding bulk crystals. The
three-dimensional atomic ordering in BaTiO3 is more complex. It is cubic-like on average, but locally
shows slight distortions of a tetragonal-type. The new structural information helps one to understand
better the dielectric properties of these nanomaterials.
1. Introduction
Crystalline perovskite-type oxides show many useful
properties and are widely used as catalysts and in piezoelectrics and ferroelectrics.1,2 A prime example is the family
of BaxSr1-xTiO3 oxides, in particular, BaTiO3. The material
exists in several crystallographic modifications, each showing
a particular dielectric behavior. At high temperature BaTiO3
has a centrosymmetric cubic structure and is paraelectric.
Between room temperature and 393 K the material possesses
a tetragonal-type structure, below 278 K the structure is
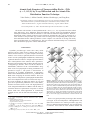
orthorhombic, and below 183 K it is rhombohedral.3 Fragments of the four polymorphs occurring with BaTiO3 are
presented in Figure 1. The picture is characteristic of
perovskites: all crystalline modifications of (Ba/Sr)TiO3
feature a three-dimensional network of Ti-O6 octahedra with
Ba/Sr atoms occupying the network channels. The asymmetry of the low-temperature crystallographic modifications
arises from a displacement of the Ti cations with respect to
the oxygen octahedra (as depicted in Figures 1b-1d) and
gives rise to spontaneous polarization. As a result, BaTiO3
becomes ferroelectric below 393 K. The high permittivity
of the tetragonal modification of BaTiO3 and the ability to
switch the direction of polarization in response to external
electric fields have found application in commercially
available devices such as thin film and multilayer capacitors.4,5
* To whom correspondence should be addressed. E-mail: petkov@
phy.cmich.edu.
† Central Michigan University.
‡ Max-Planck Institute of Colloids and Interfaces.
§ Argonne National Laboratory.
(1) Chandler, C. D.; Roger C.; Hampden-Smith, M. J. Chem. ReV. 1993,
93, 1205.
(2) Bhalla, A. S.; Gou, R.; Roy, R. Mater. Res. InnoVations 2000, 4, 3.
(3) Kwei, G.; Billinge, S. J. L.; Cheong, S.-W.; Saxton, J. G. Ferroelectrics
1995, 164, 57.
(4) Hennings, D.; Klee, M.; Waser, R. AdV. Mater. 1991, 3, 334.
Figure 1. Fragments of the cubic- (a), tetragonal- (b), orthorhombic- (c),
and rhombohedral-type (d) structures occurring with bulk BaTiO3 crystals.
All structure types feature a 3D network of corner-sharing Ti-O6 octahedra
with Ba atoms (solid circles) occupying the open space between them as
shown in (a). Note the octahedral units are perfect in the cubic-type structure.
The Ti-O6 octahedra shown are somewhat distorted with the non-cubictype structure types due to the off-center displacement (directions shown
with arrows) of Ti atoms (solid circles at the center of the octahedra) as
depicted in (b), (c), and (d). The octahedra are centered by Ti atoms (small
solid circles) and coordinated by oxygens (open cicles). The unit cell in
the case of the cubic-type perovskite structure is outlined with thin solid
lines.
SrTiO3 is a typical perovskite possessing a cubic structure
(see Figure 1a) at room temperature. Although BaTiO3 and
SrTiO3 have structures of a similar (perovskite) type, they
show very different transition behavior. It is not until SrTiO3
is cooled to 110 K when its cubic structure distorts and
(5) Frey, M. H.; Payne, D. A. Appl. Phys. Lett. 1993, 63, 2753.
10.1021/cm052145g CCC: $33.50 © 2006 American Chemical Society
Published on Web 01/13/2006
Nanocrystalline BaxSr1-xTiO3 (x)1,0.5,0) Structure
becomes tetragonal.6,7 Thus, SrTiO3 exhibits paraelectric
behavior at room temperature, although recent studies suggest
that the material is indeed an incipient ferroelectric whose
ferroelectricity is suppressed by quantum fluctuations.8
Barium-based mixed oxides have also attracted much
attention.9 In particular, BaxSr1-xTiO3 has shown excellent
dielectric properties, especially as thin films. At room
temperature and low concentrations of Sr (x < 0.5) these
mixed oxides adopt a tetragonal-type structure10 featuring
slightly distorted Ti-O6 octahedra (see Figure 1b). At higher
concentrations of Sr the structure is of the cubic type shown
in Figure 1a.11
It has been discovered that many of the useful properties
of perovskite materials are critically dependent on the
crystallite size. For example, it has been found that at room
temperature the structure of BaTiO3 transforms to cubic-like
when the crystallite size becomes smaller than 100 nm.12,13
On the other hand, high-resolution synchrotron radiation
studies and Raman scattering experiments have shown that
fine BaTiO3 powders with crystallite size as small as 40 nm
show a structure with tetragonal distortions and exhibit
somewhat reduced but still measurable spontaneous polarization.14 Recently, the attention has shifted to even finer
powders with crystallites as small as only a few nanometers.
The reason is that having BaxSr1-xTiO3 in a nanocrystalline
state is a key requirement for producing defect-free thin
films.15,16 Furthermore, nanosize powders provide good
sinterability, which is an essential property for the fabrication
of advanced ceramic materials.2,4
When in a nanocrystalline state BaxSr1-xTiO3 ceramics are
non-ferroelectric, resulting in stable dielectric properties.17,18
Several explanations for the disappearance of ferroelectricity
have been put forward. They point to the absence of longrange cooperative structural distortions as one of the main
reasons that could lead to a suppression of the thermodynamically stable tetragonal phase and the related to it
ferroelectric behavior in nanostructured BaxSr1-xTiO3.19 A
thorough understanding of this so-called size effect and the
properties of nanocrystalline barium/strontium-based materials obviously requires a detailed knowledge of their atomic(6) Lytle, F. W. J. Appl. Phys. 1964, 35, 2212.
(7) Salje, E. K.; Gallardo, M. C.; Jimenes, J.; Cerro, J. J. Phys.: Condens.
Matter 1998, 10, 5535.
(8) Wang, Y. X. Solid State Commun. 2005, 135, 290.
(9) Thongrueng, J.; Nishio, K.; Watanable, Y.; Nagata, K.; Tsuchiya, T.
J. Aust. Ceram. Soc. 2001, 37, 51.
(10) Josef, J.; Vimala, T. M.; Raju, J.; Murthy, V. R. K. J. Appl. Phys.
1999, 32, 1049.
(11) Liu, R. S.; Cheng, Y. C.; Chen, J. M.; Liu, R. G.; Wang, J. L.; Tsai,
J. C.; Hsu, M. Y. Mater. Lett. 1998, 37, 285.
(12) Uchino, K.; Sadanaga, E.; Hirose, T. J. Am. Ceram. Soc. 1989, 72,
1151.
(13) Begg, B. D.; Vance, E. R.; Nowotny, J. J. Am. Ceram. Soc. 1994, 77,
3186.
(14) Yashimura, M.; Hoshina, T.; Ishimura, D.; Kobayashi, S.; Nakamura,
W.; Tsurumi, T.; Wada, S. J. Appl. Phys. 2005, 98, 014313.
(15) Matsuda, H.; Kobayashi, N.; Kobayashi, T.; Miyazawa, K.; Kuwabara,
N. J. Non-Cryst. Solids 2000, 271, 162.
(16) Zhang, J.; Yin, Z.; Zhang, M.-S. Phys. Lett. A 2003, 310, 479.
(17) Takeuchi, T.; Tabuchi, M.; Ado, K.; Honjo, K.; Nakamura, O.;
Kageyama, H.; Suyama, Y.; Ohtori, N.; Nagasawa, M. J. Mater. Sci.
1997, 32, 4053.
(18) Soten, I.; Miguez, H.; Yang, S. M.; Petrov, S.; Coombs, N.; Tetreault,
N.; Matsuura, N.; Ruda, H. E.; Ozin, G. AdV. Funct. Mater. 2002, 12.
(19) Frey, M. H.; Payne, D. A. Phys. ReV. B 1996, 54, 3158.
Chem. Mater., Vol. 18, No. 3, 2006 815
scale structure. Usually the structure of materials is determined from the Bragg peaks in their diffraction patterns.
However, nanocrystalline materials lack the extended order
of the usual crystals and show diffraction patterns with a
pronounced diffuse component and a few broad Bragg-like
features. This renders the traditional diffraction techniques
for structure determination very difficult to apply. That is
why structural studies on nanocrystals are scarce and the
atomic arrangement in BaxSr1-xTiO3 nanopowders has not
been determined in detail yet. Recently, it has been shown
that the three-dimensional (3D) structure of materials with
reduced structural coherence, including nanocrystals, can be
determined using the so-called atomic pair distribution
function (PDF) technique.20-23 Here, we employ the traditional Rietveld and the nontraditional PDF technique to
determine the 3D structure of BaxSr1-xTiO3 (x ) 1, 0.5, 0)
nanoparticles with crystallites having size as small as 5 nm.
We find that these nanostructured materials possess a welldefined atomic arrangement that may be described in terms
of the perovskite-type structure depicted in Figure 1. The
new structural information helps one understand better the
dielectric properties of the nanomaterials.
2. Experimental Section
2.1. Sample Preparation. Nanocrystalline BaxSr1-xTiO3 samples
were obtained through a recently discovered approach employing
a nonhydrolytic and halide-free procedure.24 In the first step of the
procedure metallic barium and/or strontium were dissolved in
anhydrous benzyl alcohol at elevated temperatures (343-373 K).
Generally, Sr needed a higher temperature to dissolve than Ba. The
resulted solutions were mixed with 1 molar equiv of titanium
isopropoxide, and the reaction mixture was transferred to a steel
autoclave and heated at 574 K for 48 h. The heating took place
under subsolvothermal conditions since the boiling point of benzyl
alcohol is about 478 K. Representative TEM images of thusobtained nanocrystalline materials are shown in Figures 2, 3, and
4 in ref 24. The TEM images reveal that the samples consist of
individual particles with an average size of about 5 nm. Analyses
based on the width of the peaks in the X-ray diffraction patterns of
BaxSr1-xTiO3 performed by us yielded very similar estimates for
the average nanocrystallites’ size. The TEM studies also show that
the nanocrystals are uniform in size and mostly spherical. No large
particles or agglomerates are observed. Thus-obtained nanocrystalline BaxSr1-xTiO3 (x ) 1, 0.5, 0) powders were loaded into glass
capillaries and subjected to synchrotron radiation scattering experiments.
2.2. Synchrotron Radiation Scattering Experiments. Synchrotron radiation scattering experiments were carried out at the
beamline 11-ID-C (Advanced Photon Source, Argonne National
Laboratory) using X-rays of energy 115.232 keV (λ ) 0.1076 Å)
at room temperature. X-rays of higher energy were used to obtain
diffraction data to higher values of the wave vector, Q, which is
important for the success of PDF analysis (Qmax ) 28 Å-1 with
(20) Toby, B. H.; Egami T. Acta Crystallogr. A 1992, 48, 336.
(21) Gateshki, M.; Hwang, S.-J.; Park, D. H.; Ren, Y.; Petkov, V. J. Phys.
Chem. B 2004, 108, 14956.
(22) Billinge, S. J. L.; Kanatzidis, M. G. Chem. Commun. 2004, 7, 749.
(23) Petkov, V.; Trikalitis, P. N.; Bozin, E. S.; Billinge, S. J. L.; Vogt, T.;
Kanatzidis, M. G. J. Am. Chem. Soc. 2002, 124, 10157.
(24) (a) Niederberger, M.; Pinna, N.; Polleux, J.; Antonietti, M. Angew.
Chem., Int. Ed. 2004, 43, 2270. (b) Niederberger, M.; Garnweitner,
G.; Pinna, N.; Antoneitti, M. J. Am. Chem. Soc. 2004, 126, 9120.
816 Chem. Mater., Vol. 18, No. 3, 2006
PetkoV et al.
where F(r) and F0 are the local and average atomic number
densities, respectively, and r is the radial distance. It peaks
at characteristic distances separating pairs of atoms and thus
reflects the atomic-scale structure. The PDF G(r) is the
Fourier transform of the experimentally observable total
structure function, S(Q), i.e.,
G(r) ) (2/π)
Q
∫Q)0
max
Q[S(Q) - 1]sin(Qr) dQ
(2)
where Q is the magnitude of the wave vector (Q ) 4π sin
θ/λ), 2θ is the angle between the incoming and outgoing
radiation beams, and λ is the wavelength of the radiation
used. The structure function is related to the coherent part
of the total scattered intensity as
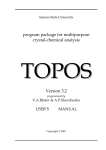
S(Q) ) 1 + [Icoh(Q) Figure 2. Experimental powder diffraction patterns for nanocrystalline
BaxSr1-xTiO3 (symbols) and calculated patterns (solid lines) obtained
through Rietveld refinements. The positions of the Bragg peaks of the cubic
(upper set of bars) and tetragonal (lower set of bars) structures that were
fitted to the diffraction pattern of BaTiO3 are given in the lower part of the
plot. Note the diffraction data for SrTiO3 and Ba0.5Sr0.5TiO3 are approximated with a cubic-type structure only. The corresponding goodnessof-fit factors, Rw, for each of the refinements are reported in Table 1.
the present experiments). The scattered radiation was collected with
an imaging plate detector (mar345). The use of an imaging plate
detector greatly reduces the data collection time and improves the
statistical accuracy of the diffraction data as demonstrated by recent
experiments on materials with reduced structural coherence.25 Up
to 10 images were taken for each of the samples. The exposure
time was 10 s/image. The corresponding images were combined,
subjected to geometrical corrections, integrated, and reduced to onedimensional X-ray diffraction (XRD) patterns using the computer
program FIT2D.26 Thus-obtained XRD patterns for the three
samples studied are presented in Figure 2.
3. Results
As can be seen in Figure 2, the experimental XRD patterns
of nanocrystalline BaxSr1-xTiO3 powders show only a few
broad, Bragg-like peaks that merge into a slowly oscillating
diffuse component already at Bragg angles as low as 6°. As
our subsequent analyses show, the diffraction patterns of
SrTiO3 and Ba0.5Sr0.5TiO3 can be indexed in a cubic unit
cell while that of BaTiO3 can be indexed in both cubic and
tetragonal unit cells of the perovsike-type structure type
shown in Figure 1. Such diffraction patterns are typical for
materials of limited structural coherence and are obviously
difficult to be tackled by traditional techniques for structure
determination. However, when reduced to the corresponding
atomic PDFs, they become a structure-sensitive quantity
lending itself to structure determination.
The frequently used atomic Pair Distribution Function,
G(r), is defined as
G(r) ) 4πr[F(r) - F0]
(1)
(25) (a) Chupas, P. J.; Qiu, X.; Lee, P.; Grey C. P.; Billinge, S. J. L. J.
Appl. Crystallogr. 2003, 36, 1342. (b) Petkov, V.; Qadir, D.; Shastri,
S. D. Solid State Commun. 2004, 129, 239.
(26) Hammersley, A. P.; Hanfland, M.; Hausermann, D. High-Pressure
Res. 1996, 14, 235.
∑ci|fi(Q)|2]/|∑ci fi(Q)|2
(3)
where Icoh(Q) is the coherent scattering intensity per atom
in electron units and ci and fi are the atomic concentration
and X-ray scattering factor, respectively, for the atomic
species of type i.27 As can be seen from eqs 1-3, the PDF
is simply another representation of the powder XRD data.
However, exploring the diffraction data in real space is
advantageous, especially in the case of materials of limited
structural coherence. First, as eqs 2 and 3 imply, the total
scattering, including Bragg scattering as well as diffuse
scattering, contributes to the PDF. In this way both the
average, longer range atomic structure, manifested in the
Bragg peaks, and the local structural distortions, manifested
in the diffuse component of the diffraction pattern, are
reflected in the PDF. And second, the atomic PDFs do not
imply any periodicity and can be used to study the atomic
ordering in materials showing any degree of structural
coherence, ranging from crystals28 to glasses29 and even
liquids.30 Recently, the atomic PDF approach has been
successfully applied to nanocrystalline materials31-33 as well.
Experimental PDFs for the samples studied were obtained
as follows. First, the coherently scattered intensities were
extracted from the corresponding XRD patterns by applying
appropriate corrections for flux, background, Compton
scattering, and sample absorption. The intensities were
normalized in absolute electron units, reduced to structure
functions Q[S(Q) - 1], and Fourier-transformed to atomic
PDFs. Thus-obtained experimental atomic PDFs are shown
in Figure 3. All data processing was done with the help of
the program RAD.34 As can be seen in Figure 3, the
experimental PDFs are rich in structural features but they
vanish at interatomic distances of 2-2.5 nm which are much
shorter than the average size of the nanocrystals (∼5 nm).
(27) Klug, H. P.; Alexander, L. E. In X-ray Diffraction Procedures for
Polycrystalline Materials; Wiley: New York, 1974.
(28) Petkov, V.; Jeong, I.-K.; Chung, J. S.; Thorpe, M. F.; Kycia, S.;
Billinge, S. J. L. Phys. ReV. Lett. 1999, 83, 4089.
(29) Petkov, V.; Billinge, S. J. L.; Sashtri, S. D.; Himmel, B. Phys. ReV.
Lett. 2000, 85, 3436.
(30) Petkov, V.; Yunchov, G. J. Phys.: Condens. Matter 1996, 8, 6145.
(31) Petkov, V.; Zavalij, P. Y.; Lutta, S.; Whittingham, M. S.; Parvanov,
V.; Shastri, S. D. Phys. ReV. B 2004, 69, 085410.
(32) Dmowski, W.; Egami, T.; Swider-Lyons, K. E.; Love, C. T.; Rolison,
D. R. J. Phys. Chem. B 2002, 106, 12677.
(33) Gateshki, M.; Petkov, V.; Williams, G.; Pradhan S. K.; Ren, Y. Phys.
ReV. B 2005, 71, 224107.
(34) Petkov, V. J. Appl. Crystallogr. 1989, 22, 387.
Nanocrystalline BaxSr1-xTiO3 (x)1,0.5,0) Structure
Chem. Mater., Vol. 18, No. 3, 2006 817
Table 1. Structure Data for Nanocrystalline BaxSr1-xTiO3 (x ) 1,
0.5, 0) as Obtained by the Present Rietveld and PDF Refinementsa
BaTiO3
a, Å
UBa/Sr (Å2)
UTi (Å2)
UO (Å2)
Rw, %
Ba0.5Sr0.5Ti O3
SrTiO3
Rietveld
PDF
Rietveld
PDF
Rietveld
PDF
4.016(6)
0.022(2)
0.016(2)
-0.001(2)
2.81
4.021(5)
0.009(2)
0.015(2)
0.022(2)
25
3.985(4)
0.014(2)
0.013(2)
0.001(2)
2.37
3.979(6)
0.016(2)
0.006(2)
0.030(2)
19
3.930(3)
0.013(2)
0.008(2)
0.012(2)
2.34
3.927(5)
0.009(2)
0.010(2)
0.031(2)
18
a The refinements are based on the cubic-type structure presented in
Figure 1a. The goodness-of-fit (Rietveld, see eq 4) and reliability (PDF,
see eq 5) factors Rw are reported for each of the refinements.
analyzing the experimental diffraction data both in reciprocal
and real space employing the Rietveld and PDF techniques,
respectively.
Figure 3. Experimental PDFs for nanocrystalline BaxSr1-xTiO3 extracted
from the corresponding powder diffraction patterns using data extending
to wave vectors as high as 28 Å-1. The position of the first PDF peak,
reflecting Ti-O first neighbor atomic pairs, is marked with an arrow. Note
the intensity of the first PDF peak changes with the relative Sr/Ba content
due to the different scattering power for X-rays of Ba and Sr. A broken
line runs, as a guide to the eye, through the shoulder of the PDF peak
centered at approximately 6.7 Å. The shoulder diminishes with Sr content.
This observation shows that the nanocrystalline BaxSr1-xTiO3
not only lacks the extended order of usual crystals but shows
some structural distortions that further reduce their structural
coherence. Such structural distortions are frequently observed
with nanoparticles of sizes from 5-10 nm and are often
ascribed to surface relaxation effects.35 The distortions are
more pronounced with nanocrystalline BaTiO3 than with the
samples containing Sr since its PDF decays to zero faster
than those of the other two materials (see Figure 3). The
first peak in the three experimental PDFs shown in Figure 3
is positioned at approximately 1.98(2) Å, which is close to
the average Ti-O first neighbor distance observed in the
corresponding crystalline bulk perovskites. The area under
the peak yields 5.8(2) oxygen neighbors for each titanium
atom, reflecting the presence of Ti-O6 octahedral units in
the nanomaterials. The peak is quite sharp and appears with
almost the same shape and full-width at half-maximum
(∼0.18 Å) in the PDFs for the three samples showing that
they all are built of well-defined Ti-O6 octahedra. Also, the
three experimental PDFs exhibit a similar oscillatory behavior at longer interatomic distances, indicating that nanocrystalline BaxSr1-xTiO3 (x ) 1, 0.5, 0) share common
structural features, those of an extended network of Ti-O6
octahedra. However, some fine but clearly noticeable differences in the experimental PDFs are also observed. For
example, the peak at approximately 6.7 Å appears with a
well-pronounced shoulder in the PDF for BaTiO3. The same
peak in the PDF for SrTiO3 has no such pronounced shoulder.
In general, the initial analysis of the experimental PDFs
suggests that the atomic ordering in BaxSr1-xTiO3 nanopowders is likely to be of the same type but differ in some
fine details for different concentrations of Ba and Sr. To
reveal the fine features in the atomic ordering in nanocrystalline BaxSr1-xTiO3, we tested several structural models
(35) Gilbert, B.; Huang, F.; Zhang, H. Z.; Waychunas G. A.; Banfield, J.
F. Science 2004, 305, 65.
4. Discussion
At first, we approached the experimental XRD patterns
with the widely employed Rietveld technique. The Rietveld
technique36 is used for crystal structure determination and
refinement from powder diffraction data. The method
employs a least-squares procedure to compare experimental
Bragg intensities with those calculated from a plausible
structural model. The parameters of the model are then
adjusted until the best fit to the experimental diffraction data
is achieved. The progress of the fit is assessed by computing
various goodness-of-fit factors with the most frequently used
being37
Rw )
{
}
calc 2
∑ wi(yobs
i - yi )
2
∑ wi(yobs
i )
1/2
(4)
where yobs
and ycalc
are the observed and calculated data
i
i
points and wi are weighting factors taking into account the
statistical accuracy of the diffraction experiment. The Rietveld analyses were carried out with the help of the program
FullProf.38 The XRD patterns of nanocrystalline SrTiO3 and
Ba0.5Sr0.5TiO3 were fit with a cubic structure of a perovskite
type39,11 that is found with the corresponding bulk crystals
at room temperature. The XRD pattern of BaTiO3 was
approached with both the cubic and tetragonal structures (see
Figures 1a and 1b) occurring with the corresponding bulk
crystal. Results from the Rietveld refinements are presented
in Figure 2 and the values of the refined structural parameters
in Tables 1 and 2. As can be seen in Figure 2, the XRD
pattern of SrTiO3 and Ba0.5Sr0.5TiO3 are very well reproduced
by a model based on the cubic structure of a perovskite type
shown in Figure 1a. The results show that even when in the
nanocrystalline state, SrTiO3 and Ba0.5Sr0.5TiO3 adopt the
structure type of the corresponding bulk crystals. The XRD
pattern for nanocrystalline BaTiO3 is almost equally well
reproduced by the cubic and tetragonal perovskite-type
structure as the data presented in Figure 2 shows. The values
of the corresponding goodness-of-fit factors Rw, see Tables
(36) Rietveld, H. M. J Appl. Crystallogr. 1969, 2, 65.
(37) Young, R. A. In The RietVeld Method; Oxford University Press: New
York, 1996.
(38) Rodrı́guez-Carvajal, J. Physica B 1993, 192, 55.
(39) Abramov, Y. A.; Tsirel’son, V. G.; Zavodnik, V. E.; Ivanov, S. A.;
Brown, I. D. Acta Crystallogr. B 1983, 39, 942.
818 Chem. Mater., Vol. 18, No. 3, 2006
PetkoV et al.
Table 2. Structure Data for Nanocrystalline BaTiO3 as Obtained by
the Present Rietveld and PDF Refinementsa
a, Å
c, Å
z(Ti)
z(O1)
z(O2)
UBa (Å2)
UTi (Å2)
UO (Å2)
Rw, %
Rietveld
PDF
3.987(6)
4.091(7)
0.467(5)
-0.138(5)
0.495(6)
0.027(2)
0.006(2)
-0.020(2)
2.47
3.997(6)
4.0851(7)
0.470(3)
-0.130(7)
0.490(3)
0.010(2)
0.018(2)
0.021(2)
21
a The refinements are based on the tetragonal-type structure presented
in Figure 1b. The goodness-of-fit (Rietveld, see eq 4) and reliability (PDF,
see eq 5) factors Rw are reported for each of the refinements.
1 and 2, does not allow one to draw a definitive conclusion
in favor of either of the two different structure models
attempted either. Moreover, the Rietveld analysis of the XRD
data for the nanocrystalline BaTiO3 yielded negative values
for the mean-square atomic displacements of oxygen atoms
(also known as thermal factors; see Tables 1 and 2). Such
unphysical results are often obtained with Rietveld analyses
of powder diffraction patterns for materials with considerably
reduced structural coherence. The problems stem from the
inability of the Rietveld analysis to handle properly diffraction patterns showing both broad Bragg peaks and pronounced diffuse scattering. As we demonstrate below, the
difficulties are greatly reduced when the diffraction data are
analyzed in terms of the corresponding atomic PDFs.
Similarly to the Rietveld technique, the PDF technique
employs a least-squares procedure to compare experimental
and model data (PDF) calculated from a plausible structural
model. The structural parameters of the model (unit cell
constants, atomic coordinates, and thermal factors) are
adjusted until the best possible fit to the experimental data
is achieved. The progress of the refinement is assessed by
computing a reliability factor, Rw:
Rw )
{
)2
∑ wi(Giexp. - Gcalc.
i
∑ wi(Giexp.)2
}
1/2
(5)
where Gexp. and Gcalc. are the experimental and calculated
PDFs, respectively, and wi are weighting factors reflecting
the statistical quality of the individual data points.
Results from the PDF analyses of the experimental data
for BaxSr1-xTiO3 (x ) 1, 0.5, 0) in terms of the cubic
structure are presented in Figures 4 , 5, and 6. Structure data
from literature sources3,40-42 were used as initial values in
the PDF refinements. The PDF refinements were done with
the help of the program PDFFIT.43 To mimic the presence
of limited structural disorder in the nanocrystalline materials,
we multiplied the model PDF data with a decaying exponent
of the type exp(-Rr) as originally suggested by Ergun and
later on implemented in a similar manner by Gilbert et al.44
Typical values for R used were of the order of 0.1 Å-1. The
(40)
(41)
(42)
(43)
(44)
Buttner, R. H.; Maslen, E. N. Acta Crystallogr. 1983, 39, 7764.
Evans, H. T. Acta Crystallogr. 1967, 1, 1948.
Hewat, A. W. Ferroelectrics 1974, 6, 215.
Proffen, T.; Billinge, S. J. L. J. Appl. Crystallogr. 1999, 32, 572.
Ergun, S.; Schehl, R. R. Carbon 1973, 11, 127. Gilbert, B.; Huang,
F.; Zhang, H. Z.; Waychunas, G. A.; Banfield, J. F. Science 2004,
305, 65.
Figure 4. Experimental (symbols) and model (solid line) PDFs for BaTiO3.
The model PDF is based on the cubic-type structure shown in Figure 1a.
The parameters of the model are given in Table 1. The reliability factor Rw
is reported in the lower part of the figure.
Figure 5. Experimental (symbols) and model (solid line) PDFs for Ba0.5Sr0.5TiO3. The model PDF is based on a structure of the cubic type shown
in Figure 1a. The parameters of the model are given in Table 1. The
reliability factor Rw is reported in the lower part of the figure. The peak at
6.7 Å is given an enlarged scale in the inset. Its shape is well-reproduced
by a cubic-type model.
refined values of the structural parameters from the analysis
are summarized in Table 1. In the case of SrTiO3 and Ba0.5Sr0.5TiO3 the PDF-based fit yielded structural parameters that
are in good agreement with the present Rietveld results (see
Table 1). The agreement documents well the fact that the
atomic PDF provides a firm quantitative basis for structure
determination. The reliability factors (defined by eq 5) also
reported in Table 1 are as low (∼18%) as could be achieved
with a PDF refinement.45 These results support the findings
of the Rietveld refinements that the atomic ordering in
nanocrystalline SrTiO3 and Ba0.5Sr0.5TiO3 can be welldescribed in terms of the perovskite, cubic-type structure
(space group Pm3hm) depicted in Figure 1a. Models based
on the perovskite, tetragonal-type structure (space group
P4mm) were also attempted with the PDF data for SrTiO3
and Ba0.5Sr0.5TiO3. These models, although having more
internal degrees of freedom, did not give any significant
Nanocrystalline BaxSr1-xTiO3 (x)1,0.5,0) Structure
Figure 6. Experimental (symbols) and model (solid line) PDFs for SrTiO3.
The model PDF is based on a structure of the cubic type shown in Figure
1a. The parameters of the model are given in Table 1. The reliability factor
Rw is reported in the lower part of the figure. The peak at 6.7 Å is given an
enlarged scale in the inset. Its shape is well-reproduced by a cubic-type
model.
improvement in the reliability factors nor in reproducing the
important details in the experimental data. This observation
reinforced our conclusion that nanocrystalline SrTiO3 and
Ba0.5Sr0.5TiO3 studied by us possess a cubic-type structure
at room temperature as their crystalline analogues do.
The atomic ordering in BaTiO3, however, is not so welldescribed in terms of the perovskite, cubic-type structure as
the relatively high value (∼25%, see Table 1) of the
corresponding reliability factor Rw shows. That is why we
attempted three more structural models based on the other
three structural modifications: tetragonal (space group
P4mm), orthorhombic (space group Amm2), and rhombohedral (space group R3m), occurring with bulk crystalline
BaTiO3. Results from PDF analyses of the experimental data
in terms of these three structural models are presented in
Figures 7, 8, and 9, respectively. As the results in Figures 8
and 9 show, the orthorhombic- and rhombohedral-type
models (see Figures 1c and 1d) may be unambiguously ruled
out because they feature substantially distorted Ti-O6
octahedral units, i.e., a broad distribution of first neighbor
Ti-O distances (2 Ti-O distances at 1.86 Å, two Ti-O
(45) Here it may be noted that the agreement factors achieved with the
PDF refinements appear somewhat higher when compared to those
resulted from the Rietveld refinement of diffraction data in reciprocal
space (see Tables 1 and 2). This reflects the fact that an atomic PDF
differs from the corresponding XRD pattern and is a quantity much
more sensitive to the local atomic ordering in materials. Furthermore,
the PDF G(r) is very sensitive to the effects of imperfect data correction
and systematic errors. As a result, Rw’s close to 20% are common for
PDF refinements even of well-crystallized materials.21,23,31 The inherently higher absolute value of the reliability factors resulting from
PDF-based refinements does not affect their functional purpose as a
residuals quantity that must be minimized to find the best fit and as
a quantity allowing differentiation between competing structural
models. It may also be noted that when the atomic pair correlation
function, g(r), defined as g(r) ) F(r)/F0, is used to guide a refinement
of a structural model, the resulting reliability factors Rw are significantly lower than those reported from a refinement based on the
corresponding PDF G(r), and very close to the values of the goodnessof-fit indicators reported from Rietveld analyses. We, however, prefer
to work with the PDF G(r) and not g(r) since the former scales with
the radial distance r (see the multiplicative factor in the definition of
G(r); eq 1) and is thus more sensitive to the longer range atomic
correlations.
Chem. Mater., Vol. 18, No. 3, 2006 819
Figure 7. Experimental (symbols) and model (solid line) PDFs for BaTiO3.
The model PDF is based on the tetragonal-type structure shown in Figure
1b. The parameters of the model are given in Table 2. The reliability factor
Rw is reported in the lower part of the figure. A portion of the experimental
data (open circles) is compared to model ones based on cubic-type (solid
line) and tetragonal-type structures (solid symbols) in the inset on an
enlarged scale. The experimental data are better reproduced by the
tetragonal-type model.
Figure 8. Experimental (symbols) and model (solid line) PDFs for BaTiO3.
The model PDF is based on the orthorhombic-type structure shown in Figure
1c. The reliability factor Rw is reported in the lower part of the figure. An
arrow marks the position of the first PDF peak where the model and
experimental data show a strong disagreement. The same peak is given in
the inset on an enlarged scale.
distances of 2.0 Å, and two Ti-O distances of 2.16 Å with
the orthorhombic model; three Ti-O distances of 1.87 Å
and three Ti-O distances of 2.13 Å with the rhombohedral
model) resulting in a split first PDF peak, a feature the
experimental data do not show. On the other hand, the model
based on the tetragonal-type structure considerably improves
the reliability factor (compare the PDF-based Rw values
reported in Tables 1 and 2 calculated over the whole range
of PDF data from 1 to 28 Å) and better describes the fine
features in the experimental PDF data appearing at low-r
values, in particular, the intensity distribution of the two
subcomponents of the split PDF peak at 10 Å and the position
and intensity of the shoulder of the peak at 6.9 Å (see the
inset in Figure 7). The shoulder reflects mostly correlations
between oxygen atoms from neighboring Ti-O6 octahedra
and its pronounced presence in the PDF for BaTiO3 and
820 Chem. Mater., Vol. 18, No. 3, 2006
Figure 9. Experimental (symbols) and model (solid line) PDFs for BaTiO3.
The model PDF is based on the rhombohedral-type structure shown in Figure
1d. The reliability factor Rw is reported in the lower part of the figure. An
arrow marks the position of the first PDF peak where the model and
experimental data show a strong disagreement. The same peak is given in
the inset on an enlarged scale.
almost disappearance in the PDFs for SrTiO3 and Ba05Sr0.5TiO3 (see Figure 3) indicates that those octahedral units are
somewhat distorted/rotated in the former material and almost
perfectly lined up in the materials containing Sr. The results
suggest that the atomic ordering in nanocrystalline BaTiO3
studied by us is likely to exhibit slight distortions similar to
those occurring in bulk tetragonal BaTiO3 crystal.
The tetragonal structure too features somewhat distorted
Ti-O6 octahedra (one Ti-O distance of approximately 1.9
Å, four Ti-O distances of 2.0 Å, and one Ti-O distance of
2.15 Å). The first peak in the PDF for nanocrystalline
BaTiO3, however, is very well reproduced by the tetragonalbased model, indicating that a model featuring slightly
distorted Ti-O6 octahedra is compatible with the experimental diffraction data. Interestingly, the tetragonal-based
model is superior over the cubic one mostly at low-r
distances (0-15 Å) as the data in Figure 10 a show. It also
agrees reasonably well with the PDF data at higher r
distances and yields a better overall reliability factor Rw (see
Figure 7). A closer look at the behavior of the model data at
higher r distances, however, shows (see Figure 10b) that the
cubic-based model somewhat outperforms the tetragonalbased one as the corresponding reliability factors Rw (this
time calculated over a range of real space distances from 15
to 28 Å) shows. For longer range distances the tetragonalstructure-based model does not reproduce the intensities of
the experimental PDF peaks as good as the cubic-type models
do and, furthermore, seems to produce a PDF that is not
perfectly lined up with the experimental data for distances
longer than 24 Å. The fact that the tetragonal-type model is
superior over the cubic-type one mostly at distances shorter
than 10-15 Å shows that the fine tetragonal distortions in
nanocrystalline BaTiO3 are very likely to be local in nature
(up to 10-15 Å) and coexist with a cubic-type arrangement
at longer range interatomic distances. The coexistence of a
lower symmetry local and a higher symmetry average atomic
arrangements is not an unusual picture and has even been
observed with perfectly crystalline materials such as InGa-As semiconductors for example. These are single-phase
PetkoV et al.
Figure 10. Low r (0-15 Å; upper panel) and higher r part (15-28 Å;
lower panel) of the experimental (symbols) and model (solid line) PDFs
for BaTiO3. The model PDFs are based on the cubic- and tetragonal-type
structures shown in Figure 1a and 1b, respectively. The corresponding
structural parameters are summarized in Table 1 and Table 2, respectively.
The reported in the figure reliability factors Rw are calculated over the
corresponding range of distances.
materials possessing a long-range cubic structure and substantially distorted local atomic ordering.29 Nanocrystalline
ZrO2 has also shown a distorted local and cubic-type, longer
range atomic structure.33 Furthermore, recent NMR studies46
have suggested that even bulk cubic BaTiO3 crystal may be
viewed as an assembly of a large number of small and
randomly oriented “tetragonal” nanosize domains with
dynamically elongated unit cells which transform into a phase
with macroscopic tetragonal structure only when cooled
below 393 K. With nanocrystalline BaTiO3 such a transformation of the local tetragonal-type distortions into a macroscopic tetragonal-type structure that is thermodynamically
stable at room temperature may not occur because of the
very limited structural coherence length (∼2 nm) in the
material.
In summary, the results of our structural studies show that
nanocrystalline SrTiO3 and Ba0.5Sr0.5TiO3 possess a structure
of a perovskite type exhibiting almost perfect Ti-O6 units
arranged in a long-range pattern with cubic symmetry. The
atomic arrangement in nanocrystalline BaTiO3 is also of a
perovskite type but exhibits slight tetragonal distortions that
show up at short-range interatomic distances only.
This new structural information helps one understand the
dielectric properties of BaxSr1-xTiO3 (x ) 1, 0.5, 0) nanoceramics as follows: The longer range cubic (centrosymmetric structures) of SrTiO3 and Ba0.5Sr0.5TiO3 are incompatible with the appearance of ferroelectricity and the
materials do not show spontaneous polarization as experimentally observed.12-16 The situation with BaTiO3 is more
complex. The material shows local tetragonal distortions but
they seem to be confined to distances as short as 10-15 Å
only. As the theoretical estimates of Lines and Glass
suggest,47 the correlation length between polar units in
(46) Zalar, B.; Lebar, A.; Selinger, J.; Blinc, R. Phys. ReV. B. 2005, 71,
064107.
(47) Lines, M. E.; Glass, A. M. In Principles and Applications of
Ferroelectrics and Related Materials; Clarendon: Oxford, 1977.
Nanocrystalline BaxSr1-xTiO3 (x)1,0.5,0) Structure
ferroelectric materials are of the order of at least 10 and 2
nm in directions parallel and perpendicular to the polarization
vector, respectively. With nanocrystalline BaTiO3 the polar
units (slightly distorted/rotated Ti-O6 octahedra) are correlated over distances of about 1.5 nm only and may not
become a driving force strong enough to transform the longer
range structure into an asymmetric (tetragonal) one even at
room temperature. As a result, the material does not show
macroscopic spontaneous polarization as observed in
practice.12-16
5. Conclusions
The atomic arrangement in nanocrystalline BaxSr1-xTiO3
(x ) 1, 0.5, 0) has been studied by synchrotron radiation
scattering experiments and Rietveld and atomic PDF techniques. The materials have been found to possess an atomic
arrangement well-defined over 2-2.5 nm distances and
resembling the one occurring in the crystalline perovskites.
Although the structural coherence length in the nanostructured materials is greatly reduced, their structure still may
be described in terms of a repetitive unit cell containing only
a few atoms as the data summarized in Tables 1 and 2 show.
SrTiO3 and Ba0.5Sr0.5TiO3 possess an atomic arrangement that
Chem. Mater., Vol. 18, No. 3, 2006 821
is cubic type at both short and longer range interatomic
distances. The local symmetry with nanocrystalline BaTiO3
is tetragonal but the slight tetragonal distortions seem to
average out and the structure of the material is better
described in terms of a cubic-like ordering at longer range
distances. That is presumably the reason nanocrystalline
BaTiO3, similarly to SrTiO3 and Ba0.5Sr0.5TiO3, does not
show spontaneous polarization at room temperature.
This study is another demonstration of the ability of the
PDF technique to yield three-dimensional structural information for materials of limited structural coherence, including
nanocrystalline materials. The technique succeeds because
it relies on total scattering data obtained from the material
and, as a result, is sensitive to its essential structural features
regardless of crystalline periodicity and size.
Acknowledgment. Thanks are due to M. Beno from APS,
Argonne National Laboratory, for the help with the synchrotron
experiments. The work was supported by NSF through grant
DMR 0304391(NIRT). The Advanced Photon Source is supported by DOE under Contract W-31-109-Eng-38.
CM052145G