Download Electronic electricity meter EMS - Elgama
Transcript
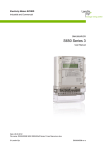
Electronic electricity meter
EMS
User’s manual
Version 5.
“ELGAMA – ELEKTRONIKA” Ltd., Lithuania 2006
“ELGAMA-ELEKTRONIKA” Ltd
Electronic electricity
meter EMS
USER’S MANUAL
"ELGAMA-ELEKTRONIKA" Ltd.
2 Visorių str.
LT-08300 Vilnius
Ph.: +370 5 2375 000
Fax: +370 5 2375 020
E-mail: info@elgama.lt
ELECTRONIC ELECTRICITY METER EMS. USER MANUAL
Contents
1
DESIGNATION ............................................................................................................................................................7
2
METER MODIFICATIONS........................................................................................................................................7
2.1
2.2
2.3
2.4
TYPES OF EMS METER ...........................................................................................................................................7
MAIN FUNCTIONS OF METER ...................................................................................................................................7
ADDITIONAL FUNCTIONS ........................................................................................................................................8
METER CONNECTION ..............................................................................................................................................8
3
TECHNICAL SPECIFICATIONS..............................................................................................................................9
4
CONSTRUCTION ......................................................................................................................................................10
4.1
4.2
4.2.1
4.2.2
4.2.3
4.2.4
4.2.5
4.2.6
4.3
4.3.1
4.3.2
4.4
4.4.1
4.4.2
4.4.3
4.5
4.6
5
ENERGY REGISTRATION......................................................................................................................................16
5.1
5.2
5.3
6
HOUSING ..............................................................................................................................................................10
ELECTRONICS AND OPERATION PRINCIPLE ............................................................................................................11
Measurement module ......................................................................................................................................11
Signal processing............................................................................................................................................11
Microprocessor...............................................................................................................................................11
Non-volatile memory.......................................................................................................................................11
Liquid crystal display......................................................................................................................................11
Internal clock ..................................................................................................................................................12
COMMUNICATION INTERFACES .............................................................................................................................13
Optical communication interface....................................................................................................................13
Electrical communication interface ................................................................................................................13
OUTPUTS ..............................................................................................................................................................14
Optical pulse outputs ......................................................................................................................................14
Electrical pulse outputs (S0)...........................................................................................................................14
Relay output ....................................................................................................................................................14
POWER SUPPLY .....................................................................................................................................................14
CONTROL PUSH BUTTON .......................................................................................................................................14
TOTAL ENERGY REGISTERS ...................................................................................................................................16
RATED ENERGY REGISTERS ..................................................................................................................................16
BILLING PERIOD ENERGY REGISTERS ....................................................................................................................16
DEMAND REGISTRATION.....................................................................................................................................17
6.1
6.2
6.3
6.4
6.5
CURRENT AVERAGE DEMAND ...............................................................................................................................17
LOAD PROFILE ......................................................................................................................................................17
MAXIMUM DEMAND OF BILLING PERIOD...............................................................................................................18
DAILY MAXIMUM DEMAND ...................................................................................................................................19
DEMAND MONITOR AND CUMULATED MAXIMUM DEMAND...................................................................................19
7
REGISTRATION OF INSTANTANEOUS VALUES.............................................................................................19
8
BILLING PERIOD RESET .......................................................................................................................................20
9
TARIFF MODULE.....................................................................................................................................................20
9.1
9.2
9.3
9.4
10
DAY TABLES .........................................................................................................................................................20
WEEK TABLES ......................................................................................................................................................21
SEASON TABLE .....................................................................................................................................................21
SPECIAL DAY TABLES ...........................................................................................................................................21
DATA READING........................................................................................................................................................22
10.1
MANUAL DATA SCROLLING ON LCD ....................................................................................................................22
10.1.1
Scrolling through menu of parameters.......................................................................................................23
10.1.2
Scrolling of billing data .............................................................................................................................24
10.1.3
Scrolling of instantaneous values...............................................................................................................24
10.2
AUTOMATIC DATA SCROLLING .............................................................................................................................25
10.3
INDICATION OF ABNORMAL STATES ......................................................................................................................25
10.4
DATA READING VIA COMMUNICATION INTERFACES..............................................................................................30
11
PARAMETERIZATION............................................................................................................................................30
5
ELECTRONIC ELECTRICITY METER EMS. USER MANUAL
12
SECURITY SYSTEM.................................................................................................................................................30
12.1
12.2
12.3
12.4
12.5
13
SEALING ...............................................................................................................................................................30
PASSWORD ...........................................................................................................................................................31
BLOCKING OF OPTICAL COMMUNICATION INTERFACE (OPTIONAL) .......................................................................31
EVENT LOG ..........................................................................................................................................................31
OTHER MEANS OF PREVENTION ............................................................................................................................32
TECHNICAL SERVICE OF THE METER ............................................................................................................33
13.1
INSTALLATION......................................................................................................................................................33
13.2
SAFETY REQUIREMENTS .......................................................................................................................................35
13.3
TRANSPORTATION AND STORAGE RULES ..............................................................................................................35
13.4
PREVENTION AND ELIMINATION OF MALFUNCTIONS .............................................................................................35
13.4.1
Exterior inspection.....................................................................................................................................35
13.4.2
Inspection of connection and parameterization .........................................................................................35
13.4.3
Procedure of returning to manufacturer ....................................................................................................36
14
ANNEX A. EXAMPLE OF PARAMETER SET .....................................................................................................37
15
ANNEX B. DIMENSIONS OF THE METER..........................................................................................................38
6
ELECTRONIC ELECTRICITY METER EMS. USER MANUAL
1 Designation
This User’s manual introduces a description and exploitation instruction of electronic electricity meter
EMS.
Electricity meter EMS (further referred to as EMS) is an electronic three-phase multi-tariff meter,
which measures active and reactive energy (or only active energy). Furthermore some of EMS
modifications (see Table 2-1) register maximum demand, store load profile and measure instantaneous
RMS values of current, voltage and power.
EMS conforms with the requirements of standard IEC 62053-21 for the accuracy class 1 for active
energy measurement, requirements of standard IEC 62053-23 for the accuracy class 2 for reactive
energy measurement, and requirements for the accuracy class 1 for RMS instantaneous values of
current, voltage, power, load profiles and Maximum Demand.
Meter is used in the utilities, different fields of industry, transport, agriculture, and in domestic sector.
It may be also used in energy management and billing systems – meter has S0 and serial
communication interfaces for data transmission into dispatchers.
EMS resistance to climate and mechanical influences correspond to the requirements of standard IEC
62053-11. Meter must be kept and exploited in the room protected from dust, aggressive steam and
gas.
Note: Tables and Figures of this User’s manual present measurement values and pulse outputs in the
quantities of energy and power (+A, -A, +R, -R, +P, -P, +Q, -Q). Exact number of measurement
values and pulse outputs of a certain meter are indicated in its passport.
2 Meter modifications
2.1 Types of EMS meter
Two types of EMS meter are manufactured:
• Meters of active energy measure import [+A] and export [-A] active energy;
• Meters of active and reactive energy (combimeters) measure import [+A] active energy,
import [+R] and export [-R] reactive energy).
2.2 Main functions of meter
Four modifications of the meter with different amount of main functions are produced:
1. Registration of energy consumption;
2. Registration of energy consumption and maximum demand;
3. Registration of energy consumption, maximum demand and load profiles;
4. Registration of energy consumption, maximum demand, load profiles and instantaneous value.
7
ELECTRONIC ELECTRICITY METER EMS. USER MANUAL
2.3 Additional functions
All EMS meters have S0 pulse outputs. Active energy meters usually have 1 or 2 outputs, and
combimeters – 3 outputs. Meters can be implemented with electrical communication interface (20mA
“current loop” or RS485) and programmable relay output. Multi-tariff meters have internal real time
clock for the control of tariff module. Single tariff meters (modifications EMS XXX.X0.X) have no
internal clock.
2.4 Meter connection
There are meter modifications for three-phase four-wire and for three-phase three-wire electricity
networks. Both, direct-connected and transformer-operated meters are available.
Table 2-1 Type designation
EMS
X
X
X.
X
X.
X
Connection:
Three element four-wire connection 1
Two element three-wire connection 2
Nominal meter voltage:
3x57,7/100V; 3x63,5/110V; 3x69,2/120V 1
- 2
3x220/380V; 3x230/400V 3
3x120/208V; 3x127/220V 4
Nominal meter (maximum) current:
Connection via transformers, 5 (6,25) A 1
Connection via transformers, 5 (10) A 2
Direct connection, 10 (60) A 3
Direct connection, 10 (100) A 4
Direct connection, 5 (60) A 5
Measured quantities:
Active energy (A+)
0
Active energy (A+) and reactive energy (R+, R-)
1
Energy (A+, R+, R-), maximum demand (P+, Q+, Q-)
2
Energy (A+, A-), maximum demand (P+, P-)
3
Energy (A+, R+, R-), maximum demand and profiles (P+, Q+, Q-)
4
Energy (A+, A-), maximum demand and profiles (P+, P-)
5
Energy (A+, R+, R-), maximum demand and load profiles (P+, Q+, Q-),
6
instantaneous values
Internal clock:
Without internal clock 0
With internal clock 1
Auxiliary outputs:
S0 outputs
S0 outputs, relay
S0 outputs, electrical communication interface
S0 outputs, relay, electrical communication interface
8
1
2
3
4
ELECTRONIC ELECTRICITY METER EMS. USER MANUAL
3 Technical specifications
Table 3-1. Main technical specifications
Accuracy class:
Active energy
Reactive energy
Average active power
Nominal voltage, V:
Voltage range, % from Unom:
Nominal (maximum) current, A:
Starting current, % Inom:
Nominal frequency, Hz:
Power consumption, VA:
In voltage circuits
In current circuits (I = Inom)
Meter constant, imp/kWh, imp/kvarh:
Accuracy
Internal clock (IEC 61038):
Backup power supply
Backup time (power reserve) with battery
Backup time (power reserve) with SuperCap (optional)
Loading time of SuperCap for max backup time
Overall lifetime of SuperCap
Number of energy tariffs
Tariff module functions:
Number of maximum demand tariffs
number
S0 output (IEC 62053-31):
Output constant, imp/kWh (imp/kvarh)
pulse duration, ms
Relay:
Maximum switching voltage, V
Maximum switching current, mA
Optical interface
Communication interfaces:
Electrical interface (20mA current loop or RS485)
AC voltage tests (IEC 62053-21)
Insulation strength:
Impulse voltage tests (IEC 60060-1)
Electromagnetic Compatibility:
Electrostatic Discharges (IEC 61000-4-2)
Electromagnetic RF Fields 80MHz-2GHz (IEC 61000-4-3)
Fast Transient Burst Test (IEC 61000-4-4)
Fast Transient Surge Test (IEC 61000-4-5)
Operation temperature range
Storage and transportation temperature range
Mass, kg:
Dimensions, mm3
9
1 (IEC 62053-21)
2 (IEC 62053-23)
1
see Table 2-1
-20%... +15%
see Table 2-1
0,4 (direct-connected)
0,2 (transformer-operated)
50 or 60
< 1,0 (< 0,5 W)
< 0,05 (direct-connected)
< 0,5 (transformer-operated)
500 or 1000 (direct)
5000 or 10000 (transformer)
< 0,5 s/24 h (T=23°C),
< 0,1 s/°C/24 h
Li-ion battery or SuperCap
> 10 years
> 7 days
<1 hour
>15 years
programmable (1…4)
programmable (1…4)
1…3
1...19999 (direct)
1…60000 (transformer)
30
programmable
250
120
IEC 62056-21
IEC 62056-31
4 kV
6 kV
15 kV
10 and 30 V/m
4 kV
4 kV
- 40 … +60°C
- 40 … +70°C
< 1,3
325x177x55
ELECTRONIC ELECTRICITY METER EMS. USER MANUAL
4 Construction
4.1 Housing
Meter case, terminal block and fixing holes comply with requirements of standards IEC 62053-21 and
DIN 43857. The meter conforms to the degree of protection IP51 given in IEC 60529. Clearances and
creepage distances conform to IEC 62052-11 requirements for indoor meters of protective class II.
A highly mechanically resistant transparent cover is made of ultraviolet stabilized polycarbonate
material. It protects meter interior and the name-plate. The transparent cover is fixed to the base by
two sealing bolts. Figure 4-1 presents meter exterior and location of control elements. In addition,
Annex B indicates meter dimensions and location of fixing holes.
6
2
5
1
4
3
exterior
Figure 4-1. EMS meter
Table 4-1. Explanation of Figure 4-1
1
2
3
Optical communication interface
Liquid crystal display (LCD)
Sealing bolts
4
5
6
10
Two-position push button
Photo-sensor for display control
Optical pulse outputs
ELECTRONIC ELECTRICITY METER EMS. USER MANUAL
There is a liquid crystal display (LCD), optical communication interface, photo-sensor (optional) for
display control and two-position push button on the meter cover. See chapter 10.1 for the explanation
of display control commands, and chapter 4.6 for the description of control push button.
Nameplate bears all the necessary information about the meter according to the standard IEC 6205211. Furthermore, designation of main measured value codes and connection diagram are presented on
the nameplate. Printed circuit board (PCB) with surface mounted electronics devices is placed under
the cover. Metal screens that protect electronic devices from external electromagnetic field influence
cover PCB.
4.2 Electronics and operation principle
4.2.1 Measurement module
In measurement module, current and voltage values of each phase are transformed into proportional
analogous signals. Precise current transformers are used for current measurement, and resistive voltage
dividers – for voltage measurement.
4.2.2 Signal processing
Six-channel Sigma - Delta converter transforms analogous signals into digital codes and passes them
to microprocessor.
4.2.3 Microprocessor
The microprocessor calculates average power P(t) by multiplying digital codes with calibration
constants. Combimeters use a value of voltage, phase turned by 90º, for reactive power Q(t)
calculation. Energy values are calculated by means of integrating power values over time. In
accordance with the valid tariff program, the received values are registered in the corresponding
energy and demand registers of non-volatile memory.
Furthermore, microprocessor controls liquid crystal display, communication interfaces, meter outputs,
tariff module and internal clock.
4.2.4 Non-volatile memory
Meter contains a non-volatile EEPROM memory, where billing data, meter parameters and
information about events are stored. The EEPROM memory guaranties more than 20 years of data
retention. Different memory variants (sizes) are available on request (see Table 6-2).
4.2.5 Liquid crystal display
Liquid crystal display (LCD) contains 84 controlled segments. LCD displays majority of data
accumulated in meter and parameterization constants. Figure 4-2 presents the arrangement of LCD
segments and chapter 10 introduces the detailed schemes of information displayed.
Liquid crystal display can be divided into 14 information fields (field is composed of one or several
segments):
•
•
•
•
Energy direction indicator shows load quadrant (active, reactive).
Battery state indicator warns when battery has to be replaced or super capacitor is discharged.
Communication indicator is activated when communication is carried out via optical
communication interface.
Phase sequence indicator shows a number and a sequence of phase voltages connected.
11
ELECTRONIC ELECTRICITY METER EMS. USER MANUAL
•
•
•
•
•
Measurement unit indicator shows measurement unit of the displayed value.
Index shows the identification code of displayed value. The last numeral of the code indicates
a tariff zone (only for energy and power data). “0” means accumulated value of all tariffs.
Arrow of historical values is activated when data of expired interval is reviewed.
Arrow of demand monitor indicates a state when demand monitor threshold is exceeded;
Tariff arrows are switched on when a corresponding tariff is active. At the same time only one
arrow, indicating active energy tariff, and another arrow, indicating active demand tariff, are
turned on (tariff numbers are written on the nameplate below the corresponding arrows).
Backup power supply warning
+P
Measurement units
Arrows of current
energy tariff
Arrows of current
demand tariff
Figure 4-2. Segments of liquid crystal display
While network voltage is disconnected, microprocessor operates in an energy saving mode, thus,
display is not active. When meter is disconnected data may be reviewed by affecting photo-sensor or
push-button (in unsealed position) for 2 seconds (this feature is available only in meters with backup
battery, not with super capacitor). Accumulated energies of each activated tariff are displayed three
times repeatedly, and afterwards display becomes inactive.
4.2.6 Internal clock
Meter contains internal real time clock, which counts years, months, weekdays, hours, minutes and
seconds. Clock information is used to control the time switch of energy and demand tariffs, to form
integration periods of average demand and to register events with date and time stamps. Clock is
synchronised by quartz resonator. Temperature errors are compensated by the firmware (only when
network voltage is applied to the meter). Table 3-1 presents main characteristics of the internal clock.
Changeover to daylight saving time (summer time) and back to normal time is performed
automatically. Start and end of daylight saving time can be set according to the European standard or
the user may define their own specifications (see Table 4-2 for available variants).
In case of power outage, backup power supply for the clock is provided by a Li-ion battery or super
capacitor (SuperCap). Please refer to the meter passport, in order to find out what type of backup
power supply is implemented in a certain meter. When the network voltage is available, energy from
the backup power supply is not consumed. The Li-ion battery can backup internal real time clock for
not less than 10 years without the main power supply. The SuperCap has a capacity for at least 7 days
supply of the real time clock. If a blinking battery state indicator appears on the display, the time and
date of the internal clock is not guaranteed and the battery must be replaced or the super capacitor has
to be recharged. In this case, the meter performs as a single-tariff device, and the data is assigned to the
specific tariff (default on failure), specified during the parameterization. It can be any of the activated
12
ELECTRONIC ELECTRICITY METER EMS. USER MANUAL
energy or demand tariffs. The time and date of the internal clock has to be set in order to recover a
normal tariff operation.
Only the manufacturer or its authorized representative may replace the Li-ion battery!
It takes not more than 1 hour for the main power supply to completely recharge the SuperCap.
Table 4-2. Specification of daylight saving time
Date format
Daylight saving time
[MM.DD.hh]
00.00.00 Daylight saving time is deactivated.
A changeover to summer time is carried out on the last Sunday of a specified month MM
at 2 a.m., by setting the clock 1 hour forward. A changeover back to normal time is
MM.00.00
carried out on the last Sunday of a specified month MM at 3 a.m. by setting the clock 1
hour backward.
A changeover to summer time is carried out on the last Sunday of a specified month MM
on the specified time hh:00 by setting the clock 1 hour forward. A changeover back to
MM.00.hh
normal time is carried out on the last Sunday of a specified month MM on the specified
time hh:00 by setting the clock 1 hour backward.
A changeover to summer time is carried out on the time and date specified by setting the
MM.DD.hh clock 1 hour forward. A changeover back to normal time is carried out on the time and
date specified by setting the clock 1 hour backward.
4.3 Communication interfaces
All EMS meters have an optical communication interface. In addition, EMS XXX.XX.3 and EMS
XXX.XX.4 modifications have electrical communication interface - 20mA “current loop” or RS485.
Exact type of electrical interface of a certain meter is indicated in its passport
4.3.1 Optical communication interface
Optical communication interface meets the requirements of standard IEC 62056-21 and is used to
download data locally into PC via an optical head. Interface is also used for the adjustment and
parameterisation of the meter.
Characteristics of optical communication interface are the following:
Data transmission rate
300 ... 9600 baud;
Recommended data reading rate
4800 baud;
Recommended parameterization rate
2400 baud.
Some modifications of EMS meters maintain the blocking function of the optical communication
interface. This function prevents unauthorized data reading and changes of parameters. Pushing a
button in sealing position (when seal is eliminated) unblocks communication. Read more about this
function in Chapter 12.3. In other modifications of EMS meters, long press (>6 seconds) of push
button in sealing position invokes reset of billing period (see Chapter 8).
4.3.2 Electrical communication interface
Electrical interface is designated for remote data transmission to external equipment. There can be
different interface implementations. A default variant of the interface is a two-wired passive 20 mA
“current loop” type electrical interface powered by external device. The maximum supply voltage of
open circuit is <30V, and the maximum loop current is <30 mA. In case of reverse connection,
interface is not active, but it is protected from damage. The current loop interface is used to link a
maximum of 8 meters to a bus system and allows data transmitting up to 2 km distance.
As an alternative, passive or active RS485 electrical interface can be implemented in some
modifications. For the passive interface, the power supply has to be provided by the external
communication devices connected to the meter. The voltage of the power supply must be in the range
8…20 V. The passive RS485 interface is used to link a maximum of 128 meters in a daisy-chain
13
ELECTRONIC ELECTRICITY METER EMS. USER MANUAL
network, while in case of active RS485 interface a maximum of 32 meters can be connected. The
communication is possible within a distance of several hundreds of meters.
Please refer to the passport of certain EMS meter to find out about exact type of electrical interface
implemented. In any case, data are transmitted by means of IEC 62056-31 protocol with a baud rate up
to 9600 bauds.
4.4 Outputs
4.4.1 Optical pulse outputs
Meter is equipped with a red light emitting diode (LED), which produces light pulses with frequency
proportional to the energy measured. LED is used for meter calibration and metrological verification.
Pulse constants (imp/kWh, imp/kVarh) and pulse duration (30 ms) are programmed by manufacturer
and can not be changed by the user. Active energy meters have only one LED for active energy,
whereas combimeters have two light emitting diodes: the first LED - for active energy, and the second
- for reactive energy.
4.4.2 Electrical pulse outputs (S0)
Meter has electrical pulse outputs for transmission of pulses to external pulse receivers. Pulses carry
information about the measured energy. Outputs are electrically isolated by opto-couplers. Pulse
constant is programmed in the interval from 1 to 60000 imp/kWh (imp/kVAh) for transformeroperated meters and from 1 to 19999 imp/kWh (imp/kVAh) for direct-connected meters. Maximum
switching voltage is 24 V, and maximum switching current is 100 mA. Active energy meters have one
or two outputs (it depends on energy directions measured), whereas combimeters can have three
electrical pulse outputs. For the exact number of electrical pulse outputs, please refer to the meter
passport.
4.4.3 Relay output
Relay output can commutate direct and alternating 120 mA current with voltage up to 250 V. Relay
operation may be programmed in two modes:
normally disconnected contacts are connected when specified energy tariff is valid;
normally disconnected contacts are connected for two programmed periods during the 24-hour
interval (periods are set in 15 minutes step).
4.5 Power supply
EMS meter is equipped with pulse mode power supply. It guarantees stable operation of meter when
network voltage ranges from -15 ... +20% of the nominal voltage. In case of voltage disconnection,
microprocessor switches into energy saving mode, where backup power supply for internal real time
clock is provided by Li-ion battery or super capacitor (SuperCap). Please refer to the meter passport, in
order to find out what type of backup power supply is implemented in a certain meter. When the
voltage is restored, energy from backup power supply is not consumed. Li-ion battery can backup
internal real time clock for not less than 10 years without main power supply. SuperCap has a capacity
for at least 7 days supply of real time clock, and it takes not more than 1 hour for main power supply to
completely recharge SuperCap.
4.6 Control push button
Two-position push button is mounted on the main cover of meter.
In position A (see Figure 4-3) the button is used to control data scrolling on LCD. Two commands are
used:
14
ELECTRONIC ELECTRICITY METER EMS. USER MANUAL
•
•
Short button push (<0,5s – further referred to as a short signal);
Long button push (>2s – further referred to as a long signal).
Data scrolling commands generated by a push button correspond to the light signal commands
received by photo sensor.
Read Chapter 10.1 to find out more about the control of data scrolling.
(Optional) In position B (see Figure 4-3) button can be used to unblock communication via optical
interface (read more about communication blocking function in Chapter 12.3) or, as an alternative, to
invoke billing period reset (see Chapter 8).
Figure 4-3. Two-position push button
Switching of push-button function
In order to change the push button function, please use a screwdriver and turn the button by 90º
clockwise.
Button sealing
Push button can be sealed only in position A (see Figure 4-3). A sealing wire of 2mm diameter is
recommended for that purpose. However, if a wire of 1mm diameter is used, it is necessary to make it
double. Moreover, wire has to be stretched tightly.
15
ELECTRONIC ELECTRICITY METER EMS. USER MANUAL
5 Energy registration
Energy values are obtained by integrating single-phase values of power over the integration interval of
1 second. The resulting energy values with a fixed period (energy portions) are summed up
continuously in appropriate energy registers.
5.1 Total energy registers
In total energy registers, energy is recorded as a cumulative value, i.e. the memory continuously
replaces the old value of energy with the new value (previous value + energy portion). Cumulative
values are calculated from the origin (first start of meter measurements) to the instantaneous time
point. The following total energy registers can be available in the meter (see Table 5-1). Please refer to
symbol * in type designation EMS xxx.*x.x (see Table 2-1) in order to find out what energy quantities
are registered in a certain type of meter. Total energy registers are displayed on LCD (see Figure 10-7)
and can be readout via communication interfaces.
Table 5-1. Total energy registers
Code
Register
1.8.0
Total energy register for import active energy (+A)
2.8.0
Total energy register for export active energy (-A)
3.8.0
Total energy register for import reactive energy (+R)
4.8.0
Total energy register for export reactive energy (-R)
5.2 Rated energy registers
In rated energy registers, energy is recorded as a cumulative value for a time span of specified rate
(energy tariff). The following rated energy registers can be available in the meter (see Table 5-2).
Please refer to symbol * in type designation EMS xxx.*x.x (see Table 2-1) in order to find out what
energy quantities are registered in a certain type of meter. Each energy quantity may have several rated
energy registers. It depends on the number of activated energy tariffs. Rated energy registers are
displayed on LCD (see Figure 10-7) and can be readout via communication interfaces.
Table 5-2. Rated energy registers
Code
Register
1.8.T
Rated energy register of tariff T for import active energy (+A)
2.8.T
Rated energy register of tariff T for export active energy (-A)
3.8.T
Rated energy register of tariff T for import reactive energy (+R)
4.8.T
Rated energy register of tariff T for export reactive energy (-R)
T = [1…4] – energy tariff
5.3 Billing period energy registers
Billing period energy registers record energy as a delta value, in order to obtain energy consumption
during a billing period. The procedure is as follows. At the end of the billing period, the meter saves
the content of the energy register to the billing profile and clears the content of the energy register.
During the following billing period, the meter records the energy consumption beginning with a meter
reading of 0 and, at the end of the period, the value is again saved and the register is cleared. The
following billing energy registers can be available in the meter (see Table 5-3). Please refer to symbol
* in type designation EMS xxx.*x.x (see Table 2-1) in order to find out what energy quantities are
registered in a certain type of meter. Each energy quantity may have several billing period energy
registers. It depends on the number of activated energy tariffs.
16
ELECTRONIC ELECTRICITY METER EMS. USER MANUAL
At the end of the billing period, the energy value of current billing period is stored in a non-volatile
memory. Energy consumption history of 16 last billing periods is available. Every time a new value is
stored, the oldest stored value is overwritten. Only energy values of current and last billing periods are
displayed on LCD (see Figure 10-7). The entire history of billing period energy values is readout via
communication interfaces.
Table 5-3. Billing period energy registers
Code
Register
1.9.T
Billing period energy register of tariff T for import active energy (+A)
2.9.T
Billing period energy register of tariff T for export active energy (-A)
3.9.T
Billing period energy register of tariff T for import reactive energy (+R)
4.9.T
Billing period energy register of tariff T for export reactive energy (-R)
T = [1…4] – energy tariff
6 Demand registration
Measured energy portions are recorded in demand registers as average demand values over integration
period. Integration period is the regular period of time during which the demand is measured and
continuously integrated. Integration period can be selected from the array of [5, 10, 15, 20, 30, 60]
minutes during parameterisation of the meter. Control of the integration period takes place internally
by the internal clock. The integration period is synchronised with the time-of-day, so that it always
starts on the hour (e.g. integration periods of 15 minutes start at 10:00, 10:15, 10:30, 10:45, 11:00,
11:15 etc.).
6.1 Current average demand
Current average demand registers record average power of current integration period. Each register
sums up the corresponding energy portions during the current integration period. Current average
demand (CD) is calculated according to Equation 1:
Equation 1
∆E ⋅ 3600
CD =
∆t
where ∆E – energy registered from the beginning of current integration period [kWh, kVArh]; ∆t –
number of seconds elapsed from the beginning of current integration period.
At the end of integration period the current average value of demand is available for further processing
in the maximum demand registers and can be stored in load profile.
The following current average demand registers can be available in the meter (see Table 6-1). Please
refer to symbol * in type designation EMS xxx.*x.x (see Table 2-1) in order to find out what demand
quantities are registered in a certain type of meter.
Table 6-1. Current average demand registers
Code
Register
1.4.0
Current average demand register for import active power (+P)
2.4.0
Current average demand register for export active power (-P)
3.4.0
Current average demand register for import reactive power (+Q)
4.4.0
Current average demand register for export reactive power (-Q)
6.2 Load profile
Load profile function is available only in EMS XXX.41.X, EMS XXX.51.X and EMS XXX.61.X
modifications. Average values of demand can be stored to the load profile at the end of every
integration period. Maximum load profile width, i.e. number of demand quantities stored in load
profile, is 3. Please refer to symbol * in type designation EMS xxx.*x.x (see Table 2-1) in order to find
17
ELECTRONIC ELECTRICITY METER EMS. USER MANUAL
out what demand quantities are registered in a certain type of meter. During parameterisation, user
selects the measured demand quantities to be captured in the load profile.
Memory depth, i.e. number of days to be recorded in the load profile, is presented in Table 6-2. It
depends on the integration period, as well as, on non-volatile memory variants (sizes A, B and C), that
are available on request. Table 6-2 presents the total storage time of load profile for all demand
quantities. It may be divided for measured demand quantities at any ratio. For example, if the meter is
equipped with memory variant C, if the integration period is set to 15 minutes, and if only import
active demand (+P) is parameterised for recording, then 63 days can be recorded in the load profile.
Load profile entries are not displayed on LCD, however they can be readout via communication
interfaces.
Table 6-2. Storage interval of load profile (in days)
Memory variant (selectable by ordering)
Integration period, min.
A
B
C
Number of days
5
7
14
21
10
14
28
42
15
21
42
63
20
28
56
84
30
42
84
126
60
84
168
252
6.3 Maximum demand of billing period
Billing period maximum demand is the highest average value of demand determined during the entire
billing period. At the end of each integration period, the meter compares the current average value of
demand with the previously highest average value of demand for the current billing period. The
comparison is only made if the corresponding demand tariff is active. If the current average value is
equal or less than the highest average value, the maximum demand remains unchanged. If the current
average value is greater than the highest average value, the meter stores the current average value as
new maximum demand and simultaneously records the date and time at which the new maximum
occurred. The following billing period maximum demand registers can be available in the meter (see
Table 6-3). Please refer to symbol * in type designation EMS xxx.*x.x (see Table 2-1) in order to find
out what demand quantities are registered in a certain type of meter. Each demand quantity may have
several billing period maximum demand registers. It depends on the number of activated demand
tariffs.
At the end of the billing period, the current maximum demand value together with date and time is
stored in a non-volatile memory. Maximum demand history of 12 last billing periods is available.
Every time a new value is stored, the oldest stored value is overwritten. Only maximum demand values
of current and last billing periods are displayed on LCD (see Figure 10-7). The entire history of billing
period maximum demand values is readout via communication interfaces.
Table 6-3. Billing period maximum demand registers
Code
Register
1.6.M
Billing period maximum demand register of tariff M for import active power (+P)
2.6.M
Billing period maximum demand register of tariff M for export active power (-P)
3.6.M
Billing period maximum demand register of tariff M for import reactive power (+Q)
4.6.M
Billing period maximum demand register of tariff M for export reactive power (-Q)
M = [1…4] – demand tariff
18
ELECTRONIC ELECTRICITY METER EMS. USER MANUAL
6.4 Daily maximum demand
Similarly to maximum demand of billing period, meter registers daily maximum demand, i.e. the
highest average value of demand determined during the 24-hour period. A history of 480 daily
maximum demand values can be stored in the non-volatile memory in total. Memory depth, i.e.
number of values (number of days) to be stored for each demand quantity, is calculated according to
Equation 2:
Equation 2
480
N=
NM * NE
where NM – number of activated demand tariffs [1…4]; NE – number of measured demand quantities
[1…3]. For example, if meter measures +P, +Q and –Q demand, and 4 demand tariffs are activated, the
history of 40 days of daily maximum demand is available. Please refer to symbol * in type designation
EMS xxx.*x.x (see Table 2-1) in order to find out what demand quantities are registered in a certain
type of meter. One demand quantity must share at least one day.
Daily maximum demand is not displayed on LCD, however it can be readout via communication
interfaces.
6.5 Demand monitor and cumulated maximum demand
Demand monitor of the meter monitors average demand values of import power (+P). For this purpose,
the user has to parameterise the demand monitor threshold (i.e. an upper limit of +P average demand).
At the end of each hour, meter selects the highest average demand, registered during this hour. If the
highest demand value exceeds the parameterised threshold, this value is added to cumulative
maximum demand register, and the demand monitor counter is incremented. Furthermore, an arrow
“Demand monitor threshold” is activated on LCD, and stays active until the end of billing period. At
the end of billing period, values of cumulative maximum demand and demand monitor counter are
stored in a non-volatile memory. The cumulative maximum demand register and demand monitor
counter register are cleared then and a new demand monitor for the next billing period starts.
Demand monitor history of 5 last billing periods is available in the meter. It is not displayed on LCD,
however it can be readout via communication interfaces.
7 Registration of instantaneous values
Instantaneous values are measured only in EMS XXX.61.X modification. Available registers of
instantaneous values are listed in table7-1.Instantaneous values are integrated over the integration
interval of 1 second, thus the registers are updated every second. Registers of instantaneous values are
displayed on LCD (see Chapter 10.1.3) and can be readout via electrical interface.
19
ELECTRONIC ELECTRICITY METER EMS. USER MANUAL
Table 7-1. Registers of instantaneous values
Code
Description
32.7.0
Instantaneous RMS voltage (V) of phase L1
52.7.0
Instantaneous RMS voltage (V) of phase L2
72.7.0
Instantaneous RMS voltage (V) of phase L3
31.7.0
Instantaneous RMS current (A) of phase L1
51.7.0
Instantaneous RMS current (A) of phase L2
71.7.0
Instantaneous RMS current (A) of phase L3
1.7.0
Instantaneous active power (kW) of all phases
21.7.0
Instantaneous active power (kW) of phase L1
41.7.0
Instantaneous active power (kW) of phase L2
61.7.0
Instantaneous active power (kW) of phase L3
3.7.0
Instantaneous reactive power (kVAr) of all phases
23.7.0
Instantaneous reactive power (kVAr) of phase L1
43.7.0
Instantaneous reactive power (kVAr) of phase L2
63.7.0
Instantaneous reactive power (kVAr) of phase L3
8 Billing period reset
At the end of billing period, the billing period reset signal triggers the storage of the current values to
the non-volatile memory. The billing period reset may be initiated:
• Automatically by the internal real-time clock at the end of each month;
• (Optional) Manually by pressing the push button in position B (secured by the seal);
• Locally by sending an appropriate command via the optical interface;
• By opening a terminal cover of the meter (tampering recording).
After every billing period reset, regardless how it was initiated, no further reset is possible until the
end of current month (reset lockout).
If billing period reset has to be initiated manually, the push-button needs to be pressed longer than 6
seconds. If billing period reset is carried out successfully, all LCD arrow segments are switched on.
Otherwise, reset lockout is active, and only first 7 arrow segments are switched on.
9 Tariff module
Tariff module uses the internal clock as time base to perform a time switch function for tariff control,
i.e. to activate and deactivate rated registers and the arrows in the display. It can control up to 4 energy
and 4 demand tariffs, which are related to each other. Relations of energy and demand tariffs are
configurable parameters and are available for display on LCD (seeTable 10-2). Tariff on and off times
can be set with the help of day tables, week tables, season table and special day table.
9.1 Day tables
Day table describe tariff switching times during a 24-hour period. Up to 8 tariff transitions can be
described in one table. Up to 16 different day tables can be parameterised in the meter. An example of
day table is presented in table 9-1
20
ELECTRONIC ELECTRICITY METER EMS. USER MANUAL
Table 9-1. Example of day table
No.
1
2
3
4
5
6
7
8
Time
07:00
08:00
11:00
18:00
20:00
23:00
Tariff
T2
T1
T2
T1
T2
T1
9.2 Week tables
Week table defines the number of the day table, which is applicable at a particular day of the week and
on special days. Maximum 10 week tables can be parameterised in the meter. Table 9-2 introduces an
example of week table.
Table 9-2. Example of week table
No
Monday
Tuesday
1
2
3
0
2
3
0
2
3
Wednesday
0
2
3
Thursday
0
2
3
Friday
0
2
3
Saturday
Sunday
1
1
1
1
1
1
Special
day
1
1
1
9.3 Season table
Season table allows activation of the specified week table on the specified date (MM.dd). The year can
be divided in up to 12 seasons.
9.4 Special day tables
There are two special day tables in the meter memory. One table contains permanent special days (the
same date each year, e.g. New Year) and the other table is composed of movable special days
(different date each year, e.g. Easter).
The permanent day table is not limited (every day of the year can be parameterized as a special day),
whereas the movable day table can contain up to 16 days (year, month and day must be specified).
LCD does not display movable days, however, they may be readout via communication interfaces. The
table of permanent special days can be reviewed on LCD (see Figure 10-6).
At each change of the date, the tariff module checks whether or not the following day is a special day
and selects the day table accordingly.
9.5 Tariff Module Operation in Case of Clock Failure
The tariff module controls tariff schedule on the basis of data received from the internal real-time
clock. In the case of clock failure (i.e., clock provides not-guaranteed time data), the control of tariff
schedule becomes impossible because real time is unknown. Should this happen, a blinking battery
state indicator is displayed in LCD, the performance of tariff schedule is interrupted, and all energy
and maximum demand data are recorder in “default on failure” energy and demand tariffs. Those
“default on failure “ tariffs are defined during the parameterization. Time and date of internal clock
have to be set in order to recover the normal operation mode of the tariff module.
21
ELECTRONIC ELECTRICITY METER EMS. USER MANUAL
10 Data reading
Meter data can be accessed in the following ways:
manual data scrolling on LCD;
automatic data scrolling on LCD;
data reading via optical interface;
data reading via electrical interface.
Notice: Meter does not multiply data by voltage and current transformation coefficients stored in the
memory of the meter. All data obtained from the meter need to be multiplied by transformation
coefficients.
10.1 Manual data scrolling on LCD
Almost all data of the meter can be displayed on LCD. Data accessible on LCD and scrolling diagrams
are presented in Figure 10-1 ... Figure 10-8.
Data scrolling can be controlled by:
photo sensor;
push button in position A.
Photo-sensor is used as an optical switch. A light beam, e.g. from a torch, has the same function as the
push button. This enables readings to be made from a distance, e.g. through a protective glass screen in
front of the meter. Meter modifications with backup super capacitor have no photo sensor.
There are two LCD control commands regardless of the source they are generated:
short signal - light beam with duration of <0,5 s or push of the button in position A for <0,5 s;
long signal - light beam with duration of >2s or push of the button in position A for >2 s.
Main menu includes the following data (see also Figure 10-1):
time (code 0.9.1) - time of internal clock. Format hh:mm:ss;
date (code 0.9.2) - date of internal clock. Format - programmable (see Table 10-1);
LCD test - all segments of LCD are switched on for the inspection purposes;
Serial Number (code 0.0.0);
CD +A (code 1.4.0) – average demand of current integration period for active energy (+A);
CD -A (code 2.4.0) – average demand of current integration period for active energy (-A);
CD +R (code 3.4.0) - average demand of current integration period for reactive energy (+R);
CD –R (code 4.4.0) - average demand of current integration period for reactive energy (-R);
_InSt_ - Instantaneous RMS values of voltage current and power;
_End_ - end of main cycle.
22
ELECTRONIC ELECTRICITY METER EMS. USER MANUAL
+P
+P
+P
End of cycle
+P
+P
Instant values
+P
+P
+P
+P
+P
Figure 10-1. Main data scrolling cycle
10.1.1 Scrolling through menu of parameters
Menu of parameters can be activated by means of long signal while LCD test is displayed. Further data
scrolling is presented in Figure 10-2. First column in this diagram presents main cycle of parameter
menu. Short signals initiate scrolling through this menu. Long signal activates scrolling through
submenu (if parameter has the one). Scrolling diagrams of certain parameters are presented in Figure
10-3 ... Figure 10-6.
Every parameter has unique index, which is used to identify parameter. Indexes of main parameters
and their descriptions are presented below.
Index 1_. Number of five digits abcde describes current meter configuration. Meaning of each digit is
described in Figure 10-2. Available values of each digit are presented in Table 10-1. Long signal from
this parameter activates scrolling of relay configuration (see Figure 10-3).
Table 10-1. Meaning of digits in meter configuration
Description
Values
Comments
0
Import only
a. Directions of active energy
1
Import and export
0
Year-Month-day [YY-MM-DD]
b. Format of date indication
1
Weekday-Month-day [WD-MM-DD]
c. Number of activated tariffs
1 ... 4
One ... four tariffs
0
No decimals
d. Decimals for energy indication
1…3
One … three decimals
0
Programmable intervals
e. Activity of relay
1 ... 4
Relay activity assigned to particular tariff 1..4
Index 2_. Type designation of the meter (see Table 2-1).
Index 3_. Contains caption “_SEAS_” only. Long signal activates scrolling through the season table.
Scrolling diagram is presented in Figure 10-4.
23
ELECTRONIC ELECTRICITY METER EMS. USER MANUAL
Index 4_ Contains caption “_uEE-P_” only. Long signal activates scrolling through each week table.
Scrolling diagram is presented in Figure 10-4.
Index 5_. Contains caption “_day-P_” only. Long signal activates scrolling through each day table.
Scrolling diagram is presented in Figure 10-5.
Index 6_. Contains caption “S_day_” only. Long signal activates scrolling through the special day
table. Scrolling diagram is presented in Figure 10-6. Note that movable special days are not displayed
on LCD.
Index 7_. Start of daylight saving time (see Table 4-2).
Index 8_. End of daylight saving time (see Table 4-2).
Index 9_. Constant (imp/kWh) of pulse outputs. Constant is the same for active and reactive energy.
Index A_. Contains two parameters: number of maximum demand tariffs and integration period in
minutes.
Index b_. Number (hexadecimal) of days, daily maximum demand values (-R, +R, +A) are stored in
the memory.
Index C_. Hexadecimal number X1.X2.X3.X4 describes relations between maximum demand tariffs
M1 ... M4 and energy tariffs T1 ... T4. X1 describes energy tariffs, related with maximum demand tariff
M1, X2 – energy tariffs, related with M2 and so on (see
Table 10-2).
Index d_. Date of manufacture of the meter.
Table 10-2. Description of relations between maximum demand tariffs and energy tariffs
М(1...4)
0
1
2
3
4
5
6
7
8
9 A b C d E F
T1 T2 T1 T3 T3 T3 T3 T4 T4 T4 T4 T4 T4 T4 T4
Related energy
T2
T1 T2 T2
T1 T2 T2 T3 T3 T3 T3
tariff
T1
T1
T1 T2 T2
T1
10.1.2 Scrolling of billing data
Scrolling cycles of billing data can be accessed by means of long signal while average demand
registers (codes 1.4.0, 2.4.0, 3.4.0 and 4.4.0) are displayed in the main scrolling cycle (see Figure
10-1). Scrolling diagram of billing data is presented in Figure 10-7.
Figure 10-8 presents examples of data indication on LCD. Only data of activated energy tariffs can be
displayed on LCD.
10.1.3 Scrolling of instantaneous values
Scrolling cycles of instantaneous values can be accessed by means of long signal while caption
“InSt_” is displayed in the main scrolling cycle (see Figure 10-1). Available registers of instantaneous
values are presented in table7-1
24
ELECTRONIC ELECTRICITY METER EMS. USER MANUAL
10.2 Automatic data scrolling
If meter receives no display control signals for 1 minute, microprocessor activates automatic data
scrolling mode. In this indication mode, meter sequentially displays data from a data list. User can
modify the list as well as time of indication of one value, but data accessible in automatic scrolling
mode is limited to the amount of registers presented in Table 10-3.
Table 10-3. List of registers available for display in automatic scrolling mode
Value
Time
Date
LCD test
Serial Number
Average demand of current integration period
Maximum demand of current billing period
Comments
Displays values of activated tariffs only
Displays values of activated tariffs only. Arrow
“Historical values” is activated.
Displays values of activated tariffs only
Displays values of activated tariffs only. Arrow
“Historical values” is active.
Displays values of activated tariffs only
Maximum demand of last billing period
Energy of current billing period
Energy of last billing period
Rated energy registers
Total energy registers
Display period of one value can be programmed from 5 to 99 sec.
10.3 Indication of abnormal states
If meter detects internal failures or abnormal state in network (power outages, reverse current flow), it
displays on LCD the following messages:
Er
fatal failure of the meter. Further exploitation of the meter is not allowed. If this message
occurs, meter has to be uninstalled.
L1L2L3 The whole non-blinking message indicates presence of voltage in all three phases.
If some character disappears it means that there is no voltage in that phase.
Blinking character indicates reverse current flow in that phase.
Blinking of the whole message indicates abnormal sequence of voltage phases.
Voltage of backup power supply felt below critical level. It means super capacitor has to be
charged or battery has to be changed. Only manufacturer or it representative can change the battery! In
case of super capacitor, time switching of tariffs is not possible, therefore single-tariff operation is
carried out. Time and date has to be set in the meter in order to recover a normal operation of the tariff
module.
Internal meter errors
A list of internal meter errors can be accessed only via communication interfaces. If there are internal
errors registered in the list, read meter data again (a single internal error can be random and caused by
various reasons). If there is no new error in the newly received list, the meter can be exploited further.
If the newly received list contains a new internal error, the meter has a fatal error and must be
uninstalled.
25
ELECTRONIC ELECTRICITY METER EMS. USER MANUAL
Test
Index
Number of registers for active energy
Format of date
Number of energy tariffs
Decimals
Activity of relay
Programmable intervals of relay activity (see pic. 6-3)
Type
designation
Season table
Season
table
Week
tables
Day
tables
Week tables
Day tables
Special days
Special
days
Summer time
[MM.DD.hh]
Standard time
[MM.DD.hh]
“Time” in main cycle
Long signal
Short signal
Constant of
pulse outputs
Number of maximum demand tariffs
Integration period, min
Number (hexadecimal) of days daily
maximum demand values (-R, +R, +A)
are stored in the memory
Relations between Maximum Demand
and energy tariffs (M4.M3.M2.M1)
Date of manufacture of the meter
Figure 10-2. Scrolling diagram of parameters
26
ELECTRONIC ELECTRICITY METER EMS. USER MANUAL
Beginning of I interval [hh:mm]
End of I interval [hh:mm]
End of II interval [hh:mm]
Beginning of II interval [hh:mm]
Short signal
Long Signal
Figure 10-3. Scrolling diagram of relay program
B
Seasons
Week tables
Number of week table
Season start date (MM.dd)
Figure 10-4. Scrolling diagram of season and week tables
27
ELECTRONIC ELECTRICITY METER EMS. USER MANUAL
Indicator of active profile
Time of tariff change (hh.mm)
Number of
of change of tariff
Number of tariff
to be activated
Figure 10-5. Scrolling diagram of day tables
January
February
Number of special days in month
December
Special days
Time
Long signal
Figure 10-6. Scrolling diagram of special days
28
Short signal
ELECTRONIC ELECTRICITY METER EMS. USER MANUAL
Active +
Active -
Reactive +
Reactive -
Maximum
demand
of current
billing period
Maximum
demand
of last
billing period
Energy
of current
billing period
Energy
of last
billing period
Total energy
Figure 10-7. Scrolling diagram of billing data
Code of data
Indicator of voltage phase sequence
Reactive energy +R
Measurement unit
Active energy +A
Value identificator
Historical values
Tariff of value
Value
Index of parameter
Active energy -A
Reactive energy -R
Parameter symbol
Arrow of active tariff
Figure 10-8. Examples of data indication
29
ELECTRONIC ELECTRICITY METER EMS. USER MANUAL
10.4 Data reading via communication interfaces
For local data readout via optical interface, an optical head shall be used to connect meter to a serial
port of PC. Communication is performed according to the standard protocol IEC62056-21.
Manufacturer provides software LZEMSGS for data reading. The software features graphical user
interface for data readout, database management and graphical interpretation of meter data. For
detailed information see user manual of the appropriate software.
Electrical interface enables connection of the meter to Automatic Meter Reading (AMR) system for
remote data readout. Please refer to chapter 4.3.2 for information about available electrical interface
options. For local data readout via electrical interface, an appropriate converter shall be employed (e.g.
current loop/RS232 or RS485/RS232). PLC, RF, PSTN, GSM, GPRS modems can be implemented for
further data transmission. Please note, that electrical interface employs IEC62056-31 protocol.
11 Parameterization
Parameterization has to be carried out in order to adopt meter settings to the utility requirements. An
example of meter settings is presented in annex A.
Parameterization is performed by means of LZEMSGS software via an optical interface. For detailed
information on using parameterization software refer to the LZEMSGS user manual.
Meter settings (parameters) are protected by password (see chapter 12.2).
Changing of certain parameters causes a reset of some data stored (see Table 11-1 for a list of such
parameters).
Table 11-1. Parameters that cause stored data reset
Parameter
Integration period
Relation between energy and demand tariffs
Number of maximum demand tariffs
Daily maximum demand storage time
Maximum
demand of billing
period
reset
reset
reset
–
Data
Daily
maximum
demand
reset
reset
reset
reset
Load profiles
reset
–
–
–
12 Security system
The data and parameters of the meter are protected against unintended or improper access by a multistage security system.
12.1 Sealing
The utility seals must be broken in order to open the terminal cover. Opening of main cover is secured
by the verification seals. Location of seals is shown in Figure 4-1. Furthermore, a special function of
the push-button (e.g. billing period reset) can be sealed by utility also.
30
ELECTRONIC ELECTRICITY METER EMS. USER MANUAL
12.2 Password
Meter parameterization is protected by a static 8-character password. For the password any of the
ASCII symbols is allowed. If password is set, the user needs to know the password. It is checked by
the meter and access is granted, only if the passwords match.
A system of prevention from password guess is implemented too. If the meter registers more than four
cases of trying to parameterize the meter by using the wrong password, optical communication
interface is blocked for 24 hours period. During this period the meter does not accept even the correct
password.
12.3 Blocking of optical communication interface (optional)
In some modifications, blocking of the optical communication interface is implemented, in order to
protect against unauthorized data readout and parameterization. The utility seal needs to be broken and
the push button has to be pressed in order to unblock communication (see Chapter 4.6).
Communication is unblocked for 1hour, and afterwards it is blocked automatically again.
12.4 Event Log
The event log is an aperiodic memory in which irregular events are captured that may occur in the
meter or in the network the meter is connected to. Entries of the event log can be readout via
communication interfaces. The list below presents all events that are recorded in the event log:
Internal errors of meter
• Resets of the microprocessor (watchdog);
• Checksum errors.
Date and time of last parameterization
Power outage
• total number of power outages,
• date and time of last 32 power outages.
Remark: if duration of power outage is less than parameterized threshold, date and time of this power
outage is not registered, although total number of power outages is incremented.
Missing of any phase voltage
• date and time of last 10 occurrences when any phase voltage was missing.
Reverse current flow
total duration of reverse current flow;
date and time of last reverse current flow:
begin date and time;
end date and time;
duration.
Influence by a strong magnetic field
• total number of influences;
• total duration of influences;
• date and time of last influence.
Opening of terminal cover
• total number of openings;
• total duration of openings;
• date and time of last cover opening,
31
ELECTRONIC ELECTRICITY METER EMS. USER MANUAL
Remark: opening of terminal cover causes an immediate billing period reset and billing data (energy
and maximum demand registers) are stored in the non-volatile memory.
12.5 Other means of prevention
Independently of the current flow direction, energy is recorded as an increasing cumulative value. In
case of reverse current flow, LCD displays a warning – symbol (L1, L2, L3) of a corresponding phase
flashes.
32
ELECTRONIC ELECTRICITY METER EMS. USER MANUAL
13 Technical service of the meter
13.1 Installation
Installation, de-installation and verification of meter must be carried out only be a person who has an
adequate qualification and is familiar with this manual. Figure 13-1, Figure 13-2 and Figure 13-3
present schemes of meter connection into electricity network.
1 2 3 4 5 6 7 8 9 11 14 16 13 23 15 17 18 33
A
B
C
N
Figure 13-1. Three element meter connection into four-wire network via current transformers
+
1
3 4
6 7
9 10 12
-
+
+
+
-
23 24 41 43 44 40
35 36
L1
L2
L3
N
Figure 13-2. Three element meter connection into four-wire network
CS
1 2 3 4 5 6 7 8 9 11 14 16 13 23 15 17 18
Figure 13-3. Two element meter connection into three-wire network via current and voltage
transformers
Prior to installation of the meter it is necessary to make sure that there is no humidity condensate
inside. In case meter was stored in a non-heated room, it is necessary to keep meter for at least 6 hours
in a heated room before installation.
Note: this instruction presents general schemes of meter connection. Connection scheme of auxiliary
terminals may slightly differ as it depends on the number of auxiliary outputs and allotment of
33
ELECTRONIC ELECTRICITY METER EMS. USER MANUAL
auxiliary terminals in the terminal block. Please refer to the passport of the meter for the exact
connection scheme. Location of auxiliary terminals is presented in Figure 13-4 and Figure 13-5.
In case of installation of direct-connected meter, voltage and current circuits of each phase need to be
connected by means of voltage links (see in Figure 13-4).
Auxiliary
terminals
Voltage links
Figure 13-4. Location of voltage links and auxiliary terminals
Figure 13-5. Location of electrical interface terminals
34
ELECTRONIC ELECTRICITY METER EMS. USER MANUAL
13.2 Safety requirements
1. Safety rules of electric equipment maintenance should be followed while installing and using a
meter.
2. Installing, uninstalling, parameterization and verification can be performed only by an authorized
organizations that have technicians with necessary qualifications.
3. Meter’s connection or disconnection from the network should be done when voltage in the network
is turned off. A protection from accidental network voltage connection must be established.
4. No accessories can be hung on a meter, it is forbidden to hit or strike meter’s case.
13.3 Transportation and storage rules
1. Prior to the usage meter has to be kept in a closed room, where the temperature ranges from 5°C to
40°C and average air humidity is up to 80% when temperature being 25°C, in a transportation packing.
The room must be without harmful gas or steam.
2. Packed meters are put in the shelves not more than five rows on each other and not nearer than 0.5
m from heating devices.
3. Unpacked meters can be kept only in repair workshop. Meter can be loaded not more than five rows
on each other and separators must be used. The temperature must range from 10°C to 35°C, average
area humidity must not exceed 80% when temperature being 25°C.
4. During wintertime meters must be kept in a heated room for 6 hours or more.
5. Meters are to be transported only in closed vehicles (carriage, container, hold). Shake acceleration
is to be up to 30m/s², 80-120 strikes per minute. The temperature must range from -50°C to +50°C,
average area humidity must not exceed 98% when temperature being 35°C.
13.4 Prevention and elimination of malfunctions
If it is suspected that meter works improperly, the following actions should be performed:
13.4.1 Exterior inspection
Before applying voltage to the meter, make sure that the case has no mechanical damages,
there are no signs of overheating, all wires are properly connected.
Do not plug a meter into network if it is mechanically damaged. This can cause staff injuries
and destroy meter as well as other equipment!
13.4.2 Inspection of connection and parameterization
After plugging a meter into electric network check whether date and time are correct, whether meter
shows the correct energy direction, valid tariff time zone, calendar and tariff seasons.
1. If meter shows wrong date and time, contact a representative from the organization in charge of the
meter installation.
2. If LCD indicator shows a warning message ‘Er’, the meter should be uninstalled and passed for
repair works.
3. If energy direction is wrong, check if inputs are connected properly to the terminal block.
35
ELECTRONIC ELECTRICITY METER EMS. USER MANUAL
4. If meter calendar season, season time or valid tariff time zone does not correspond to the real
situation, meter’s parameterization data has to be checked and errors has to be corrected by
repeating meter parameterization.
13.4.3 Procedure of returning to manufacturer
In case malfunctions cannot be eliminated on the spot, the meter should be returned to the
manufacturer for repair or replacement. Meters on their return to enterprise must have their passport
with remarks, made by organization in charge of their exploitation, and short description of meter
malfunctioning.
36
ELECTRONIC ELECTRICITY METER EMS. USER MANUAL
14 Annex A. Example of parameter set
Parameterization data
User identifier:
Active energy directions:
Number for energy tariffs:
Number for demand tariffs:
Integration period, min:
Display scroll time
Duration (in days) of data storage:
for daily maximum demand
for load profiles
Relation between energy
and demand tariffs
Daylight saving time
LIETUVA
1, 2
1, 2, 3, 4
1, 2, 3, 4
5 10 15 20 30 60
10s
+A
-A
+R
40
X
40
14
X
14
-R
40
14
Do not register power
outage if outage duration is:
T1
T4
S0 pulse output constant:
T2
Start:
End:
Voltage transf. coefficient
Current transf. coefficient
Date format:
T3
Number of decimals in energy:
√
M1
√
M2
M3
M4
[MM-DD hh:nn]
00-00, 00
00-00, 00
1,00
1,00
[WD], [YY]
0, 1, 2, 3
<10s
Imp/kWh,
imp/kVArh
500
Relay output function:
T0 T1 T2 T3 T4
T0 – relay activation intervals
[hh:mm-hh:mm]
00:00 – 00:00
00:00 – 00:00
√
T0(1):
T0(2):
√
Selection of registers in automatic scroll
Time
Date
+A
-A
+R
-R
Test
1_Cd
2_Cd
3_Cd
4_Cd
Sr. No.
1_Ld
2_Ld
3_Ld
4_Ld
CD +A
1_C
2_C
3_C
4_C
CD -A
1_L
2_L
3_L
4_L
CD +R
Total
Total
Total
Total
CD – average demand of current period;
Cd – max. demand of current month;
Ld – max. demand of last month;
C – energy of current month;
L – energy of last month;
Total – total energy
CD -R
SUM
SUM
SUM
SUM
Special days
Month
January
February
March
April
Day
Month
Day
May
June
July
August
1
16
11
Month
September
October
November
December
1
6
15
Day
1
25, 26
Movable Special days
2004.04.12
2012.04.09
2005.03.28
2013.04.01
2006.04.17
2014.04.21
2007.04.09
2015.04.06
2008.03.24
2016.03.28
2009.04.13
2017.04.17
2010.04.05
2018.04.02
2011.04.25
2019.04.22
Tariff seasons and week profiles related to them
No.
1
2
3
Date
04.01
05.01
09.01
W. pr
1
2
1
No.
4
5
6
Date
10.01
00.00
00.00
W. pr
3
0
0
No.
7
8
9
Date
00.00
00.00
00.00
W. pr
0
0
0
No.
10
11
12
Date
00.00
00.00
00.00
W. pr
0
0
0
Week profiles
No
1
2
3
Monday
1
2
3
Tuesday
1
2
3
Wednesday
1
2
3
Thursday
1
2
3
Friday
1
2
3
Saturday
0
0
0
Sunday
0
0
0
Spec. day
0
0
0
6
7
8
Day profiles
No
0
1
2
3
1
07:00
07:00
07:00
07:00
T3
T2
T2
T2
2
23:00
09:00
09:00
08:00
Switch of tariffs
4
5
3
T4
T1
T1
T1
12:00
12:00
11:00
T2
T2
T2
19:00
23:00
18:00
T1
T4
T1
37
21:00
T2
23:00
T4
20:00
T2
23:00
T4
ELECTRONIC ELECTRICITY METER EMS. USER MANUAL
15 Annex B. Dimensions of the meter
Figure 15-1. Dimensions of the meter and fixing holes
38


