1
Berichte aus
Arbeitskreisen
der
DGK
Nr. 8
Rietveld Refinement
of the Crystal Structure of
Sodium-para-hydroxybenzoate
using the GSAS Program System:
A Practical Guide
Robert E. Dinnebier
Deutsche Gesellschaft für Kristallographie
2000
Preface
The idea behind this manual is to give a handsome and practical guide on
how to set up and perform a successful Rietveld refinement with GSAS1 for the
very specific problem of the coordination compound Na-para-hydroxybenzoate.
This relatively complicated example was chosen because of the fact that many of
the features of GSAS must be used in order to get a good Rietveld refinement
done. These features include peak asymmetry due to axial divergence,
anisotropic peak broadening due to micro strain, 3-dimensional difference
Fourier maps, rigid bodies with satellite groups etc. The entire guide is written as
an exercise on Rietveld analysis for the VII. Workshop Powder Diffraction:
Structure Determination and Refinement from Powder Diffraction Data which is
organized by the Powder Diffraction Group of the German Society of
Crystallography DGK (October 4-8, 2000, Laboratory of Crystallography,
University of Bayreuth, Germany, http://www.uni-bayreuth.de/departments/crystal/workshop2000/).
The results of the crystal structure determination of Na-parahydroxybenzoate as well as part of the information on rigid bodies in powder
diffraction have already been published in the following papers:
• Dinnebier, R. E., Rigid Bodies in Powder Diffraction: A Practical Guide,
1999, Powder Diffraction 14, 84-92.
• Dinnebier, R. E. Von Dreele, R., Stephens, P. W., Jelonek, S. & Sieler, J.,
Structure of Sodium-para-hydroxybenzoate NaO2C-C6H4OH by Powder
Diffraction: Application of an Phenomenological Model of Anisotropic Peak
Width, 1999, J. Appl. Cryst 32, 761–769.
Permission has been granted from the Journal of Applied Crystallography
as well as from Powder Diffraction to reproduce parts of these papers in this
manual.
For more information about the program system we recommend reading
the user’s manual of GSAS which is part of the GSAS program package. This
short tutorial contains only the minimum input that is necessary to solve the
problem given above.
Although great care has been taken in preparing this script, no guarantee
can be given about its correctness or its usability with future versions of the
GSAS program system. If you have any comments, suggestions, bug reports etc.
regarding this script, please contact the author at robert.dinnebier@unibayreuth.de.
1
General Structure Analysis System, R. B. Von Dreele and A. C. Larson, © Regents of
the University of California, 1995
Acknowledgement
I am in particular grateful to Robert Von Dreele (LANL), Peter Stephens
(SUNY at Stony Brook) and Sander van Smaalen (U Bayreuth) for helpful
discussions and contributions to this guide. Research carried out in part at the
National Synchrotron Light Source at Brookhaven National Laboratory, which is
supported by the U.S. Department of Energy, Division of Materials Sciences and
Division of Chemical Sciences. The SUNY X3 beamline at NSLS is supported
by the Division of Basic Energy Sciences of the U.S. Department of Energy
under grant DE-FG02-86ER45231. Research at the University of Leipzig was
supported in part by the Deutsche Forschungsgemeinschaft and the Fond der
Chemischen Industrie in Germany. Work at Stony Brook was partially supported
by the National Science Foundation under grant DMR 95-01325. Support by the
Deutsche Forschungsgemeinschaft (Di 687/2-1) is gratefully acknowledged.
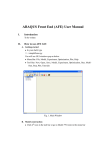
Contents
1
INTRODUCTION TO THE CRYSTALLOGRAPHIC PROBLEM ................3
2
POWDER X-RAY DIFFRACTION EXPERIMENTS .......................................5
3
PROGRAM FILES NEEDED ...............................................................................8
3.1 THE GSAS PROGRAM SYSTEM ...............................................................................8
3.2 THE VRML VIEWER PROGRAM ..............................................................................8
3.3 THE MATHCAD EXPLORER .....................................................................................8
4
INPUT FILES NEEDED ........................................................................................9
4.1
4.2
4.3
4.4
4.5
4.6
NABENZO.GDA: MEASURED INTENSITIES ..........................................................9
NABENZO.BG: MANUAL BACKGROUND. ..........................................................10
X3B1.PAR: INSTRUMENT PARAMETER FILE ........................................................10
NABENZO.ATO: LIST OF ATOMS ......................................................................11
NABENZO.MCD: MATHCAD FILE .....................................................................11
NABENZO.EXP: EXPERIMENT DATA FILE .........................................................11
5
GENERAL PRINCIPLES OF GSAS..................................................................12
6
THE LEBAIL FIT ................................................................................................13
6.1 PREPARING A NEW EXPERIMENT FILE IN GSAS ....................................................13
6.1.1 Powder data preparation ............................................................................14
6.1.2 Least squares refinement set up ..................................................................19
6.2 RUN POWDER DATA PREPARATION .......................................................................21
6.3 RUN GENERAL LEAST SQUARES ............................................................................22
6.4 REFINING ADDITIONAL PROFILE PARAMETERS......................................................22
6.5 REFINING THE ZERO SHIFT ....................................................................................23
6.6 PLOTTING OF THE REFINED POWDER DIFFRACTION DATA .....................................23
6.7 WAVELENGTH SHIFT ............................................................................................25
6.8 ANISOTROPIC PEAK BROADENING DUE TO MICRO STRAIN .....................................26
6.9 EXTRACTING INTENSITIES FOR CRYSTAL STRUCTURE DETERMINATION ................29
7
THE RIETVELD FIT...........................................................................................31
7.1 REFINING THE SCALE FACTOR ONLY .....................................................................31
7.2 INTRODUCING ADDITIONAL ATOMS ......................................................................32
7.3 FIXING THE FLOATING ORIGIN ..............................................................................34
7.4 WHAT TO DO IN CASE OF DIVERGENCE OF THE REFINEMENT.................................35
7.5 HOW TO USE RIGID BODIES WITH SATELLITE GROUPS IN GSAS ............................36
7.5.1 Introduction.................................................................................................36
7.5.2 Definition of a rigid body............................................................................37
7.5.3 How to set up a rigid body ..........................................................................39
2
1 Introduction to the crystallographic problem
7.5.4
7.5.5
7.5.6
7.5.7
7.5.8
7.5.9
7.6
7.7
7.8
7.9
Defining the rigid body of para-hydroxybenzoate...................................... 40
Finding the starting parameters for the rigid body.................................... 41
Introducing the rigid body into GSAS ........................................................ 42
Refining the position and orientation of the rigid bodies........................... 45
Refining an overall temperature factor of the rigid body........................... 47
Refinement of the bond lengths and the satellite group rotation
of the rigid body.......................................................................................... 49
HOW TO PERFORM A DIFFERENCE FOURIER ANALYSIS ......................................... 51
REFINING THE POSITION OF THE MISSING HYDROXY-HYDROGEN ATOM ............... 60
CALCULATE THE R-F AND R-F2 VALUES OF THE REFINEMENT. ........................... 61
SWITCHING TO SOFT CONSTRAINTS ...................................................................... 61
8
DESCRIPTION OF THE STRUCTURE OF NA-PARAHYDROXYBENZOATE ............................................................................................. 67
8.1 CALCULATE THE BOND LENGTHS AND ANGLES OF THE REFINED STRUCTURE ....... 67
8.2 RESULTS AND DISCUSSION OF THE CRYSTAL STRUCTURE OF NA-PARAHYDROXYBENZOATE ............................................................................................ 68
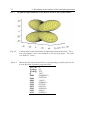
8.3 VISUALIZATION OF THE ANISOTROPIC STRAIN TENSOR ........................................ 71
8.3.1 Input of Laue group, monoclinic axis and lattice parameters.................... 71
8.3.2 Input of lattice parameters ......................................................................... 71
8.3.3 Input of the anisotropic strain coefficients Shkl........................................... 72
8.3.4 Definition of the metric tensor and the crystal !
cartesian transformation matrix................................................................. 72
8.3.5 Calculation of the hkl depenent microstrain broadening........................... 73
8.3.6 Calculation of the three dimensional representation of the anisotropic
micro strain................................................................................................. 73
8.3.7 Graphical representation of the micro strain in the crystal lattice............ 74
9
REFERENCES ..................................................................................................... 75
GSAS practical guide
1
3
Introduction to the crystallographic problem
The carboxylation of sodium phenolate, known as Kolbe-Schmitt
synthesis (Kolbe, 1874), leads to two main reaction products: sodium-orthohydroxybenzoate, also known as sodium salicylate, and sodium-parahydroxybenzoate. The reaction is still one of the most important industrial solidstate reactions, with many applications in the synthesis of pigments, fertilizers
and pharmaceuticals like aspirin (Behr, 1985, Brockhaus ABC Chemie, 1971).
Although the reaction has been known since the middle of the last century (Kolbe
& Lautemann, 1860), and despite its importance, its mechanism and the crystal
structures of its products are still unknown. Many models for the reaction
mechanism have been published (Hales, Jones, Lindsey, 1954). The types and the
amounts of the reaction products are strongly influenced by the reaction
conditions of temperature, pressure, time, type of the alkali cation, and solvent
(e.g. Lindsey & Jeskey, 1957 and references therein). Under typical reaction
conditions (120°C, 5 atm), the carboxylation of dry sodium phenolate leads to an
almost quantitative yield of sodium salicylate (Lindsey & Jeskey, 1957). An
increase in the production of sodium para-hydroxybenzoate can be achieved by
low temperatures or by the chelation of sodium phenoxide with polyethers
(Sakakibara & Haraguchi, 1980).
We have begun a major investigation to solve the crystal structures of the
substances related to Kolbe-Schmitt type reactions in order to get more insight in
its mechanism. The structures of the reactants have recently been solved using
single crystal and high-resolution x-ray powder diffraction (Dinnebier, Pink,
Sieler & Stephens, 1997). Here the crystal structure refinement of sodium parahydroxybenzoate from high-resolution x-ray powder diffraction data is described
in detail. Since this compound is a possible intermediate or product of the KolbeSchmitt synthesis, its structure is of particular interest for future in situ
investigations with temperature and time resolved powder diffraction.
Since the early work of Hugo Rietveld at the end of the 60’s (Rietveld,
1969), structure refinement and also structure determination from powder data
became more and more important (e.g. Harris & Tremayne, 1996; Langford, &
Louër, 1996; Masciocchi & Sironi, 1997; Poojary & Clearfield, 1997). One
major obstacle in the development of this method was that the reflection line
shape obtained by x-ray powder diffraction is much more complicated than in the
case of neutron diffraction, and it took many years before a generally applicable
and physical meaningful description was found. Important contributions have
been the parameterization of the Voigt-function (Thompson, Cox & Hastings,
1987) and the description of the asymmetry due to axial divergence (Finger, Cox
& Jephcoat, 1994). Nowadays, it is often possible to describe the entire profile of
4
1 Introduction to the crystallographic problem
a synchrotron powder pattern with only four adjustable parameters. On the other
hand, the especially high resolution of synchrotron radiation revealed another
problem which hinders a satisfactory description of the peak profile of real
powders: the fact that for many samples, the diffraction peak width is not a
smooth function of diffraction angle. Most of the available Rietveld programs
produce unacceptable fits when presented with this anisotropic broadening (in
the three-dimensional diffraction space); see Le Bail (1992) for a useful review
of previous attempts. These treatments offer different numbers of additional
adjustable profile parameters, but often lack a connection with any plausible
microscopic source of anisotropic broadening, and frequently do not even obey
the conditions imposed by crystallographic symmetry.
The title compound shows severe anisotropic broadening which could not
be modeled by any of the hitherto available algorithms. This motivated one of us
(Stephens, 1999) to develop an empirical model of anisotropic broadening due to
correlated variations in lattice metric parameters, which extends and corrects
previous work by Thompson, Reilly, & Hastings (1987) and Rodriguez-Carvajal,
Fernandez-Diaz, and Martinez. (1991). This has been implemented in the
program GSAS (Larson and Von Dreele, 1994) used in the present work to refine
the structure. Popa (1998) has independently published a similar model, but
without an explicit experimental realization. There has been some progress in
providing a microscopic interpretation of this model (Ungar & Tichy, 1998), but
so far its main value is in improving the ability of a calculated line shape to
match experimental data, thereby increasing the reliability of a Rietveld
refinement. In the present case, this improvement was sufficiently dramatic that
the data could be used to locate the position of the hydrogen atom of the phenol
hydroxy group by difference Fourier analysis from powder data. This hydrogen
atom position was then subsequently included in the Rietveld refinement of the
structure.
GSAS practical guide
2
5
Powder X-ray diffraction experiments
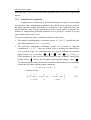
For the X-ray powder diffraction experiments, the sample of sodium-parahydroxybenzoate was sealed in a glass capillary of 0.7 mm diameter. Highresolution powder diffraction data were collected at the SUNY X3B1 beamline at
the National Synchrotron Light Source, Brookhaven National Laboratory. X-rays
of wavelength 1.14750(2) Å were selected by a double Si(111) monochromator.
Wavelengths and the zero point have been determined from eight well-defined
reflections of the NBS1976 flat plate alumina standard. The diffracted beam was
analyzed with a Ge(111) crystal and detected with a Na(Tl)I scintillation counter
with a pulse height discriminator in the counting chain. The incoming beam was
monitored by an ion-chamber for normalization for the decay of the primary
beam. In this parallel beam configuration, the resolution is determined by the
analyzer crystal instead of by slits. Data were taken at room temperature for 4.3
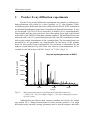
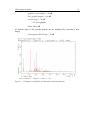
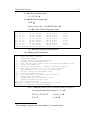
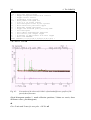
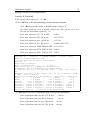
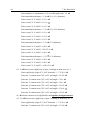
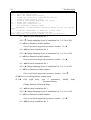
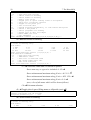
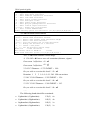
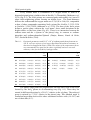
seconds at each 2Θ in steps of 0.005° from 3° to 73.195° (Fig. 2.1).
Na-para-hydroxybenzoate at 295 K
60000
Intensity [Counts]
50000
x10
40000
30000
20000
10000
0
20.00
Fig. 2.1:
40.00
2Θ [°]
60.00
Measured powder pattern of sodium-para-hydroxybenzoate at λ=
1.14937(1) Å. The part at higher angles (> 30° 2θ) is enlarged by a factor
of 10 for clarity.
Although Θ-scans did not show serious crystallite size effects, the sample
was rocked for 5° during measurement for better particle statistics. Low angle
diffraction peaks showed a strong asymmetry due to axial divergence and had a
6
2 Powder X-ray diffraction experiments
full width at half maximum of 0.012°2Θ that is close to the resolution of the
spectrometer.
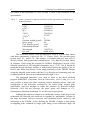
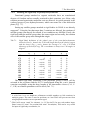
Tab. 2.1
Lattice parameters and selected details of the experiment of sodium-parahydroxybenzoate.
a [Å]
b [Å]
c [Å]
β[°]
V[Å3]
V/Z[Å3]
Z
Formula weight [g/mol]
Space group
Calc. density [g/cm3]
Polarization fraction
Wavelength
S/L, H/L
16.0608(3)
5.38291(9)
3.63834(7)
92.8692(5)
314.153(9)
157.077
2
320.208
P2 1
1.693
0.95
1.14975(2)
0.008, 0.015
The diffraction pattern could be indexed on basis of a monoclinic lattice
with lattice parameters of given in Tab. 2.1 (Visser, 1969). The possible space
groups were P2 1 and P 21 / m . The number of formula units per unit cell (Z)
directly follows from geometrical considerations. A Le Bail fit (Le Bail, Duroy
& Fourquet, 1988) using the program FULLPROF (Rodríguez-Carvajal, 1990)
allowed extraction of 416 integrated intensities up to 72.91° 2Θ. It should be
noted that despite the large number of well-resolved peaks, the quality of the Le
Bail fit was rather bad because of the strong anisotropy of the FWHM. Despite
using the uniaxial strain model with the (110) direction as broadening axis, the
weighted profile R-factor was an unsatisfactorily high 23.9%.
The integrated intensities were used as input to the direct methods
program SIRPOW92 (Cascarano, Favia & Giacovazzo, 1992). Using P 21 / m , it
was possible to detect the entire molecule without hydrogen atoms. Since the
arrangement of the molecules restricted by the mirror plane seemed quite
unfavorable, and first attempts to refine the structure by Rietveld analysis
(Rietveld, 1969) did not converge, the space group was changed to P2 1 .
Subsequent refinements confirmed P2 1 as the correct space group.
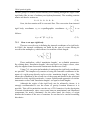
Although the structure seemed to be chemically correct at this stage of the
refinement, the Rietveld plot could not be regarded as ‘publishable’ because of
the large deviations between observed and calculated profile caused by the
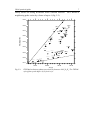
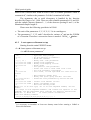
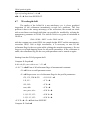
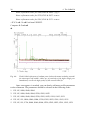
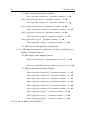
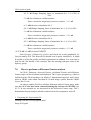
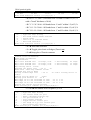
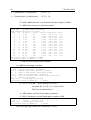
anisotropy in the FWHM. A plot showing the FWHM of single or only partly
overlapping peaks obtained by single peak fitting versus diffraction angle 2Θ
GSAS practical guide
7
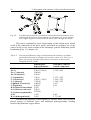
clearly shows the strong deviations from a smooth function. The FWHM of
neighboring peaks varies by a factor of up to 4 (Fig. 2.2).
0.09
(61-1)
0.08
(411)
(3 1 1 )
0.07
(521)
(70-1)
(71-1)
(22-1)
(601) (421)
(51-1)
(42-1)
(620)
(701)
(221)
(32-1)
FWHM[°2Θ]
0.06
( 2 (12 -11 1) )
( 13 10 1 )
0.05
(511)
(021)
(( 01 11 1- 1) )
( 1( 10 0- 11 ))
(130)
0.04
(0 0 1 )
(811)
(430)
(520)
( 3 2 0 (420)
)
(710) (810)
( 2 2 0(610)
)
(5 1 0 )
0.03
(4 1 0 )
0.02
(5 0 0 )
(1 0 0 )
(2 0 0 )
(6 0 0 )
(1 2 0 )
(700)
(2 1 0 )
(1 1 0 )
(3 0 0 )
(4 0 0 )
0.01
10.00
Fig. 2.2:
20.00
2Θ [°]
30.00
40.00
FWHM distribution sodium-para-hydroxybenzoate NaC7O3H5. The FWHM
of neighbor peaks differs by a factor of 4.
8
3
3 Program files needed
Program files needed
For the present problem, three different public domain programs are used
which can be downloaded from the world wide web. Although some of the
programs (including GSAS) are available for different computer platforms, this
manual is optimized for Microsoft Windows 95/98/NT (Trademark).
3.1
The GSAS program system
The PC-version of GSAS runs under a DOS Window and can be found at:
ftp://ftp.lanl.gov/public/gsas/ms-dos
Download the files GSASKIT.EXE and README.TXT and follow the
instructions therein. It is recommended to download also the GSAS manual in
PDF format at:
ftp://ftp.lanl.gov/public/gsas/manual
3.2
The VRML viewer program
There are several VRML viewer programs freely available (e.g. VRWEB).
VRWEB can be downloaded at
ftp://ftp.lanl.gov/public/gsas/ms-dos
Download the self-executable file VRWEB.EXE and follow the
instructions. The original download site is:
ftp://ftp.iicm.edu/pub/VRweb (and at many more sites all over the world)
3.3
The Mathcad Explorer
The 3-dimensional anisotropic lattice strain can be calculated and viewed
with the aid of a Mathcad script. A suitable viewer from Mathsoft Inc.
(Trademark) can be downloaded free of charge at
http://www.mathsoft.com/mathcad/explorer/
Download the self-extracting file mcexp802.exe and follow the
instructions on the screen.
GSAS practical guide
4
9
Input files needed
Five files in ASCII format and one file in Mathcad format (see 4.1 to 4.6)
are needed to process the present problem, one of them (see 4.6) will be created
from scratch during the exercise. The files and the newest version of this manual
can be found in zipped format at:
http://www.uni-bayreuth/departments/crystal/rietveld/
Download the file Rietveld.zip and extract it using the Winzip (or similar
program).
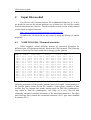
4.1
NABENZO.GDA: Measured intensities
GSAS supports several different formats for measured intensities for
different types of experiments that are listed in the GSAS manual. The following
format is useful for fixed step width, fixed energy powder patterns.
Na-p-hydroxybenzoate, X3B1
BANK 1 14039
2808 CONST
300.00
0.50 0 0 ESD
690.3 22.6 710.9 22.9 693.2 22.6 668.1 22.2 657.7
716.1 23.0 739.9 23.4 678.8 22.4 672.1 22.3 700.3
743.6 23.4 682.5 22.4 671.6 22.3 694.6 22.6 684.2
658.4 22.0 671.4 21.8 690.6 22.2 713.1 21.9 667.5
692.5 22.6 712.3 22.9 671.0 22.3 685.0 22.5 661.3
710.2 23.0 716.6 23.0 671.9 22.3 683.9 22.5 687.2
659.8 22.1 670.5 22.3 671.7 22.4 656.8 22.1 684.4
662.0 22.2 707.3 22.9 662.6 22.2 696.5 22.7 657.1
685.3 22.6 681.0 22.5 711.2 23.0 658.6 22.1 675.6
653.3 22.0 643.0 21.9 629.4 21.6 707.5 22.9 651.3
686.0 22.6 678.7 22.5 629.7 21.6 674.3 22.4 666.1
600.7 21.1 643.8 21.9 665.4 22.2 679.3 22.5 667.5
682.8 22.5 660.1 22.1 660.0 22.1 653.5 22.0 656.6
640.4 21.8 672.3 22.4 643.9 21.9 629.8 21.6 641.3
…
22.0
22.7
22.5
21.9
22.1
22.5
22.5
22.1
22.4
22.0
22.2
22.3
22.1
21.8
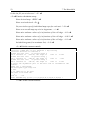
The first line contains the title in free format. The second line contains the
following parameters of the powder pattern (from left to right): Actual number of
the powder pattern (bank) in the file, number of data points, number of data
records, flag for constant step width, starting angle in °2Θ*100 (centidegrees),
step width in °2Θ*100 (centidegrees), two flags set to zero, flag for data
containing estimated standard deviations of the measured intensities. The third
and following lines contain the measured intensities (F8.1) plus their standard
deviations (F8.1).
10
4.2
4 Input files needed
NABENZO.BG: Manual background.
Although there is a large number of background modeling functions
available in GSAS it is advisable, especially at the beginning of a LeBail/
Rietveld refinement to use a subtracted background from manually determined
background points. A convenient program to create a GSAS macro file
consisting of manually set background points is e.g. GUFI (Dinnebier, 1993).
i
i
i
i
i
i
i
i
…
3.020
3.436
4.884
5.955
6.748
8.474
9.565
9.942
697.93
620.99
438.78
365.89
333.50
280.86
268.71
268.71
26.42
24.92
20.95
19.13
18.26
16.76
16.39
16.39
This is an example for the use of Macro files. The lines contains the
following parameters (from left to right): “i” = insert this data point; position of
the background point in °2Θ, intensity of the background point, estimated
standard deviation of the background intensity. The latter is usually determined
(something missing here)
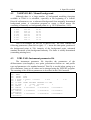
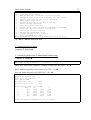
4.3
X3B1.PAR: Instrument parameter file
The instrument parameter file describes the parameters of the
diffractometer (wavelength(s), zero point, polarization fraction etc. and profile
type and parameters of a standard material. This file is needed when setting up a
new refinement. Later on, all values can be changed using the EXPEDT program.
The meaning of the different parameters is described in the GSAS manual.
123456789012345678901234567890123456789012345678901234567890
INS
BANK
1
INS
DTYPE
STND
INS
HTYPE
PXCR
INS 1 ICONS 1.148917 0.000000
0.004
0
0.97
INS 1 IRAD
0
INS 1I HEAD DUMMY INCIDENT SPECTRUM for X3B1
INS 1I ITYP
0
0.0000 150.0000
1
INS 1PRCF1
2
12
0.002
INS 1PRCF11
6.427000E+00 -1.067000E+00
0.000000E+00
0.610200E+00
INS 1PRCF12
0.679600E+00
0.000000E+00
0.673300E+00
0.000000E+00
INS 1PRCF13
0.000000E+00
0.000000E+00
0.000000E+00
0.000000E+00
GSAS practical guide
4.4
11
NABENZO.ATO: List of atoms
For every atom in a rigid body, there must be an entry in the atom list of
GSAS. It is therefore convenient to use the macro option (as for the manually
determined background) to insert large number of dummy atoms.
i
i
i
i
i
i
i
i
…
n
n
n
n
n
n
n
n
C
C
C
C
C
C
C
C
0.0
0.0
0.0
0.0
0.0
0.0
0.0
0.0
0.0
0.0
0.0
0.0
0.0
0.0
0.0
0.0
0.0
0.0
0.0
0.0
0.0
0.0
0.0
0.0
1.0
1.0
1.0
1.0
1.0
1.0
1.0
1.0
C1
C2
C3
C4
C5
C6
C7
C8
i
i
i
i
i
i
i
i
0.025
0.025
0.025
0.025
0.025
0.025
0.025
0.025
This is an example for the use of Macro files. The lines contains the
following parameters (from left to right): “i n” = insert the next atom in the atom
list; type of atom, fractional coordinates; fractional occupancy; name of the atom,
“i” flag for isotropic temperature, isotropic temperature factor u.
4.5
NABENZO.MCD: Mathcad file
This Mathcad script allows the three dimensional representation of the
anisotropic strain which can be derived from the refinement of the anisotropic
half width in the GSAS program (see chapter 8.3).
4.6
NABENZO.EXP: Experiment data file
The experiment data file contains all the information for a LeBail/
Rietveld refinement. It will be created from scratch in the following chapters.
Only very experienced users should edit this file manually.
12
5
5 General principles of GSAS
General principles of GSAS
It is quite useful to remember the following general properties/ features of
GSAS:
• GSAS is strictly menu-oriented and more or less self-explanatory.
↵
• Within a menu all options will be listed in detail by pressing ↵ or ?↵
• Press X to exit to the higher menu.
• Press Q to quit programs in the shell (i.e. Powplot).
• Press / to keep the actual input (will not always work).
• The input is not case sensitive (except were explicitly noted).
• Press L to list available options or inputs. If the bottom of the page is reached,
GSAS will prompt.
• The default answer is often surrounded by <> and will be activated by
pressing ↵
• GSAS creates a list file that contains a lot of useful information. It can be
edited using an ASCII editor (one editor is included in the GSAS distribution
kit). If the file is too big for the editor, delete it and rerun the last refinement.
• All input in the EXPEDT program can be recorded in Macro files (ASCII
format). This feature is particularly convenient for reading in the manual
background and the list of atoms. To read in a macro, type @R↵. The
program then will ask you for the name of the macro file.
• It is possible to combine several inputs in a line separated by at least one space
character (e.g. L O P L ↵ to reach the profile parameters in the Expedt
program).
• GSAS uses fixed ASCII format files except for the macro files that are in free
ASCII format. Files which have been edited manually and which now contain
lines with lengths unequal to 80 characters, can be converted by Setup !
Convert.
GSAS practical guide
6
13
The LeBail fit
At the beginning of a crystal structure refinement, it is useful to refine
profile and lattice parameters separately without having a structural model, a so
called LeBail fit (LeBail, , 1988)need reference. When switching to Rietveld
analysis, profile and lattice parameters can then be kept at their refined values. A
clear separation between the powder profile, the background and the crystal
structure makes refinements much easier.
The following chapter explains how to create a new parameter file for
LeBail- and Rietveld refinement in GSAS.
6.1
Preparing a new experiment file in GSAS
To create a new experimental data file from scratch, GSAS needs
information about the powder pattern (powder data preparation, chapter 6.1.1)
and about the least squares refinement procedure (least squares refinement set up,
chapter 6.1.2).
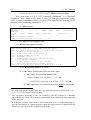
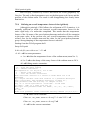
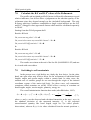
Fig. 6.1:
Windows shell of GSAS after selecting an experiment name. The appearance
of the GSAS program shell might differ considerably.
GSAS ↵ (Calls the GSAS program shell)
Setup ! Set/Change Name of Experiment
<NABENZO> ↵
14
6 The LeBail fit
6.1.1
Powder data preparation
Setup ! Expedt
Do you wish to create it ? <Y> ↵
Title <Workshop on Powder Diffraction> ↵
EXPEDT
<?> D
K n P
R
S
X
EXPEDT
data setup options:
Type this help listing
Distance/angle calculation set up
Delete all but the last n history records
Powder data preparation
Review data in the experiment file
Single crystal data preparation
Exit from EXPEDT
data setup option (<?>,D,K,P,R,S,X) >
<P> ↵ Powder Data Preparation
The available powder data preparation options are:
<?> - Type this help listing
P
- Phases - lattice & sp. Group
T
- Change the experiment title
X
- Return to the main EXPEDT menu
You have no phase information
Select editing option for Powder data preparation (<?>,P,T,X) >
<T> ↵ Change experiment title
<L> ↵ List current information
<X> ↵ List current information
<P> ↵ Phases- Lattice & space groups
<I> ↵ Insert new phase
phase name <Na-para-hydroxybenzoate> ↵
space group <P 21> ↵
a, b,c and β <16.061 5.383 3.638 92.87> ↵
<X> ↵ Exit to Expedt main menu
<H> ↵ Select and prepare histograms.
<I> ↵ Insert a new histogram.
name: <NABENZO.GDA>↵
file correct ? <Y>↵
parameter file name: <X3B1.PAR>↵
scan number: <1>↵
preview ? <Y>↵
GSAS practical guide
15
graphic screen output ? <A>↵
save graphic output ? <N>↵
set plot rage ? <N>↵
<X> Exit graphic.
Xmin, Xmax: ↵
(if desired, parts of the powder pattern can de displayed by selecting a new
range)
is histogram OK to keep ? <Y>↵
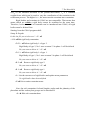
Fig. 6.2:
Complete raw data file of sodium-para-hydroxybenzoate.
16
6 The LeBail fit
Histogram editing commands:
<?> - Type this help listing
A
- Edit sample orientation angles
B
- Edit fixed background
C
- Edit the data compression factor
D
- Set minimum d-spacing - REQUIRED for new histograms
E
- Edit excluded regions
F
- Set phase flags for this histogram
I
- Edit instrumental constants
L
- List histogram title
M
- Modify incident spectrum source
P
- Plot histogram
S
- Edit the data sampling factor
T
- Set max 2-Theta or Energy or min TOF (equivalent to D option)
W
- Edit profile params.
X
- Exit from editing this histogram
Enter histogram data modification command
(<?>,A,B,C,D,E,F,I,L,M,P,S,T,W,X) >
<I> ↵ Edit instrumental constants.
Diffractometer constant editing commands:
<?> - Type this help listing
$
- Enter DCL command
C
- Change a diffractometer constant
D n - Enter refinement damping factor "n" (n = 0 to 9)
The applied shift is (10-n)*10% of the computed shift, n = 0 for full
shift
H m - Select histogram "m"
K d - Set constraints on diffractometer constant "d"
L
- List the diffractometer constants
N
- Select next powder histogram
R
- Reset diffractometer constants
V
- Set the refinement flags
X
- Exit to overall parameter menu
These constants are: LAM, POLA & ZERO
CAUTION - IF LAM IS CHANGED POWPREF SHOULD BE RERUN
Give diffractometer constant editing command (<?>,$,C,D,H,K,L,N,R,V,X)
>
<C> ↵
<LAM> ↵
<1.14937> ↵
<C> ↵
<POLA> ↵
<0.95> ↵
<C> ↵
<ZERO> ↵
<0.00> ↵
<C> ↵
<IPOL>1 ↵
<0> ↵
<X> ↵ Exit to overall parameter menu
<T> ↵ Set max 2-Theta or Energy or min TOF (equiv. to D option).
Enter new maximum 2-theta in deg. <73.148> ↵
1
(IPOL= 0 selects P =
POLA + (1 − POLA) cos 2 (2Θ )
as the polarization function)
2
GSAS practical guide
17
<E> ↵ Edit excluded regions.
<c 1 0.0 3.0> ↵
<B> ↵ Edit fixed background
<@R> ↵
name of macro file: <NABENZO.BG> ↵
<L> ↵ List the fixed background points.
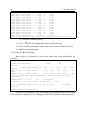
…
No.: 51 at:
44.391 value:
329.45 error:
No.: 52 at:
49.687 value:
313.25 error:
No.: 53 at:
51.537 value:
313.25 error:
No.: 54 at:
56.198 value:
325.40 error:
No.: 55 at:
62.386 value:
321.35 error:
No.: 56 at:
66.690 value:
305.15 error:
No.: 57 at:
69.427 value:
284.91 error:
No.: 58 at:
73.175 value:
256.56 error:
Fixed background editing options - (<?>,C,D,I,L,X) >
18.15
17.70
17.70
18.04
17.93
17.47
16.88
16.02
<X> ↵ Exit to histogram editing menu.
<W> ↵ Edit profile parameters.
Profile editing options:
<?> - Type this help listing
$
- Enter DCL command
A
- Change anisotropic broadening axis
C
- Change profile parameter values
L
- List the current profile values and their refinement flags
P n - Select new phase "n"
R n - Reset profile coeffs. to default values for type "n"
D a - Set damping factor (0-9) for all profile coeffs.
Applied shifts are (10-a)*10% of calcd. Shift
G
- Global setting of refinement flags
H m - Select new histogram "m"
K p - Set constraints on profile coefficient "p"
N
- Select next histogram
V
- Request new set of refinement flags
W
- Change the peak cut-off value
X
- Exit from this mode
WARNING--- Changes in profile parameters or cutoff
should be followed by rerunning POWPREF
<R 3>2 ↵ Reset profile coeffs. to default values for type "n"
Do you still want them replaced ? <Y> ↵
2
GU, GV, GW & GP:
< 0 0 0 0.1> ↵
LX, LY:
<1 10> ↵
The meaning of profile function number 3 is explained later
18
6 The LeBail fit
S/L, H/L:
<0.008 0.015> ↵
trns, shft:
<0 0> ↵
stec, ptec, sfec:
<0 0 0> ↵
L11, L22, L33:
<0 0 0> ↵
L12, L13, L23:
<0 0 0> ↵
<W 0.2> ↵ change the peak cut-off value
<L> ↵ List the current profile values
<X> ↵ exit from this mode.
<X> ↵ Exit form editing this histogram.
<X> ↵ Return to previous menu.
<X> ↵ Return to the main EXPEDT menu.
Profile editing options - (<?>,$,A,C,D,G,H,K,L,N,P,R,V,W,X) >l
Histogram no.
1 Bank no. 1 Lambda1,lambda2 = 1.14750 .00000
Title: Na-p-hydroxybenzoate, X3B1
**** Histogram will be used in least-squares
Phase no. 1
Phase name: Na benzoate
Aniso. broadening axis
0.
0.
1. Damp 0
Peak profile type no. 3 Number of coefficients: 19
Pseudovoigt profile coefficients as parameterized in P. Thompson, D.E.
Cox & J.B. Hastings (1987). J. Appl. Cryst.,20,79-83.
Asymmetry correction of L.W. Finger, D.E. Cox & A. P. Jephcoat (1994).
J. Appl. Cryst.,27,892-900.
#1(GU)
=
.0 N #2(GV)
=
.0 N #3(GW)
=
.0 N
#4(GP)
=
.2 Y #5(LX)
=
.000 Y #6(LY)
=
15.316 Y
#7(S/L) =
.0087 N #8(H/L) =
.0146 N
#9(trns) =
-12.08 N #10(shft)=
.0000 N
#11(stec)=
.00 N #12(ptec)=
.00 N #13(sfec)=
.00 N
#14(L11) =
.000 N #15(L22) =
.000 N #16(L33) =
.000 N
#17(L12) =
.000 N #18(L13) =
.000 N #19(L23) =
.000 N
Cut-off for peaks is
.50 percent of the peak maximum
The profile function No. 3 refers to the modified Thomson-Cox-HastingsPseudo-Voigt profile function (Thompson, Cox & Hastings, 1987). For this
function, the full width at half maximium (FWHM) in dependence of the
scattering angle 2Θ is defined separately for the Gaussian part
ΓG = U tan 2 Θ + V tan Θ + W +
P
cos 2 Θ
(6.1)
and for the Lorentzian part
ΓL (Θ ) = X tan Θ + Y / cos Θ .
(6.2)
Except for the term P, formula 5.1 is equivalent to the well known
Cagliotti formula (Cagliotti, Paoletti & Ricci, 1958). The additional term P was
GSAS practical guide
19
added to the Gaussian half width in order to have a refinable parameter which is
constant in d*, similar to the parameter Y of the Lorentzian half width.
The asymmetry due to axial divergence is handled by the function
described by Finger et al., 1994. There are two refinable parameters S/L and H/L
with the sample detector distance L, ½ of the detector opening H and ½ of the
illuminated sample length S.
Please note the following specialties in GSAS:
• The unit of the parameters U, V, W, P, X, Y is in centidegrees.
• The parameters U, V, W, and P describe the variance σ2 and not the FWHM
of a Gaussian. Therefore a conversion factor is needed: FWHM G = 8 ln 2σ 2 .
6.1.2
Least squares refinement set up
Starting from the main EXPEDT menu:
<L> ↵ Least squares refinement set up.
<A> ↵ Edit atom parameters3.
Atom editing commands:
<?>
- Type this help package
x <?>
- To give details on command x
$
- Enter DCL command
+,-,*, or /
- Modify num. atom parameters
C t/s/s1:s2 codes - Change atom parameters
D t/s/s1:s2 codes - Modify atom damping factors
E t/s/s1:s2
- Erase atoms
F
- Fix specific atom parameters
I s
- Insert one atom or read atoms from a file
K
- Set atom parameter constraints
L t/s/s1:s2
- List atoms, if none specified all atoms will be
listed
M
- Edit magnetic moment data
S
- Modify the space group and unit cell data
T t/s/s1:s2 M V
- Transform atom parameters by matrix "M" and
vector "V"
U t/s/s1:s2 codes - Convert atom thermal factors
V t/s/s1:s2 codes - Modify refinement flags
X
- Exit from editing atoms
Where "t" is an atom type, "s" is an atom sequence number, "s1:s2"
refers
to a range of atom sequence numbers, and "codes" are specific to the
command; see the individual help listings for specific instructions
Phase No. 1; Phase has
16 atoms; Title: Na benzoate
Give atom editing command
(<?>,$,C,D,E,F,I,K,L,M,S,T,U,V,X,+,-,*,/) >
3
It is necessary to introduce at least one dummy atom before starting a LeBail or
Rietveld refinement.
20
6 The LeBail fit
<I N Na 0.1 0.25 0.37 1.0 NA1 I 0.025> ↵ insert the next atom
(Na: atom type, 0.1 0.25 0.37: fractional coordinates4, 1.0: fractional
occupancy5, Na1: name of the atom, I: flag for isotropic temperature factor,
0.025: isotropic temperature factor u. If parts of the input line are missing, GSAS
prompts for the remaining parameters)
<L> ↵ List atoms
Phase No. 1; Phase has
1 atoms; Title: Na benzoate
SER TYPE
X
Y
Z
FRAC
NAME
UISO
CODE
MULT FXU
1 NA
.10000 .25000 .37000 1.00000 NA1
.03392 I XU
2 000
Give atom editing command
(<?>,$,C,D,E,F,I,K,L,M,S,T,U,V,X,+,-,*,/) >
STSYM
1
<X> ↵ Exit from editing atoms.
<L> ↵ Edit least squares controls.
Maximum number of cycles is
5
Print option flag is
256; edit with "P" option
Enter L-S control editing option (<?>,A,B,C,D,E,J,L,P,X) >
A a - Maximum atom position shift
B b - Matrix band width (0 full matrix)
C n - Maximum number of cycles
D d - Marquardt factor
E
- Change powder data Fobs extraction flags
L
- List current settings
P
- Select options for the output listing
X
- Exit from editing least squares controls
Enter L-S control editing option (<?>,A,B,C,D,E,J,L,P,X) >
<C 5> ↵ maximum number of cycles
<E 1> ↵ Change powder data Fobs extraction flags
<C> ↵ Change Fo extraction method flags
Extract LeBail Fo's for phase 1 ?: <Y> ↵
… start LeBail extraction with all Fo's=1.06 ?: <N> ↵
<E> ↵ Toggle main Fo extraction flag (Fo’s must be extracted).
4
It is important that the dummy atom lies on a general position (be careful with x= 0.1,
y= 0.2, z= 0.3 in tetragonal space groups)
5
The occupancy according to the site symmetry (Wycoff position) is calculated
automatically by GSAS. Site symmetry and multiplicity are displayed at the right side
of the atom list..
6
A LeBail fit in GSAS, either starts with all intensities set to 1.0 (equipartitioning) or
uses the information of a partial structure (from the present atom list) that affects the
behavior of convergence for overlapping reflections.
GSAS practical guide
21
<L> ↵ List the current Fo extraction flags.
Fo's will be extracted from this histogram
Experiment phase flags:
1
0
0
0
0
0
0
Histogram Fo extraction flags :
1
0
0
0
0
0
0
0 for Rietveld 1 for LeBail method 2 start all Fo=1.0
Damping factor for LeBail extraction:
0
(to be applied only to 1st cycle)
Fo extraction flag editing options - (<?>,C,D,E,H,L,N,X) >
0
0
0
0
<X> ↵ Exit to least squares control editing menu.
<X> ↵ Exit from editing least squares controls.
<O> ↵ Edit overall parameters.
<B> ↵ Background coefficients.
<C 2> ↵ Change backgr. function type to cosine Fourier series.
Enter number of background terms desired: <4> ↵
</> ↵ accept current values.
<V> ↵ Toggle background refinement flag (turn it off).
<X> ↵ Exit to overall parameter menu.
<H> ↵ Histogram scale factors.
<V> ↵ Toggle scale factor refinement flag (turn it off).
<X> ↵ Exit to overall parameter menu.
<L> ↵ Lattice parameters.
<V> ↵ Toggle lattice parameters refinement flag (turn it on).
<X> ↵ Exit to overall parameter menu.
<X> ↵ Exit from editing overall parameters.
<X> ↵ Exit to main EXPEDT menu.
<X> ↵ Exit from EXPEDT.
6.2
Run powder data preparation
After preparing all input files, some preliminary calculations like peak
positions etc. must be carried out first.
Starting from the GSAS program shell:
Compute ! Powpref ↵
22
6 The LeBail fit
↵
Please note, that after changing parameters which affect peak positions
(e.g. lattice or profile parameters), Powpref must be run again. If you rerun
Powpref during a LeBail fit, all peak intensities will be calculated from the
atomic positions or start from unity. In this case, the number of cycles in the least
squares menu should be set to 0 before the first least squares cycle.
6.3
Run general least squares
This is the first LeBail type of refinement, refining the lattice parameters
only.
Starting from the GSAS program shell:
Compute ! Genles ↵
↵
The actual number of processed step intensities and cycles as well as
different agreement factors showing the progress of the refinement are displayed
online.
6.4
Refining additional profile parameters
It is normally sufficient to refine the parameters GP, LX, LY and S/L in
case of high resolution synchrotron powder data. It might be necessary to use a
different overall damping factor for the profile parameters or to refine the
asymmetry parameter S/L in a separate run of EXPEDT.
Starting from the GSAS program shell:
Compute ! Expedt ↵
Is this the file you wish to use ? <Y> ↵
<L O P> ↵ Least squares refinement set up, overall parameters, profile
coefficients.
<V> ↵ Request new set of refinement flags.
GU, GV, GW & GP: < N N N Y> ↵
LX, LY:
<Y Y> ↵
S/L, H/L:
<Y N> ↵
trns, shft:
<N N> ↵
stec, ptec, sfec:
<N N N> ↵
GSAS practical guide
23
L11, L22, L33:
<N N N> ↵
L12, L13, L23:
<N N N> ↵
<D> ↵ Enter new profile coefficient damping factor (0 to 9) > 5 ↵
<X X X > ↵ <X> ↵ Exit from EXPEDT.
Compute ! Genles ↵
↵
6.5
Refining the zero shift
Now the overall zero shift should be refined even in the case of a well
aligned diffractometer.
Starting from the GSAS program shell:
Compute ! Expedt ↵
Is this the file you wish to use ? <Y> ↵
<L O C> ↵ LSQ refinement set up, edit overall parameters, diffract. constants.
<V> ↵ Set the refinement flags.
<Z> ↵
<L> ↵ List the diffractometer constants.
<X> ↵ Exit to overall parameter menu.
<X X X> ↵ <X> ↵ Exit from EXPEDT.
Compute ! Genles ↵
↵
6.6
Plotting of the refined powder diffraction data
In order to check the improvement of the refinement graphically, the
versatile plotting routine of GSAS can be used.
Starting from the GSAS program shell:
Graphics ! Powplot ↵
Enter graphic screen option ? <A> ↵
Do you want to save graphics outputs ? <N> ↵
↵
24
6 The LeBail fit
POWPLOT Commands:
<?> - Type this help listing
B
- Toggle background subtraction control
C
- Toggle cursor control
D
- Difference curve toggle
H n - Read powder histogram "n"
I
- I/Io or I on Y-axis toggle
L
- List histogram titles & plot options
M
- Mark reflection positions toggle
N
- Read next powder histogram
O
- Toggle the observed point plotting mode
P
- Plot histogram
R
- Plot radial distribution functions
S
- Set initial plot ranges toggle
T
- D-spacing or TOF/2-theta on X-axis toggle
X
- Exit from POWPLOT
Enter command (<?>,B,C,D,H,I,L,M,N,O,P,R,S,T,X) >
<H 1 M O T D P> ↵
Fig. 6.3:
Screenshot of the observed, LeBail- refined and difference profile of Napara-hydroxybenzoate.
(Read histogram number 1, mark reflection positions, 2-theta on x-axis, show
difference curve, plot histogram)
↵
Give X-min and X-max for next plot: <10 20> ↵
GSAS practical guide
25
Type of scaling desired: <A> ↵
↵ ↵ <X> ↵ Exit from POWPLOT.
6.7
Wavelength shift
The quality of the LeBail fit is not satisfactory yet. A closer graphical
inspection of the refinement immediately reveals two problems. The first
problem is due to the strong anisotropy of the reflections, the second one deals
with a non-linear wavelength shift that can possibly be modeled by refining the
transparency parameter in GSAS. The shift in 2Θ at every point in calculated in
GSAS as
∆ 2Θ = ZERO + SHFT ⋅ cos Θ + TRNS ⋅ sin 2Θ
(6.3)
with the constant zero point ZERO, the sample height SHFT and the transparency
correction TRNS. Due to high correlations, it is necessary to turn off the
refinement flag for the zero point while refining the sample transparency. Do not
forget to set a high damping factor for all profile parameters. If the refinement is
stable, the refinement flag for the zero point parameter can be turned on again.
Starting from the GSAS program shell:
Compute ! Expedt ↵
Is this the file you wish to use ? <Y> ↵
<L O C V> ↵ ↵ Turn of all refinement flags of instrumental constants.
<X> ↵ Exit to overall parameter menu.
<P > ↵ Request new set of refinement flags for the profile parameters.
GU, GV, GW & GP:
< N N N Y> ↵
LX, LY:
<Y Y> ↵
S/L, H/L:
<Y N> ↵
trns, shft:
<Y N> ↵
stec, ptec, sfec:
<N N N> ↵
L11, L22, L33:
<N N N> ↵
L12, L13, L23:
<N N N> ↵
<X X X> ↵ <X> ↵ Exit from EXPEDT.
Compute ! Genles↵
26
6 The LeBail fit
↵
6.8
Anisotropic peak broadening due to micro strain
The following model was used for the distribution of powder diffraction
peak widths. Each crystallite is regarded as having its own lattice parameters,
with a multi-dimensional distribution throughout the powder sample. The width
of each reflection can be expressed in terms of moments of this distribution,
which leads naturally to parameters that can be varied to achieve optimal fits.
Interested readers are referred to the paper by Stephens (1999) for further
description of the model and the derivation of the lineshape used here.
d*hkl is defined to be the inverse of the d-spacing of the (hkl) reflection.
Then d*2 is bilinear in the Miller indices, and so can be expanded in terms related
to the covariances of the distribution of lattice metrics. This leads to an
expression in which the variance of d*2 is a sum of 15 different combinations of
Miller indices in fourth order. Imposing the symmetry of the monoclinic lattice
(e.g., that reflections (hkl, hk l , h kl and h k l ) are equivalent) reduces the
number of independent terms to the following nine:
S 2 = S 400 h 4 + S 040 k 4 + S 004 l 4 + 3(S 220 h 2 k 2 + S 202 h 2 l 2 + S 022 k 2 l 2 )
+ 2(S 103 hl 3 + S 301 h 3 l) + 3S 121 hk 2 l
(6.4)
The anisotropic strain contribution to the angular width in 2Θ of the
reflection is given by
δ2Θ=(360°/π)(δd/d)tanΘ,
(6.5)
where
δd/d =
π S2
.
18000d *hkl
(6.6)
Here, the parameters SHKL are regarded as free parameters, to be chosen to
obtain the best fit between model and experiment. The anisotropic broadening
has both Gaussian and Lorentzian components, and it was found to be important
to include both in order to obtain an acceptable fit to the diffraction data.
Therefore another interpolation parameter ζ was introduced, so that the halfwidth at half maximum of the Lorentzian component is now given by
X + ζ δ2Θ,
(6.7)
and the variance of the Gaussian component of the lineshape is given by
(Utan 2Θ + VtanΘ + W + P/cosΘ + (1 − ς ) 2 δ 2Θ 2 )1/2
(6.8)
The profile function above is implemented in GSAS as profile function
No. 4.
GSAS practical guide
27
Starting from the GSAS program shell:
Compute ! Expedt ↵
Is this the file you wish to use ? <Y> ↵
<L O P> ↵ Turn of all refinement flags of instrumental constants.
<R 4> ↵ Reset profile coeffs. to default values for type "n".
No values found for reset of profile coefficients; they will be set to zero
Do you still want them replaced ? <Y>
Enter new values for GU, GV & GW
<0 0 0>
Enter new values for GP, LX & ptec
<0.1 0.35 0>
Enter new values for trns, shft & sfec
<-12 0 0>
Enter new values for S/L, H/L & eta
<0.009 0.015 0.75>
Enter new values for S400, S040 & S004 <0.1 0.1 0.1>
Enter new values for S220, S202 & S022 <0 0 0>
Enter new values for S301, S103 & S121 <0 0 0>
Profile editing options - (<?>,$,A,C,D,G,H,K,L,N,P,R,V,W,X) >l
Histogram no.
1 Bank no. 1 Lambda1,lambda2 = 1.14750 .00000
Title: Na-p-hydroxybenzoate, X3B1
**** Histogram will be used in least-squares
Phase no. 1
Phase name: Na benzoate
Aniso. broadening axis
0.
0.
1. Damp 7
Peak profile type no. 4 Number of coefficients: 21
Pseudovoigt profile coefficients as parameterized in
P. Thompson, D.E. Cox & J.B. Hastings (1987). J. Appl. Cryst.,20,7983.
Asymmetry correction of L.W. Finger, D.E. Cox & A. P. Jephcoat (1994).
J. Appl. Cryst.,27,892-900.
Microstrain broadening by P.W. Stephens, J. Appl. Cryst. (submitted)
#1(GU)
=
.0 N #2(GV)
=
.0 N #3(GW)
=
.0 N
#4(GP)
=
.1 Y #5(LX)
=
.353 Y #6(ptec) =
.00 N
#7(trns) =
-12.03 Y #8(shft) =
.0000 N #9(sfec) =
.00 N
#10(S/L) =
.0087 N #11(H/L) =
.0147 Y #12(eta) =
.6430 Y
#13(S400)= 2.2E-04 Y #14(S040)= 2.2E-02 Y #15(S004)= 1.6E+00 Y
#16(S220)= 8.4E-03 Y #17(S202)= 2.7E-01 Y #18(S022)= 4.3E-01 Y
#19(S301)= 2.0E-02 Y #20(S103)= 8.1E-02 Y #21(S121)= 2.2E-02 Y
Cut-off for peaks is
.50 percent of the peak maximum
<V> ↵ Request new set of refinement flags for the profile parameters.
Enter refinement codes for GU, GV & GW
<n n n>
Enter refinement codes for GP, LX & ptec
<y y n>
Enter refinement code for trns, shft & sfec
<n n n>
Enter refinement codes for S/L, H/L & eta
<n n n>
28
6 The LeBail fit
Enter refinement codes for S400, S040 & S004 <y y y>
Enter refinement codes for S220, S202 & S022 <n n n>
Enter refinement codes for S301, S103 & S121 <n n n>
<X X X> ↵ <X> ↵ Exit from EXPEDT.
Compute ! Genles↵
↵
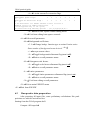
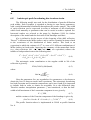
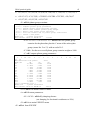
Fig. 6.4:
Final LeBail refinement of sodium-para-hydroxybenzoate including a model
for anisotropic half widths. A blow up, in particular of the higher angle part
immediately reveals the high quality of the actual LeBail fit.
Once convergence is reached, you can slowly add more profile parameters
to the refinement. The parameters should be released in the following order:
1. GP, LX, S400, S040, S004
2. GP, LX, S400, S040, S004, S220, S202, S022
3. GP, LX, S400, S040, S004, S220, S202, S022, S301, S103, S121
4. GP, LX, S/L, S400, S040, S004, S220, S202, S022, S301, S103, S121
5. GP, LX, S/L, ETA, S400, S040, S004, S220, S202, S022, S301, S103, S121
GSAS practical guide
29
6. GP, LX, TRNS, S/L, ETA, S400, S040, S004, S220, S202, S022, S301, S103,
S121
• In case of divergence, the refinement strategy must be changed: if one or
more of the strain values of the principal strain axes (S400, S040, S004) go
negative, set these values to zero and do not refine them until overall
convergence has been reached.
• If convergence has not been reached (check Chi**2 & Final
sum((shift/esd)**2)), it might be necessary to add some more GENLES
cycles.
• If it is necessary to change profile and/ or lattice parameters, POWPREF
should be rerun. Since for the first refinement Cycle the program starts from
equal intensities, it is advisable to set the number of cycles to 0 for the
following run of GENLES.
The final LeBail refinement of sodium-para-hydroxybenzoate should look
similar to that in Fig. 6.4
6.9
Extracting intensities for crystal structure determination
GSAS can create a list of intensities, respectively structure factors. Several
formats are supported, which might be directly used in computer programs for
structure determination from powder diffraction data like SIRPOW (Altomare et
al., 1995) or for the deposition of data for publication.
Starting from the GSAS program shell:
Utilities ! Reflist ↵
Enter histogram number for reflection list (0 to terminate): <1> ↵
Do you want to save graphics outputs ? <N> ↵
<R> ↵ for one phase ascii reflection file (compatible to SIRPOW).
Enter phase no. for ascii reflection file: <1> ↵
Enter name for ascii reflection file: <NABENZO> ↵
Enter histogram number for reflection list (0 to terminate): <0> ↵
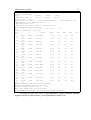
• The complete name of reflection file will be NABENZO.RFL and can be
displayed using an ASCII editor.
30
Iref
H K L Mul Icod D-space
Fosq
Phas
1 1 0 0
2 102116.04064 8.835E+04
.0
2 2 0 0
2 1021 8.02032 1.186E+04
.0
3 3 0 0
2 1021 5.34688 5.158E+04
.0
4 1 1 0
4 1021 5.10322 4.234E+05
8.8
5 2 1 0
4 1021 4.46956 4.247E+04
9.457E+01-176.9
6 4 0 0
2 1021 4.01016 1.939E+04
180.0
…
6 The LeBail fit
Fcsq
FoTsq
FcTsq
8.970E+04 1.994E+02 2.025E+02
1.220E+04 2.505E+01 2.582E+01
5.107E+04 1.189E+02 1.177E+02
4.318E+05 9.884E+02 1.008E+03
4.149E+04 9.685E+01
1.806E+04 4.554E+01 4.240E+01
GSAS practical guide
7
31
The Rietveld fit
It is now time to switch to Rietveld refinement. As already mentioned, the
refinement of the lattice/ profile parameters and of the crystal structure should be
performed separately. Therefore, it is necessary to turn of all refinement flags of
the LeBail refinement.
7.1
Refining the scale factor only
Starting from the GSAS program shell:
Setup ! Expedt
Is this the file you wish to use ? <Y> ↵
1. Change the refinement flag
<L L E> ↵ Change powder data Fobs extraction flags in LSQ controls.
Enter histogram number : <1> ↵
<C> ↵ change Fo extraction method flags
Extract LeBail Fo's for phase 1 in this histogram ?: <n> ↵
<X X> ↵ Exit from editing least squares controls.
2. Turn off the refinement flags of the zero point, profile and lattice parameters
<O L V> ↵ Toggle the lattice parameters refinement flag (turn it off).
<X> ↵ Exit from lattice parameters.
<P V> ↵…↵ (21x) Toggle the profile paramameter refinement flags
(turn them off).
<X> ↵ Exit from profile parameters.
<Z V> ↵ Toggle the zero point parameter refinement flag
(turn it off).
<X> ↵ Exit from instrument parameters.
3. Turn on the refinement flag of the scale factor
32
7 The Rietveld fit
<H V> ↵ Toggle the scale factor refinement flag (turn it on).
<X X> ↵
<X> ↵ Exit from EXPEDT.
Run Powpref, followed by Genles and check the result graphically by
Powplot. The result is quite disappointing. It is quite obvious that a Rietveld
refinement with just one atom at an arbitrary position cannot lead to a reasonable
result.
7.2
Introducing additional atoms
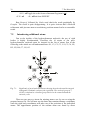
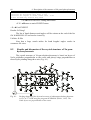
Due to the rigidity of the hydroxybenzoate molecule, the use of rigid
bodies is highly recommended. Therefore the 14 atoms of the parahydroxybenzoate molecule must be inserted in the list of atoms first in the
following order which we will understand later: O1, C1, C2, C3, C4 ,C5, C6, H1,
H2, H3, H4, C7, O2, O3.
Fig. 7.1:
Rigid body of para-hydroxybenzoate showing the molecule and the internal
orthogonal coordinate system of the rigid body. The carboxyl group (C7,
O2,O3) is defined as a satellite group which can be rotated around the
internal y-axis.
There are two ways to insert the missing atoms: one by one or using the
prepared macro file. We will now use the latter that contains dummy coordinates
since the rigid body coordinates will take care of the positions of the individual
atoms. The approximate position of the sodium atom was found by direct
GSAS practical guide
33
methods as x=.9, y=.8, z=.25 and will be entered manually. Only the hydrogen
atom belonging to the hydroxy group will be left out due to its undetermined
position relative to the other atoms of the rigid body.
Starting from the GSAS program shell:
Setup ! Expedt
Is this the file you wish to use ? <Y> ↵
<L A L> ↵ List atom parameters.
@R ↵
name of macro file: <NABENZO.ATO> ↵
<L> ↵ List atom parameters.
<C 1> ↵
Enter sets of parameter names and new values <x 0.9 y 0.8 z 0.25> ↵
34
7 The Rietveld fit
Phase No. 1; Phase has
15 atoms; Title: Na benzoate
SER TYPE
X
Y
Z
FRAC
NAME
UISO
MULT FXU
1 NA
.90000 .80000 .25000 1.00000 NA1
.02500
2 000
2 O
.00000 .00000 .00000 1.00000 O1
.02500
2 000
3 C
.00000 .00000 .00000 1.00000 C1
.02500
2 000
4 C
.00000 .00000 .00000 1.00000 C2
.02500
2 000
5 C
.00000 .00000 .00000 1.00000 C3
.02500
2 000
6 C
.00000 .00000 .00000 1.00000 C4
.02500
2 000
7 C
.00000 .00000 .00000 1.00000 C5
.02500
2 000
8 C
.00000 .00000 .00000 1.00000 C6
.02500
2 000
9 H
.00000 .00000 .00000 1.00000 H1
.02500
2 000
10 H
.00000 .00000 .00000 1.00000 H2
.02500
2 000
11 H
.00000 .00000 .00000 1.00000 H3
.02500
2 000
12 H
.00000 .00000 .00000 1.00000 H4
.02500
2 000
13 C
.00000 .00000 .00000 1.00000 C7
.02500
2 000
14 O
.00000 .00000 .00000 1.00000 O2
.02500
2 000
15 O
.00000 .00000 .00000 1.00000 O3
.02500
2 000
Phase No. 1; Phase has
16 atoms; Title: Na benzoate
Give atom editing command
(<?>,$,C,D,E,F,I,K,L,M,S,T,U,V,X,+,-,*,/) >
CODE
STSYM
I
1
I
1
I
1
I
1
I
1
I
1
I
1
I
1
I
1
I
1
I
1
I
1
I
1
I
1
I
1
<X X> ↵ <X> ↵ Exit Expedt.
7.3
Fixing the floating origin
In space group P21, with the unique axis b, the origin in y-direction is
floating. It is therefore necessary to fix the y-coordinate of one atom at an
arbitrary value. It is recommended to use the sodium atom for this purpose.
Starting from the GSAS program shell:
Setup ! Expedt
Is this the file you wish to use ? <Y> ↵
<L A L> ↵ List atom parameters.
<F 1 Y> ↵
GSAS practical guide
35
<L> ↵ List the current parameters being held.
<X X> ↵ <X> ↵Exit from EXPEDT.
7.4
What to do in case of divergence of the refinement
If the refinement seriously diverges, it might be useful to check the
correlation matrix:
Starting from the GSAS program shell:
Setup ! Expedt
Is this the file you wish to use ? <Y> ↵
<L L L> ↵ Edit least squares controls.
A a - Maximum atom position shift
B b - Matrix band width (0 full matrix)
C n - Maximum number of cycles
D d - Marquardt factor
E
- Change powder data Fobs extraction flags
L
- List current settings
P
- Select options for the output listing
X
- Exit from editing least squares controls
Enter L-S control editing option (<?>,A,B,C,D,E,J,L,P,X) >
<P> ↵ Select options for the output listing.
Least squares print editing options
<?> - Type this help listing
A
- Toggle print of applied shifts & shift factors
C
- Toggle print of correlation matrix
K
- Toggle print of linear constraint matrices
L
- List the current print options
M
- Toggle print of Least-Squares matrices
O
- Turn all print options off
P
- Toggle print of all the parameters for each cycle
R
- Toggle print of reciprocal metric tensor changes
S
- Toggle print of summary shift/esd data after last cycle
T
- Toggle print of recip. metric tensor var/covar terms
X
- Exit to least squares controls editing menu
Z
- Toggle print of zero/unit pole figure constraints
Enter LS print editing option (<?>,A,C,K,L,M,O,P,R,S,T,X,Z) >
<M> ↵ Toggle print of Least-Squares matrices (turn it on).
Print the the Least-Squares matrices and vectors
<X X> ↵ <X> ↵ Exit Expedt.
With the print out option of the correlation matrix turned on, it is now
possible to check for serious correlations between parameters after a completed
run of the Genles program. If high correlations occur, it might be necessary to fix
one or more parameters to previously refined values. The correlation matrix will
be printed in the list file that can be examined by the built in editor:
36
7 The Rietveld fit
Utilities ! Elst - Examine list file
7.5
How to use rigid bodies with satellite groups in GSAS
7.5.1
Introduction
To date, only a few papers have been published about the practical use of
rigid bodies. Although being a standard tool in single crystal analysis, very little
attention has been paid to rigid bodies in powder diffraction. Presumably less
than 5% of the ‘Rietveld’-community make active use them.
In many structures, groups of atoms (molecules or coordination
polyhedra) have a well-established structure, are not completely independent, and
therefore form a relatively rigid unit. Typical examples are the cyclopentadienyl
anion or the benzene ring. Rigid bodies have been a common tool in single
crystal X-ray diffraction for more than 30 years (Scheringer, 1963), and are
especially valuable when the quality of the data is low, the ratio of observations
to parameters is low, and/or the structure is very complicated (e.g. proteins).
According to Scheringer there are several general advantages for using rigid
bodies:
• Since the group is forced to shift as a complete unit, meaningless changes
cannot occur.
• The number of refinable parameters can be drastically reduced and they can be
determined with much higher accuracy. This is in particular useful in the case
of powder data, since the ratio of the number of independent observations
(Bragg intensities) to refinable parameters is typically very low.
• The range of convergence to the correct structure is much larger than in the
normal refinement.
• Hydrogen atoms can be included in the refinement process at an early stage.
Only their relative positions in respect to the other atoms are needed. With
powder data they can only be found directly in very special cases (e.g.
Schmidt et al., 1998; Dinnebier et al., 1999) although their contribution to the
profile is clearly measurable (e.g. Lightfoot, Metha & Bruce, 1993).
• The thermal parameters refer to the group as a whole. The use of TLS matrices
allows anisotropic refinement of the translational and librational parts of the
temperature factor (Downs, 1989).
Furthermore, it is often impossible to refine individual atomic positions if
disorder occurs. By using rigid bodies it might be possible to model disorder
even in the case of powder data (e.g. Dinnebier et al., 1999a,c). The advantages
that have led to the introduction of rigid bodies in single crystal analysis are even
more valid for powder data. Interestingly, very little has been done so far in this
GSAS practical guide
37
field and only a few Rietveld refinement programs like GSAS offer a rigid body
option.
7.5.2
Definition of a rigid body
A rigid group of atoms can be positioned uniquely in space by specifying
6 parameters: three translational parameters that define some reference point of
the group and three angles that define its orientation. If the rigid body lies on a
special position, some of these parameters will have fixed values. In general, the
number of independent positional parameters for a group of n atoms in crystal
space reduces then from 3n to 6.
To set up a rigid body, three coordinate systems are necessary:
! ! !
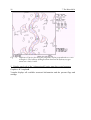
1. The natural crystallographic coordinate system A = {a , b , c } , described by the
unit cell parameters of a, b, c, α, β, and γ.
2. The reference orthogonal coordinate system of a crystal in cartesian
! ! !
coordinates E = { x , y , z } . There are infinite ways in defining the natural basis
of a crystal in terms of a cartesian basis. In a typical definition E could be
! " ! ! " !
! " ! !
aligned with A in a way that: x a , y (c × a ) b * , and z a × (c × a ) (Fig. 1).
(This definition is also used In GSAS except for the “standard” monoclinic
! !
!!
setting, where y b and for the hexagonal and trigonal settings, where z c ).
The transformation matrix M which is needed to transform the one coordinate
system into the other with the matrix equations:
E = M ⋅ A or A = M −1 ⋅ E
(7.1)
is then given by
a
M = b ⋅ cos γ
c ⋅ cos β
0
b ⋅ sin α * ⋅ sin γ
0
0
*
− b ⋅ cos α ⋅ sin γ
c ⋅ sin β
(7.2)
38
7 The Rietveld fit
b
y
γ
a
x
z
c
Fig. 7.2:
Orthonormalization of the crystallographic coordinate system A into a
cartesian coordinate system E.
{! ! !}
3. The internal rigid body reference system in cartesian coordinates I = i , j , k
whose origin is the basepoint of the rigid body. The coordinates can also be
expressed in terms of spherical coordinates (like e.g. in the Rietveld
refinement program FULLPROF (Rodriguez-Carvajal, 1990), but not in
GSAS).
The origin of the internal reference system is related to the origin of the other
two systems by the translational vector
vx
!
v[A] = v y
v
z
in crystallographic
coordinates. In order to describe the orientation of the rigid body in crystal space,
GSAS transforms the cartesian reference system E to the original rigid body
reference system I by rotations around the three cartesian axis αx, αy, αz, using
the following rotation matrices:
0
1
R x (α x ) = 0 cos α x
0 sin α
x
cos α y
0
− sin α x ; R y (α y ) = 0
− sin α
cos α x
y
cos α z
R z (α z ) = sin α z
0
− sin α z
cos α z
0
0
0
1
0 sin α y
1
0 ;
cos α y
(7.3)
Other programs use the Eulerian angles φ, θ and ψ (as defined e.g. in
Goldstein, 1980) or the four quarternians (as defined e.g. in Leach, 1996) for that
purpose. In GSAS, the coordinate system and not the coordinates are
transformed, therefore, the transpose of the product of the rotation matrices must
be applied to transform the coordinates. All angles are positive when rotated
clockwise, while looking along the positive rotation axis. Although only three
rotations are needed, up to three additional rotations allow free rotation of
GSAS practical guide
39
satellite groups or rotation around arbitrary axes running through the origin of the
rigid body (like in case of sodium-para-hydroxybenzoate). The resulting rotation
matrix can then be written as
R = R1 ⋅ R2 ⋅ R3 ⋅ R4 ⋅ R5 ⋅ R6 .
(7.4)
Note, the last rotation will be executed first. The conversion from internal
rigid body coordinates s[I]
follows:
ux
!
to crystallographic coordinates u[A] = u y is as
u
z
(
)
!
!
!
u[A ] = M −1 R T ⋅ s[I ] + v[A]
7.5.3
(7.5)
How to set up a rigid body
There are several ways in defining the internal coordinates of a rigid body.
In GSAS, the internal coordinates are build by the sum of vectors having an
overall scalar multiplier ti which allows for variation of their length:
s xi
n
!
s[I ] = ∑ t i ⋅ s yi
i =1
s zi
(7.6)
These multipliers, called ‘translation lengths’, are refinable parameters.
By refining these ‘translation lengths’, the term rigid is no longer correct, since
only the angular frame but not the interatomic distances are fixed.
Using (7.6), two principal methods of setting up the rigid body coordinates
are possible. The simplest way consists of using the cartesian coordinates of the
atoms of a rigid group directly and to set the ‘translation length’ to unity. This
allows the refinement of the overall size of the group and should be the preferred
method for fairly rigid big molecules. A more sophisticated approach is to define
interatomic vectors with ‘translation lengths’ set equal to bond lengths.
Although the origin of the rigid body can be arbitrarily chosen, it is
strongly recommended to use the center of gravity location whenever it is
possible. This will in particular ease the use of TLS matrices for the description
of atomic displacement, since cross terms between translational and librational
components are nearly eliminated. On the other hand, the choice of origin
dictates the location of the axes of rotations. So one has to be careful in making
this choice.
40
7.5.4
7 The Rietveld fit
Defining the rigid body of para-hydroxybenzoate
Functional groups attached to organic molecules have no translational
degrees of freedom and are usually restricted in their rotations, too. Often, only
rotations around a particular molecular axis are allowed. A typical example is the
carboxyl group of para-hydroxybenzoate, which can rotate out of the molecular
plane (Fig. 7.1).
Setting up satellite groups attached to rigid bodies in GSAS is not directly
supported7. Using the fact that more than 3 rotations are allowed, the rotations of
satellite groups can directly be refined, if two conditions are fulfilled. Firstly, the
rigid body and the satellite group share the same origin and secondly, the rotation
axis of the satellite group runs through that origin.
Tab 7.1:
Rigid Body definition of the phenol part of the para-hydroxybenzoate
molecule where t1 denotes the C-O bond length between the phenol oxygen
and the benzyl ring, t2 and t3 denote the average C-C, resp. C-H bond
distances of the benzyl ring. The z-coordinate is always zero. All angles in
degrees8.
t1
O1
C1
C2
C3
C4
C5
C6
H1
H2
H3
H4
t2
x
0
0
0
0
0
0
0
0
0
0
0
y
-1
0
0
0
0
0
0
0
0
0
0
t3
x
0
0
cos(30)
− cos(30)
cos(30)
− cos(30)
0
cos(30)
− cos(30)
cos(30)
− cos(30)
y
-1
-1
-0.5
-0.5
0.5
0.5
1
-0.5
-0.5
0.5
0.5
x
0
0
0
0
0
0
0
cos(30)
− cos(30)
cos(30)
− cos(30)
y
0
0
0
0
0
0
0
-0.5
-0.5
0.5
0.5
The main rigid body consisting of the phenolate group (C6H4O) will be
oriented in the xy-plane with the O1-C1 bond aligned along the y-axis. Internal
cartesian coordinates using the three lengths of the interatomic vectors (C-O, CC, C-H) as refinable parameters will be used (Tab. 7.1).
7
A trick here is to use duplicate refinement variable numbers to link rotations in
multiple groups. The same is true for positions, etc. but GSAS will prevent one from
using duplicate numbers across parameter types.
8
GSAS will accept “snnn” for sin(nnn), i.e. s35 for sin(35) for any real number input.
Same is true for “cnnn” for cos(nnn) and “tnnn” for tan(nnn). This can be very useful
for input of rigid body coordinates, etc.
GSAS practical guide
41
The satellite group consisting of the carboxy group (CO2) starts at the
same origin as the phenolate group with the C6-O7 bond aligned along the y-axis
(Tab. 7.2) with the two C-O bond lengths as refinable parameters.
The rotation of the carboxyl group around y-axis can now be refined
separately. If all 6 internal bond length are refined, the number of least squares
parameters still reduces from 42 to 13 (3 translational, 4 rotational and 6 bond
lengths).
Tab 7.2:
Rigid Body definition of the carboxylate part of the para-hydroxybenzoate
molecule where t4 denotes the C-C bond length between the benzyl ring and
the carboxyl group, t5 and t6 denote the C-O bond distances within the
carboxyl group. The z-coordinate is always zero. All angles in degrees.
C7
O2
O3
t2
x
0
0
0
y
1
1
1
t4
x
0
0
0
y
1
1
1
t5
x
0
cos(30)
0
y
0
0.5
0
t6
x
0
0
− cos(30)
y
0
0
0.5
If the above mentioned conditions are not fulfilled, there is another, less
sophisticated way of setting up satellite groups in GSAS by setting up two
independent rigid bodies and constraining two atoms in two different groups
using the soft constraint option. It is important to set the weight factor to a huge
number. We will not pursue this possibility any further here.
7.5.5
Finding the starting parameters for the rigid body
Presuming that the rigid body is located on a general position, 6
parameters are needed to describe its position and orientation within the unit cell.
The starting values should be as close as possible to the true ones. The radius of
convergence strongly depends on the size of the molecule. As a rule of thumb, a
misorientation of >15° for one angle of a small molecule, often leads to
divergence in the refinement.
The following considerations will lead to a reasonable starting orientation
position and orientation of the rigid body.
• Bonding of the oxygen atoms of the carboxyl group to the sodium atom.
• Orientation of the long axis of the rigid body along the crystallographic aaxis, more or less parallel to the ab-plane.
The y and z coordinates of the position of the rigid body remain as degrees of
freedom. They can be determined by e.g. trial and error. According to the rigid
body definition (Tab. 7.1, 7.2) the following starting parameters apply for the
rigid body and its satellite group (Tab. 7.3, 7.4):
42
7 The Rietveld fit
Tab. 7.3:
Starting parameters for the position and orientation of the rigid body of
para-hydroxybenzoate.
x/a
y/b
z/c
Rot(z)
Rot(y)
Rot(x)
0.7
0.25
0.9
90
0
0
The values for the bond lengths can be found in the literature (e.g.
International Tables Vol. C, 1995):
Tab. 7.4:
Starting parameters for the bond length in the rigid body of parahydroxybenzoate.
t1 C-OH
t2 C-C (phenyl)
t3 C-H
t4 C-C (carboxyl)
t5/6 C-O
(carboxyl)
7.5.6
1.38
1.4
1.05
1.5
1.3
Introducing the rigid body into GSAS
Before introducing the rigid body into GSAS, all soft constraints (if any)
have to be deleted and the refinement flag for the position of all atoms belonging
to the rigid body must be turned on. In our case, it might be useful to set the
damping factor for the shift of the sodium atom to 50 % (i.e. 5 on a scale from 0
to 9).
Starting from the GSAS program shell:
Setup ! Expedt
Is this the file you wish to use ? <Y> ↵
<L A L> ↵ List atom parameters.
<v 1:16 x> ↵
<d 1 x 5> ↵
<L> ↵ List atom parameters.
<X X> ↵ <X> ↵Exit from EXPEDT.
Now, the rigid body and its satellite group should be introduced according
to tables 7.1 and 7.2. Every translation distance must be defined for all the atoms
in the rigid body. The main rigid body will start at atom No. 2, whereas the
satellite group starts at atom No. 13.
GSAS practical guide
43
Starting from the GSAS program shell:
Setup ! Expedt
Is this the file you wish to use ? <Y> ↵
<L B> ↵ Edit rigid body constraints.
Rigid body editing option
<?>
- Type this help listing
A
- Edit atom parameters for phase "p"
B n
- Define new rigid body type with "n" atoms
Create a new rigid body definition
C t b - Change parameters for rigid body "b" of type "t"
Modify refinement flags, change origin
Change rotations, modify TLS data
D t b - Delete rigid body "b" of type "t"
E t
- Edit rigid body type "t" parameters
Modify body parameterization
Change distance refinement flags
I t s - Insert a new rigid body of type "t" starting at atom seq. no.
"s"
L
- List the current set of rigid bodies
and update atom parameters
P p
- Select phase "p"
R t
- Remove rigid body type "t"
(must be deleted from all phases first)
X
- Exit to main constraint menu
Enter rigid body editing option desired (<?>,A,B,C,D,E,I,L,P,R,X) >
<B 11> ↵ Define new rigid body type with 11 atoms (main rigid body).
Enter number of translations (1-9) to build rigid body: <3> ↵
Enter translation distance: <1.38> ↵ (O-Cring distance)
Enter vector X, Y and Z: <0 –1 0> ↵
….
Enter vector X, Y and Z: <0 0 0> ↵
Enter translation distance: <1.4> ↵ (Cring-Cring distance)
Enter vector X, Y and Z: <0 –1 0> ↵
….
Enter vector X, Y and Z: <-c30 0.5 0> ↵
Enter translation distance: <1.0> ↵ (Cring-H distance)
Enter vector X, Y and Z: <0 0 0> ↵
….
Enter vector X, Y and Z: <–c30 0.5 0> ↵
<B 3> ↵ Define new rigid body type with 3 atoms (satellite group).
44
7 The Rietveld fit
Enter number of translations (1-9) to build rigid body: <4> ↵
Enter translation distance: <1.4> ↵ (Cring-Cring distance)
Enter vector X, Y and Z: <0 1 0> ↵
Enter vector X, Y and Z: <0 1 0> ↵
Enter vector X, Y and Z: <0 1 0> ↵
Enter translation distance: <1.5> ↵ (Cring-CO2 distance)
Enter vector X, Y and Z: <0 1 0> ↵
Enter vector X, Y and Z: <0 1 0> ↵
Enter vector X, Y and Z: <0 1 0> ↵
Enter translation distance: <1.3> ↵ (C-O distance)
Enter vector X, Y and Z: <0 0 0> ↵
Enter vector X, Y and Z: <c30 0.5 0> ↵
Enter vector X, Y and Z: <0 0 0> ↵
Enter translation distance: <1.3> ↵ (C-O distance)
Enter vector X, Y and Z: <0 0 0> ↵
Enter vector X, Y and Z: <0 0 0> ↵
Enter vector X, Y and Z: <-c30 0.5 0> ↵
<I 1 2> ↵ Insert a new rigid body of type 1 starting at atom seq. no. 2
Enter rigid body origin X, Y & Z locations: <.7 .25 0.9> ↵
Enter no. 1 rotation axis (X,Y or Z) and angle: <Z -90> ↵
Enter no. 2 rotation axis (X,Y or Z) and angle: <Y 0> ↵
Enter no. 3 rotation axis (X,Y or Z) and angle: <X 0> ↵
Enter no. 4 rotation axis (X,Y or Z) and angle: <Z 0.0> ↵
Enter no. 5 rotation axis (X,Y or Z) and angle: <Z 0.0> ↵
Enter no. 6 rotation axis (X,Y or Z) and angle: <Z 0.0> ↵
<L> ↵ List the current set of rigid bodies and update atom parameters.
<I 2 13> ↵ Insert a new rigid body of type 2 starting at atom seq. no. 13
Enter rigid body origin X, Y & Z locations: <.7 .25 0.9> ↵
Enter no. 1 rotation axis (X,Y or Z) and angle: <Z -90> ↵
GSAS practical guide
45
Enter no. 2 rotation axis (X,Y or Z) and angle: <Y 0> ↵
Enter no. 3 rotation axis (X,Y or Z) and angle: <X 0> ↵
Enter no. 4 rotation axis (X,Y or Z) and angle: <Z 0.0> ↵
Enter no. 5 rotation axis (X,Y or Z) and angle: <Z 0.0> ↵
Enter no. 6 rotation axis (X,Y or Z) and angle: <Z 0.0> ↵
<L> ↵ List the current set of rigid bodies and update atom parameters.
<X X X> ↵ <X> ↵Exit from EXPEDT.
Now, if you check the atom list, you will find out that GSAS has changed
the atomic coordinates of all atoms belonging to the rigid bodies according to the
rigid bodies definitions.
Run Powpref, followed by Genles and check the result graphically by
Powplot. The only refined parameters now are the histogram scale factor and the
position of the sodium atom. The result is still disappointing but clearly better
than before.
7.5.7
Refining the position and orientation of the rigid bodies
Now, the position and orientation of the entire molecule but not the
rotation of the carboxylate (satellite) group around the C6-O7 axis (Fig. 7.1)
should be refined. In particular at the beginning of the rigid body refinement, it is
useful to set the damping to about 50% to reduce the risk of divergence of the
refinement. It should be noted that the parameter to be refined will numbered by
the user (0= no refinement, 1..n= refinement). The order of the numbers is not
important, equal numbers mean that there corresponding parameters are
constrained to shift by the same amount.
Starting from the GSAS program shell:
Setup ! Expedt
Is this the file you wish to use ? <Y> ↵
<L B> ↵ Edit rigid body constraints.
<C 1 1> ↵
Change parameters for rigid body 1 of type 1 (main group)
Modify refinement flags etc.
<D> ↵ Change current damping factors.
Enter new Rotation no. 1 damping factor (0 to 9): <5> ↵
…
nter new Rigid body Z origin damping factor (0 to 9): <5> ↵
46
7 The Rietveld fit
<V> ↵ Set refinement parameter numbers.
nter rigid body rotation no. 1 parameter number: <1> ↵
Enter rigid body rotation no. 2 parameter number: <2> ↵
nter rigid body rotation no. 3 parameter number: <3> ↵
Enter rigid body rotation no. 4 parameter number: <0> ↵
Enter rigid body rotation no. 5 parameter number: <0> ↵
Enter rigid body rotation no. 6 parameter number: <0> ↵
Enter rigid body origin X
Enter rigid body origin Y
parameter number: <4> ↵
parameter number: <5> ↵
Enter rigid body origin Z
parameter number: <6> ↵
<X> ↵ Exit to overall rigid body editing menu
<C 2 1> ↵ Change parameters for rigid body 1 of type 2 (satellite group)
Modify refinement flags etc.
<D> ↵ Change current damping factors.
Enter new Rotation no. 1 damping factor (0 to 9): <5> ↵
…
Enter new Rigid body Z origin damp. factor (0 to 9): <5> ↵
<V> ↵ Set refinement parameter numbers.
Enter rigid body rotation no. 1 parameter number: <1> ↵
Enter rigid body rotation no. 2 parameter number: <2> ↵
Enter rigid body rotation no. 3 parameter number: <3> ↵
Enter rigid body rotation no. 4 parameter number: <0> ↵
Enter rigid body rotation no. 5 parameter number: <0> ↵
Enter rigid body rotation no. 6 parameter number: <0> ↵
Enter rigid body origin X
parameter number: <4> ↵
Enter rigid body origin Y
parameter number: <5> ↵
Enter rigid body origin Z
parameter number: <6> ↵
<X X X> ↵ <X> ↵Exit from EXPEDT.
GSAS practical guide
47
Run Powpref, followed by Genles and check the result graphically by
Powplot. The only refined parameters now are the histogram scale factor and the
position of the sodium atom. The result is still disappointing but clearly better
than before.
7.5.8
Refining an overall temperature factor of the rigid body
Although in principle, GSAS allows the refinement of TLS matrices, it is
normally sufficient to refine one isotropic overall temperature factor for the
entire rigid body of a molecular compound. This means that the temperature
factors of the 14 atoms of the para-hydroxybenzoate molecule will be constraint
to the same value. In the present case, two overall temperature factors will be
refined. One for the sodium atom and the other for the para-hydroxybenzoate
group. Strong damping of the temperature factors is advised.
Starting from the GSAS program shell:
Setup ! Expedt
Is this the file you wish to use ? <Y> ↵
<L A L> ↵ List atom parameters.
<v 1 u> ↵ refine the temperature factor of the sodium atom (atom No. 1)
<d 1 u 5> ↵ set the damp. of the temp. factor of the sodium atom to 50 %
<K> ↵ Editing atomic constraints.
Atom constraint editing options:
<?> - Type this help listing
D s - Delete constraints
The sequence no. "s" may be n, n:m or ALL
I
- Enter a new constraint
L
- List the current constraints
Each constraint consists of a series of terms which are to be
described
by a single variable. Each term consists of a parameter descriptor
and a coefficient. The parameter descriptor is phase no.,
atom parameter name and atom seq. no. Ranges of atom
seq. no.'s can be specified as 'start:end'. If the name
is 'UISO', 'ALL' is a legal atom seq. no.
The legal atom parameter names are 'FRAC', 'X', 'Y', 'Z', 'UISO',
'U11', 'M
X', etc.
Enter atom parameter linear constraint editing command (<?>,D,I,L,X) >
<I> ↵ Enter a new constraint.
Phase no., var_name, atom no. & coeff.? <1 uiso 2:15 1> ↵
Phase no., var_name, atom no. & coeff.? ↵
<L> ↵ List the current constraints.
48
7 The Rietveld fit
Linear atomic constraint no.
1
Phase,parm.,atom,coeff. = 1 UISO
2
1.0000
Phase,parm.,atom,coeff. = 1 UISO
3
1.0000
Phase,parm.,atom,coeff. = 1 UISO
4
1.0000
Phase,parm.,atom,coeff. = 1 UISO
5
1.0000
Phase,parm.,atom,coeff. = 1 UISO
6
1.0000
Phase,parm.,atom,coeff. = 1 UISO
7
1.0000
Phase,parm.,atom,coeff. = 1 UISO
8
1.0000
Phase,parm.,atom,coeff. = 1 UISO
9
1.0000
Phase,parm.,atom,coeff. = 1 UISO 10
1.0000
Phase,parm.,atom,coeff. = 1 UISO 11
1.0000
Phase,parm.,atom,coeff. = 1 UISO 12
1.0000
Phase,parm.,atom,coeff. = 1 UISO 13
1.0000
Phase,parm.,atom,coeff. = 1 UISO 14
1.0000
Phase,parm.,atom,coeff. = 1 UISO 15
1.0000
Enter atom parameter linear constraint editing command (<?>,D,I,L,X) >
<x> Exit the constraint menu.
<v 2:15 u> ↵ refine the temperature factor of the molecule.
<d 2:15 u 5> ↵ set the damp. of the temp. factor of the molecule to 50 %
<L> ↵ List atom parameters.
<X X> ↵ <X> ↵ Exit Expedt.
Run Powpref, followed by Genles and check the result graphically by
Powplot.
Restraint data statistics:
Powder data statistics
Fitted
All
Average
Bank Ndata Sum(w*d**2) wRp
Rp
wRp
Rp
DWd
Integral
Hstgm 1 PXC
1 14029 44870.
.0715 .0524 .0715 .0524
.544
.964
Powder totals
14029 44870.
.0715 .0524 .0715 .0524
.544
Cycle 973 There were 14029 observations. Total before-cycle CHI**2 =
4.4870E+04
Reduced CHI**2 = 3.207
Histogram 1 Type PXC
for
39 variables
Nobs= 422 R(F**2) =
.0603
Final variable sum((shift/esd)**2) for cycle 973:
88.49 sec
1.31 Time:
GENLES terminated successfully.
In case of convergence of the refinement, the damping factors of the rigid
body should be changed to 0 (no damping) followed by another refinement cycle.
GSAS practical guide
7.5.9
49
Refinement of the bond lengths and the satellite group rotation of
the rigid body
Due to the exceptionally high quality of the powder pattern of sodiumpara-hydroxybenzoate, it is possible to refine several bond lengths of the rigid
body as well as the orientation of the carboxylate satellite group.
Starting from the GSAS program shell:
Setup ! Expedt
Is this the file you wish to use ? <Y> ↵
<L B> ↵Edit rigid body constraints.
<C 2 1> ↵ Change parameters for rigid body 1 of type 2 (satellite group)
Modify refinement flags etc.
<V> ↵ Set refinement parameter numbers.
Enter rigid body rotation no. 1 param. number: <1> ↵ (Rot z)
Enter rigid body rotation no. 2 param. number: <7> ↵ (Rot y)
(= rotation of CO2 group)
Enter rigid body rotation no. 3 param. number: <3> ↵ (Rot x)
Enter rigid body rotation no. 4 param. number: <0> ↵
Enter rigid body rotation no. 5 param. number: <0> ↵
Enter rigid body rotation no. 6 param. number: <0> ↵
Enter rigid body origin X
parameter number: <4> ↵
Enter rigid body origin Y
parameter number: <5> ↵
Enter rigid body origin Z
parameter number: <6> ↵
<X>↵ Exit to overall rigid body editing menu
<E 1>↵
Edit rigid body type 1 parameters, Modify body parameteriz.,
Change distance refinement flags.
50
7 The Rietveld fit
Rigid body type editing options
<?> - Type this help listing
A
- Add a new translation operator
C
- Change the translation magnitude and vectors
D
- Change current damping factor
L
- List the translation magnitude and vectors
N
- Select next translation
T t - Select new translation "t"
V
- Set refinement variable number
Refinement variable numbers should be chosen so that the various
magns
are either independent or identical to each other
X
- Exit to overall rigid body editing menu
Enter rigid body type editing command (<?>,A,C,D,L,N,T,V,X) >
<t 1> ↵ Select new translation No. 1
<D 5> ↵ Change damping factor of translation No. 1 (C-O) to 50%.
<V> ↵ Set refinement variable number.
Enter translation magnitude parameter number: <8> ↵
<t 2> ↵ Select new translation No. 2
<D 5> ↵ Change damping factor of translation No. 1 (C-C) to 50%.
<V> ↵ Set refinement variable number.
Enter translation magnitude parameter number: <9> ↵
<t 3> ↵ Select new translation No. 1
<D 5> ↵ Change damping factor of translation No. 3 (C-C) to 50%.
<V> ↵ Set refinement variable number.
Enter translation magnitude parameter number: <10> ↵
<X>↵ Exit to overall rigid body editing menu
<E 2>↵
Edit
rigid
body
type 2 parameters,
parameterization,
Modify
body
Change distance refinement flags.
<t 1> ↵ Select new translation No. 1
<D 5> ↵ Change damping factor of translation No. 1 (C-C) to 50%.
<V> ↵ Set refinement variable number.
Enter translation magnitude parameter number: <9> ↵
<t 2> ↵ Select new translation No. 2
GSAS practical guide
51
<D 5> ↵ Change damping factor of translation No. 1 (C-CO2) to
50%.
<V> ↵ Set refinement variable number.
Enter translation magnitude parameter number: <11> ↵
<t 3> ↵ Select new translation No. 3
<D 5> ↵ Change damping factor of translation No. 1 (C-O) to 50%.
<V> ↵ Set refinement variable number.
Enter translation magnitude parameter number: <12> ↵
<t 4> ↵ Select new translation No. 4
<D 5> ↵ Change damping factor of translation No. 1 (C-O) to 50%.
<V> ↵ Set refinement variable number.
Enter translation magnitude parameter number: <13> ↵
<X X X>↵ <X> ↵ Exit from EXPEDT.
Run Powpref, followed by Genles and check the result graphically by
Powplot and by Elst. The Rietveld Fit should now be quite satisfactory. It might
be useful to refine the profile and lattice parameters in addition. It is now time to
look for the fine details of the structure like the missing hydrogen atom of the
hydroxy group.
7.6
How to perform a difference Fourier analysis
In GSAS, Patterson, observed Fourier, calculated Fourier and difference
Fourier maps can be calculated and displayed. The Vrstplot program e.g. which is
included in the GSAS package can display 3-dimensional structure and Fourier
plots in VRML code which can than be viewed using a public domain VRML
viewer like Vrweb.
In order to enable GSAS to calculate Patterson and/or Fourier maps, make
sure that the F’obs have been extracted during the last run of GENLES (see
6.1.2). In our example we are interested in the difference Fourier map. The 3dimensional Fourier analysis should contain at least the asymmetric unit cell.
1. Preparing the Experement file
Starting from the GSAS program shell:
Setup ! Expedt
52
7 The Rietveld fit
Is this the file you wish to use ? <Y> ↵
<F> ↵ Fourier calculation set up
Enter desired map: <DELF> ↵
Enter section desired: <Z> ↵
Do you wish to specify individual map steps for each axis ? <N> ↵
Enter new overall map step size in Angstroms : </> ↵
Enter min. and max. values of x in fractions of the cell edge: <0 1> ↵
Enter min. and max. values of y in fractions of the cell edge: <0 0.5> ↵
Enter min. and max. values of z in fractions of the cell edge: <0 1> ↵
Include histogram (0 to terminate list): <1 0> ↵
<L> ↵ List the current controls
Current Fourier map options for phase 1 are:
Calculate a DELF map. Do not generate a map listing
Calculate sections at constant Z
Divide the cell into
80 points along x
The x interval is .2008 A; the range is
.0000 to 1.0000
Divide the cell into
28 points along y
The y interval is .1922 A; the range is
.0000 to
.5000
Divide the cell into
20 points along z
The z interval is .1819 A; the range is
.0000 to 1.0000
At least one asymmetric part of the unit cell is included in the
Fourier.
There are 1 histograms
The histogram type flags are
1 PXC
1 of them are to be used
The ones to be used are:
1
F000 is
.000
Enter FOURIER map option (<?>,A,D,E,F,H,I,L,P,R,S,T,W,X) >
<?> ↵ List the current controls
GSAS practical guide
53
The FOURIER control data edit options are
<?> - Type this help listing
A - Add another map to the set to be calculated
D - Change minimum reflection D-spacing for this phase
E - Erase a map from the set to be calculated
F - Edit phase composition
H - Select histograms to include in the map
I - Enter new map intervals
L - List the current controls
P - Select phase (only one can be processed by FOURIER
R - Enter new unit cell limits for the map
S - Change the sections control
T - Change the experiment title
W - Change the map listing options
X - Exit to EXPEDT main menu
Enter FOURIER map option (<?>,A,D,E,F,H,I,L,P,R,S,T,W,X) >
<X> ↵ <X> ↵ Exit from EXPEDT.
2. Run the Fourier program
Compute ! Fourier ↵
3. Search for peaks in the 3-dimensional Fourier map
Compute ! Forsrh ↵
A DELF file has been opened
The range of map values is
-.253 to
.236
Enter min. Peak value (negative if negative values are desired): <0> ↵
Enter number of peaks to be located (1 to 225): <5> ↵
Save the peaks located in the EXP file?: <N> ↵
Min rho =
.00000 No. of peaks =
Phase I.D. Na benzoate
Data I.D. Na benzoate
Map type is DELF
New Rho limit set to
.2103
New Rho limit set to
.2811
The following peaks were found
Rho
X
Y
1
.467
.8139
.3016
2
.376
.5509
.2637
3
.371
.0512
.0206
4
.347
.4898
.0666
5
.305
.5409
.2358
Total CPU time for FORSRH was
5
Peaks saved? N
Z
.7600
.0365
.1620
.8728
.6894
38.23 seconds
54
7 The Rietveld fit
The first peak at (0.81, 0.3, 0.76) could be a reasonable candidate for he
missing hydrogen atom of the hydroxy group. For a better verification, graphical
representation of the difference Fourier density are necessary.
4. Display sections of the 3-dimensional Fourier map
Graphics ! Fouplot ↵
Do you want to save graphics outputs ? <N> ↵
Map X axis divided into
84 steps, from
Map Y axis divided into
28 steps, from
Map Z axis divided into
20 steps, from
Map scaling factor 1.E+00
Rescaled rho limits from
-.39 to
.47
There were 29325 map elements stored
Selected maptype is DELF
The map values range from
-.39 to
.47
1.E+00
5 contours will be drawn between rho =
with an interval of
.08
Contours will be drawn at:
.08
.16
.23
.31
.39
The map center is at
.00000
.00000
The map orientation vectors are:
U =
1.00000
.00000
.00000
V =
.00000
1.00000
.00000
Plot axes to crystal transformation matrix:
.062264
.000000
.003121
.000000
.185776
.000000
.000000
.000000
.275200
0 and covering
0 and covering
0 and covering
85 steps
15 steps
23 steps
with a scaling factor of
.00 and
.47
.00000
Height of section above center is
.000 A
The map size - center to edge is
5.00 A
The map grid interval is .300 A
Enter FORPLOT command (<?>,A,C,D,G,F,H,I,L,M,N,O,P,Q,R,S,T,V) >
<?> ↵ Type help listing
GSAS practical guide
FORPLOT
<?>
A
Numbers
C c
D
F
G g
H h
I v
L
M v
N n
O
P
Q
R a r drawing
S s
T x y z
V u v -
55
commands:
Type this help listing
Define map center and orientation by entering 3 or 4 atom seq.
Set map center
Set atom labeling limit
Read a different Fourier map
Set grid interval "g" in A (default = .3)
Set height "h" of section above center in A
Select contour interval in rho "v"
List current settings
Select minimum rho value "v" (default = 0.0)
Select number of contours "n" and assign their values
Convert map to DSN6 format
Plot map
Quit FORPLOT
Enter axis (x,y,or z) and angle for rotation of current
Set map size - center to edge (default = 5.0 A)
- Display rho at "x,y,z"
Set map orientation vectors "u" and "v" (Enter 6 values)
Map horizontal is u and normal is uxv
Enter FORPLOT command (<?>,A,C,D,G,F,H,I,L,M,N,O,P,Q,R,S,T,V) >
<V> Set map orientation vectors "u" and "v"
X,Y,Z components of "U" vector for plot <1 0 0> ↵
X,Y,Z components of "V" vector for plot <0 1 0> ↵
<C 0.5 0.5 0.0> ↵ Set map center
<H 2.73> ↵ Set height "h" of section above center in Å (0.75 * 3.638 Å)
<D 0.5> ↵ Set atom labeling limit to 0.5 Å.
<S 7.0> ↵ Set map size - center to edge to 7 Å.
<I 0.08> ↵ Select contour interval in rho.
<P> ↵ Plot map (see Fig. 7.3).
<X> ↵ Exit cursor mode.
<Q> ↵ Quit FORPLOT.
56
7 The Rietveld fit
Fig . 7.3: Difference Fourier plot using the program Forplot perpendicular to c-axis
at height ¾. The hydroxy-hydrogen atoms between the hydroxy oxygen
atoms are clearly visible.
5. Display one level of the 3-dimensional Fourier map plus crystal structure
Graphics ! Vrstplot ↵
Vrstplot displays all available structural information and the present flags and
settings.
GSAS practical guide
57
Phase name: Na benzoate
Lattice parameters:
a,b,c
=
16.0607
5.3828
3.6383
alpha,beta,gamma =
90.000
92.870
90.000
Space group
P 21
The lattice is acentric
primitive monoclinic
Laue symmetry 2/m
Multiplicity of a general site is
2
The unique axis is b
The location of the origin is arbitrary in y
The equivalent positions are:
( 1)
X
Y
Z ( 2)
-X 1/2+Y
-Z
Atomic coordinates (Uij*100):
ser.
x
y
z
name
U11
U22
U33
U12
U13
U23
1
.9471
.8030
.2566 NA1
3.39
.00
.00
.00
.00
.00
2
.5228
.2433
.8744 O2
2.05
.00
.00
.00
.00
.00
3
.6079
.2569
.8442 C3
2.05
.00
.00
.00
.00
.00
4
.6430
.4641
.6841 C4
2.05
.00
.00
.00
.00
.00
5
.6587
.0635
.9739 C5
2.05
.00
.00
.00
.00
.00
6
.7288
.4779
.6537 C6
2.05
.00
.00
.00
.00
.00
7
.7445
.0772
.9435 C7
2.05
.00
.00
.00
.00
.00
8
.7796
.2844
.7834 C8
2.05
.00
.00
.00
.00
.00
9
.6075
.5992
.5936 H9
2.05
.00
.00
.00
.00
.00
10
.6342 -.0812 1.0857 H10
2.05
.00
.00
.00
.00
.00
11
.7533
.6226
.5419 H11
2.05
.00
.00
.00
.00
.00
12
.7800 -.0578 1.0340 H12
2.05
.00
.00
.00
.00
.00
13
.8730
.2994
.7502 C13
2.05
.00
.00
.00
.00
.00
14
.9077
.5106
.6879 O14
2.05
.00
.00
.00
.00
.00
15
.9168
.1059
.7835 O15
2.05
.00
.00
.00
.00
.00
Space filling atoms will not be plotted
Thermal ellipsoids will be plotted
The ellipsoid probability is
.500
Unit cell edges will not be plotted
Enter VRSTPLOT command (<?>,A,B,C,E,F,H,L,M,N,P,U,W,Q) >
In order to view one level of the difference Fourier electron demsity
together wit the crystal structure, several parameters must be set.
58
7 The Rietveld fit
VRSTPLOT commands:
<?>
- Type this help listing
A
- Select atoms for drawing
B
- Select bonds for drawing
C
- Modify atom colors
E
- Toggle plot of space filling atoms or ellipsoids
F
- Setup plot of Fourier contours
H
- Toggle of hkl plane plot
L
- List structure data
M
- Change ellipsoid probability or atom radius multiplier
N n
- Select a new phase n
P
- Select polyhedra for drawing
U
- Toggle plot of unit cell edges
W
- Write VRML plot file
Q
- Quit VRSTPLOT
Enter VRSTPLOT command (<?>,A,B,C,E,F,H,L,M,N,P,U,W,Q) >
<A> ↵ Select atoms for drawing.
List of atoms to be plotted
No atoms in drawing array
Atom names:
1 NA1
2 O2
3 C3
4 C4
6 C6
7 C7
8 C8
9 H9
11 H11
12 H12
13 C13
14 O14
Enter atom selection control (<?>,A,L,U,X) >
Atom selection commands
<?>
- Type this help listing
A
- Individual atoms
L
- Show list of selected atoms
U
- All atoms within unit cell
X
- Exit atom selection
Enter atom selection control (<?>,A,L,U,X) >
5 C5
10 H10
15 O15
<U> ↵ All atoms within unit cell should be plotted
Enter atom seq. or type to be included <1:15> ↵
Enter minimum and maximum along X axis <-0.5 1.5> ↵
Enter minimum and maximum along Y axis <-0.25 1.25> ↵
Enter minimum and maximum along Z axis <0 1> ↵
(now, a list of all atoms which will be drawn follows)
<X> ↵ Exit atom selection
<E> ↵ Toggle plot of space filling atoms or ellipsoids (set it off)
Space filling atoms will not be plotted
Thermal ellipsoids will be plotted
Ellipsoid probability is
.500
<B> Select bonds for drawing
List of bonds to be plotted
No bonds in drawing array
Atom names:
1 NA1
2 O2
3 C3
4 C4
5 C5
GSAS practical guide
6 C6
7 C7
8 C8
11 H11
12 H12
13 C13
Enter bond selection control (<?>,B,D,L,X) >
59
9 H9
14 O14
10 H10
15 O15
<B Na O 2.5 1 0.06> (All bonds betw. Na and O within 2.5(±1) Å
with a "bond" thickness of 0.06)
<B C C 1.5 0.3 0.06> All bonds betw. C and C within 1.5(±0.3) Å
<B C O 1.3 0.3 0.06> All bonds betw. C and O within 1.3(±0.3) Å
<B C H 1.0 0.1 0.06> All bonds betw. C and H within 1.0(±0.1) Å
Bond selection commands
<?>
- Type this help listing
B
- All bonds within "bond" distance
D
- Delete bonds
L
- Show list of selected bonds
X
- Exit bond selection
Enter bond selection control (<?>,B,D,L,X) >
<X> ↵ Exit bond selection
<U> ↵ Toggle plot of unit cell edges (Turn it on)
<F> ↵ Setup plot of Fourier contours
A DELF file has been opened
Problem title: Na benzoate
Phase name: Na benzoate
Map parameters:
Map X axis divided into
84 steps, from
0 and covering
85 steps
Map Y axis divided into
28 steps, from
0 and covering
15 steps
Map Z axis divided into
20 steps, from
0 and covering
23 steps
Map scaling factor 1.E+00
Rescaled rho limits from
-.39 to
.47
There were 29325 map elements stored
Selected map type is DELF
The map values range from
-.39 to
.47 with a scaling factor of
1.E+00
Contour will be drawn at:
.03927
The map grid interval is
.30 A
The range in X to be contoured is from
.00 to 1.00
The range in Y to be contoured is from
.00 to 1.00
The range in Z to be contoured is from
.00 to 1.00
Fourier map contour will be plotted
Enter Fourier plot command (<?>,C,F,G,L,M,R,X) >
<C 0.4> ↵ Set contour level for plot to ρ= 0.4
Fourier plot commands:
<?>
- Type this help listing
C
- Set contour level for plot
F
- Read a different Fourier map
G
- Set grid interval in A
L
- List current settings
M
- Toggle Fourier contour plot
R
- Set range in x,y,z for contour plot
X
- Exit Fourier map controls
Enter Fourier plot command (<?>,C,F,G,L,M,R,X) >
60
7 The Rietveld fit
<M> ↵ Toggle Fourier contour plot (turn it on)
<R 0 1 0 1 0 1> ↵ Set range for contour plot (full unit cell)
<X> ↵ Exit Fourier map controls
<W> ↵ Write VRML plot file
Enter new color number (1-120, 0 for list) <54> ↵
<Q> ↵ Quit VRSTPLOT
The file NABENZO.WRL was written which can now be viewed, rotated,
zoomed etc. with a VRML viewer like VRWEB. You might want to explore the
VRSTPLOT program further and try out the many options.
At this point, you should essentially reproduce more or less the drawing of
Fig. 7.4. In order to produce a hardcopy output, the Print Screen option of the
Windows operating system can be used. For better quality pictures, you will need
to run a ray-tracing program like POV. Note, this step can be quite time
consuming; therefore, be certain you have the drawing you want.
Fig. 7.4:
7.7
3-dimensional difference-Fourier plot of sodium-para-hydroxybenzoate
NaC7O3H5 in space group P21 after applying the anisotropic FWHM model.
The missing hydroxy-hydrogen atoms are clearly visible between the
hydroxy-oxygen atoms
Refining the position of the missing hydroxy-hydrogen
atom
Add the position of the missing hydroxy hydrogen, which can be deduced
from the output of the Fourier search program or graphically using Forplot (see
chapter 7.6), to the list of atoms and fix the temperature factor to an arbitrary
value (e.g. 0.05). Set the damping factor to at least 5. It should now be possible to
refine the position of the hydrogen atom freely.
GSAS practical guide
7.8
61
Calculate the R-F and R-F2 values of the Refinement.
The profile and weighted profile R-factors in Rietveld refinement are good
relative indicators, but do not allow a judgement on the absolute quality of the
refinement since they depend strongly on the (included) background. The only
R-factors which are somehow comparable to single crystal analysis are the R-F
and R-F2 (Bragg-R-value) agreement factors which must be calculated separately
in GSAS.
Starting from the GSAS program shell:
Results ! Rcalc
Do you want any plots? <N> ↵
Do you wish to enter any extra hkl classes? <N> ↵
Do you wish FoSQ statistics? <N> ↵
&
Results ! Rcalc
Do you want any plots? <N> ↵
Do you wish to enter any extra hkl classes? <N> ↵
Do you wish FoSQ statistics? <Y> ↵
The results are written at the end of the list file (NABENZO.LST) and can
be viewed with a text editor.
7.9
Switching to soft constraints
In the present case, rigid bodies are clearly the best choice. On the other
hand, one quite often may wish to allow for the refinement of individual bond
lengths, angles and torsion angles within a certain limit. In other cases, the
rotation axes of satellite groups do not run through the origin of the internal
coordinate system of the main rigid body. For these cases, soft constraints,
sometimes called restraints are useful. GSAS offers a variety of restraints on
bond lengths, angles, torsion angles, planarity, energy etc.
The overall minimization function then reads (after Bärlocher, 1993):
S yR = ∑ wi ( yoi − y ci ) + cw ∑ w j (Roj − Rcj ( x) ) , wi =
2
i
2
j
1
1
, w=
2
σ ( y oi )
σ ( Roj ) 2
(7.7)
where yoi and yci are the observed and calculated intensities at the step i, σ(yoi) is
the standard deviation of the measured intensity, Roj is the expected
stereochemical quantity like bond length, angle etc. (so called pseudoobservation), whereas Rcj(x) is its value calculated from the atomic positions x,
62
7 The Rietveld fit
σ(Roj) is the standard deviation of the pseudo-observation, cw is a common
weight factor which can be used to vary the contribution of the restraints in the
refinement process. The higher is cw, the more turn the restraints into constraints.
Rigid bodies and restraints in GSAS are not compatible. That means that
atoms which are within a rigid body cannot be restrained at the same time.
Therefore, before this kind of restraints can be introduced into GSAS, all rigid
bodies must be deleted first.
Starting from the GSAS program shell:
Setup ! Expedt
Is this the file you wish to use ? <Y> ↵
<L B> ↵Edit rigid body constraints.
<D 2 1> ↵ Delete rigid body 1 of type 2.
Rigid body of type 2, No 1 start. at atom 13 in phase 1 will be deleted
Do you want to delete it ? <Y> ↵
<D 1 1> ↵ Delete rigid body 1 of type 1.
Rigid body of type 1, No 1 start. at atom 2 in phase 1 will be deleted
Do you want to delete it ? <Y> ↵
<R 2> ↵
Remove rigid body type 2.
Do you want to delete it ? <Y> ↵
<R 1> ↵
Remove rigid body type 1.
Do you want to delete it ? <Y> ↵
<L> List the current set of rigid bodies and update atom parameters
No rigid bodies have been defined
<X>↵ Exit to main constraint menu
Now, the soft constraints for bond lengths, angles and the planarity of the
phenolate and the carboxylate groups can be introduced:
<S> ↵ Edit soft constraint data.
GSAS practical guide
63
<?> - Type this help listing
A - Edit bond angle restraints
C - Edit chemical composition restraints
D - Edit atom bond restraints
K - Edit chiral volume restraints
L - List histogram titles
P - Edit planar group restraints
R - Edit phi/psi pseudopotential restraints
T - Edit torsion angle restraints
U n/n:m - Toggle use of histograms
X - Exit to main EXPEDT menu
Select editing option for restraints (<?>,A,C,D,K,L,P,R,T,U,X) >
<D> ↵ Edit atom bond restraints
The options for editing bond restraints are:
D n:n - Delete bond restraints records
F
x - Enter a new overall bond restraints weight
I d s - Enter a new bond restraint
L n:n - List the current set of bond restraints
M
n - Modify the distance in a restraint
P
n - Select a new phase
R
x - Set the distance search range
There are
0 bond restraints
The current value of FACTR is
1.00000
Enter bond restraint option (<?>,D,F,I,L,M,P,R,X) >
<R 1.2> ↵ Set the distance search range.
<I 1.38 0.05> ↵ Enter a new soft constraint (distance, sigma)
Enter atom 1 definition: <C> ↵
Enter atom 2 definition: <C> ↵
2 3 O2 C3 Distance = 1.379 D/DIST = .999
Do you wish to restrain this bond ? <Y> ↵
Restraint 1
2
3 1 0 0 0 0 1.380 .050 was written
13 14 C13 O14 Distance = 1.292 D/DIST = .936
Do you wish to restrain this bond ? <N> ↵
13 15 C13 O15 Distance = 1.260 D/DIST = .913
Do you wish to restrain this bond ? <N> ↵
…..
The following bonds should be restrained:
• C(phenolate)-C(phenolate):
1.39(5) 6x
• C(phenolate)-H(phenolate):
1.05(5) 4x
• O(phenolate)-H(phenolate):
1.05(5) 1x
• C(phenolate)-O(phenolate):
1.38(5) 1x
64
7 The Rietveld fit
• C(phenolate)-C(carboxylate):
1.51(5) 1x
• C(carboxylate)-C(carboxylate):
1.27(5) 2x
…..
<F 10000> ↵ Set the new overall bond restraints weight to 10000.
<L> ↵ List the current set of bond restraints.
The current value of FACTR is
10000.0
There are
14 bond length restraints
Bond length restraints for phase
1
BNo
S1
S2 Atom 1
Atom 2 Rstrnt Sigma
1
2
3 O2
C3
1.380 .050
2
3
4 C3
C4
1.390 .050
3
3
5 C3
C5
1.390 .050
4
4
6 C4
C6
1.390 .050
5
5
7 C5
C7
1.390 .050
6
6
8 C6
C8
1.390 .050
7
7
8 C7
C8
1.390 .050
8
8
13 C8
C13
1.510 .050
9
13
14 C13
O14
1.270 .050
10
13
15 C13
O15
1.270 .050
11
4
9 C4
H9
1.050 .050
12
5
10 C5
H10
1.050 .050
13
6
11 C6
H11
1.050 .050
14
7
12 C7
H12
1.050 .050
The search range is D/DRNG to D*DRNG
The current value of DRNG is 1.100
Dist. Error
1.379 .001
1.390 .000
1.390 .000
1.390 .000
1.390 .000
1.390 .000
1.390 .000
1.513 -.003
1.292 -.022
1.260 .010
.971 .079
.971 .079
.971 .079
.971 .079
<X> ↵ Exit from editing bond restraints.
<A> ↵ Edit bond angle restraints
The options for editing bond angle restraints are:
C n:n - Compute bond angle parameters
D n:n - Delete bond angle restraint records
F
x - Enter a new overall bond angle weight
I d s - Enter a new bond angle restraint
L n:n - List the current set of bond angle restraints
P
n - Select a new phase
There are
0 bond angle restraints
The current value of FACTR is
1.00000
<I 120 2 2 3 4 0> ↵
inserts an angle of 120(2)°
on atoms No. 2 (O1), 3 (C1), and 4 (O2).
The list is terminated by 0.
<C> ↵ Compute (and list) bond angle parameters
<F 1000> Set the new overall bond angle weight to 1000
ToNo
Name
Angle
esd
At. seq.
1
1
120.00
120.00 2.00
2
There are
1 bond angle restraints
The current value of FACTR is
1.00000
3
4
The following angles should be restrained to 120(2)°:
GSAS practical guide
65
• <C1,C2,C3, <C1,C2,C4, <C2,C4,C6, <C4,C6,C5, <C6,C5,C3, <C5,C3,C1
• <O1-C1-C2, <C1,C2,H1, <C2C4H3 <C6C5H4 <C5C3H2, <C4,C6,O7
• <C6,C7,O2, <C6,O7,O3, <O3,O7,O2
<P> ↵ Edit planar group restraints
The options for editing planar group restraints are:
C n:n - Compute planar group parameters
D n:n - Delete planar group restraint records
F
x - Enter a new overall planar group weight
I d s - Enter a new planar group restraint
L n:n - List the current set of planar group constraints
P
n - Select a new phase
There are
0 plane restraints
The current value of FACTR is
1.00000
<I 0.2 2 3 4 5 6 7 8 9 10 11 12 13 > ↵ Enter the new planar group
restraint for the phenolate plus the C atom of the carboxylate
group (atoms No. 2 to 13) with an esd of 0.2.
<F 1000> Set the new overall planar group restraint weight to 1000
<C> ↵ Compute planar group parameters
PlNo Phas Natm esd
At. seq.
1
1 12 .20
2
3
4
5
6
12
13
RMS deviation from plane:
.0000
Name res
pX
pY
pZ
O2
-2.7807
.0000
.0000
C3
-1.4016
.0000
.0000
C4
-.7063
1.2041
.0000
C5
-.7064
-1.2041
.0000
C6
.6841
1.2041
.0000
C7
.6840
-1.2041
.0000
C8
1.3793
.0000
.0000
H9
-1.1918
2.0449
.0000
H10
-1.1918
-2.0449
.0000
H11
1.1695
2.0449
.0000
H12
1.1695
-2.0449
.0000
C13
2.8922
.0000
.0000
"X" to terminate list >
There are
1 plane restraints
The current value of FACTR is
1000.0
7
8
9
10
<X X> ↵ Exit to main EXPEDT menu.
<A> ↵ Edit atom parameters.
<D 1:16 X 5> ↵ Modify damping dactors
(set damping for fractional coordinates to 50%)
<X> ↵ Exit to main EXPEDT menu.
<X> ↵ Exit from EXPEDT.
11
66
7 The Rietveld fit
Run Powpref, followed by Genles and check the result graphically by
Powplot and by Elst. The overall weight factors for the different groups of
restraints are quite high at the moment and should be decreased gradually until
the deformation of the chemical groups does not make sense any more. It can be
expected that the bond lengths need to be constrained more than bond angles.
It is recommended to check for peaks in the difference Fourier map as
described above.
GSAS practical guide
8
Description of the structure of Na-parahydroxybenzoate
8.1
Calculate the bond lengths and angles of the refined
structure
67
In order to calculate all relevant bond distances and angles, the program
needs to know the range of interest.
Starting from the GSAS program shell:
Setup ! Expedt
Is this the file you wish to use ? <Y> ↵
<D> ↵ Distance/angle calculation set up
The available options are:
<?> - Type this help listing
A
- Edit atom parameters
D
- Edit the distance/angle routine controls
P
- Edit phase data - lattice & sp. Group
T
- Change the experiment title
X
- Return to main EXPEDT menu
Select editing option for Distance/angle calculation (<?>,A,D,P,T,X) >
<D> ↵ Edit the distance/angle routine controls
The DISAGL control data edit options are
<?> - Type this help listing
C
- Change distance limit type and values
D
- Delete calculation of distances for this phase
F
- Change the Fourier peak inclusion option
L
- List the current controls
N n - Process phase "n"
O
- Select a new output option
X
- Exit to DISAGL editing main menu
Enter DISAGL control data edit option (<?>,C,D,F,L,N,O,X) >
<C> ↵ Change distance limit type and values
Do you wish to use individual atom radii for distance limits? <n> ↵
Enter maximum distance for distance listing <3.5> ↵
Do you wish to use individual atom radii for angle limits? <n> ↵
Enter maximum distance for angle listing <3.5>
<L> ↵ List the current controls
68
8 Description of the structure of Na-para-hydroxybenzoate
Current Distance and Angle options for phase 1 are:
Calculate all distances less than 3.500
Calculate all angles to atoms closer than 3.500
Do not include any Fourier map peaks
<X> ↵ Exit to DISAGL editing main menu
<X X> ↵ Return to main EXPEDT menu
<X> ↵ Exit EXPEDT
Results ! Disagl
The list of bond distances and angles will be written at the end of the list
file NABENZO.LST and can be viewed by
Utilities ! Elst
Note that a large search radius for bond lengths/ angles results in
enormous file sizes.
8.2
Results and discussion of the crystal structure of Na-parahydroxybenzoate
The crystal structure of Na-para-hydroxybenzoate is based on layers of
NaO6 polyhedra perpendicular to the a-axis and phenyl rings perpendicular to
those layers pointing along the a-axis (Fig. 8.1).
Fig. 8.1:
Packing diagram of the layered structure of sodium-para-hydroxybenzoate
in P 21 at T= 295K using the program SCAHAKAL (Keller, 1997). The
NaO6 layers are perpendicular to the a-axis.
GSAS practical guide
69
Every sodium atom is coordinated to 6 oxygen atoms in form of a
distorted trigonal prism, similar to that in Na2SO4-V (Thenardite) (Mehrotra et al,
1978) (Fig. 8.2). The NaO6 prisms are connected quite unfavorably via 6 out of 9
edges with neighboring prisms forming an infinite layer. The bond distances
between the sodium and the oxygen atoms are 2.33(1)Å to 2.64(1)Å, comparable
to that of other compounds containing NaO6 prisms like Na2SO4: 2.335-2.535Å
or Na2SeO4: 2.330-2.592Å (Mehrotra et al, 1978). The base of the NaO6 prism
defines a perfect plane, whereas the ‘roof atoms’ show small deviations in the
height relative to the base plane (Fig 8.2). There is no interaction between the
sodium atom and the π-system of the phenyl ring, in contrast to sodiumphenolate and sodium-phenolate*2phenol (Dinjus, Kunert, Nauck & Sieler,
1997; Jörchel & Sieler, 1994).
Tab. 8.1:
Positional parameters and Ui/Å2 x 103 of sodium-para-hydroxybenzoate at
295 K; esd’s are a factor of six larger than Rietveld statistical estimates, as
discussed in Langford & Louër (1996). The values of the temperature factor
are constrained to be equal for the entire rigid body and were set to an
arbitrary value for the hydroxy hydrogen atom.
x/a
y/b
z/c
Ui
*100
x/a
y/b
z/c
Ui
*100
Na
0.9474(4)
0.8031
0.257(2)
36(3)
H1
0.610(2)
0.601(6)
0.588(5)
21(1)
O1
0.5255(6)
0.243(2)
0.871(2)
21(1)
H2
0.636(1)
-0.084(6)
0.087(5)
21(1)
C1
0.6106(4)
0.256(2)
0.842(1)
21(1)
H3
0.757(1)
0.624(6)
0.538(5)
21(1)
C2
0.6458(4)
0.463(2)
0.681(2)
21(1)
H4
0.783(2)
-0.061(6)
0.037(5)
21(1)
C3
0.6613(3)
0.063(2)
0.973(2)
21(1)
H
0.49(1)
0.09(2)
0.03(4)
50
C4
0.7317(3)
0.477(2)
0.652(2)
21(1)
C5
0.7472(3)
0.077(2)
0.943(3)
21(1)
C6
0.7824(3)
0.284(2)
0.783(1)
21(1)
C7
0.8741(3)
0.298(2)
0.752(1)
21(1)
O2
0.9091(5)
0.511(3)
0.692(3)
21(1)
O3
0.9179(6)
0.104(3)
0.783(3)
21(1)
The phenol rings point out perpendicular on both sides from of the layer
formed by the NaO6 prisms in an alternating way (Fig. 8.1). There they are
rotated in different directions by ±29.1(3)° relative to the ab-plane. The carboxyl
group is twisted by 17.5(3)° relative to the phenol ring. This dihedral angle is
somewhat larger than observed for other substituted benzoic acids (1.8-5.0°) and
one of their salts (9.5°).
70
Fig. 8.2:
8 Description of the structure of Na-para-hydroxybenzoate
Coordination polyhedron of sodium in sodium-para-hydroxybenzoate. Left:
bond lengths between the cation and the oxygen atoms in Å (viewed along c
axis). Right: heights in Å measured from the bc plane through the cation.
This can be explained by steric requirements of the sodium atom, which
result in the connection of the NaO6 prism, and which are probably one of the
causes for the severe strain evident in the anisotropic powder diffraction profile
broadening (Figs. 2.2, chapter 6.8).
Tab. 8.2:
Selected bond-distance ranges and intramolecular distances of sodiumpara-hydroxybenzoate as compared to literature values in Å. Esd’s are a
factor of six larger than Rietveld statistical estimates, as discussed in
Langford & Louër (1996).
Sodium-parahydroxybenzoate
3.595(5)
Na-Na (short.)
2.34(1)..2.64(1)
Na-O
2.869(6)
Na- C (shortest)
2.81(4)
Na- H (shortest)
1.38(1)
C-O (phenolic)
1.26(2), 1.30(2)
C-O (carboxyl)
1.391(4)
C-C (phenyl)
1.485(6)
C(phenyl)-C(carboxyl)
0.99(4)
C-H (phenyl)
H-H (shortest interchain) 2.2(2)
2.22(1)
O-O (shortest carboxyl)
O-O (shortest phenolate) 2.979(6)
1.1(2)
O-H
1.9(1)
H..O (hydrogen bond)
Literature values of
related compounds
2.330..2.592
1.357..1.385
1.228, 1.322
1.385..1.395
1.475
0.98
0.84
1.73..2.01
The molecular structure is held together by van der Waals forces between
phenyl groups of different layers and additional hydrogen-bridge bonding
between the phenolate oxygen atoms.
GSAS practical guide
71
All intra- and intermolecular distances agree well with the literature
(Table 8.2).
8.3
Visualization of the anisotropic strain tensor
GSAS does not offer a visualization of the internal strain distribution as
derived from the anisotropy of the FWHM (see chapter 6.8). A 3-dimenensional
strain representation can be achieved using a graphically oriented math program
like MATHCAD (Trademark of MathSoft Inc.). In the following, a complete
Matchcad script is given (courtesy of Bob Von Dreele) for calculation and
graphical representation of the 3-dimensional strain distribution as derived from
the refined coefficients Shkl of the anisotropic FWHM (Tab. 8.3). The script is
applicable to all Laue groups and can be run with the MATHCAD 7 EXPLORER
(Trademark of MathSoft Inc.) which is available free of charge from Mathsoft
Inc. Modifications to the script can not be saved.
The script consists of several parts which will be listed in he following
(chapter 8.3.1-6). It is more or less self explanatory.
8.3.1
Input of Laue group, monoclinic axis and lattice parameters
Choose Laue group:
Triclinic = 1
Monoclinic = 2
Orthorhombic = 3
Tetragonal = 4
Trigonal = 5
Hexagonal = 6
Cubic = 7
8.3.2
If Monoclinic choose unique axis:
x=1
y=2
z=3
Laue
Input of lattice parameters
Enter lattice parameters (A & deg):
a
16.06411
b
5.383797
c
3.639085
α
90
β
92.8735
γ
90
α
α.
β
β.
γ
π
γ.
180
π
180
π
180
2
Maxis
2
72
8 Description of the structure of Na-para-hydroxybenzoate
8.3.3
Input of the anisotropic strain coefficients Shkl.
Enter Shkl coefficients:
S400
4
2.893.10 S022
1
5.482.10
S031
0
S040
2
3.044.10 S202
1
3.411.10
S103
1
1.02.10
S004
2.041
2
1.018.10
S310
0
S013
0
S301
2.69.10
S130
0
8.3.4
S220
2
S211
0
S121
2
2.236.10
S112
0
Definition of the metric tensor and the crystal ! cartesian
transformation matrix
Define inverse metric tensor:
a
a .b .cos ( γ ) a .c .cos ( β )
2
a .b .cos ( γ )
g
b
b .c .cos ( α )
2
a .c .cos ( β ) b .c .cos ( α )
ca
c
sa
1
g
1
2
G1 , 2
G1 , 1 .G2 , 2
G
ca
2
Define crystal to cartesian transformation matrix
1
a 0 0
A
0 b 0
B
0 0 c
Define D-spacing
0
cos ( γ ) sa .sin( γ )
cos ( β )
M( H )
0
T
H .G.H
0
ca .sin ( γ )
sin ( β )
L
T
( A .B )
GSAS practical guide
8.3.5
73
Calculation of the hkl depenent microstrain broadening
Define Peter Stephen's function for microstrain broadening
σM ( H )
h
H0 , 0
k
H0 , 1
l
H0 , 2
4
4
4
2 2
2 2
2 2
S400 .h
S040 .k S004 .l 3 . S220 .h .k S202 .h .l S022 .k .l ...
if Laue 1
3.
3
3.
3
3.
3
.
.
.
.
.
.
.
.
.
.
+ 2 S310 h k S103 h l S031 k l S130 h k S301 h l S013 k l ...
2
2
2
+ 3 . S211 .h .k .l S121 .h .k .l S112 .h .k .l
if Laue 2
4
4
4
2 2
S400 .h
S040 .k S004 .l 3 . S220 .h .k
3
3
2
3 .S211 .h .k .l
+ 2 . S031 .k .l S013 .k .l
2 2
S202 .h .l
2 2
S022 .k .l ... if Maxis 1
S040 .k S004 .l
S400 .h
3
3
+ 2 . S301 .h .l S103 .h .l
4
2 2
3 . S220 .h .k
2
3 .S121 .h .k .l
2 2
S202 .h .l
2 2
S022 .k .l ... if Maxis 2
4
4
4
S400 .h
S040 .k S004 .l
3
3
+ 2 . S310 .h .k S130 .h .k
2 2
3 . S220 .h .k
2
3 .S112 .h .k .l
2 2
S202 .h .l
2 2
S022 .k .l ... if Maxis 3
4
S400 .h
4
S040 .k
4
S004 .l
4
S400 . h
4
k
S400 . h
4
k
S004 .l
4
4
4
2 2
3 .S202 . h .l
4
3
h .k
2 2
3 . S220 .h .k
h .k
3
2 2
h .k
2 2
S202 .h .l
2 2
k .l
4
4
k
4
l
2 2
S220 .3 . h .k
S004 .l
2 2
3 .S202 . h .l
4
2 2
h .k
2 2
k .l
2
3 .S211 . h .k .l
2 2
k .l
Then the H dependent µstrain is (in units of 10-6 ):
8.3.6
0 .. 60 φ i
π
6 .i .
0 .. 60
j
180
Xi , j
sin φ i .sin ψ j
Ii , j
Xi , j Yi , j Zi , j
Xi , j
Xi , j .Pi , j
Yi , j
j
cos φ i .sin ψ j
Ii , j
Yi , j
ψ
S( H )
Yi , j .Pi , j
Ii , j .L
Pi , j
Zi , j
3 .j.
2
h .k .l
2
h .k . l
if Laue 7
π . σM ( H )
1.8 .M ( H )
Calculation of the three dimensional representation of the
anisotropic micro strain
i
if Laue 3
2 2
3 .S220 .h .k if Laue 4
4
4
4
2 2
2 2
2 2
S400 . h
k l
3 .S220 . h .k h .l k .l
3
3
3
3
3
3
+ 2 .S310 . h .k h .k h .l h .l k .l k .l
S400 . h
2 2
S022 .k .l
π
180
Zi , j
S Ii , j
Zi , j .Pi , j
cos ψ j
if Laue 6
2
h .k .l ... if Laue 5
74
8.3.7
8 Description of the structure of Na-para-hydroxybenzoate
Graphical representation of the micro strain in the crystal lattice
Fig. 8.3:
3-dimenisonal strain distribution of sodium-para-hydroxybenzoate. The xaxis is horizontal, z-axis vertical and the y-axis out of the paper. The scale
is in δd/d*10-6 strain.
Tab. 8.3:
Refined profile and strain parameters corresponding to profile function No
4 in the Rietveld refinement program GSAS.
U=V=W
P [cdeg]
X [cdeg]
ζ
S400
S040
S004
S220
S202
S022
S301
S103
S121
0
0.1
.432
.6657
0.000224(7)
0.0222(9)
1.64(2)
0.0084(2)
0.274(4)
0.433(8)
0.0203(8)
0.08(1)
0.0224(?)
GSAS practical guide
9
75
References
Behr, A. (1985). Chem.-Ing.-Tech. 57, 11, 893-903.
Brockhaus ABC Chemie, Band 1 A-K, VEB F. A. Brockhaus Verlag Leipzig
1971, p. 565.
Cascarano, G, Favia, L. & Giacovazzo, C. (1992). J. Appl. Cryst. 25, 310-317.
Colapietro, M. & Domenicano, A. (1977). Acta Cryst. B33, 2240-2243.
Colapietro, M. & Domenicano, A. (1978). Acta Cryst. B34, 3277-3280.
Colapietro, M., Domenicano, A. & Ceccarini, G. P. (1979). Acta Cryst. B35,
890-894.
Colapietro, M., Domenicano, A. & Marciante, C. (1979). Acta Cryst. B35, 21772180.
Dinjus, E., Kunert, M., Nauck, M. & Sieler, J. (1997). Chem. Ber., in press.
Dinnebier, R. E., Pink, M., Sieler, J. & Stephens, P.W. (1997). Inorg. Chem. 36,
3398-3401.
Dinnebier, R. E., Von Dreele, R., Stephens, P. W., Jelonek, S. & Sieler, J. (
1999), J. Appl. Cryst. 32, 761–769.
Doedens, R. J. (1970). In Crystallographic Computing (ed. By F. R. Ahmed),
pp.198-204. Munksgaard, Copenhagen.
Downs, R.T. (1989), Ph.D. thesis, Virginia Tech, Blacksburg Va 24061 USA.
Finger, L. W., Cox, D. E. & Jephcoat, A. P. (1994). J. Appl. Cryst. 27, 892-900.
Goldstein, H. (1980). Classical Mechanics, (Addison Wesley, Reading) - ISBN
0-201-02918-9.
Hales, J. L., Jones, J. I. & Lindsey, A. S. (1954). J. Chem. Soc., 3145-3151.
Harris, K. D. M. & Tremayne, M. (1996). Chem. Mater. 8, 2554-2570.
Heath, E. A., Singh, P. & Ebisuzaki, Y. (1992). Acta Cryst. C58, 1960-1965.
Jörchel, P. & Sieler, J. (1994). Z. Anorg. Allg. Chem. 620, 1058-1062.
Keller, E. (1997). SCHAKAL97, Kristallographisches Institut der Universität,
Freiburg, Germany.
Kolbe, H. J. (1874). Prak. Ch. 118, 107.
Kolbe, H. J. & Lautemann, E (1860). Liebigs Ann. Chem. 115, 157.
Langford, I. & Louër,. D. (1996). Rep. Prog. Physics 59, 131.
76
9 References
Larson, A.C. & Von Dreele, R.B. (1994). GSAS. Los Alamos National
Laboratory Report LAUR 86-748. (Used version: August 1997).
Leach, A. R. (1996). Molecular Modelling: Principles and Applications, Addison
Wesley Longman Limited, England.
LeBail, A., Duroy, H. & Fourquet, J.L. (1988). Mat. Res. Bull. 23, 447-452.
LeBail, A. (1992). Accuracy in Powder Diffraction II: Proceedings of the
International Conference May 26-29, 1992. Edited by Prince, E. & Stalick,
J. K. NIST Special Publication 846 (U.S. Government Printing Office,
Washington, DC), 142-153.
Lengauer, C. L., Tillmans, E., Zemann, J. & Robert, J.-L. (1995) Z. Krist. 210,
656-661.
Lightfoot, P., Metha, M. A. & Bruce, P.G. (1993). Science 262, 883-885.
Lindsey, A. S. & Jeskey, H. (1957). Chem. Rev. 57, 583-620.
Manojlovic, L. (1968). Acta Cryst. B24, 326-330.
Masciocchi, N & Sironi, A, J. Chem. Soc. Dalton Trans. 1997, 4643-4650.
Mehrotra, B. N., Hahn, Th., Eysel, W., Röpke, H. & Illguth, A. (1978). N. Jb.
Miner. Mh. H. 9, 408-421.
Popa, N. C. (1998). J. Appl. Cryst. 31, 176-180.
Poojary, D. M. & Clearfield, A. (1997). Accounts of Chemical Research 30, 414422.
Rietveld, H.M (1969). J. Appl. Cryst. 2, 65-71.
Rodríguez-Carvajal, J. Fernández-Díaz, M. T. & Martínez, J. L. (1991). J. Phys.:
Condens. Matter 3, 3215-3234.
Rodríguez-Carvajal, J. (1990). Abstracts of the Satellite Meeting on Powder
Diffraction of the XV Congress of the IUCr, Toulouse, France, 127.
Sakakibara, T. & Haraguchi, K. (1980). Bull. Chem. Soc. Jpn. 53, 279-280.
Scheringer, C (1963). Acta Cryst 16, 546-550.
Schmidt, M. W., Finger, L. W., Angel, R. J. & Dinnebier, R. E. (1998). Am.
Mineral. 83, 881-888.
GSAS practical guide
77
Smith, G. S., Johnson, Q. C., Smith, D. K., Cox, D. E. & Zalkin, A. (1988). Solid
State Comm. 67(5), 491-494.
Stephens, P. W. (1999). J. Appl. Cryst. 32, in the press.
Thompson, P., Cox, D. E. & Hastings, J. B. (1987). J. Appl. Cryst. 20, 79-83.
Thompson, P., Reilly, J. J. & Hastings, J. B. (1987). J. Less Common Metals
129, 105-114.
Ungar, T. & Tichy, G (1999), Physica Status Solidi A171, 425-434.
Visser, J.W. (1969). J. Appl. Cryst. 2, 89-95.