1
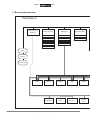
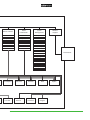
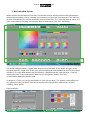
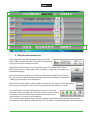
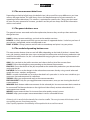
PressView 3 user manual
Introduction:
Thank you for using PressView, the all-in-one color quality control software product.
All PressView users have one thing in common: they all want to measure color and analyze how the
color is behaving on a particular substrate.
It is our goal to give you the maximum amount of information of a specific color, but on such a way
that you intuitively understand the status of your measured color and know what to do to improve
the situation. With PressView you are now able to setup a completely new and reliable system for
managing color, from the defenition of your own custom color strip to even closed-loop color
control.
We hope that PressView suits your company to a level beyond satisfaction. If you have questions or
suggestions about PressView, please feel free to contact your local PressView reseller or Colorware
directly. For additional information, like specific technotes or update information, on PressView,
please take a look at www.colorware.eu
We wish you a lot of fun, profit and success with PressView.
The Colorware team
2
- PressView 3 User Manual v6.0 -
Index
1.1 Basic system overview
1.2 Client-server setup
1.3 Measurement devices
1.4 Color strips
.................................................................4
.................................................................6
.................................................................7
.................................................................7
2 PressView client login
.................................................................8
3 Basic window layout
................................................................
3.1 The job information area . . . . . . . . . . . . . . . . . . . . . . . . . . . . . . . . . . . . . . . . . . . . . . . . . . . . . . . . . . . . . .
3.2 The measurement detail area . . . . . . . . . . . . . . . . . . . . . . . . . . . . . . . . . . . . . . . . . . . . . . . . . . . . . . . . . .
3.3 The generic buttons area . . . . . . . . . . . . . . . . . . . . . . . . . . . . . . . . . . . . . . . . . . . . . . . . . . . . . . . . . . . . . .
3.4 The module depending butoons area. . . . . . . . . . . . . . . . . . . . . . . . . . . . . . . . . . . . . . . . . . . . . . . . . .
10
11
12
12
12
4 Process control module . . . . . . . . . . . . . . . . . . . . . . . . . . . . . . . . . . . . . . . . . . . . . . . . . . . . . . . . . . . . . . . .
4.1 Process control: exploring this module in 10 steps . . . . . . . . . . . . . . . . . . . . . . . . . . . . . . . . . . . . .
4.2.1
step 1:
Connecting a device . . . . . . . . . . . . . . . . . . . . . . . . . . . . . . . . . . . . . . . . . . . .
4.2.2
step 2:
Calibrating a device. . . . . . . . . . . . . . . . . . . . . . . . . . . . . . . . . . . . . . . . . . . . .
4.2.3
step 3:
select a client . . . . . . . . . . . . . . . . . . . . . . . . . . . . . . . . . . . . . . . . . . . . . . . . . .
4.2.4
step 4:
select a job . . . . . . . . . . . . . . . . . . . . . . . . . . . . . . . . . . . . . . . . . . . . . . . . . . . . .
4.2.5
step 5:
Ajusting the job view . . . . . . . . . . . . . . . . . . . . . . . . . . . . . . . . . . . . . . . . . . .
4.2.6
step 6:
Measuring. . . . . . . . . . . . . . . . . . . . . . . . . . . . . . . . . . . . . . . . . . . . . . . . . . . . . .
4.2.7
step 7:
Gamut view . . . . . . . . . . . . . . . . . . . . . . . . . . . . . . . . . . . . . . . . . . . . . . . . . . . .
4.2.8
step 8:
Dotgain view . . . . . . . . . . . . . . . . . . . . . . . . . . . . . . . . . . . . . . . . . . . . . . . . . . .
4.2.9
step 9:
Quick spot measurement . . . . . . . . . . . . . . . . . . . . . . . . . . . . . . . . . . . . . . .
4.2.10 step 10:
evaluating trends . . . . . . . . . . . . . . . . . . . . . . . . . . . . . . . . . . . . . . . . . . . . . . .
4.2.11: Ink zones
................................................................
14
15
15
15
15
16
16
17
20
21
22
22
24
5 system management module . . . . . . . . . . . . . . . . . . . . . . . . . . . . . . . . . . . . . . . . . . . . . . . . . . . . . . . . . . . . . 28
6 Multi spot module
. . . . . . . . . . . . . . . . . . . . . . . . . . . . . . . . . . . . . . . . . . . . . . . . . . . . . . . . . . . . . . . . 29
7 spot color tool module
. . . . . . . . . . . . . . . . . . . . . . . . . . . . . . . . . . . . . . . . . . . . . . . . . . . . . . . . . . . . . . . . 32
8 Proof certification module . . . . . . . . . . . . . . . . . . . . . . . . . . . . . . . . . . . . . . . . . . . . . . . . . . . . . . . . . . . . . . . . 33
9 Color libraries module
. . . . . . . . . . . . . . . . . . . . . . . . . . . . . . . . . . . . . . . . . . . . . . . . . . . . . . . . . . . . . . . . 34
10 Advanced statistics module . . . . . . . . . . . . . . . . . . . . . . . . . . . . . . . . . . . . . . . . . . . . . . . . . . . . . . . . . . . . . . . 36
11 remote support module . . . . . . . . . . . . . . . . . . . . . . . . . . . . . . . . . . . . . . . . . . . . . . . . . . . . . . . . . . . . . . . . 38
12 setting up a new job
. . . . . . . . . . . . . . . . . . . . . . . . . . . . . . . . . . . . . . . . . . . . . . . . . . . . . . . . . . . . . . . . 39
13 Defining a custom color strip . . . . . . . . . . . . . . . . . . . . . . . . . . . . . . . . . . . . . . . . . . . . . . . . . . . . . . . . . . . . .
13.1 Adding an extra channel . . . . . . . . . . . . . . . . . . . . . . . . . . . . . . . . . . . . . . . . . . . . . . . . . . . . . . . . . . . .
13.2 Managing inkzones . . . . . . . . . . . . . . . . . . . . . . . . . . . . . . . . . . . . . . . . . . . . . . . . . . . . . . . . . . . . . . . .
13.3 Gray balance patches . . . . . . . . . . . . . . . . . . . . . . . . . . . . . . . . . . . . . . . . . . . . . . . . . . . . . . . . . . . . . . .
- PressVIeW 3 User MAnUAl v6.0 -
44
46
47
47
3
www.
.eu
1.1 Basic system overview
PressView 3
Advanced
Statistics
Color Libraries
Multi Spot
Spot Color Tool
New
Measure
Reference
Edit
Delete
Sample
Delete
New
Add
View
Copy/Move
Home
Devices
Print screen
Jobs
4
Gamut
Process
Spot
Trends
Colorbooks
Search
Statistics
Scatter
view
- PressView 3 User Manual v6.0 -
Process Control
Proof
Certification
System
Management
Job info
Job info
Companies
Duplicate
Duplicate
Users
Measure
Measure
User groups
Delete
Delete
Machines
New
New
Color strips
View
View
References
Remote
Support
Spot color books
Teamviewer
Conditions
Paper types
Ink sets
Tolerance sets
Clients
Job presets
Jobs
Print Report
Measure
Previous
Next
List view
Raw list
Ink zones
Dotgain
Export
- PressView 3 User Manual v6.0 -
5
www.
.eu
1.2 Client-server setup
All measurements and other created data is always stored on a PressView server. This server either
runs on your local system or , depending on the configuration, is situated somewhere on your lAn
(local Area network).
Because all data is stored on a server, you don’t have to perform separate saving-actions during
production. Another advantage of having a server is ‘global accessability’. This means that all data
can be viewed, used or interchanged with any PressView-workstation anywhere else in the world.
Off course the server needs to be connected to the internet and it has to run PressView client with valid
credentials.
To make sure your data stays safe, have your administrator add the PressView server to the backup
routine.
Internet cloud
PressView
Server
Intranet lAn
PressView
Server
PressView
Client
6
PressView
Client
PressView
Client
- PressVIeW 3 User MAnUAl v6.0 -
PressView
Client
PressView
Mobile
1.3 Measurement devices
PressView connects directly to most commonly used spectral measurement devices. New devices are
added on a regular base. Today we support the following devices:
• X-Rite EyeOne
• X-Rite IntelliTrax
• X-Rite 530 & 939
• Techkon SpectroDens
• Techkon SpectroDrive
• Techkon SpectroJet
• Techkon RS800
PressView is able to import and present data from various other brands, like Komori and Heidelberg
(Image Control) for correct quality control.
1.4 Color strips
PressView is very flexible and is able to measure nearly any color bar that you can measure with your
device. The system supports many color bars out of the box and you can create your custom color
bar definitions from within the Management module.
- PressView 3 User Manual v6.0 -
7
www.
.eu
2. PressView client login
When you launch PressView for the first time, click on ‘Advanced options’ and provide the proper IP
address of the PressView server (e.g. http://192.168.56.101)
By default, the username/password ‘colorware/colorware’ or ‘pv/1234’ can be used to login to the
system.
login
After you click ‘login’ the system tries to connect to all installed devices, which might take a few
seconds. If the login procedure is successful you are taken to the main (Home) view of PressView.
Depending on your license level and installed features different modules can become visible.
Pro Packaging (all modules)
8
- PressVIeW 3 User MAnUAl v6.0 -
Now, let’s see what this software can do
note
From this point on, this manual is going to take you for a ride through all modules of PressView 3
Pro Packaging. The modules will be treated in the order in which they are numbered in the Home
window below.
7
6
3
2
1
5
4
8
Usermanual module order
To get to know PressView more easy, we have printed a special sheet called “PressView
Color Bar Sampler”. This Color Bar Sampler contains a number of sample jobs for you to
measure with PressView. Based on job number one (Print quality analisys), we will take
you through the Process control module. If you do not have a PressView Color Bar Sampler
sheet available, ask your local reseller for one.
Color Bar sampler
- PressVIeW 3 User MAnUAl v6.0 -
9
www.
.eu
3. Basic window layout
Before we dive into the depts of PressView, we feel the need to explain the ‘common interpretation
method’. Most modules start by showing you an overview of jobs and measurements. This overview
contains all available jobs and corresponding measurement data. This is also the place to start a new
job or measurement. Viewing measurement data in detail needs a bit more explaining.
1
2
3
4
Gamut view
The above example displays a typical measurement result window. All the details of a job can be
derivated from this single view. (In this case, you are looking at measurement results of a job without
ink zones). First you need to know that the window is devided into four separate areas. 1) the ‘job
information area’, 2) the ‘measurement detail area’, 3) the ‘generic buttons area’ and
4) the ‘module depending buttons area’.
Onpagenr.11(top),youseethejobdetailesofajobwithinkzones.Thisappearstobedifferentat
first glance, but now you know more about the common interpretation method, this window
suddenly seems similar.
Otherexamples:
10
- PressVIeW 3 User MAnUAl v6.0 -
1
2
3
4
Ink zone view
3.1 The job information area
In the upper area, the job information area, you first see
(left to right) a concise job label. This label is clickable and
brings you to the job settings overview.
Rightofthejoblabel,thereisthe‘OKsheet’button.Thisbuttonsetsorunsets
theOKsheetstatus.Switchingthestatusisdonebyasingleclick.Therewillbeno
confirmation popup.
NexttotheOKsheetbutton,youwillfindthe‘Productionmode’button.Thisbutton sets and shows the production mode per seperate measurement. If the button
is dark gray, the mode is set to production.
The Densities button makes it able to adjust the densities for the job at hand. By clicking
this button you will reach a new area for customizing the densities per run color.
last, but not least in the job information area, you see the ‘score
overview’ at the most right side. The score overview a concise label,
containing a selection of the most valuable information for this
measurement. Is it used as a quick indicator.
This overview -when clicked- shows you the complete collection of measurement values in their
comparison to the reference, called the ‘raw list”. In the raw list, individual patches can be examined.
- PressVIeW 3 User MAnUAl v6.0 -
11
www.
.eu
3.2 The measurement detail area
Depending on the kind of job (ergo, the default view), this area will be set up different as you have
seen on the pages before. This area always shows the detailed content of a measurement in an
appealing and considered way. This window is optimized for specific roles. Things you don’t need
to see as an press-operator for instance, you don’t see. But you can always find all the information
within a mouseclick.
3.3 The generic buttons area
The generic buttons area needs no further explanation, because they are always there and never
change function.
HOME: Is always present and bings you back to the module overview.
DEVICES: Is always present and shows you an overview of supported devices. It also lets you know if
your device is recognized, active and calibrated or not.
PRINT SCREEN: Is always present and will make a screendump and prints it to your printer.
3.4 The module depending buttons area
This area contains buttons that can and will differ, depending on the kind of job that is viewed. Not
every job vieuwing needs the same views to interpret the information and not every production role
needs aal the information. So, this is all considered for enjoying the most optimal representation of
measurement data.
JOBS: Gets you back to the joblist overview and selects the first job of the current client
GAMUT: Shows the colorgamut corresponding to the selected measurement.
PROCESS: Shows the details of the job, compared to the standard for production you selected when
setting up the job.
DOTGAIN: Focusses on the dotgain in the selected measurement. Hereby using several advanced
graphs for curves, numbers and gamuts.
SPOT: Is a quick and reliable way to analyse the details of a spot color. Its is also most suitable to just
measure a spot and compare it to a reference.
TRENDS: Helps you compare and analyse the measurementdata.
PREVIOUS/NEXT: Only lets you toggle between measurements, once you are viewing the details of
a measurement.
MEASURE: Both buttons add measurements for the selected job. Your measurement device needs to
be connected! The Measure button on the right hand side will only activate when details of a
measurement are viewed.
IMPORT: Import external data. For instance from other quality control systems
EXPORT: Helps you to export measurementdata in various selectable formats.
Obviously, this is not all the functionality Pressview has to offer. These are just most of the buttons which
are regularly present, if not always present.
Other -equally important- functionality will be explaind in the rest of the manual.
12
- PressView 3 User Manual v6.0 -
Exploring the modules
- PressView 3 User Manual v6.0 -
13
www.
.eu
4. Process control module
The Process control module is the foundation of PressView3.
Itholdsahudgenumberoffeatureslike;Jobsetup,addingcustomcolors,procescolorsequence,
dataanalysis&correction.So,whateveryouwanttodowithPressView,itmostlikelystartswiththe
Process control module.
Process control opening window
14
- PressVIeW 3 User MAnUAl v6.0 -
4.1 Process control: exploring this module in 10 steps
note
You now need:
- A running version of PressView3
- A connected measurement device
- A Color bar sampler
4.1.1 step 1: Connecting a device
Click the icon for ‘Devices’ and select your device.
Check if your device is recognized by the software.
It should display a checkmark.
In the ‘Devices overview’ is a button for options. You can use this
feature to select the way you want your device to work. ‘spot’ or
mostly used ‘strip’
4.1.2 step 2: Calibrating a device
If the device is connected, click on ‘Calibrate’
Depending on the device, the calibration wissard will first calibrate
onthetile,followedbyapaperwhitecalibration.Oncebothare
calibrated succesfully, you can continue.
Compatible devices
4.1.3 step 3: Select a client
Click the icon for Process Control and select ‘Colorware’ for client. When PressView
is just installed and activated, the Client-list
only contains “Colorware” as a client.
selected job
- PressVIeW 3 User MAnUAl v6.0 -
15
www.
.eu
4.1.4 step 4: Select a job
select the demo job, Print quality analysis (job nr. 1). The right side of the window now contains the
demo measurements belonging to this job.
This demo job is a good example for checking the quality of your pressrun during production. We
can simulate this by using the Color Bar sampler.
Measurement list
4.1.5 step 5: Ajusting the job view
The headers of the measurement columns are width-adjustable (hover over column edges and drag)
selecting a measurement
OnceyouhavebeenworkingwithPressViewandthenumberofclients,jobsandmeasurementsis
growing, the importance of the filters grows. Click on the colomnheader of your choise. If a filter is
enabled, the colomnheader is marked with a little white arrow.
Filter enabled
16
- PressVIeW 3 User MAnUAl v6.0 -
4.1.6 step 6: Measuring
Use the ‘Measure’ button to measure the eCI GrayCon Mi1, situated on the upper left side of
the Color Bar sampler. This Color Bar is marked as ‘1’.
note
If you are measuring with the Eye One Pro, use the ruler to get this measurement done.
If you are using another measuringdevice, you might want to cut the color bar out first.
Onceyoucompletedthemeasurement,themeasurementdataisshowninanewwindow,
the ‘Gamut window’. At the top of the Gamut window you see measurement 18 of 18, the
measurement you just did.
With this window you are able to
analyse the measurement information in the blink of an eye.
Top left -the ‘banner’ bar- displays the job
information. By clicking this, you are able to
change job information.
TheOKsheetbuttonletsyouknowthat
thereisnoOKsheetselectedyet.Whenthis
button is clicked on, the current measurementisusedfortheOKsheet.Hitthisbutton
again to undo.
Gamut window
The button for job mode holds two stages: ‘Make ready’ and ‘Production’.
For every measurement you can select the preferred mode.
The upper right side of the window can be seen as a clickable ‘quick reference’. It shows the summary
and score of the combined information of the measurement.
The bigger spectrum frame on the left holds the information about the actual color range compared
to the given reference. The smaller spectrum frames compare the measured colors for Paper, Highlights, Midtones and shadows against the reference, marked by the center of the crosswire.
All density data, shown in this window, is based on the density values you defined when setting up
the job. (In this case, the values we defined for this job)
Changing these values can be done by clicking on this button. Changing the desity values will not
have any effect on the spectral references.
TVI (Tone Value Increase) information is -just like the solids information- shown in columnstatistics.
These statistics all show dotted lines. These dotted lines indicate the delta, based on the industry
standard you are using (in this case CIe 76).
- PressVIeW 3 User MAnUAl v6.0 -
17
www.
.eu
ThecolorpatchesforSolid,Overprint,Paper
and Balance are all clickable.
In this view they show you the measured
Delta e and the ‘pass’ or ‘fail’
comparedtoISOCoatedv2.
Clickable patches
Clicking on one of the patches brings you to a more detailed view of -in this case- magentha. The
measured color is broken down to various values. you are also able to measure this specific color
again.
note
This is the first time we encounter the ‘Lightness’ column. For most people the way it displays the
lightness (top = black, bottom = white), is the correct way. Because we believe there is no correct
way, we made it possible to switch this view. To do so, contact your reseller.
In the CIe-lab frame, the bottom right corner of the frame, a ‘zoom’ symbol is placed. By clicking this
symbol, you will zoom out for a gamut overview .
Patch details
Patch details zoomed in
In the ‘zoomstage’ you will see four new indicators, four white lines. The first white line is the line
connected to the white dot (witch represents the measured color).
The T-crossing of this line is the reference l-value. The other white line, the one connected to the
center of the inner and outter circle shows the direction in witch magentha is placed within the
CIe-lab spectrum.
Delta-e is actually a 3D ellipsoid, composed of l, a and b. The thinner white line is your max delta-e
(4.00), when there is no delta-l. Because the device measured a delta-l of -2.27, the inner white line
(thick) represents the concavity of the 4.00 delta-e ellipsoid.
When delta-l is extreme (mutch darker ór lighter), the inner white line could not even be shown at
all. You can experience a 2D ‘spot on’, but a fail on the actual patch, because is it outside of the ellipsoid.
18
- PressVIeW 3 User MAnUAl v6.0 -
Pass
Fail
2D
representation in
PressView
darker
3D
drawing of the
actual ellipsoid
∆-l = 0
lighter
∆-Eellipsoid&2DPressView
The above feature shows two spots (pass and fail). even though the fail-spot falls within the 2D circle,
the spot is a fail, because it is outside of the ellipsoid.
This can be confusing when examining measurements, so always take the l-value in consideration
first.
In this case both C and M are in the upper half of the ellipsoid, meaning that they are both darker
than the reference.
The spot M and spot C in the drawing approximately refer to the spot M on the previous page and
the spot C on the next page.
- PressVIeW 3 User MAnUAl v6.0 -
19
www.
.eu
Onceexaminingapatch,boththespectrumframeviewandthedetailframeviewhaveasecondtab.
This second tab shows a 2D remission curve of the measurement.
remission curve
situated at the lower right side of the gamut window, the ‘raw list’ button gives you access to all the
measured color information in a raw format. By selecting a color, you can examine this specific color
in the way we just did with solid M.
Patch examination
note
Compare the diameter of the inner white circle of this cyan with the diameter of the inner white
circle of the magentha. The cyan is a fail, mostly because of it’s delta-L.
4.1.7 step 7: Gamut view
Click on the ‘Process’ icon. The window that appears -see next page- is a simplified version of the
gamut view. It’s purpose is mutch more for the press operator.
The press-operator just wants the basics to look at during the run. Therefore, this is a static window.
Outsidethebannerbaratthetopandthebuttonbaratthebottom,thiswindowdoesnotcontain
any other clickable elements. Based on only this view, the make ready-time can be shortened and
color control will increase during production.
20
- PressVIeW 3 User MAnUAl v6.0 -
Gamut view
4.1.8 step 8: Dotgain view
Click on the ‘Dotgain’ icon. You can analyse the four solids dotgain, dot size and CTP curve.
The axel graph shows the actual curve for
the selected solid. The black line represents the measured color and the white
line represents the reference curve.
By clicking on the different tabs of the
lower left frame, you can toggle between
different combinations of information.
The raw data of the lower right frame
corresponds with the selected solid on
the left side frame. This goes back and
forth. You can use the solids tabs at the
right side frame to do exactly the same.
Dotgain C TVI
Dotgain K Dot size
- PressVIeW 3 User MAnUAl v6.0 -
Dotgain Y CTP
21
www.
.eu
4.1.9 step 9: Quick spot measurement
The Button for ‘spot’ is just a small -quick check- feature. It is meant to let you do some spot measurements as an additional check. Hit the button ‘spot’ and find yourself in the below window. If your
device is still properly connected, you can start measuring. In any other case, you first have to connect and calibrate your device. First measure a reference, followed bij a sample to compare.
spot measurements
4.1.10 step 10: Evaluating trends
Trends. This part of the Process Control module is most suitable for overviewing measurement
results. Working with different dropdown menus, you can setup this screen is various preferred
combinations.
spot measurements
22
- PressVIeW 3 User MAnUAl v6.0 -
Trends information selection
The two red lines in the dotgain graph show
you the max delta-e.
The little white dots in the colored, spiked
lines are the measurements.
Thewhitedotsareclickable.Onceclicked
on a white dot, you will see the vertical black
line snap to the same position. Use ‘View’
to look at the details of the selected white dot (measurement). If you use a 5-th (or more) color, this
would be in this the graph as well.
Click on the ‘show colors’ patches at the bottom of the window to deselect or select. All run-colors
are shown by default.
Use the second tab in this
window to see the averages
over all the measurements
for this job. Hover over a
knot in the curve to see the
exact measured value.
The checkbox above the
graph acts like a filter. In this
case there are 17 make ready
measurements. not mutch
average when unchecked...
TrendsaverageDotgain&CTP
- PressVIeW 3 User MAnUAl v6.0 -
23
www.
.eu
4.1.11 : Ink zones
The past 10 steps have guided you through almost all windows of the Process
Control module, almost all.... There is still one left...’Ink Zones’.
The job we started at the beginning was based on print quality analysis, a job
without inkzones in the color bar.
When measuring a color bar containing inkzones, the software automatically gives you another
window setup. The Process button changes to an Ink zones
button, witch opens by default.
To view this window, go back to the jobs overview and select a random measurement from the
Process control demo job (2). Hit ‘View’ to get to the Ink zones window.
Ink zones window
The vertical (white overlay) detail ruler is present by default, but can be hidden by clicking on the
upper right arrow of the detail ruler itself. When present, the detail ruler can be dragged to the
inkzone you prefer to examine. You can only use the white transparant area’s of the detail ruler to
drag it!
Clicking in the inkzone
itself will do the same
trick, the detail ruler will
move itself to the clicked position / inkzone.
ruler state: present
24
- PressVIeW 3 User MAnUAl v6.0 -
ruler state: hidden
When the detail ruler is present, it shows you the detail information about the inkzone per run color.
By clicking on the detail information buttons, you will see an
already known window containing the specific color information.
Color detail window
The‘Ref’buttononthedetailrulerismainlyusedbeforeassigninganOKsheet.Thegoalforthis
button is to be able to ajust to a -or multiple- specific inkzone(s).
set the ruler to the inkzone of your preference -probably your clients preference- and click on the ‘ref’
button. You will see the next window.
Custom reference window
- PressVIeW 3 User MAnUAl v6.0 -
25
www.
.eu
say, inkzone 21 is the way you would like your oragne spot to be. To ajust to these values, set the
ruler to this inkzone and click on the ‘ref’ button. Check the checkbox for the orange spot and click
‘OK’.
SpotorangeBEFOREcustomreference
spot orange AFTer custom reference
In this case we have only checked spot orange, so only the values for this spot will be recalculated.
You can see the difference in the images above. Based on the ‘new’ values, you can start to adjust the
other inkzones to inkzone 21.
Use the ‘reset all’ button to undo the custom reference.
To get a better, more detailed overview of a single run color, you can use the bigger information
buttons at the left side of the window.
statistics per run color
26
- PressVIeW 3 User MAnUAl v6.0 -
The Ink zones button icon holds a little black arrow in the upper right corner,
meaning there are options. Click and hold this arrow to see or edit the options for ‘Ink zones’.
Default Ink zone options
Justtoshowyouthedifference,hereisthesamewindow,butwithotheroptions:
Ink zones window, custom options
- PressVIeW 3 User MAnUAl v6.0 -
27
www.
.eu
5. System management module
To manage the system, this module contains all required elements. Adding, deleting and editing
various key-parts of the system, makes sure that all the nessesary information is available.
As an administrator of the PressView system, you are able to set
the rights for all other users. In
order to be able to manage this as
well, PressView provides in a ‘User
groups’ centre. start by making the
preferred user groups, like ‘Demo’,
‘Admin’, ‘regular’ or based on the
buisiness roles. every new user has
to be part of a user group.
This module is ment to organize
thePressViewsystemlocally.Of
course a remote administrator
can make use of the webclient for
configuring the system.
If PressView is part of a network
connected to the internet,
a remote administrator only
has to know the IP-adress of the
PressView server(s), and an valid
Management module
login. Via the web-Management module, various presets can be exported en transferred to other
PressView systems.
note
If the browser window is too small, the actual menu-item information can appear under the
menu on the left side of the window
WebClient Management module
28
- PressVIeW 3 User MAnUAl v6.0 -
6. Multi spot module
Measuring a job without the nessesity of a color strip present. some jobs have no color strip, but
you still have to make sure that the colors are according to standards or the clients wishes. In this
case you can use the Multi spot module. All jobs in this module need to be based on a colorbook for
reference. You will see when you set up a new job.
Preferably you choose solids in the job to measure, no gradients what so ever. Try to choose a
physical spot on the printed object to measure with each pull you do. In PressView, a pull is called a
‘sequence’.
To get a feel for this module, use the four color patch squares, directly under the PressView logo on
the color bar sampler.
When you start this module, you will see a window with a demo-job,
(PV02mediaNOVA).Thisjob
contains two measurements,
a first pull and a second pull.
select the first pull of the
mediaNOVAjobandclickon
the ‘View button’.
scatter View:
As you can see, the ‘scatter
view’ sorts the colors that are
measured for this sequence.
PressView will react on the
amount of measured colors.
You don’t have to add references first, PressView will setup
this window, depending on
the different colors you measure. In this case there are four
specific colors measured.
Multi spot scatter view
looking at a single color; In the color graph part of the window you can
see the amount of measurements for that specific color, each represented by a blue dot in the graph
itself. At the right of every graph there is an average ∆-l indicator.
right of the graphs you will find the sequence information. As mentioned before, a sequence is
exactly the same as a pull, a physical sapmple of the printrun.
Using the add button (+), you can add new sequences. Fill in the right remarks for a sequence to
better track the right measurements at a later point in time. Use the arrows to toggle between
sequences.
Click on one of the graphs for a more detailed overview of the measured physical spots. To examine
a specific measurement, click on a tab-like sample at the lower part of the window. (see next page)
- PressVIeW 3 User MAnUAl v6.0 -
29
www.
.eu
Multi spot color detail
The above window shows all the measured ‘purple-ish’ spots within the first sequence. When a
measurement value is selected from the horizontal, tab-like list, the information for that specific
color is shown.
The selected value corresponds with the white dot in the graph. The graph drawing reads the same
as we have seen earlier in this manual.
Double clicking on a measurement value in the tab-like list, brings forth the spot measurement.
even so does just clicking on the ‘spot’ button at the bottom of the window. However there is one
big difference; double clicking a value brings the values over to the spot measurement. Measuring a
new reference will lead to new
values in this window. This way
you can compare the already
measured values from a pull to
a new sample in a later stage,
for instance.
Using the spot button, the
window will be
without any values. You still
have to measure both reference
as well as the sample.
By selecting ‘Automatic (job)
reference selection’, PressView
referres to an already measured
color in this job. It uses it’s
reference automatically.
Multi spot color detail singled out value
30
- PressVIeW 3 User MAnUAl v6.0 -
so far, you have only seen the scatter view in a four color job setup. To show you the different views
and job setups, here is a preview of a 5C CMC 2:1 job setup.
Because the job is set up
with other standards, the
perfect circular shapes on the
previous pages (CIe 76), have
changed into CMC ellipsoids.
next to that, there are 5 colors
on display. Added to the
known four, notice there is a
spotOrange.
Displaying the same measured
Multi spot scatter view 5C
values, but in an other view: list View.
The list view gives you an ‘at a glance’ overview, when it comes to
‘failing’ values.
When selected, use the ‘Analyse sample’ or double click on a single color (row) to single out the
specific measurement values.
Multi spot list view 5C
note
When measuring for this module, make sure that the device options are set to ‘Spot’.
If device mode is set to ‘Strip’, it won’t measure and will make a higher pitched noise when trying to
measure.
- PressVIeW 3 User MAnUAl v6.0 -
31
www.
.eu
7. Spot color tool module
spot color tool Module: This module is nothing more -and sertainly nothing less- than the spot color
feature within the Process Control module. The fact that is a separate module as well, only has to do
with efficiency.
spot color tool window
note
This module does not hold any measurements. It’s designed to compare against a reference in the
quickest way.
The default window of this module does not contain any information. The above preview is done
using the Color Bar sampler. We used the upper left square of the four bigger squares in the middle
of the sampler.
32
- PressVIeW 3 User MAnUAl v6.0 -
8. Proof certification module
Proof Certification Module: even though parts of the (digital) print market are trying to work without
hard proofs, the bigger part still is. Because of this, PressView contains a special module for checking
your proof.
Thinking outside the box brings us to maybe managing office environments with a strong need for
color accurate reproduction on internal printers. It can be used to verify the accuracy of the printers
themselves, for instance.
Most proofs provide a Mediawedge, just like the demo job PV01. View the measurement or make
oneifyouhaveamediawedgev3atyoudisposal.Ofcourseyoucanalsostartthismoduleby
building your own colorbar.
Again, all te patches are clickable for further examination.
Proof certification windows
- PressVIeW 3 User MAnUAl v6.0 -
33
www.
.eu
9. Color libraries module
The color libraries module holds all color libraries (color books). A color book can be used for a
specific job or it can contain colors needed for reoccuring jobs.
Any other color book can be imported if it is in one of the supported formats:
.CSV/.CGATS/.CXF1/.CXF3/.MIF
Manual input: PressView can only handle CIe-lab information!
Openthemodulebyclickingontheicon.Thewindowinfrontofyoushows’MyDemoColorBook’,
used for explaining the actions in this manual.
select the demo color book,
you will see 5 colors.
This window contains 3 zones:
1) Color book library
2) Color book
3) Color
The buttons at the
bottom of each zone correspond to the zone they are in.
starting a new library is done
in zone 1. simply click on the
+-icon and fill in a name and
choose a dotgain pecentage
preset.
Adding colors to the colorbook you just made, can
ClM Adding a new library
be done in several ways: First you can
compose your own colors. In this case you need the CIe-lab values
of the colors you would want to add to the colorbook. Click on the +-icon for ‘Add’.
Pick a patch type in the
dropdown.
In this case we’ll pick
a solid. Give the new
solid a name and fill in
the values for CIe-lab.
Click ‘save’
ClM Patch type list
34
ClM Adding a new solid
- PressVIeW 3 User MAnUAl v6.0 -
note
The Patch type dropdown menu contains:
Undefined / Solid / Dotgain / SLUR / Balance / paperwhite / BHighlights / BMidtones / BShadows /
Overprint / Other / DotgainOnly
Difference between patch type
selection
ClM Patch type Dotgain
CLMPatchtypeOverprint
ClM new patch added
And second, now the new color is added to the demo color book, we would like to have the same
color in the new color book. select the new color from the ‘My Demo Color book’ and click on the
+-icon for Move/Copy in zone 2.
You can select multiple patches to move at once. In this case, we are just moving the new patch to
the new color book. leave the checkbox unchecked in
order to copy the new patch. If checkbox is checked, the
patch will not be copied, it will be moved. This means
re-moved from the color book of origin!
Use the ‘edit’ buttons to edit the selected
items in the corresponding zones.
ClM Copy or move patches
- PressVIeW 3 User MAnUAl v6.0 -
35
www.
.eu
10. Advanced statistics module
Like the module name already explains, this module can be used for advanced data retrieval, making
use of user friendly database queries.
The advantage of this module comes to life in the middle or bigger production environments.
The more data in the database, the more valuable it becomes.
Beginning with a clean install of PressView, the database does not contain that much measurement
data. Off course you can still search for specific data.
The clean PressView install should contain just one query: ‘ok sheets’.
Run this saved query to find all measurements in the complete database, labelled as an OK sheet.
note
To setup the right query, you can select just one or make a combination of the following terms:
JOB:
Client
Color method is density
Color strip
Description
Dotgain method is density
Ink set
Is production mode
Job strip current end index
Job strip current start index
Last date
Machine
Measurement condition
Measurement type
Name
Number
Ok sheet
Paper
Paper white sample
Reference
Sequence
Sheet number
Tolerance set
User group
CLIENT:
Name
Notes
COLOR STRIP:
Active
Company
Default mapping
Description
Name
Number of zones
Patch height
Patch width
Patches per zone
Repeats
Row count
INK SET:
Active
Name
Shared
MACHINE:
Default tolerance
Machine type
Name
Number of colors
Number of ink zones
Zone width
MEASUREMENT COND.:
Density standard
Dotgain method
Illuminant
Name
Observer angle
Use density poll filter
Use spectral poll filter
White base
OK SHEET:
Content
Created at
Flow change
Is production mode
Is wet
Job
Job strip
Job strip end index
Job strip start index
Measurement type
Name
Ok sheet
Reference
PAPER:
Active
Company
Name
Paper type
Shared
Weight
REFERENCE:
Company
Default dotgain list
Is spot lib
name
Shared
TOLERANCE SET:
Average calculated
Average tolerance
Default measurement condition
Delta CMCC
Delta CMCL
Delta E method
Delta H calculated
Delta H primaries calc.
Delta H primaries tol.
Delta H tolerance
Density calculated
Density tolerance
Density variation
Dotgain calculated
Dotgain spread
Dotgain tolerance
Dotgain variation
Graybalance calculated
Graybalance tolerance
Graybalance variation
Max calculated
Max tolerance
Name
Paperwhite calculated
Paperwhite tolerance
Primaries calculated
Primaries tolerance
Primaries variation
Score for gray balance
Score for other
Score for overprint
Score for paperwhite
Score for primaries
Score for secundaries
Secondaries calculated
Secondaries tolerance
Secondaries variation
Spotcolor calculated
Spotcolor tolerance
Spotcolor variation
Use densitom. dotgain
USER GROUP:
Admin
Description
Name
In the next case, we will be searching for all jobs with reference ISOcoated, measured within the last
90 days, and where the job mode is set to ‘Production’.
Above all, this query needs to be saved with the name ‘Coated Production’, for future use.
36
- PressView 3 User Manual v6.0 -
To get the right information topside, you need to get used to
the many different combinations for setting up the right query.
Allthough all the options may have a dazzeling effect, rest asured
that retrieving the wrong information, or composing the wrong
query,wonthurtthedataatall.Juststartover.
For setting up an new query, click on the +-icon in the ‘Criteria’
section.
Where once was ‘ok sheets’, it now says ‘sentence_1’, witch means;
a new query. For every other single click on the +-icon, a new
‘sentence’ adds up.
In the ‘selected’ part of the left side of the window, you can give
the new query a name. search for ‘jobs’ in this case. Don’t use the
checkerfor‘Onetimeonlysearch’.Itwillpreventyoufromsaving
the query.
Advanced statistics start
The rules: there is no right
order in witch you should
build your query. In this case
we’ll start by adding (+) a rule
for the reference. The next
rule states something about
‘last date’. Fill in 90, for ninety
days.
last but not least, we need ‘Is
production mode is true’ to
finalize this query.
To save this query, simply hit
‘save’ at the bottom of this
window.
The query is for future use to
be found in the drop-down
menu ‘Criteria’. When the
query is saved, click on the
magnifying glass-icon. Depending on the
content of the database
and the kind of connection,
data retrieval can take a few
seconds.
AdvancedstatisticsISOcoated+90days
Advanced statistics production mode
Advanced statistics query result
- PressVIeW 3 User MAnUAl v6.0 -
37
www.
.eu
11. Remote support module
This module only has one feature, and it’s not even ours.
It does nothing more than starting an instance of TeamViewer, with which we can take over your
workstation remotely and securely.
When TeamViewer starts, it needs a few seconds to initialize and get ready for remote connection.
You will be given an ID and a password.
Contact your dealer via phone of skype and give them the credentials to log in to your workstation.
Off course you have to make sure that your workstation is connected to the internet. In any other
case, TeamViewer won’t give you an ID.
38
- PressView 3 User Manual v6.0 -
12. Setting up a new job
Process control Module: setting up a new job will take just minutes of your time. The wizzard will
take you through a few important steps of this process.
Before you start setting up a new job, make sure that the correct client is selected from the
dropdown menu or start by adding a new client first.
For adding a new client, select ‘new’ from the client dropdown menu and fill
in the formalities. A new client has no jobs and no measurements yet. see
below.
not all fields are medatory, but
filling in as mutch information as
possible, makes retrieving this
data easier at a later point in time
new Client
Using this in window, you can start with setting up a new job. Use the ‘new’ button for starting the
wizzard.
Create new job
set the custom job up, as you see fit. everything above the black lines in the middle are free to enter
or select. everything below the black line is currently based on the job preset that was used for the
previous job. If no preset has been made, the software will provide you with default settings, you can
adjust.
- PressVIeW 3 User MAnUAl v6.0 -
39
www.
.eu
Click on ‘Create job’ if the settings are conform the new job.
If not, click on ‘Customize Settings’.
Edit job settings, customize settings
The wizzard will adjust to the settings you make. For instance: if you choose to use a 6 colour printing
machine (CMYK+ 2 Spot), the wizzard will ask you to select the Spot color book like in the window
above. Hit ‘next’ when the settings comply to the job at hand.
The software will ask you to select the
spot color for this job. Still in case of the 6
color printing machine (only utilizing 5),
you can select one or more colors from
the Spot Color Library of your previous
choise.
On the left side of the window, you see
the full library you choose. The filter below
this area of the window can help you to
find the right spot color.
Use the arrow(s) in between the two
frames to ‘move’ your selection to the
Select spot color
‘selected colors’ frame. Using the filter to
find the desired color, makes life easy and the process fast! You can select multiple spot colors, even
though you can only use one for the actual run. This makes you able to stay flexible.
Once the colors are known to the system, the next step is to arrange the colors to the jobs selected
color strip. In this case, the color strip is PressViews own PCS325 5c 747mm color strip.
Although we selected a 6 color printing machine, the color strip is based on CMYK+1 (5 colors). Because of this -in this case intended-incoherence, you will see that the wizzard can and will continue.
note
40
- PressView 3 User Manual v6.0 -
Color mapping
By clicking on the dropdown menus, you can change the strips sequence. The process colors have
their fixed locations on the strip. The spot color must be set and can be selected from the dropdown.
A not yet set color is recognized by the X-mark (undefined)
note
It doesn’t matter what kind of strip you are using. In chapter 13 of this manual, we will show you how to build a custom color strip.
If all set and checked with the original, you can click the ‘next’ button.
The following window of the wizzard will let you decide how to setup the measurement data display.
Like the note in the window explains, adjusting the densities will not affect the spectral references!
In a perfect situation, you can already set the densities to the actual densities of the run. In a later
stage -like during production- you can still adjust the densities of these colors to the desired values.
The default densities, shown below, are based on market averages. Again; changing the desity values
will not have any effect on the spectral references.
Job color densities
- PressView 3 User Manual v6.0 -
41
www.
.eu
When you’ve set the densities to the preferred values, click ‘next’.
run sequence: Drag the color towers in the order of the actual run! When the towers are set in the
right order, click ‘next’.
run sequence
After clicking ‘next’, the following window shows the exact settings for the job you have just setup. In
this window, you can save the preset. saving a preset makes sure that you can use this exact job for
later purposes.
Reviewsettings&savepreset
The above window is an overview of the settings you made for this particular job, but to create the
job, another window needs to appear. Click ‘Create job
Reviewsettings&savepreset
42
- PressVIeW 3 User MAnUAl v6.0 -
When the job is created, PressView immediately wants you to measure the job. If you are not able to
measure at this moment, you can just cancel this window.
Measure new job
even though measurement is cancelled, the job will be saved in the job overview.
You can see that the job has no measurements yet!
saved new job, no measurements
When you are not measuring the new job, this is the end of ‘setting up a new job’.
You can continue to measure this job at any given time.
You do have to make sure that your measurement device is connected and calibrated, off course!
- PressVIeW 3 User MAnUAl v6.0 -
43
www.
.eu
13. Defining a custom color strip
The module to use for this job is the system Management module. But before we go into setting up
the actual color strip; there are basically two kinds of color strips. The ones with inkzones and the
ones without.
Because the color strips with inkzones are bigger, most of the time, we will be defining a color strip
without inkzones.
Offcoursewewíllshowyouhowtoworkwithinkzones!
What do you need to define a custom color strip? You need to have a custom color strip! You can
have a physical, printed color strip, it can be a digital version in any kind of file format, it can be
almost anything.
ForthiscasewewillbelookingatdefiningtheECIGrayConstrip(Mi1,FOGRA39),thesamestripwe
used for getting to know the Process control module.
navigate yourself to the management module and click on ‘Color strips’
At the right bottom side of the color strips window, you will find two active buttons. First ‘Import’
(the button you would use for importing standard color strips) and second ‘Add’ (the button we are
going to use for defining a new color strip).
Management module Color strips
Click on the ‘Add’ button to start the wizzard for defining a custom color strip.
The following window will need some basic information and fysical dimensions. This is needed for
alignment.
note
44
Using an Intellitracks spectral measurement device, setting the proper patch height and width is
of utmost importance!
- PressVIeW 3 User MAnUAl v6.0 -
Management module Color strip editor
For the patch dimensions, you can simply get a ruler and measure the height and width in
millimeters. Because we are copying the eCI GrayCon, we know that it is a single row of patches.
There are no repeats in the strip.
When all done, click ‘next’.
This will take you to a seemingly complicated screen with lots of buttons, but after this chapter, you
will master even this part of the PressView system.
It is by far not as complicated as it looks!
Management module Color strip editor
- PressVIeW 3 User MAnUAl v6.0 -
45
www.
.eu
The color strip editor lets you define any color strip you would want to define. You can make use of
the pre-defined patches in the color channels or use the buttons below the channels to set
paperwhite, balance, overprint and custom patches.
By clicking on a button, you add this patch to the color strip.
To rebuild the eCI GrayCon strip, we need to make use of mostly pre defined patches and a few
custom patches. Get your color bar sampler and start to built the eCI GrayCon strip (31 ptaches).
The first 21 patches are easy. For patch 22, you need to define a ‘custom’.
To define a custom patch, use the button ‘Custom’ at the bottom of the window.
A popup window appears to let you choose the exact patch
you need. Check the reference checkbox if you want to
make use of an already existing patch (from another strip for
instance). In any other case, giva a ‘Color name’ and select the
right ‘Tolerance group’.
13.1 Adding an extra channel
Management module Custom color
For using an extra color in the strip, you use the ‘Add color’ button at the right side of the process
colorchannels. This button will add an extra random color to the channel overview.
At this point, it’s not important to select the exact color you will use in the actual run. During the
setting up of the actual job(s), you can still select the right color.
now, you are just reserving the space in te color strip, not depending on the kind of extra color(s)
selected.
next to several standard percentages, you see a patch per channel with a *. This patch gives you the
ability to set your own percentage.
slUr is a term for mechanical
deviation of the press itself.
To detect this behaviour, you can ad a
horiontal slUr and/or a vertical slUr.
Management module extra channel(s)
46
- PressVIeW 3 User MAnUAl v6.0 -
13.2 Managing inkzones
It really only takes one click to add an inkzone to a color strip.
Management module new inkzone
Because the checkbox is activated, a new inkzone will be started after the position where the arrow
is displayed.
Using the bi-arrowed buttons on the right side of ‘shift inkzones’, you are able to set the right
inkzones, in case not all inkzones are used.
shifting inkzones only works when the color strip contains more than 1 inkzone.
The ‘repeat zone’ button does nothing more than copying the active inkzone.
Management module shift inkzones
13.3 Gray balance patches
At the bottom of the Color strip editor, you find a few special -predefined- patches.
These patches need to be explained because of the dropdown abbreviations.
eatch abbreviations stands for a different way of calculating balance. except for the UsA, there is no 1
‘agreed on’ standard for composing neutral CMY-gray.
BH = Balance Highlights
BM = Balance Midtones
Bs = Balance shadows
Balance abbreviations
Br = Brunner
G7 = G7, UsA standard
GC = eCI Gray control wedges
MW=UGRA/FOGRAmediawedges
PV = PressView gray balance
TK = Techkon wedges
UG = UGrA wedges
- PressVIeW 3 User MAnUAl v6.0 -
47
Thank you for using PressView
For more information about PressView, please visit www.colorware.eu