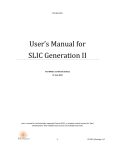
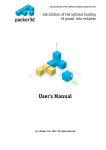
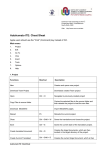
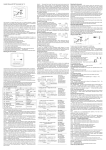
1
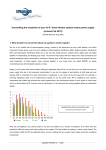
Corporate Services Division
Corporate Technical Audit Department
Contracted the North-West
North West University to execute this project
The Measurement and Verification Guideline:
Geyser Insulation Distribution Projects (Draft)
Project Name:
M&V Guideline: Geyser
Insulation Distribution
Project Number:
N/A
Report Type:
M&V Geyser Guideline
Reporting Period:
N/A
Report Issue Date:
Report Number:
Revision Number:
30 APRIL 2008
PM/M&V/NWU - 07/08 – M&V Geyser Guideline (Draft) v2r1
M&V Geyser Guideline (Draft) v1r11
Compiled by:
………………………………………………
IE Bosman
M&V Team member
North-West University
Date:
14 May 08
Authorised by:
………………………………………………
CA van der Merwe
NWU M&V Leader
North-West University
Date:
14 May 08
Accepted by:
………………………………………………
Vuyo Mini
CTAD
Corporate Services Division
Eskom
Date:
…………..
PAGE II
Table of Contents
1 INTRODUCTION .................................................................................................................... 2
2 OVERVIEW OF GEYSER INSULATION DISTRIBUTION PROJECTS .............................. 13
3 METERING PROCEDURES AND CHARACTERISATION ................................................... 2
3.1 METHODOLOGY ................................................................................................................ 2
3.2 SYSTEM USED TO DEVELOP METHODOLOGY ............................................................. 4
3.3 METERING .......................................................................................................................... 5
3.4 FILTERING OF NON-STANDING LOSSESS EVENTS ..................................................... 6
3.5 DETERMINING THE GENERIC EQUATION ...................................................................... 7
3.5.1 Determining a generic equation for an un-insulated geyser ..................................... 7
3.5.2 Determining a generic equation for an insulated geysers ......................................... 8
3.6 SUMMARY .......................................................................................................................... 9
4 EVALUATION OF GEYSER AND PIPE INSULATION DISTRIBUTION PROJECTS........ 10
4.1 ISSUES TO CONSIDER ................................................................................................... 10
4.2 CHARACTERISATION AND METERING PROCEDURE ................................................ 10
4.3 GEYSER BLANKET AND PIPE INSULATION STATISTICAL MODEL.......................... 12
4.3.1 Fieldworker Form (Installation visit) ........................................................................ 13
4.3.2 Fieldworker Form (Follow-up visit) .......................................................................... 13
5 GEYSER INSULATION M&V TOOL - USER MANUAL...................................................... 14
5.1 Add new project .......................................................................................................... 14
5.2 Open existing project .................................................................................................. 14
5.3 Fieldworker form......................................................................................................... 15
5.4 Admin ......................................................................................................................... 19
5.5 User Queries .............................................................................................................. 23
5.6 Help ............................................................................................................................ 24
APPENDIX A ........................................................................................................................... 25
APPENDIX B ........................................................................................................................... 27
APPENDIX C ........................................................................................................................... 29
APPENDIX D ........................................................................................................................... 31
PAGE III
Nomenclature:
NWU
North-West University
M&V
Measurement and Verification
DSM
Demand Side Management
Te
Environmental Temperature
Ts
Set Point Temperature
m
Slope
ID
Identification Number
CPUT
Cape Peninsula University of Technology
PAGE IV
GEYSER INSULATION DISTRIBUTION PROJECT -GUIDELINE
1 INTRODUCTION
NWU M&V team was requested by Eskom to develop a standard methodology and procedure
to determine the impact of installing geyser and pipe insulation. This standard methodology
and procedure will reduce the amount of work needed during a national roll-out campaign.
This report is the draft geyser insulation guideline and needs to be approved by all the M&V
teams before the finalisation of the guideline.
The guideline includes a description of the methodology and procedures followed to
characterise the impact of geyser blankets on the standing losses, extension of the
methodology to pipe insulation and a user manual for the application.
2 METERING PROCEDURES AND CHARACTERISATION
The NWU M&V team evaluated a sample set of geysers to characterise the influence of
geyser blankets on standing losses. The methodology followed is described in this section.
The results from this study formed the foundation for the application developed. The purpose
of the application was to determine the impact of geyser blankets and pipe insulation, on
standing losses.
In order to quantify and assess the savings, some measurements and calculations needs to
be made. Expenditure on measurement and assessing of savings should be dependent on
the amount the project will save on electricity. In other words; if a project will only save a little,
it is not viable to spend huge amounts of money on the measuring equipment in order to
verify the savings.
South Africa has a relatively warm climate and therefore much smaller temperature
differences, (environmental versus geyser temperature), than areas with colder climates. The
impact of installing geyser blankets on the standing losses of a geyser in South Africa, is
therefore smaller. Another issue is that a sample of geysers are normally scattered over a
large area, making the measuring of the impact expensive (one meter per geyser). If every
geyser would have been measured, the savings resulting from the installation of geyser
blankets will be lost in the cost of the metering equipment.
It was therefore a requirement to develop a methodology to determine the impact of geyser
blankets without measurements. The following section will describe the methodology followed
to determine the impact of geyser blankets on the standing loses.
2.1 METHODOLOGY
In order to determine the baseline (the electricity use of the geysers without DSM
intervention) the following variables need to be taken into consideration:
•
Geyser Set point (Temperature)
•
Water usage
PAGE 2
GEYSER INSULATION DISTRIBUTION PROJECT -GUIDELINE
•
Environmental temperature
•
Size of geyser
•
Geyser blanket characteristics
The electric power is therefore a function of several variables:
IPkW = f (X1, X2, X3, X4, X5, X6)…[1]
Where: IPkW
= Electric power
X1
= Geyser Set point
X2
= Water usage
X3
= Environmental temperature
X4
= Size of geyser
X5
= Geyser blanket characteristics
X6
= Maintenance on geyser blanket
A number of the above mentioned variables could be eliminated from the function:
•
Water usage: It can be assumed that the water usage before and after
implementation will remain the same because nothing was installed to change the
water usage pattern.
•
Geyser Blanket characteristics: Can be omitted from the equation because all the
geysers were fitted with the same type of geyser blankets.
•
Maintenance: Maintenance on the geyser is only a value 0 or 1 to verify if a geyser
blanket is installed (1) or not (0).
Therefore the only things remaining that influence the standing losses are the following:
IPkW = f (X1, X2, X3)…[2]
Where: IPkW
= Electric power
X1
= Geyser Set point
X2
= Environmental temperature
X3
= Size of geyser
The methodology is based on finding a relation between geyser standing losses, set point
water temperature (thermostat setting) and environmental temperature. This would simplify
future projects because only the thermostat setting and the environmental temperature will be
required to determine what the standing losses would be over a certain period. Impact of
installing geyser blankets could be easily determined in current and future M&V projects.
PAGE 3
GEYSER INSULATION DISTRIBUTION PROJECT -GUIDELINE
2.2 SAMPLE USED TO DEVELOP METHODOLOGY
METH
The sample (shown in Figure 1)
1 comprises of nine identical geysers installed in a residential
apartment complex in Potchefstroom. All the geysers are installed on an outside wall, have a
100-litre
litre capacity and a 2kW heater
heate element. The geysers have thermostats that can be
manually adjusted so that the supplied water temperature can be regulated. The thermostats
of the geysers were set to either 60°C or 70°
70°C
C and were not change d for the rest of the
metering period. These thermostat
hermostat settings are typical for geysers in residential areas.
Figure 1: Sample used (bottom row) in determining the methodology (without geyser
blankets)
determination. The
Six of the nine geysers were fitted with geyser blankets after baseline determination
geysers with the geysers blankets are shown in Figure 2. A “before” and “after” phase can
clearly be distinguished.. Using the “before” relations as the baseline and the “after” relations
as the actual values, energy savings could be determined.
GEYSER INSULATION DISTRIBUTION PROJECT -GUIDELINE
Figure 2: Geyser blankets installed
2.3 METERING
To find a relation between geyser standing losses, thermostat setting and environmental
temperature the following measurements are needed (Measurement configuration shown in
Figure 3):
1.
Electricity consumption (measured in amps, assumed voltage to be 230V). This
measurement is a direct indication whether the geyser used power or not.
2.
Environmental temperature. Temperature data from the South
uth African Weather Bureau
can be used.
3.
Hot water temperature.
ture. Installing flow meters is an intrusive process and therefore not
viable. The quantity of water consumed is negligible, as only periods when no water was
used were studied to determine geyser standing losses. Measuring the temperature of
the hot
ot water supply pipe is a direct, non-intrusive
non intrusive technique to determine when hot
water was consumed. This measurement indicates
ndicates whether the element of the geyser
switched
itched on to restore the water temperature, (the temperature dropped due to hot water
consumption or standing losses
losses).
GEYSER INSULATION DISTRIBUTION PROJECT -GUIDELINE
Temperature
measurement
Electrical
energy
measurem ent
Figure 3: Geyser installation and metering points
A “before” case was developed in the period three months prior to the installation of geyser
blankets. Logging intervals were 5 minutely.
2.4 FILTERING OF NON-STANDING LOSSES EVENTS
Only periods when no hot water was consumed would be considered to determine the geyser
standing losses. It was therefore necessary to isolate events where hot water was consumed
and the geyser switched on as a result.
Figure 4 indicates events of consumption of hot water from the geyser. The graph on the left
shows the energy consumption. On the right hand side, the hot water supply pipe (top line)
Temperature °C
Energy consumption [W]
and the environment (bottom line) temperatures are shown.
Figure 4: Temperatures of water supply pipe (top) and environment (bottom)
Three encircled peaks can be seen; these peaks indicate the events when the heating
elements switched on. The temperature graph indicates the events when hot water was
consumed from the geyser and consequently the heater element switched on to restore the
temperature. The increase in electricity consumption as a result of hot water consumption;
was disregarded.
PAGE 6
Temperature °C
Energy consumption W
GEYSER INSULATION DISTRIBUTION PROJECT -GUIDELINE
Figure 5: Example of a time period with no hot water consumption
Figure 5 shows a period where no hot water was consumed. The left hand graph shows
electricity consumption and the right hand graph shows the temperature profile. At the top on
the temperature graph, the hot water supply pipe temperature can be seen and at the bottom
the environmental temperature. A slow decline in water temperature is observed and at a
certain value, the heating element switches on and the water temperature in the supply pipe
is restored.
The electricity consumption (Figure 5) is therefore due to the geyser standing losses.
Installation of a geyser blanket will increase the intervals of element switching.
2.5 DETERMINING THE GENERIC EQUATION
2.5.1 Determining a generic equation for an un-insulated geyser
After the data isolation procedure was completed, the remaining data contained only
information of geyser standing losses. A scatter of the electricity consumption (due to
standing losses) versus the environmental temperature was drawn (Figure 6). A generic
equation was developed by calculating the average value of the slope and y-intercept (shown
in Figure 7). This equation was developed for temperatures between 0°C and 23°C. The
equation could be rewritten to include the geyser set point as an input to the equation.
Therefore:
Losses = - 1.9307 x (Te – Ts) …[3]
with Te environmental temperature and Ts the set point.
PAGE 7
GEYSER INSULATION DISTRIBUTION PROJECT -GUIDELINE
Energy use vs. Outside temp.
140
120
Energy use [W]
100
y = -1.9831x + 116.4
80
S etpoint 70°C
S etpoint 60°C
y = -1.9507x + 114.3
60
S etpoint 60°C
y = -1.8582 x + 107.1 1
40
20
0
-5
-3
-1
1
3
5
7
9
11
13
15
17
19
21
23
25
27
29
31
33
35
Outside temp. [°C]
Figure 6: Geyser standing loses vs. environmental temperature for different set points
Energy use vs. Outside temp.
120.0
100.0
80.0
Energy use [W]
y = -1.9307x + 112.6
Generic
60.0
40.0
20.0
0.0
-5
-3
-1
1
3
5
7
9
11
13
15
17
19
21
23
25
27
29
31
33
35
Outside temp. [°C]
Figure 7: Geyser standing losses vs. environment temperature in the generic equation
2.5.2 Determining a generic equation for insulated geysers
Exactly the same methodology was followed for insulated geysers. The same three geysers
were covered with geyser blankets (air gap with reflective coating) after 3 months. The
generic equation and values for both insulated and un-insulated geysers are shown in Figure
8.
PAGE 8
GEYSER INSULATION DISTRIBUTION PROJECT -GUIDELINE
Energy use vs. Outside temp.
120.0
100.0
80.0
Energy use [W]
y = -1.9307x + 112.6
y = -1 .582x + 9 3.589
Uninsulated
60.0
Insulated
40.0
20.0
0.0
-5
-3
-1
1
3
5
7
9
11
13
15
17
19
21
23
25
27
29
31
33
35
Outside temp. [°C]
Figure 8: Generic equation for geyser standing losses, insulated and un-insulated
The calculations were performed to obtain an equation in the same form as the equation for
the un-insulated geyser discussed in section 2.5.1. Therefore, the standing losses of an
insulated 100 litre geyser are as follows:
Losses = - 1.582 x (Te – Ts) …[4]
with Te environmental temperature and Ts the set point.
2.6 SUMMARY
Equations [3] and [4] were developed using geysers in operation in a residential complex.
With these equations the geyser standing losses for both insulated and un-insulated 100 litre
geysers can be calculated; with the only inputs being the environmental temperature and the
geyser set point temperature.
The equations are applicable to 100 litre geysers with air gap insulation with reflective
coating.
The equation for standing loses on un-insulated geysers is as follows:
Losses = - 1.9307 x (Te – Ts)
with Te environmental temperature and Ts the set point.
The equation for standing loses on insulated geysers is as follows:
Losses = - 1.582 x (Te – Ts)
with Te environmental temperature and Ts the set point.
PAGE 9
GEYSER INSULATION DISTRIBUTION PROJECT -GUIDELINE
3 EVALUATION
OF
GEYSER
AND
PIPE INSULATION DISTRIBUTION
PROJECTS
3.1 ISSUES TO CONSIDER
The issues to consider when evaluating geyser and pipe insulation distribution projects are
the following:
•
Amount of geyser to be fitted with geyser blankets and pipe insulation
•
Set points of the geysers
•
Size of geysers
•
Type of geyser
•
Ambient conditions of the geysers
•
Location of the geysers
o
Inside
o
Outside
o
Ceiling void
•
Type of insulation
•
Percentage coverage of geyser with blanket
•
Percentage coverage of pipe with insulation
•
Decay rate (blankets and insulation becomes torn and tattered)
3.2 CHARACTERISATION AND METERING PROCEDURE
In order to characterise the standing losses the following need to be measured for a week:
•
Set point of geyser (Ts) (Once of measurement)
•
Environmental temperature (Ta)
•
Power consumption (kWh)
From these measurements the standing losses, average environmental temperature and
average standing loss in Watts can be calculated. These measurements and calculations
needs to be repeated for the geyser:
•
Without a blanket (will only be done once per type of geyser)
•
With a blanket (will be repeated for every type of insulation)
•
With a blanket and 3 meter pipe insulation (will be repeated for every type of
insulation)
PAGE 10
GEYSER INSULATION DISTRIBUTION PROJECT -GUIDELINE
Figure 9 shows the characterisation procedure graphically. The loses can be determined
using the following equation:
Losses,, m,, With:
m1 = slope of the trend line of scatter drawn of data from geyser without insulation
m2 = slope of the trend line drawn of data from geyser with insulation
m3 = slope of the trend line drawn of data from geyser with insulation and 3 meter pipe
insulation
Ta = environmental temperature
Ts = set point temperature
The m-values will be defined by detailed metering on the specified system. The ambient
temperature will be dependent on the area where the geyser is installed and weather data for
that city (available from the weather bureau). The application will have 20 cities’ annual
weather data in half-hourly format included. The application also has the ability to upload
other weather data if the applicable city is not included in the 20 cities listed in the application.
The lines in Figure 9 coincide at the set point temperature, where the ambient temperature is
equal to the set point temperature.
Figure 9: Characterisation procedure
PAGE 11
GEYSER INSULATION DISTRIBUTION PROJECT -GUIDELINE
In order to cater for different lengths of pipe and geyser insulated a percentage coverage
factor will be used. As illustrated in Figure 10 if the geyser is covered with a blanket but only
portion of the 3 meter pipe is insulated, the standing losses will be calculated between W 2 and
W 3 according to the percentage coverage.
Figure 10: Percentage coverage illustration
The form that needs to be completed during the metering and characterisation phase can be
found in Appendix A.
3.3 GEYSER BLANKET AND PIPE INSULATION STATISTICAL MODEL
•
Inputs to the statistical model include (gathered through fieldworker form, Appendix
B):
•
o
Number of geysers
o
Set point
o
Size of geyser
o
Type/make of geyser
o
Location of geyser
o
Ambient temperatures
o
Type of insulation
o
% Coverage of geyser with blanket
o
% Coverage of pipe with insulation
o
Decay rate
The model contains the slope of the three lines. This is a specific value, characteristic
to a certain geyser size, geyser type and insulation type
M1 – Slope of the trend line for a geyser without insulation
PAGE 12
GEYSER INSULATION DISTRIBUTION PROJECT -GUIDELINE
•
M2 – Slope of the line for a geyser with insulation
M3 – Slope of the line for a geyser with blanket and pipe insulation
Outputs of such a model will include:
o
Baseline - hourly Watt values
o
Actual - hourly Watt values
3.3.1 Fieldworker Form (Installation visit)
The fieldworker forms captures all the information required for the application. During
installation phase a sample of the geysers need to be visited to capture all the relevant
information. The information needed includes the geyser make and size which can only be
gathered before the geyser blanket is installed.
Detailed description of the fieldworker form and all the relevant information is given in
section 5.3. The fieldworker form (Installation visit) can be found in Appendix B.
3.3.2 Fieldworker Form (Follow-up visit)
A follow-up visit is necessary to determine if the geyser blankets and pipe insulation are still
intact after three to six months. The same geysers that were visited during the installation visit
needs to be revisited. The information gathered during the follow-up visit is captured in the
fieldworker from (Follow-up visit), Appendix C.
This information will be incorporated to determine a decay rate. The decay rate will be dealt
with in the same manner as percentage coverage that was described in Figure 10.
4 OVERVIEW OF GEYSER INSULATION DISTRIBUTION PROJECTS
Step 1: Complete fieldworker forms for a sample of geysers. The M&V team needs to
accompany the ESCo to a sample of before installation of the geyser blankets. This is
necessary because information on the un-insulated geyser must be gathered which would be
difficult to obtain when the geyser are already insulated.
Step 2: The information gathered through the fieldworker forms needs to be entered into the
application.
Step 3: Generate results using the Geyser Insulation M&V tool.
Step 4: Conduct a follow-up visit, (on the sample of geysers visited) to determine the decay
rate of the insulation.
Step 5: The information gathered during the follow-up visit needs to be entered into the
application.
Step 6: Generate results using the Geyser Insulation M&V tool.
PAGE 13
GEYSER INSULATION DISTRIBUTION PROJECT -GUIDELINE
5 GEYSER INSULATION M&V TOOL - USER MANUAL
To start a new project you need to do the following:
•
Add a new project (Section 5.1)
•
Fill in the fieldworker forms. Additional forms can be added later. (Appendix B)
•
Fill in m-values if needed (Section 5.4)
•
Import weather data if the applicable town is not listed (Section 5.4)
•
Generate M&V results by using the user queries (Section 5.5)
If you want to generate results from a project that is already in the database you need to do
the following:
5.1
•
Open and existing project (Section 5.2)
•
Generate M&V results by using the user queries (Section 5.5)
Add new project
On the main menu, click File and then click New Project. The following window will appear:
•
Type
in
a
unique
project
ID,
preferably the DSM project number.
•
Type in a unique project name,
preferably the DSM project name.
•
Click Add Project.
If the project is added successfully a confirmation message will be displayed:
The newly added project is not opened by default. If you want to use the newly added project
you can open it from the file menu.
5.2
Open existing project
On the main menu, click File and then click Open Project. The following window will appear:
GEYSER INSULATION DISTRIBUTION PROJECT -GUIDELINE
To open an existing project select the applicable project and click on Open. The project is
now open and the name of the project will appear on the bottom left of your screen. The
toolbar icons for the fieldworker forms and user queries will also be enabled now.
5.3
Fieldworker form
On the main menu, click Project and then click Fieldworker form. The window on the next
page will appear.
Use the form below to insert the data gathered by the fieldworkers. Each fieldworker form in
this particular project must be added using this window. As you complete entering the forms
the application will update the averages calculate from all the fieldworker forms entered. For
example if 3 geysers with set points of 60ºC and 2 with set points of 50ºC is entered, the
average temperature for the sample will be 56ºC.
PAGE 15
GEYSER INSULATION DISTRIBUTION PROJECT -GUIDELINE
GEYSER INSULATION DISTRIBUTION PROJECT -GUIDELINE
Description of fields that need to be typed in is given in the following section. All the fields with
(*) next to it is compulsory, the rest of the fields are for more detailed information:
•
Form ID
o
•
•
Form ID: * Type in from ID number as found on top of the field worker form
Fieldworker Information
o
Name: Type in the fieldworker’s name
o
Phone Nr: Type in fieldworker’s phone nr.
House Information
o
Date: * Select date on which the house was visited from the calendar or enter
a date
o
Name: Enter the name of a person living in the house
o
Address: * Enter the address of the house
o
GPS: Enter the GPS coordinates of the house
o
Tel nr: Enter the telephone number of a person living in the house
o
Town: * Select a town from the list or type in the new town name by clicking
on the
button. The following window will appear allowing you to edit the
item set:
Fill in the name of the town or installation set up under Item. Give a
description if preferred. Save Changes and click on the Close Form button.
PAGE 17
GEYSER INSULATION DISTRIBUTION PROJECT -GUIDELINE
•
Technical Information:
o
Geyser
Make: * Select a make from the list. This version of the tool considers
all makes to be the same because only one type of geyser has been
tested thus far.
o
Size: * Select a size from the list.
Installation: * Select an installation arrangement from the list
Insulation
Make: * Select the applicable make of insulation from the list. This
version of the tool considers all makes to be the same because only
one type of geyser has been tested thus far.
Coverage: * Select the applicable coverage from the list. This
selection is an indication whether only the geyser is insulated or if the
geyser and pipes are insulated.
Geyser: * Select from the list according to how the geyser is
insulated.
Pressure relief insulated: Select the tick box if the pressure relief is
insulated.
Inlet pipe: * Select the amount of meters insulated or nearest amount
Outlet pipe: * Select the amount of meters insulated or nearest
amount
o
Temperature Measurements
o
Set point: * Enter the set point temperature of the geyser
Environmental Exposure
Temperature: * Select the town where the geyser is installed. If the
town is not listed you can do one of the following:
• Select
the
town
which
environmental
temperature
best
represents the environmental temperature of the applicable
town.
PAGE 18
GEYSER INSULATION DISTRIBUTION PROJECT -GUIDELINE
• If the geyser is installed inside the house with a constant
temperature environment you can select the applicable constant
temperature.
• If the temperature to which the geyser is exposed is not listed,
you can import your own set of weather data. The procedure is
described in section 5.4.
o
Decay Rate
Geyser: * Select from the list the applicable description of the state of
the insulation on the geyser at the time of the follow-up visit. If it is
the first visit, select ‘Insulation still intact’.
Comments: If the state of the geyser insulation is not adequately
described in the above mentioned list or if you want to elaborate then
you can give a description here. Remember that you need to select a
description next to Geyser that is closest to the applicable situation.
Pipe: * Select from the list the applicable description of the state of
the insulation on the pipe at the time of the follow-up visit. If it is the
first visit, select ‘Insulation still intact’, or if there is no insulation on
the pipe select ‘No insulation on pipe’.
Comments: If the state of the pipe insulation is not adequately
described in the above mentioned list you can formulate a description
here. Remember that you need to select a description next to Pipe
that best represents the applicable situation.
After all the changes have been made, you can save the changes by clicking on the
button.
If you want to edit a form that has already been entered/saved, you can double click on the
name of the form and the data will appear. After you have edited the form, you need to save
the changes.
5.4
Admin
PAGE 19
GEYSER INSULATION DISTRIBUTION PROJECT -GUIDELINE
M-Values
On the main menu, click Admin and then click M-Values, the following window will appear:
Additional M-values can be added
using this form. The M-values are
developed by CPUT. Editing of
this form will only be allowed by
NWU
and
upgraded
after
version
editing
will
distributed.
Weather data
This section explains the steps that needs to be taken to import additional weather data if the
existing temperature data set is not an addequate representation of your area. Appendix D
contains an example of the format of the data to be included in the application. The data must
be of hourly format for a full year.
an
be
GEYSER INSULATION DISTRIBUTION PROJECT -GUIDELINE
•
The next step is to choose the excel file that contains the temperature data.
•
Select a weather type from the list. If it does not appear in the list, you can add
additional weather types by clicking on the
you to edit the item set.
PAGE 21
button. A window will appear allowing
GEYSER INSULATION DISTRIBUTION PROJECT -GUIDELINE
•
Click on
to add a new temperature set. Fill in the name of the city
or description of the data set under Item and click on
close this window by clicking on
. You can now
.
•
To browse for the file click on
•
After selecting the file, select the 'sheet name' containing the data to import and click
and select the excel file from disk
Ok.
•
The Column Mapping section will now be active. The application will automatically
detect all the column headings of the sheet selected. Select the column name where
the hour of the year are situated and the column where the temperature data are
situated.
Click on
to import the data. Your temperature data has now been imported.
PAGE 22
GEYSER INSULATION DISTRIBUTION PROJECT -GUIDELINE
5.5
User Queries
After the fieldworker forms are completed and saved the user queries section can be used to
generate the M&V results. When clicking on the user queries button the following window will
appear:
The date from and to indicates the period when
the field worker forms were entered.
Select the applicable city or cities for your
results.
Select the type of geyser or geysers that should
be included in your results.
Select the size or sizes of the geysers that you
would like to include.
Select the type of insulation that you would want
results from.
Select the weather type or types applicable.
Select a sample size factor according to the
amount of geysers in the project ex. 200 000.
GEYSER INSULATION DISTRIBUTION PROJECT -GUIDELINE
After all the selections are made, click on
to generate the M&V results.
The results can be exported by clicking on the
button. Choose a
location and a csv or xml file will be exported.
5.6 Help
When selecting the About button, the following window will appear:
When selecting the Contents button, the Geyser Insulation M&V Tool’s help file will appear,
consisting of the user manual.
PAGE 24
GEYSER INSULATION DISTRIBUTION PROJECT -GUIDELINE
APPENDIX A
PAGE 25
GEYSER INSULATION DISTRIBUTION PROJECT -GUIDELINE
PAGE 26
GEYSER INSULATION DISTRIBUTION PROJECT -GUIDELINE
APPENDIX B
PAGE 27
GEYSER INSULATION DISTRIBUTION PROJECT -GUIDELINE
PAGE 28
GEYSER INSULATION DISTRIBUTION PROJECT -GUIDELINE
APPENDIX C
PAGE 29
GEYSER INSULATION DISTRIBUTION PROJECT -GUIDELINE
PAGE 30
GEYSER INSULATION DISTRIBUTION PROJECT -GUIDELINE
APPENDIX D
PAGE 31
GEYSER INSULATION DISTRIBUTION PROJECT -GUIDELINE
PAGE 32