1
Legal Notices
Lund Performance Solutions makes no warranty of any kind with regard to this manual, including, but not limited to,
the implied warranties of merchantability and fitness for a particular purpose. Lund Performance Solutions shall not be
held liable for errors contained herein or direct, indirect, special, incidental, or consequential damages in connection
with the furnishing, performance, or use of this material.
Restricted Rights Legend
All rights are reserved. No part of this document may be photocopied, reproduced, or translated to another language
without the prior written consent of Lund Performance Solutions. The information contained in this document is subject
to change without notice.
LUND PERFORMANCE SOLUTIONS
240 2nd Avenue SW
Albany, OR 97321
USA
Use of this manual and flexible disk(s), tape cartridge(s), or CD-ROM(s) supplied for this pack is restricted to this
product only. Additional copies of the programs may be made for security and back-up purposes only. Resale of the
programs in their present form or with alterations is expressly prohibited.
Copyright Notices
Copyright © 2002 Lund Performance Solutions, all rights reserved.
Reproduction, adaptation, or translation of this document without prior written permission is prohibited, except as
allowed under the copyright laws.
Printed in the United States of America.
Trademark Notices
De-Frag/X Disk Manager, Developer’s Toolbox and System Manager’s Toolbox, Forecast Capacity Planner, Intact
Dynamic Rollback (Intact D/R), Performance Gallery, Performance Gallery Gold, SOS/3000 Performance Advisor,
SOS/9000 Performance Advisor, SOS/SOLARIS Performance Advisor, Q-Xcelerator Resource Manager, and Shadow
Data Replicator (Shadow D/R), are trademarks owned by Lund Performance Solutions in the USA and other
countries.
Other brands and their products are trademarks or registered trademarks of their respective holders and should be
noted as such.
Forecast Capacity Planner version C.02
Whitney Olsen, Laura Bryngelson, Rodica Popa 03152002
TABLE OF CONTENTS
Chapter 1
Introduction . . . . . . . . . . . . . . . . . . . . . . . . . . . . . . . . . . . . . . . . . . . . . . 1
Welcome to Forecast Capacity Planner . . . . . . . . . . . . . . . . . . . . . . . . . . . . . . . . . . . . . . . . . . . . 1
System Requirements . . . . . . . . . . . . . . . . . . . . . . . . . . . . . . . . . . . . . . . . . . . . . . . . . . . . . . . . . 2
Product Support . . . . . . . . . . . . . . . . . . . . . . . . . . . . . . . . . . . . . . . . . . . . . . . . . . . . . . . . . . . . . . 3
Product Documentation . . . . . . . . . . . . . . . . . . . . . . . . . . . . . . . . . . . . . . . . . . . . . . . . . . . . . . . . 5
Online Help System . . . . . . . . . . . . . . . . . . . . . . . . . . . . . . . . . . . . . . . . . . . . . . . . . . . 6
Reference Materials . . . . . . . . . . . . . . . . . . . . . . . . . . . . . . . . . . . . . . . . . . . . . . . . . . . . . . . . . . . 6
Chapter 2
Product Overview. . . . . . . . . . . . . . . . . . . . . . . . . . . . . . . . . . . . . . . . . . 7
Product Description . . . . . . . . . . . . . . . . . . . . . . . . . . . . . . . . . . . . . . . . . . . . . . . . . . . . . . . . . . . 7
Components . . . . . . . . . . . . . . . . . . . . . . . . . . . . . . . . . . . . . . . . . . . . . . . . . . . . . . . . . 7
Product Audience . . . . . . . . . . . . . . . . . . . . . . . . . . . . . . . . . . . . . . . . . . . . . . . . . . . . . . . . . . . . . 8
Procedural Summary . . . . . . . . . . . . . . . . . . . . . . . . . . . . . . . . . . . . . . . . . . . . . . . . . . . . . . . . . . 9
New Product Features . . . . . . . . . . . . . . . . . . . . . . . . . . . . . . . . . . . . . . . . . . . . . . . . . . . . . . . . . 9
Chapter 3
Product Startup . . . . . . . . . . . . . . . . . . . . . . . . . . . . . . . . . . . . . . . . . . 11
Starting Forecast Capacity Planner . . . . . . . . . . . . . . . . . . . . . . . . . . . . . . . . . . . . . . . . . . . . . . 11
Help Topics. . . . . . . . . . . . . . . . . . . . . . . . . . . . . . . . . . . . . . . . . . . . . . . . . . . . . . . . . 11
Context-Sensitive Help . . . . . . . . . . . . . . . . . . . . . . . . . . . . . . . . . . . . . . . . . . . . . . . . 11
Tip of the Day . . . . . . . . . . . . . . . . . . . . . . . . . . . . . . . . . . . . . . . . . . . . . . . . . . . . . . . 12
Exiting Forecast Capacity Planner . . . . . . . . . . . . . . . . . . . . . . . . . . . . . . . . . . . . . . . . . . . . . . . 12
Uninstalling Forecast Capacity Planner . . . . . . . . . . . . . . . . . . . . . . . . . . . . . . . . . . . . . . . . . . . 12
Chapter 4
Data Collection, Extraction, and Export. . . . . . . . . . . . . . . . . . . . . . . 13
Overview . . . . . . . . . . . . . . . . . . . . . . . . . . . . . . . . . . . . . . . . . . . . . . . . . . . . . . . . . . . . . . . . . . . 13
Identifying System Resources . . . . . . . . . . . . . . . . . . . . . . . . . . . . . . . . . . . . . . . . . . . . . . . . . . 13
Identifying and Characterizing Workload Groups . . . . . . . . . . . . . . . . . . . . . . . . . . . . . . . . . . . . 14
MPE/iX Host Data. . . . . . . . . . . . . . . . . . . . . . . . . . . . . . . . . . . . . . . . . . . . . . . . . . . . . . . . . . . . 15
Collecting MPE/iX Performance Data. . . . . . . . . . . . . . . . . . . . . . . . . . . . . . . . . . . . . 18
Extracting MPE/iX Performance Data . . . . . . . . . . . . . . . . . . . . . . . . . . . . . . . . . . . . 19
Exporting MPE/iX Performance Data . . . . . . . . . . . . . . . . . . . . . . . . . . . . . . . . . . . . . 22
HP-UX Host Data . . . . . . . . . . . . . . . . . . . . . . . . . . . . . . . . . . . . . . . . . . . . . . . . . . . . . . . . . . . . 22
v
FORECAST CAPACITY PLANNER USER’S GUIDE
Table of Contents
Collecting HP-UX Performance Data . . . . . . . . . . . . . . . . . . . . . . . . . . . . . . . . . . . . . 25
Extracting HP-UX Performance Data . . . . . . . . . . . . . . . . . . . . . . . . . . . . . . . . . . . . . 27
Exporting HP-UX Performance Data . . . . . . . . . . . . . . . . . . . . . . . . . . . . . . . . . . . . . 30
Chapter 5
Quick Tour for MPE/iX Systems . . . . . . . . . . . . . . . . . . . . . . . . . . . . . 31
Overview . . . . . . . . . . . . . . . . . . . . . . . . . . . . . . . . . . . . . . . . . . . . . . . . . . . . . . . . . . . . . . . . . . . 31
Running Forecast Capacity Planner . . . . . . . . . . . . . . . . . . . . . . . . . . . . . . . . . . . . . . . . . . . . . . 31
Loading a Collection File. . . . . . . . . . . . . . . . . . . . . . . . . . . . . . . . . . . . . . . . . . . . . . . . . . . . . . . 31
Choosing a CPU Equivalent . . . . . . . . . . . . . . . . . . . . . . . . . . . . . . . . . . . . . . . . . . . . 32
Investigating Validation Messages . . . . . . . . . . . . . . . . . . . . . . . . . . . . . . . . . . . . . . . 33
Previewing the Unvalidated Baseline Model. . . . . . . . . . . . . . . . . . . . . . . . . . . . . . . . . . . . . . . . 33
Validating the Baseline Model. . . . . . . . . . . . . . . . . . . . . . . . . . . . . . . . . . . . . . . . . . . . . . . . . . . 36
Graphing the Model . . . . . . . . . . . . . . . . . . . . . . . . . . . . . . . . . . . . . . . . . . . . . . . . . . . . . . . . . . 36
One CPU with Zero Growth Rate . . . . . . . . . . . . . . . . . . . . . . . . . . . . . . . . . . . . . . . . 36
Four CPUs with Zero Growth Rate . . . . . . . . . . . . . . . . . . . . . . . . . . . . . . . . . . . . . . . 40
Four CPUs with Five-Percent Growth Rate . . . . . . . . . . . . . . . . . . . . . . . . . . . . . . . . 41
Utilization by Workload Group for One CPU. . . . . . . . . . . . . . . . . . . . . . . . . . . . . . . . 42
Individual Workload Group Growth. . . . . . . . . . . . . . . . . . . . . . . . . . . . . . . . . . . . . . . 44
Chapter 6
Quick Tour for HP-UX Systems. . . . . . . . . . . . . . . . . . . . . . . . . . . . . . 47
Overview . . . . . . . . . . . . . . . . . . . . . . . . . . . . . . . . . . . . . . . . . . . . . . . . . . . . . . . . . . . . . . . . . . . 47
Running Forecast Capacity Planner . . . . . . . . . . . . . . . . . . . . . . . . . . . . . . . . . . . . . . . . . . . . . . 47
Loading a New Model . . . . . . . . . . . . . . . . . . . . . . . . . . . . . . . . . . . . . . . . . . . . . . . . . . . . . . . . . 47
Choosing a CPU Equivalent . . . . . . . . . . . . . . . . . . . . . . . . . . . . . . . . . . . . . . . . . . . . 48
Validation Messages. . . . . . . . . . . . . . . . . . . . . . . . . . . . . . . . . . . . . . . . . . . . . . . . . . 49
Main Program Window . . . . . . . . . . . . . . . . . . . . . . . . . . . . . . . . . . . . . . . . . . . . . . . . 49
Reviewing Validation Thresholds . . . . . . . . . . . . . . . . . . . . . . . . . . . . . . . . . . . . . . . . . . . . . . . . 51
Validating the Baseline Model. . . . . . . . . . . . . . . . . . . . . . . . . . . . . . . . . . . . . . . . . . . . . . . . . . . 51
Graphing the Model . . . . . . . . . . . . . . . . . . . . . . . . . . . . . . . . . . . . . . . . . . . . . . . . . . . . . . . . . . 51
One CPU with Zero Growth Rate . . . . . . . . . . . . . . . . . . . . . . . . . . . . . . . . . . . . . . . . 52
Four CPUs with Zero Growth Rate . . . . . . . . . . . . . . . . . . . . . . . . . . . . . . . . . . . . . . . 55
Four CPUs with Five-percent Growth Rate . . . . . . . . . . . . . . . . . . . . . . . . . . . . . . . . 56
Utilization by Workload Group for One CPU. . . . . . . . . . . . . . . . . . . . . . . . . . . . . . . . 58
Chapter 7
Forecast Window Panes . . . . . . . . . . . . . . . . . . . . . . . . . . . . . . . . . . . 61
Main Program Window Panes (Unvalidated) . . . . . . . . . . . . . . . . . . . . . . . . . . . . . . . . . . . . . . . 61
File Manager Pane . . . . . . . . . . . . . . . . . . . . . . . . . . . . . . . . . . . . . . . . . . . . . . . . . . . 62
vi
....
TABLE OF CONTENTS
Global Unvalidated Centers Pane . . . . . . . . . . . . . . . . . . . . . . . . . . . . . . . . . . . . . . . 63
Global Unvalidated Workload Pane . . . . . . . . . . . . . . . . . . . . . . . . . . . . . . . . . . . . . . 64
Main Program Window Panes (Validated) . . . . . . . . . . . . . . . . . . . . . . . . . . . . . . . . . . . . . . . . . 65
Global Validated Centers Pane . . . . . . . . . . . . . . . . . . . . . . . . . . . . . . . . . . . . . . . . . 65
Global Validated Workload Pane . . . . . . . . . . . . . . . . . . . . . . . . . . . . . . . . . . . . . . . . 66
Chapter 8
Menus and Commands . . . . . . . . . . . . . . . . . . . . . . . . . . . . . . . . . . . . 67
Overview . . . . . . . . . . . . . . . . . . . . . . . . . . . . . . . . . . . . . . . . . . . . . . . . . . . . . . . . . . . . . . . . . . . 67
File Menu and Commands . . . . . . . . . . . . . . . . . . . . . . . . . . . . . . . . . . . . . . . . . . . . . . . . . . . . . 67
New Model . . . . . . . . . . . . . . . . . . . . . . . . . . . . . . . . . . . . . . . . . . . . . . . . . . . . . . . . . 68
Load/Validate Model. . . . . . . . . . . . . . . . . . . . . . . . . . . . . . . . . . . . . . . . . . . . . . . . . . 69
Save Model. . . . . . . . . . . . . . . . . . . . . . . . . . . . . . . . . . . . . . . . . . . . . . . . . . . . . . . . . 71
Save Model As... . . . . . . . . . . . . . . . . . . . . . . . . . . . . . . . . . . . . . . . . . . . . . . . . . . . . 71
Close . . . . . . . . . . . . . . . . . . . . . . . . . . . . . . . . . . . . . . . . . . . . . . . . . . . . . . . . . . . . . 71
Delete . . . . . . . . . . . . . . . . . . . . . . . . . . . . . . . . . . . . . . . . . . . . . . . . . . . . . . . . . . . . . 72
Print Setup... . . . . . . . . . . . . . . . . . . . . . . . . . . . . . . . . . . . . . . . . . . . . . . . . . . . . . . . . 73
Print Preview . . . . . . . . . . . . . . . . . . . . . . . . . . . . . . . . . . . . . . . . . . . . . . . . . . . . . . . 74
Print . . . . . . . . . . . . . . . . . . . . . . . . . . . . . . . . . . . . . . . . . . . . . . . . . . . . . . . . . . . . . . 74
Send... . . . . . . . . . . . . . . . . . . . . . . . . . . . . . . . . . . . . . . . . . . . . . . . . . . . . . . . . . . . . 75
Load Resources . . . . . . . . . . . . . . . . . . . . . . . . . . . . . . . . . . . . . . . . . . . . . . . . . . . . . 75
Save Resources . . . . . . . . . . . . . . . . . . . . . . . . . . . . . . . . . . . . . . . . . . . . . . . . . . . . . 75
Save Resources As . . . . . . . . . . . . . . . . . . . . . . . . . . . . . . . . . . . . . . . . . . . . . . . . . . 75
Load Desktop . . . . . . . . . . . . . . . . . . . . . . . . . . . . . . . . . . . . . . . . . . . . . . . . . . . . . . . 75
Save Desktop . . . . . . . . . . . . . . . . . . . . . . . . . . . . . . . . . . . . . . . . . . . . . . . . . . . . . . . 76
Restore Layout . . . . . . . . . . . . . . . . . . . . . . . . . . . . . . . . . . . . . . . . . . . . . . . . . . . . . . 76
Recently Used Files . . . . . . . . . . . . . . . . . . . . . . . . . . . . . . . . . . . . . . . . . . . . . . . . . . 76
Exit . . . . . . . . . . . . . . . . . . . . . . . . . . . . . . . . . . . . . . . . . . . . . . . . . . . . . . . . . . . . . . . 76
Edit Menu and Commands . . . . . . . . . . . . . . . . . . . . . . . . . . . . . . . . . . . . . . . . . . . . . . . . . . . . . 76
Undo . . . . . . . . . . . . . . . . . . . . . . . . . . . . . . . . . . . . . . . . . . . . . . . . . . . . . . . . . . . . . . 77
Redo . . . . . . . . . . . . . . . . . . . . . . . . . . . . . . . . . . . . . . . . . . . . . . . . . . . . . . . . . . . . . . 77
Cut . . . . . . . . . . . . . . . . . . . . . . . . . . . . . . . . . . . . . . . . . . . . . . . . . . . . . . . . . . . . . . . 77
Copy . . . . . . . . . . . . . . . . . . . . . . . . . . . . . . . . . . . . . . . . . . . . . . . . . . . . . . . . . . . . . . 77
Paste . . . . . . . . . . . . . . . . . . . . . . . . . . . . . . . . . . . . . . . . . . . . . . . . . . . . . . . . . . . . . 77
Edit . . . . . . . . . . . . . . . . . . . . . . . . . . . . . . . . . . . . . . . . . . . . . . . . . . . . . . . . . . . . . . . 77
Add . . . . . . . . . . . . . . . . . . . . . . . . . . . . . . . . . . . . . . . . . . . . . . . . . . . . . . . . . . . . . . . 78
Insert. . . . . . . . . . . . . . . . . . . . . . . . . . . . . . . . . . . . . . . . . . . . . . . . . . . . . . . . . . . . . . 78
Delete . . . . . . . . . . . . . . . . . . . . . . . . . . . . . . . . . . . . . . . . . . . . . . . . . . . . . . . . . . . . . 78
vii
FORECAST CAPACITY PLANNER USER’S GUIDE
Table of Contents
Options Menu and Commands . . . . . . . . . . . . . . . . . . . . . . . . . . . . . . . . . . . . . . . . . . . . . . . . . . 78
Report Fonts . . . . . . . . . . . . . . . . . . . . . . . . . . . . . . . . . . . . . . . . . . . . . . . . . . . . . . . . 79
View Options. . . . . . . . . . . . . . . . . . . . . . . . . . . . . . . . . . . . . . . . . . . . . . . . . . . . . . . . 80
Report Options . . . . . . . . . . . . . . . . . . . . . . . . . . . . . . . . . . . . . . . . . . . . . . . . . . . . . . 82
Graph Options . . . . . . . . . . . . . . . . . . . . . . . . . . . . . . . . . . . . . . . . . . . . . . . . . . . . . . 83
Resources. . . . . . . . . . . . . . . . . . . . . . . . . . . . . . . . . . . . . . . . . . . . . . . . . . . . . . . . . . 94
Thresholds . . . . . . . . . . . . . . . . . . . . . . . . . . . . . . . . . . . . . . . . . . . . . . . . . . . . . . . . 100
Prompt for all disks . . . . . . . . . . . . . . . . . . . . . . . . . . . . . . . . . . . . . . . . . . . . . . . . . . 100
Prompt for titles. . . . . . . . . . . . . . . . . . . . . . . . . . . . . . . . . . . . . . . . . . . . . . . . . . . . . 100
Change titles. . . . . . . . . . . . . . . . . . . . . . . . . . . . . . . . . . . . . . . . . . . . . . . . . . . . . . . 100
Forecast Menu and Commands . . . . . . . . . . . . . . . . . . . . . . . . . . . . . . . . . . . . . . . . . . . . . . . . 101
Forecast Options . . . . . . . . . . . . . . . . . . . . . . . . . . . . . . . . . . . . . . . . . . . . . . . . . . . 101
Graph Forecast. . . . . . . . . . . . . . . . . . . . . . . . . . . . . . . . . . . . . . . . . . . . . . . . . . . . . 101
Age Model. . . . . . . . . . . . . . . . . . . . . . . . . . . . . . . . . . . . . . . . . . . . . . . . . . . . . . . . . 102
Change Name. . . . . . . . . . . . . . . . . . . . . . . . . . . . . . . . . . . . . . . . . . . . . . . . . . . . . . 103
Copy to Clipboard . . . . . . . . . . . . . . . . . . . . . . . . . . . . . . . . . . . . . . . . . . . . . . . . . . . 103
Graph to Clipboard . . . . . . . . . . . . . . . . . . . . . . . . . . . . . . . . . . . . . . . . . . . . . . . . . . 103
Export Forecast . . . . . . . . . . . . . . . . . . . . . . . . . . . . . . . . . . . . . . . . . . . . . . . . . . . . 104
Validated Model . . . . . . . . . . . . . . . . . . . . . . . . . . . . . . . . . . . . . . . . . . . . . . . . . . . . 104
View Menu and Commands . . . . . . . . . . . . . . . . . . . . . . . . . . . . . . . . . . . . . . . . . . . . . . . . . . . 105
Toolbar . . . . . . . . . . . . . . . . . . . . . . . . . . . . . . . . . . . . . . . . . . . . . . . . . . . . . . . . . . . 105
Format Bar . . . . . . . . . . . . . . . . . . . . . . . . . . . . . . . . . . . . . . . . . . . . . . . . . . . . . . . . 106
Main Status Bar . . . . . . . . . . . . . . . . . . . . . . . . . . . . . . . . . . . . . . . . . . . . . . . . . . . . 107
Child Status Bar . . . . . . . . . . . . . . . . . . . . . . . . . . . . . . . . . . . . . . . . . . . . . . . . . . . . 107
Window Menu and Commands. . . . . . . . . . . . . . . . . . . . . . . . . . . . . . . . . . . . . . . . . . . . . . . . . 107
Help Menu and Commands . . . . . . . . . . . . . . . . . . . . . . . . . . . . . . . . . . . . . . . . . . . . . . . . . . . 108
Tip of the Day... . . . . . . . . . . . . . . . . . . . . . . . . . . . . . . . . . . . . . . . . . . . . . . . . . . . . 109
Help Topics. . . . . . . . . . . . . . . . . . . . . . . . . . . . . . . . . . . . . . . . . . . . . . . . . . . . . . . . 110
Using Help . . . . . . . . . . . . . . . . . . . . . . . . . . . . . . . . . . . . . . . . . . . . . . . . . . . . . . . . 110
About Forecast . . . . . . . . . . . . . . . . . . . . . . . . . . . . . . . . . . . . . . . . . . . . . . . . . . . . . 110
Shortcut Menu. . . . . . . . . . . . . . . . . . . . . . . . . . . . . . . . . . . . . . . . . . . . . . . . . . . . . . . . . . . . . . 111
Chapter 9
Model Creation and Validation . . . . . . . . . . . . . . . . . . . . . . . . . . . . . 113
Setting Thresholds . . . . . . . . . . . . . . . . . . . . . . . . . . . . . . . . . . . . . . . . . . . . . . . . . . . . . . . . . . 113
Forecast Thresholds . . . . . . . . . . . . . . . . . . . . . . . . . . . . . . . . . . . . . . . . . . . . . . . . . 113
Validation Thresholds . . . . . . . . . . . . . . . . . . . . . . . . . . . . . . . . . . . . . . . . . . . . . . . . 114
Loading a New Collection File . . . . . . . . . . . . . . . . . . . . . . . . . . . . . . . . . . . . . . . . . . . . . . . . . 116
viii
....
TABLE OF CONTENTS
Validation Messages . . . . . . . . . . . . . . . . . . . . . . . . . . . . . . . . . . . . . . . . . . . . . . . . 117
Validating the Model . . . . . . . . . . . . . . . . . . . . . . . . . . . . . . . . . . . . . . . . . . . . . . . . . . . . . . . . . 118
Validation Failures . . . . . . . . . . . . . . . . . . . . . . . . . . . . . . . . . . . . . . . . . . . . . . . . . . 118
Changing the Model . . . . . . . . . . . . . . . . . . . . . . . . . . . . . . . . . . . . . . . . . . . . . . . . . . . . . . . . . 121
Editing a Workload Group . . . . . . . . . . . . . . . . . . . . . . . . . . . . . . . . . . . . . . . . . . . . 122
Adding, Inserting, and Deleting Workload Groups . . . . . . . . . . . . . . . . . . . . . . . . . . 125
Editing Resources . . . . . . . . . . . . . . . . . . . . . . . . . . . . . . . . . . . . . . . . . . . . . . . . . . 126
Adding, Inserting, and Deleting Resources . . . . . . . . . . . . . . . . . . . . . . . . . . . . . . . 127
Saving and Reusing Desktops . . . . . . . . . . . . . . . . . . . . . . . . . . . . . . . . . . . . . . . . . . . . . . . . . 128
Saving the Active Desktop . . . . . . . . . . . . . . . . . . . . . . . . . . . . . . . . . . . . . . . . . . . . 128
Reloading a Saved Desktop File . . . . . . . . . . . . . . . . . . . . . . . . . . . . . . . . . . . . . . . 128
Restoring the Current Desktop . . . . . . . . . . . . . . . . . . . . . . . . . . . . . . . . . . . . . . . . . 128
Chapter 10
Model Forecasting . . . . . . . . . . . . . . . . . . . . . . . . . . . . . . . . . . . . . . . 129
Configuring the Forecast Model . . . . . . . . . . . . . . . . . . . . . . . . . . . . . . . . . . . . . . . . . . . . . . . . 129
Setting Forecast Options . . . . . . . . . . . . . . . . . . . . . . . . . . . . . . . . . . . . . . . . . . . . . 130
Setting Forecast Growth Rates . . . . . . . . . . . . . . . . . . . . . . . . . . . . . . . . . . . . . . . . 133
Aging the Forecast Model. . . . . . . . . . . . . . . . . . . . . . . . . . . . . . . . . . . . . . . . . . . . . . . . . . . . . 134
Creating Forecast Reports . . . . . . . . . . . . . . . . . . . . . . . . . . . . . . . . . . . . . . . . . . . . . . . . . . . . 134
Setting Report Fonts. . . . . . . . . . . . . . . . . . . . . . . . . . . . . . . . . . . . . . . . . . . . . . . . . 134
Setting Report Options . . . . . . . . . . . . . . . . . . . . . . . . . . . . . . . . . . . . . . . . . . . . . . . 135
Printing Forecast Reports . . . . . . . . . . . . . . . . . . . . . . . . . . . . . . . . . . . . . . . . . . . . . 136
Exporting Forecast Reports . . . . . . . . . . . . . . . . . . . . . . . . . . . . . . . . . . . . . . . . . . . 137
Appendix A
Keyboard Commands . . . . . . . . . . . . . . . . . . . . . . . . . . . . . . . . . . . . 139
Alternate Key Commands. . . . . . . . . . . . . . . . . . . . . . . . . . . . . . . . . . . . . . . . . . . . . . . . . . . . . 139
Two-key and Function Key Commands . . . . . . . . . . . . . . . . . . . . . . . . . . . . . . . . . . . . . . . . . . 139
File Menu Command Shortcuts . . . . . . . . . . . . . . . . . . . . . . . . . . . . . . . . . . . . . . . . 140
Edit Menu Command Shortcuts . . . . . . . . . . . . . . . . . . . . . . . . . . . . . . . . . . . . . . . . 142
Options Menu Command Shortcuts . . . . . . . . . . . . . . . . . . . . . . . . . . . . . . . . . . . . . 143
Forecast Menu Command Shortcuts . . . . . . . . . . . . . . . . . . . . . . . . . . . . . . . . . . . . 143
View Menu Command Shortcuts . . . . . . . . . . . . . . . . . . . . . . . . . . . . . . . . . . . . . . . 144
Window Menu Command Shortcuts . . . . . . . . . . . . . . . . . . . . . . . . . . . . . . . . . . . . . 144
Help Menu Command Shortcuts . . . . . . . . . . . . . . . . . . . . . . . . . . . . . . . . . . . . . . . 145
Appendix B
Program Messages . . . . . . . . . . . . . . . . . . . . . . . . . . . . . . . . . . . . . . 147
Confirmation Messages . . . . . . . . . . . . . . . . . . . . . . . . . . . . . . . . . . . . . . . . . . . . . . . . . . . . . . 147
ix
FORECAST CAPACITY PLANNER USER’S GUIDE
Table of Contents
Information Messages. . . . . . . . . . . . . . . . . . . . . . . . . . . . . . . . . . . . . . . . . . . . . . . . . . . . . . . . 148
Warning Messages . . . . . . . . . . . . . . . . . . . . . . . . . . . . . . . . . . . . . . . . . . . . . . . . . . . . . . . . . . 152
Error Messages. . . . . . . . . . . . . . . . . . . . . . . . . . . . . . . . . . . . . . . . . . . . . . . . . . . . . . . . . . . . . 152
List of Figures . . . . . . . . . . . . . . . . . . . . . . . . . . . . . . . . . . . . . . . . . . 157
List of Tables . . . . . . . . . . . . . . . . . . . . . . . . . . . . . . . . . . . . . . . . . . . 161
Index . . . . . . . . . . . . . . . . . . . . . . . . . . . . . . . . . . . . . . . . . . . . . . . . . . 163
x
1
INTRODUCTION
Welcome to Forecast Capacity Planner
Forecast Capacity Planner™ is a performance, capacity-planning tool that allows system
administrators and planners to answer questions about cost efficiency and system performance
throughout the life of a computer system.
Figure 1.1
Initial Forecast Capacity Planner screen
Forecast Capacity Planner (also referred to as Forecast) is a PC-based software tool that uses
data gathered by a host-based collector program to calculate and report present and future
system performance. Full-color graphs and reports allow system administrators and capacity
1
1
FORECAST CAPACITY PLANNER USER’S GUIDE
Introduction
planners to predict future hardware requirements, as well as determine the effect of application
changes.
Capacity planning is an integral part of managing computer resources for future growth. By
developing and maintaining a capacity planning strategy for your operation, you can ensure the
efficient management of your organization’s computer assets.
System Requirements
The Windows-based Forecast Capacity Planner program requires the following system hardware
and software.
Hardware
•
Personal computer with a 486/33 or higher processor (Pentium 166 recommended)
•
16 megabytes (MB) of RAM (32 MB recommended)
•
8 MB of free hard disk space (16 MB required for installation)
•
10X CD-ROM drive
•
256-color VGA or better video
•
Two-button mouse (a three-button mouse is recommended)
•
Connectivity to the host system
Software
•
Microsoft Windows 9X/NT 4.0/2000 operating system
•
Microsoft Internet Explorer 4.x (or higher) Web browser
Internet Explorer should be installed on your system to enable specific system files to be
updated.
•
•
2
A host data collector:
•
SOS/3000 Performance Advisor™ by Lund Performance Solutions
•
SOS/9000 Performance Advisor™ by Lund Performance Solutions
FTP (file transfer protocol) or terminal emulation software to transfer data log files from the
host system to the PC
Product Support
....
INTRODUCTION
Product Support
When you purchase support from Lund Performance Solutions, you benefit from the knowledge
and experience of our technical support team. We are glad to help you interpret data and resolve
performance issues. Our contracted product support entitles you to receive timely updates, bug
fixes, documentation and direct technical support.
Lund Performance Solutions Main Offices
Postal Address
Lund Performance Solutions
240 2nd Avenue SW
Albany OR 97321 USA
Internet URL
Visit the Lund Performance Solutions Web site at http://www.lund.com/.
Telephone Number
For customer and technical support, call (541) 812-7600, Monday through Friday during the hours
of 8:00 A.M. to 5:00 P.M. Pacific time, excluding holidays.
Fax Number
Transmit fax messages to (541) 812-7611.
E-mail Addresses
Send e-mail messages to:
•
Sales Team
info@lund.com
•
Technical Support Team
support@lund.com
•
Documentation Team
documentation@lund.com
•
Certified Trainers
lti@lund.com
•
Consulting Team
lcs@lund.com
3
FORECAST CAPACITY PLANNER USER’S GUIDE
Introduction
1
Lund Performance Solutions Sales Team
Lund Performance Solutions’ professional sales team is available to answer your sales and
customer support questions Monday through Friday during the hours 8:00 A.M. to 5:00 P.M.
Pacific time, excluding major holidays.
Please contact your sales representative for information about the latest Lund Performance
Solutions products, the Lund Software Subscription Plan, upgrade options and prices, and more.
Lund Performance Solutions Technical Support Team
At Lund Performance Solutions, we are working hard to provide you with intuitive software
products. Additionally, we try to provide superior online and printed documentation. However,
should you find yourself with a technical question that you cannot answer with the tools provided,
please contact our technical support team.
Our website also contains helpful information and FAQs for many technical support questions.
Visit http://www.lund.com/Support/index.html.
NOTE You must be a registered user to access Lund Performance
Solutions’ support services. Lund Performance Solutions’ support
services are subject to Lund Performance Solutions’ prices, terms,
and conditions in place at the time the service is used.
E-mail Tech Support
Ask questions and receive detailed answers from the technical support team by sending an email message to support@lund.com. Please include the product version with your question. You
will receive a reply by e-mail.
Telephone Tech Support
The technical support team is available by phone at (541) 812-7600, Monday through Friday
during the hours 8:00 A.M. to 5:00 P.M. Pacific time, excluding major holidays. Lund Performance
Solutions also provides after-hours emergency support, seven days a week.
When you call, please be at your computer, have the product documentation in hand, and be
prepared to provide the following information:
4
•
Product name and version number.
•
Type of computer hardware you are using.
•
Software version number of your operating system(s).
•
Exact wording of any messages that appear on your screen.
•
What you were doing when the problem occurred.
•
How you tried to solve the problem.
....
INTRODUCTION
Product Documentation
Lund Performance Solutions Documentation Team
Lund Performance Solutions makes every effort to produce the highest quality documentation for
our products, and we welcome your feedback. If you have comments or suggestions about our
online Help or printed guides, send an e-mail message to documentation@lund.com or contact
your account manager.
Lund Training Institute Certified Trainers
Lund Training Institute (LTI) presents system performance training courses at their corporate
training center in Oregon and at various locations across the United States and Canada
throughout the year. The Certified Trainer Program is designed for trainers from all educational
areas, including academia, consulting, and business.
For information about Lund Training Institute or to receive an application, please review the LTI
Web site (http://www.lund.com/Training/index.html), send an e-mail message to
lti@lund.com, or contact your Lund account manager.
Lund Consulting Services IT Consultants
Lund Consulting Services, a division of Lund Performance Solutions, offers strategic IT solutions
and expert support to a wide range of businesses. Our team of experienced IT professionals
provides onsite consulting, training, and project management services to help businesses
optimize their computer resources and achieve long-lasting success.
For information about Lund Consulting Services, please review our Web site at http://
www.lund.com/Consulting/Index.html, send an e-mail message to lcs@lund.com, or contact
your account manager.
Product Documentation
User’s Guide
This user’s guide accompanies the Forecast Capacity Planner software as a guide for the new
user and as a quick reference for experienced users.
This guide assumes that you have a working knowledge of the Windows operating system.
Document Conventions
The user interface in Forecast is designed to accommodate a variety of work styles. Some users
prefer using standard menu commands; others are more comfortable with shortcut menus,
keyboard commands or toolbar buttons.
Generally, standard menu commands appear in the procedural sections of this document.
Alternative methods of accessing menus, controls, and commands are discussed in “Keyboard
Commands” on page 139.
5
1
FORECAST CAPACITY PLANNER USER’S GUIDE
Introduction
Online Help System
In the online Help system, you will find explanations of the many features of Forecast, as well as
tips to guide you through the program’s basic functionality.
Reference Materials
6
•
Quantitative System Performance, Computer System Analysis Using Queueing Network
Models, Edward D. Lazowska, John Zahojan, G. Scott Graham, and Kenneth C. Sevcik.
Copyright ©1984 by Prentice-Hall, Inc.
•
SOS/3000 Performance Advisor User Manual. Copyright © 1992-2000 by Lund Performance
Solutions, Albany, Oregon, USA.
•
SOS/9000 Performance Advisor User Manual. Copyright © 1992-2000 by Lund Performance
Solutions, Albany, Oregon, USA.
•
Taming UNIX: UNIX Performance Management Series, Volume I, Robert A. Lund. Copyright
©1997 by Robert A. Lund.
2
PRODUCT OVERVIEW
Product Description
Forecast Capacity Planner (Forecast) allows system administrators and planners to answer whatif questions regarding the impact of new applications, additional users, performance tuning, and
hardware upgrades.
Using Forecast, an administrator can create models to view the future performance of the system
and address a variety of questions based on application workload and business growth, such as:
•
Can an upgrade be postponed until next year?
•
What response service levels can be expected?
•
What will be the effect of upgrading to a larger system?
•
Can we extend the life of the existing system by balancing workloads?
•
Will changes to applications change response times?
Components
Collection
A collection is a raw collection data file that contains information about a computer system that
has been gathered at time intervals specified by the user. This file usually includes information
about the processor, memory, disk statistics, and process information. A collection has not yet
been validated within Forecast. These are saved within Forecast as *.col files.
Model
A model is raw data attached to working algorithms and saved. By saving data as a model, the
user is verifying that the model accurately represents the actual data and information on their
systems. These are saved within Forecast as *.mdl files.
7
2
FORECAST CAPACITY PLANNER USER’S GUIDE
Product Overview
Resource
A resource is a hardware component of any host system, including CPUs and disk drives. These
can be saved within Forecast as a *.dat file in the Resource.dat file.
Center
A center is a collection of like resources (see previous section). For example, one or more CPUs
is a CPU center; one or more disk drives is a disk drive center.
Workload Group
A workload group is a group of similar, identifiable transactions on the host system performed by
individual users and programs. Workload groups can be grouped by:
•
Applications
•
User login
•
Departmental processes
•
Drive device
A workload group may be as simple as one user running one program, or as complex as entire
departments running many programs.
Desktop
A desktop is the current state of the Forecast display area, which includes the size and position
of the main program window and all of the charts or panes currently open in the application,
saved to disk as a Forecast desktop file (*.dsk). By saving and loading a desktop, a previous
session can be quickly and easily restored with minimal work duplication.
Product Audience
Forecast Capacity Planner is designed for use by MPE/iX and HP-UX host system administrators
and system planners. However, the usefulness of timely and accurate forecasting will benefit an
entire organization—from online users to top management.
8
....
PRODUCT OVERVIEW
Procedural Summary
Procedural Summary
Forecast Capacity Planner allows you to collect data from your system, build a baseline model of
your system, and create performance projections from that model. The major procedural steps in
the process include:
1
Identify the resources, (CPU, and disk drive types) on your host system.
2
Identify and characterize the workload groups on your host system.
3
Run the data collection and reduction software:
•
SOS/3000 Performance Advisor for MPE/iX™,
•
SOS/9000 Performance Advisor for HP-UX™,
to create a data collection file.
4
Transfer the data collection file to your PC to create an unvalidated model (a collection) in
Forecast Capacity Planner.
5
Create a model. Evaluate and modify the projected model as needed to ensure that it is an
accurate representation of your host system.
6
Validate the baseline model.
7
Create a performance projection for your validated model.
New Product Features
The following features have been added to the Forecast Capacity Planner product since version
B.0x:
•
With version C.0x, Forecast Capacity Planner is fully compliant with the Windows userinterface standards. Windows 9X/NT/2000 users will find the interface familiar and easy to
navigate. Menus and tools are logically placed and organized for quick access. All of the
commands needed to load, validate, and forecast a model are accessible from the Main
Program window.
•
A number of multi-step procedures are combined or automated in version C.0x. For
example, generating detailed information on model components is now done with a simple
mouse click.
•
The Save Desktop command in version C.0x allows you to save the current desktop as a
named file to preserve settings and layouts for future use.
If you have used earlier versions of Forecast Capacity Planner, you can use one of the Quick
Tours in Chapters 5 and 6 to familiarize yourself with the new features and functions in version
C.0x.
9
3
PRODUCT STARTUP
Starting Forecast Capacity Planner
To start Forecast Capacity Planner, do the following:
1
From the WIndows task bar, click Start.
2
From the Programs submenu, click Forecast 32.
3
From the Forecast 32 submenu, click Forecast 32.
Help Topics
To access the online indexed Help, select Help Topics from the Help menu. Select a book or
page from the Help Contents tab, or use the Index or Find tabs
Context-Sensitive Help
To access context-sensitive Help on a specific dialog box, click the Help button in the dialog box.
Help about the dialog box will display in a separate window.
To get context-sensitive Help elsewhere in Forecast, do either of the following:
•
Position your mouse over the item in question and press the F1 function key. This is
especially helpful for open dialog boxes that do not contain a Help button, as the Help
Toolbar button will not open dialog boxes and cannot be selected if a dialog box is already
open.
OR
•
Select the Help toolbar button
for use with toolbar buttons or menu items. This will
change the cursor to a question mark. Move the question mark pointer over an item and click
to get Help for that item.
11
3
FORECAST CAPACITY PLANNER USER’S GUIDE
Product Startup
Tip of the Day
The Tip of the Day box displays a different informational message each time Forecast Capacity
Planner is started on your PC. The messages are designed to help you enhance your productivity
when using Forecast Capacity Planner.
Exiting Forecast Capacity Planner
To exit the Forecast Capacity Planner program, select Exit from the File menu.
Uninstalling Forecast Capacity Planner
Running the Uninstall Forecast 32 program removes the Forecast Capacity Planner application
and all associated files from your PC.
To uninstall Forecast Capacity Planner, do the following:
1
From the WIndows task bar, click Start.
2
From the Programs submenu, click Forecast 32.
From the Forecast 32 submenu, click Uninstall Forecast 32.
12
4
DATA COLLECTION, EXTRACTION, AND EXPORT
Overview
Forecast Capacity Planner creates a model of your system based on the data collection (*.col)
files transferred from your MPE/iX system. To accurately predict future performance, it is
important to start with an accurate picture of your current system. The usefulness of your forecast
depends on the quality and relevance of your baseline data.
Some of the procedures described in this chapter require Lund Performance Solutions’ SOS
Performance Advisor software. Refer to your SOS Performance Advisor User’s Guide for further
information.
Data Collection Process
1
Identify host system resources.
2
Identify and characterize the workload groups on the host system.
3
Create a workload definition file.
4
Collect performance data on the host system.
5
Reduce the performance data on the host system.
6
Download/export performance data to the PC.
Identifying System Resources
The modeling algorithms used by Forecast Capacity Planner depend on the performance
attributes of the hardware. It is important to accurately identify the following components of the
host system:
•
Hardware configuration
•
CPU type
•
Disk drive type(s)
13
4
FORECAST CAPACITY PLANNER USER’S GUIDE
Data Collection, Extraction, and Export
NOTE The SOS Performance Advisor programs automatically
recognize most CPU types, but not disk drive types. It is important
to use the proper syntax to identify the disk drives on your system.
To use Forecast Capacity Planner to review the list of disk drives:
1
Run Forecast Capacity Planner as described in “Starting Forecast Capacity Planner” on
page 11.
2
On the Options menu, click Resources.
3
In the Resources dialog box, click the Disks tab.
4
Use the horizontal scroll bar to review the list of disk drives.
Identifying and Characterizing Workload
Groups
A workload group is a group of similar, identifiable transactions on the host system performed by
individual users and programs. Group processes to form a meaningful model of system usage.
Identifying and grouping similar components is the key to creating an accurate and useful model.
For example, workloads can be grouped by:
•
Applications
•
User login
•
Departmental processes
•
Disk devices
A workload group may be as simple as one user running one program, or as complex as entire
departments running many programs.
Forecast Capacity Planner creates a model of your host system using Mean Value Analysis
(MVA) queuing network algorithms. MVA algorithms use average workload groups to generate
system data. For that reason, make sure model inputs such as workload groups are
homogeneous. A homogeneous workload group consists of processes of a similar type, function,
and priority.
Averaging is meaningless for workload groups made up of dissimilar transactions. For example, if
an average accounts receivable transaction takes 200 milliseconds of the CPU’s time, while
general ledger transactions average 500 milliseconds, taking an average of the two does not
provide a meaningful average for either transaction.
Identifying Workload Groups
Input from management and system users is essential in identifying and defining workload
groups. Interview managers and users to determine how the system is used, and to identify
distinct functions, such as order entry, telemarketing, or accounting. Break down the various
departmental functions into essential components, based on your desired result. Identify
14
....
DATA COLLECTION, EXTRACTION, AND EXPORT
MPE/iX Host Data
groupings that will provide you with the needed information. These grouped components make up
your workload groups.
While it is important to keep your model as simple as possible and the number of workload
groups to a minimum, it is more important to keep all workload groups in the model as
homogeneous as possible. Do not sacrifice the accuracy of your model for simplicity.
Characterizing Workload Groups
Once you have identified your workload groups, use the following guidelines to further refine your
workload definitions:
•
Limit the components of any workload group to users or transactions with service demands
of comparable magnitude and similar balance across the system. Do not mix heavy-CPU/
low-I/O transactions with light-CPU/heavy-I/O transactions.
•
Do not mix interactive processes and batch processes in the same workload group. System
resources, priorities, and think times are different for interactive and batch processes.
•
Consider the desired outputs of the model when defining workload groups. For example, if
response times for database queries are a concern, do not group database queries with
other workload components. Create a separate workload group for this task, preferably
defined by user logon.
•
Use separate workload groups for specific divisions, branches, or departments as needed to
further refine the model.
•
Identify workload groups by user logon, if possible.
MPE/iX Host Data
Creating an MPE/iX Workload Definition File
You can use the three pre-defined MPE/iX workload groups or create your own workload
definitions file.
Predefined Workload Groups
Forecast Capacity Planner uses three predefined (default) workload groups:
•
JOB
Includes all batch job streams
•
SESSION
Includes all interactive (online) terminal sessions
•
SYSPROCS
Includes all system processes
If you prefer to use more specific workload groups, you may create a workload definitions file (see
the next section, "User-defined Workload Groups.").
15
4
FORECAST CAPACITY PLANNER USER’S GUIDE
Data Collection, Extraction, and Export
User-defined Workload Groups
Defining specific workload groups is a good way to track specific processes, such as processes
run by a specific department in your business. However, user-defined workload groups are
optional—they are not required to run Forecast.
Creating a Workload Definitions File
User-defined workload groups are created in the soswkdef.pub.lps file. Use your editor to create
an soswkdef file (quad.util.lps is included on the distribution tape).
The basic format of the soswkdef file requires three items for each workload group:
•
The name of the group (up to 10 characters).
•
The type of the processes included in the group (JOB, SESSION, or BOTH).
•
The user and/or program specifications (a list of one or both of the following):
•
USER
The account by which MPE knows you (your user or login ID)
•
PROG
The MPE fully-qualified program file name
Workload Definition File Configuration Rules
1
A workload group name of up to 10 characters is required.
2
A workload group type specification is necessary to indicate which types of processes to
include or exclude from the workload definition. This makes it possible to create two
workload groups for processes that run in both interactive and batch modes. For example:
•
JOB includes only batch processes.
•
SESSION includes only interactive (online) terminal sessions.
•
SYSPROCS includes only system processes.
3
Workload groups must be separated by one or more blank lines within a definition file.
4
Comments can be included on any line if preceded by an exclamation point (!).
5
Either a user or a program specification is required. The specification must be entered one
per line and must be one of the following three types:
•
A program specification (PROG=PROGRAM.GROUP.ACCOUNT).
•
A user specification (USER=SESSION, USER.ACCOUNT,GROUP). The session
name and logon group are optional.
•
The MPE logical device number (LDEV=nnn) or range of device numbers (LDEV=nnnnnn).
The symbol "@" can be used as a wildcard for any of the criteria, just as it can with normal
MPE/iX rules (partial or full).
16
....
DATA COLLECTION, EXTRACTION, AND EXPORT
MPE/iX Host Data
NOTE The drive specification means that you can capture activity on
a terminal-by-terminal basis, or even within a range of terminals.
Use this option carefully!
6
There is virtually no limit to the number of user, program, and LDEV specifications allowed
for each workload group.
7
The name and type of specification lines are required. All other lines are optional. In order to
be considered part of a workload group, a process must satisfy the program, user, and
LDEV specifications, if all three are present.
•
If more than one program specification lines are included, a program needs to satisfy
only one of the program specifications to be included in the group.
•
If no program specifications are entered, all process programs are considered to be in
the group, unless the process is somehow disqualified by the user or drive
specification.
•
The user and drive specifications are resolved in the same way. For instance, the lines
in the following example should be entered into the soswkdef file to define the
workload called "WORKTEST."
WORKTEST
!Workload name
SESSION
!Only terminals
PROG=@.PUB.MFG
PROG=MONEND.PUB.QTR
USER=JANE, MGR.MFG
USER=@,@.QTR
LDEV=50-60
Figure 4.1
Workload definition file (example)
For a process to be included in the WORKTEST workload group, it must satisfy only one
program specification, one user specification, and one LDEV specification. Each is
considered to be an "and" condition. For instance, a program, INVEN01.PUB.MFG, run by
MGR.QTR at LDEV 56 would be counted in the WORKTEST workload group.
8
When selecting any of the following system-type processes, the program group and the
account must be specified as "@."
•
Specify command interpreter processes by the program file name "ci" (PROG=ci).
•
Specify spooler processes by the program file name "sp" (PROG=sp).
•
All other system processes can be identified by name.
17
4
FORECAST CAPACITY PLANNER USER’S GUIDE
Data Collection, Extraction, and Export
To strip out command interpreters from the catch-all sessions workload group, create a
separate workload with the program name "ci" to track the response times for sessions. It
will reflect what the users actually experience.
9
A process can belong to only one workload group. If a process meets the criteria for two or
more groups, it will be assigned to the first workload group in the file for which it qualifies.
Collecting MPE/iX Performance Data
Data collection on an MPE/iX system can be accomplished with or without the SOS/3000
Performance Advisor software from Lund Performance Solutions.
Steaming the Data Collector Job with SOS/3000
24-hour Collection
To establish 24-hour continuous data collection, do the following:
From the HP e3000 terminal, type :Stream sosmonj.pub.lps
8-hour Collection
To establish 8-hour continuous data collection, do the following:
From the HP e3000 terminal, type :Stream sosjob.pub.lps
Steaming the Data Collector Job without SOS/3000
24-hour Collection
To establish 24-hour continuous monitoring, do the following:
1
From the HP e3000 terminal, verify the Duration of job in minutes value is 0 (zero).
2
Type :Stream fcpcolj.pub.lps
These changes will cause the fcpcolj job to automatically restream itself every 24 hours at
midnight. If your backup jobs kill this job, you will need to restream it as part of a daily routine.
8-hour Collection
To establish 8-hour continuous data collection, do the following:
18
1
From the HP e3000 terminal, verify the Duration of job in minutes value is 480.
2
Comment out the Stream fcpcolj line near the bottom of the screen. Do not remove the line.
3
Type :Stream fcpcolj.pub.lps
....
DATA COLLECTION, EXTRACTION, AND EXPORT
MPE/iX Host Data
Changing the Sampling Interval Length
By default, the performance data sampling interval for all data collection job streams is 300
seconds (five minutes). Every five minutes, an average of all performance indicators for the
current cycle is recorded in the log file.
To change the interval:
1
Locate the Data collection interval in seconds line in the job stream file.
2
Replace the default value with the desired number of seconds.
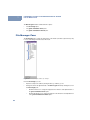
Extracting MPE/iX Performance Data
The SOS Performance Advisor SOSLOGX program reduces data from the collected log files,
based on the criteria defined by the user. The process consists of two steps:
1
The program scans the collected data and selects only the records that meet criteria set by
the user.
2
The program creates a data file to download to your PC.
Running SOSLOGX
To run SOSLOGX:
1
Enter the command Run soslogx.pub.lps at the prompt.
2
Enter the following information as prompted:
a
The start date of the initial sample using the format mm/dd/yy. If you do not provide a
date, the program will retrieve the earliest sample date recorded by default.
b
The start time using the format hh:mm. If you do not provide a start date, the program
will retrieve the start time of the earliest sample data recorded, by default.
If the SOSLOGX parameters are acceptable, go to the next section, “Creating the SOSLOGX
Reduction File” on page 21.
19
4
FORECAST CAPACITY PLANNER USER’S GUIDE
Data Collection, Extraction, and Export
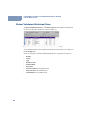
1
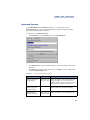
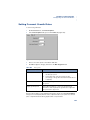
From the log screen, select OPTIONS (F1). The SOSLOGX MAIN OPTION MENU displays.
SOSLOGX MAIN OPTION MENU
1)
Current log file location (LOGFILES.LPS)
2)
Display process information (Y)
3)
Use function keys to select reports (Y)
4)
Process display option menu (SUBMENU)
5)
Data break configuration menu (SUBMENU)
6)
Export file configuration menu (SUBMENU)
7)
Log information exclusions (SUBMENU)
8)
Zone configuration (SUBMENU)
9)
Report card configuration (SUBMENU)
10)
Forecast data reduction configuration (SUBMENU)
11)
Performance Gallery configuration (SUBMENU)
12)
Report output configuration menu (SUBMENU)
Which Option:__
Figure 4.2
SOSLOGX Main Option Menu
2
Select option 10, Forecast data reduction configuration (SUBMENU).
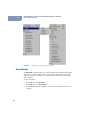
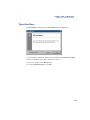
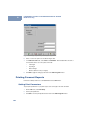
3
Press the Enter key. The SOSLOGX Forecast Data Reduction submenu displays.
SOSLOGX Forecast Data Reduction
1)
Workload analysis period minimum time (10)
2)
Workload analysis period decay percentage (95)
3)
Workload analysis start buffer time (10)
4)
Workload analysis end buffer time (10)
5)
Load sample analysis period minimum time (60)
6)
Load sample analysis period decay percentage (30)
7)
Suspicious delay time warning threshold percentage (30)
8)
Memory wait warning threshold percentage (30)
Which Option:__
Figure 4.3
20
SOSLOGX Forecast Data Reduction Configuration Menu
....
DATA COLLECTION, EXTRACTION, AND EXPORT
MPE/iX Host Data
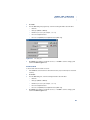
4
If necessary, reset the parameters as follows:
a
In the space at the bottom of the screen, type the number of the parameter to be
changed and press Enter.
b
Type the new value.
c
Press Enter.
5
Select EXIT OPTIONS (F8). The program will ask if you want to save these options.
6
Press the F1 key or Y key to save the options.
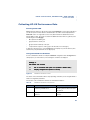
Creating the SOSLOGX Reduction File
To create the SOSLOGX reduction file:
1
Select UTILITY KEYS (F5).
2
Select FORECAST ANALYSIS (F5). A series of prompts appears. Respond to the prompts
as outlined in Table 4.1
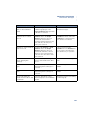
Table 4.1
SOSLOGX Forecast Analysis prompts
Prompt
Response
Enter name of output collection file:
Type an MPE file name for the data
file.
Enter the reduction period start date (mm/dd/
yy):
Type the month, day, and year using
the format given.
Enter the reduction period start time
(hh:mm):
Type the start time using the format
given.
Enter the reduction period end date (mm/dd/
yy):
Type the month, day, and year using
the format given.
Enter the reduction period end time (hh:mm):
Type the end time using the format
given.
3
Press Enter.
4
The program scrolls through the system configuration, including CPU and disk types, then
asks if this configuration is correct.
5
•
Type Y if the current configuration is correct.
•
Type N if the current configuration is not correct. You will then be prompted to change
the CPU(s) and each of the disks for your system.
The program scans the appropriate log files and writes the reduction file. The extraction
process may take a few moments to several minutes to complete, depending on the size of
the data file and the speed of your computer’s processor.
21
FORECAST CAPACITY PLANNER USER’S GUIDE
Data Collection, Extraction, and Export
4
As the program runs, a series of informational messages displays. You may want to print these
messages for later reference.
Evaluating the SOSLOGX Reduction File
By default, the program chooses a period when the CPU is most busy. Review the reduction file to
determine if the data is an accurate representation of activity on the system.
•
If you are satisfied that the reduction is accurate, press the Y key to save the reduction file to
your user’s group.
•
If you are not satisfied with the reduction, press the N key. The program will ask you to define
a new period.
Exiting SOSLOGX
To exit SOSLOGX:
1
Select MAIN KEYS (F8).
2
Select EXIT SOSLOGX (F8).
3
Press the Y key to confirm.
Exporting MPE/iX Performance Data
Close SOSLOGX before exporting files. The transfer of data from the MPE/iX system to the PC
requires:
•
A PC connected to the host MPE/iX system
•
FTP (file transfer protocol) or terminal emulation software such as Reflections, Business
Session for Windows, MiniSoft32, Or AdvanceLink
Refer to the documentation provided with your terminal emulation software for instructions to
download from the MPE/iX system to the PC using binary format. The name of the file on the
PC should include the extension ".col." The extension can be added during the download
process, or the file can be renamed after it is transferred to the PC.
HP-UX Host Data
Creating an HP-UX Workload Definition File
Once you have identified and refined your workload groups as described in “Identifying and
Characterizing Workload Groups” on page 14, enter the data in a workload definition file.
User-defined Workload Groups
User-defined workload groups are created in /opt/lps/lib/workdefs. Use your editor to create the
workdefs file.
22
HP-UX Host Data
....
DATA COLLECTION, EXTRACTION, AND EXPORT
Workload Definition Requirements
The workdefs file requires the following information for each workload:
•
The name of the workload, up to ten characters.
•
The type of process or processes included in the workload, such as ATTACH, DETACH,
SYS, or ALL.
•
The user or program specification, including one or more of the following (see Figure 4.4 for
an example):
•
USER (your user ID or logon ID).
•
PROG (the name of the executable program file).
•
TTY (the device name of your terminal).
•
GROUP (the user group identification).
FINANCE
!Name of workload
BOTH
!Group type (ATTACH/DETACH/SYS/BOTH/ALL)
USER=johndoe
!User specifications (optional)
GROUP=managers
!Group identification
TTY=ttyp1
!Device file specification
!At least on blank line (required)
EDITORS
!Name of workload
ATTACH
!Group type
PROG=vi
!Program file name
PROG=ed
!Program file name
!At least one blank line (required)
COMPILING
!Name of workload
BOTH
!Group type
PROG=cobol
!Program file name
PROG=c
!Program file name
Figure 4.4
HP-UX sample workload definition file
Workload Definition File Configuration Rules
Use the following guidelines to create or edit workload definition files:
•
Separate workloads by one or more blank lines.
•
Include comments on any line, if desired, preceded by an exclamation character (!).
23
4
FORECAST CAPACITY PLANNER USER’S GUIDE
Data Collection, Extraction, and Export
•
•
A workload type specification is needed to indicate the types of processes to include or
exclude from the workload definition. This makes it possible to create two workloads for
processes that run in both interactive and batch modes. For example:
•
DETACH (detached processes).
•
ATTACH (attached processes).
•
SYS (HP-UX system processes).
•
BOTH (detached and attached processes, but not system processes).
•
ALL (all processes).
Program and user specifications are specified by:
•
PROG=program name.
•
USER=user name/group name. System group names are valid specifications. Check
the /etc/group file for a list of existing group names.
For more information about group names, refer to your HP-UX HP 9000 Reference,
Volume 3, Section 5, regexp (Regular Expressions).
24
•
Device file specifications, such as TTY=tty0p2, are also valid. You can capture activity on a
terminal-by-terminal basis, or for multiple terminals.
•
There is no limit to the number of user, program, and tty specifications allowed for each
workload.
•
Name and type specification lines are required. All other lines are optional.
•
To be included in a workload group, a process must satisfy the program, user, and tty
specifications, if all three are present.
•
If one or more program specification lines are included, a program needs to satisfy only
one of these to be included in the group.
•
If no program specifications are entered, only users and/or devices are specified, then
all process programs are included in the group, unless the process is somehow
disqualified by the user or tty specifications.
•
A process can belong to only one workload group. If it fits the criteria for two or more groups,
it is assigned to the first workload in the file for which it qualifies.
•
Three workloads appear by default: DETACH, ATTACH, and SYS. Processes that do not fit
into user-defined workload groups will be included in one of these pre-defined workload
groups.
....
DATA COLLECTION, EXTRACTION, AND EXPORT
HP-UX Host Data
Collecting HP-UX Performance Data
Running SOSLOGD
SOS Performance Advisor for HP-UX uses the program SOSLOGD to collect and log raw data on
your HP-UX system for later extraction and download for use with Forecast Capacity Planner.
SOSLOGD creates one logical file record for every batch interval. The default interval is 10
minutes (600 seconds). The log file is saved in the SOS Performance Advisor log directory and
named using the format SLyyjjjs.
•
SL represents the SOS log file.
•
yy represents the current year.
•
jjj represents the Julian day of the year.
•
s represents the sequence of the log (up to 26 characters, from a through z).
To begin the collection process, enter soslogd at the shell prompt of your home directory. This
assumes that your path statements are set up properly.
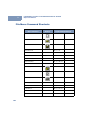
Using Command Line Switches
Use the command line switches to modify the SOSLOGD configuration. Enter soslogd -h at the
shell prompt of your home directory. The following list of switches are displayed
$soslogd -h
SOS command line switches
-c
Run in continuous mode (must kill w/LPSKILL <daemon name>)
-o
Display configuration options at startup
Figure 4.5
SOSLOGD command line switches
The effects of the command line switches vary depending on whether you are using the default or
advanced configuration parameters.
The functions of the command line switches are summarized in Table 4.2.
Table 4.2
Switch
SOSLOGD command line switch functions
Result (Default)
Result (Advanced)
-c
Log continuously (24 hours) by
restarting at 00:00 hours.
Log continuously (24 hours) by
restarting after the Run Time value
has expired.
-h
Display the command line
switches.
Display the command line
switches.
25
4
FORECAST CAPACITY PLANNER USER’S GUIDE
Data Collection, Extraction, and Export
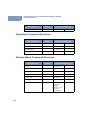
Switch
-o
Result (Default)
Result (Advanced)
Display the default configuration.
Display the configuration
parameters in the .soslogrc file.
Default Configuration Parameters
To view the default configuration parameters for your system, type soslogd -o from your home
directory. The default parameters are described in Table 4.3.
SOSLOGD default configuration parameters
Table 4.3
Parameter
Description
Enter duration of job in minutes (0)
The duration of the job is 24 hours.
Interval time in seconds (600)
The program will take a sample and write
a log record every 10 minutes.
Company name ( )
The company name is blank, by default.
Display advice messages (Y)
SOSLOGD will display advice messages.
Advanced Configuration Parameters
To create a custom configuration parameter file:
1
Create a custom file, .soslogrc, with your editing program, listing the parameters as
described in Table 4.4.
SOSLOGD advanced configuration parameters
Table 4.4
Parameter
26
Description
Run time
The amount of time (minutes) SOS Performance Advisor will
monitor your system’s processes.
Cycle time
The amount of time (seconds) between samples.
Company name
Your company name (added to the title of each log report). (This
can be the name of your system or another subheading, if desired.)
2
Place the .soslogrc file in your home directory (the same directory as SOSLOGD) to enable
batch logging parameters.
3
To change the configuration, edit the parameters in the .soslogrc file. For example:
•
To collect data in one-hour batches, change the batch run time to 60 minutes by typing
Batch Run Time=60.
•
To shorten the interval time to five minutes (300 seconds), type Cycle Time=300.
•
To add the name of your company (or another subheading) to the title of each log
report, type Company Name=<your company’s name>.
....
DATA COLLECTION, EXTRACTION, AND EXPORT
HP-UX Host Data
Batch Run Time = 60
Cycle Time = 300
Company Name = Acme Systems
Figure 4.6
Sample of user-defined configuration parameters (.soslogrc file)
Extracting HP-UX Performance Data
The SOS Performance Advisor SOSLOGX program extracts data from the collected log files,
based on the criteria defined by the user. The extraction process consists of two steps:
1
The program scans the collected data and selects only the records that meet criteria set by
the user.
2
The program creates a data file to download to a PC.
Running SOSLOGX
To run SOSLOGX:
1
From your home directory, enter soslogx at the prompt.
2
Enter the following information as prompted:
a
The start date of the initial sample using the format mm/dd/yy. If you do not provide a
date, the program will retrieve the earliest sample date recorded by default.
b
The start time using the format hh:mm. If you do not provide a start date, the program
will retrieve the earliest sample data recorded for that date, by default.
Modifying SOSLOGX Parameters
If the SOSLOGX parameters are acceptable, go to the next section, “Creating the SOSLOGX
Reduction File” on page 29.
To modify the current SOSLOGX parameters:
27
4
FORECAST CAPACITY PLANNER USER’S GUIDE
Data Collection, Extraction, and Export
1
From the log screen, select OPTIONS (F1). The SOSLOGX MAIN OPTION MENU displays
(see Figure 4.7).
SOSLOGX MAIN OPTION MENU
1)
Current log file location (/opt/lps/log)
2)
Company name ( )
3)
Use function keys to select reports (N)
4)
Maximum lines per report page (60)
5)
Data break configuration menu (SUBMENU)
6)
Log information exclusions (SUBMENU)
7)
Export file configuration menu (SUBMENU)
8)
Forecast data reduction configuration (SUBMENU)
9)
Performance Gallery configuration (SUBMENU)
Which Option:__
Figure 4.7
SOSLOGX Main Option Menu (HP-UX)
2
Select option 8, Forecast data reduction configuration (SUBMENU).
3
Press the Enter key. The SOSLOGX Forecast Data Reduction submenu displays.
SOSLOGX Forecast Data Reduction
1)
Workload analysis period minimum time (10)
2)
Workload analysis period decay percentage (95)
3)
Workload analysis start buffer time (10)
4)
Workload analysis end buffer time (10)
5)
Load sample analysis period minimum time (60)
6)
Load sample analysis period decay percentage (95)
7)
Suspicious delay time warning threshold percentage (30)
8)
Memory wait warning threshold percentage (30)
Which Option:__
Figure 4.8
28
SOSLOGX Forecast Data Reduction Configuration Menu (HP-UX)
....
DATA COLLECTION, EXTRACTION, AND EXPORT
HP-UX Host Data
4
5
If necessary, reset the parameters as follows:
a
In the space at the bottom of the screen, type the number of the option to be changed
and press Enter.
b
Type the new value.
c
Press Enter.
Select EXIT OPTIONS (F8).
Creating the SOSLOGX Reduction File
To create the SOSLOGX reduction file:
1
Select UTILITY KEYS (F5).
2
Select FORECAST ANALYSIS (F5). A series of prompts appears.
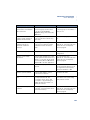
Table 4.5
Forecast prompts
Prompt
Response
Enter name of output collection file:
Type a name for the data file. Include the
collection file extension (*.col).
Enter the reduction period start date
(mm/dd/yy):
Type the month, day, and year using the
format given.
Enter the reduction period start time
(hh:mm):
Type the start time using the format
given.
Enter the reduction period end date (mm/
dd/yy):
Type the month, day, and year using the
format given.
Enter the reduction period end time
(hh:mm):
Type the end time using the format given.
3
Press Enter.
The program scans the appropriate log files and writes the reduction file. The extraction process
may take a few moments to several minutes to complete, depending on the size of the data file
and the speed of your computer’s processor.
As the program runs, a series of informational messages displays. You may want to print these
messages for later reference.
Evaluating the SOSLOGX Reduction File
By default, the program chooses a period when the CPU is most busy. Review the reduction file to
determine if the data is an accurate representation of activity on the system.
•
If you are satisfied that the reduction is accurate, press the Y key to save the reduction file to
your user’s group.
•
If you are not satisfied with the reduction, press the N key. The program will ask you to define
a new period.
29
4
FORECAST CAPACITY PLANNER USER’S GUIDE
Data Collection, Extraction, and Export
Exiting SOSLOGX
To exit SOSLOGX:
1
Select MAIN KEYS (F8).
2
Select EXIT SOSLOGX (F8).
3
Press the Y key to confirm.
Exporting HP-UX Performance Data
Transferring the data from the host system to your PC requires:
•
A PC connected to the host system.
•
FTP (file transfer protocol) or terminal emulation software, such as Reflection, Business
Session for Windows, MiniSoft92, or AdvanceLink.
Refer to the documentation for your terminal emulation software and select the option to
download from the host system to the PC using binary data format.
The name of the file on the PC should include the extension for collection files (*.col). The
extension can be added to the file during the download or the file can be renamed after it is
downloaded to the PC.
30
5
QUICK TOUR FOR MPE/IX SYSTEMS
Overview
The Quick Tour in this chapter introduces first-time users to the features and functions of Forecast
Capacity Planner. For users upgrading from earlier versions of the software, these tours provide a
quick and easy way to get acquainted with the changes in the current version.
Before beginning the tour, install Forecast Capacity Planner along with the appropriate sample
files on your personal computer.
Running Forecast Capacity Planner
Run Forecast Capacity Planner on your personal computer as described in “Starting Forecast
Capacity Planner” on page 11.
Loading a Collection File
Forecast Capacity Planner creates a model of your system based on the data collection (*.col)
files transferred from the host system. See “MPE/iX Host Data” on page 15 for information on
host data collection and data transfer.
Your software includes a sample collection file (HP3000A1.col) for use with this tour.
To load the collection file:
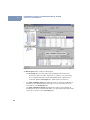
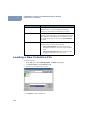
1
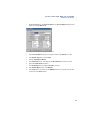
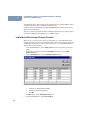
On the File menu, click Load/Validate model. The Open dialog box will appear (Figure 5.1).
2
In the Files of type list, click Collections (*col).
3
Click once on the collection file, HP3000A1.col, to select the file.
31
5
FORECAST CAPACITY PLANNER USER’S GUIDE
Quick Tour for MPE/iX Systems
Figure 5.1
4
Open dialog box (showing *.col files)
Click Open to load the collection file.
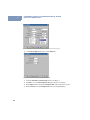
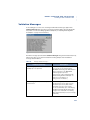
Choosing a CPU Equivalent
In some instances, the CPU naming conventions on the host will differ from those on the PC.
When that happens, Forecast will generate the Choose CPU dialog.
Figure 5.2
Choose CPU dialog box
The Choose CPU dialog states which CPU type cannot be found by the Forecast application. In
the example shown in Figure 5.2, the CPU in question is a 3000/957. To resolve the issue, select
the equivalent CPU name from the pull-down list (for example, 3000/957) and click OK.
32
....
QUICK TOUR FOR MPE/IX SYSTEMS
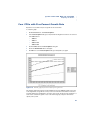
Previewing the Unvalidated Baseline Model
Investigating Validation Messages
As the loading process runs, you will receive a list of warnings and informational messages in the
Validation Messages dialog (Figure 5.3). These messages provide information about workload
groups that may violate one or more modeling algorithm assumptions. For information about
these assumptions, see “Validation Failures” on page 118.
Figure 5.3
Validation Messages dialog box
Normally, you would investigate the causes of these messages and determine what, if any,
influence they have on your model. It may be necessary to repeat running the data collection
process to collect another sample from the host system. Information about evaluating workload
groups is provided in “Identifying and Characterizing Workload Groups” on page 14.
For this exercise, assume that the messages do not affect the validity of the model. Click OK to
continue.
Previewing the Unvalidated Baseline Model
When the loading procedure is complete, the Main Program window will display. The name of the
file will also appear at the top left corner of the Forecast window. The window contains the
unvalidated data loaded from the host system. (The model is not validated until it is saved in the
Model (*.mdl) format.) The Main Program window for an unvalidated model is divided into three
panes:
•
The file manager pane.
•
The global unvalidated centers pane.
•
The global unvalidated workloads pane.
The content of each pane is described following the example shown in Figure 5.4.
33
5
FORECAST CAPACITY PLANNER USER’S GUIDE
Quick Tour for MPE/iX Systems
Figure 5.4
Main Program window panes (unvalidated model)
The file manager pane
The file manager pane is a representation of the unvalidated model in outline form.
•
To expand or collapse the outline, click the Plus (+) or Minus (-) icons (respectively) within
the file manager pane.
•
To access detailed information, click the individual CPU, Disk, or Workload icons.
•
•
Clicking on Centers (or anything contained within) will cause the Workloads pane to be
hidden. Clicking on Workloads (or anything contained within) will cause the Centers
pane to be hidden. To re-display both panes, click on the file name (HP 3000 MPE/iX
Tutorial A1).
To edit items on the file manager pane, double-click the associated icon.
The global unvalidated centers pane
The global unvalidated centers pane displays the results for each CPU and disk drive in the
model. To view detailed information about a single resource in the model, click the associated
icon in the file manager pane.
34
....
QUICK TOUR FOR MPE/IX SYSTEMS
Previewing the Unvalidated Baseline Model
The global unvalidated workloads pane
The global unvalidated workloads pane displays the results for each workload group included
in the model. To view detailed information about a single workload group in the model, click the
associated icon in the file manager pane.
Validation Thresholds
Normally, you would review the data in the Main Program window to determine if the model is a
valid representation of the system’s baseline performance. For this exercise, assume that the
model is valid.
Acceptable validation thresholds for each system resource are listed in the following table.
Resource
Pane/Column
CPU utilization
Acceptable Validation
Variance
up to 15 percent
Transaction/hour
(throughput)
Workloads/ Var: Tran/Hr
up to 30 percent
Response time
Workloads/ Var: Resp.
Time
up to 30 percent
Disk I/O/second
Centers/ Var: IO/sec
Disk queue length
Centers/ Var: Avg. Queue
Length
Variances for disk I/O/second
and disk queue length are
ignored because most real-world
situations do not account for
issues like database spreading.
If your numbers are out of range, review your workload definitions as described in “Identifying and
Characterizing Workload Groups” on page 14. Model numbers can be changed in the Edit
Workload screen. To change your variances:
1
Select the workload group to revise.
2
Press Enter.
3
In the Edit Workload screen, make your changes.
4
Press OK.
35
5
FORECAST CAPACITY PLANNER USER’S GUIDE
Quick Tour for MPE/iX Systems
Validating the Baseline Model
Validate the baseline model you have created:
1
On the Forecast menu, click Validated Model.
2
In the forecast dialog box, click Yes to begin the validation process. Notice that the name of
the document (top left corner of the window) changes from HP3000A1.col to
HP3000A1.mdl.
3
On the File menu, click Save Model As....
4
In the Save As dialog box, click Save to save the model in the default location on your
computer.
Graphing the Model
The validated model created in the previous steps provides an accurate snapshot of your host
system. The real power of Forecast Capacity Planner is its ability to predict future performance
based on user-supplied what-if scenarios designed to illustrate the forecasting and graphing
capabilities of the software.
The examples in this section are based on the following assumptions:
•
Standard system performance tuning (defragging and balancing disk drives, repacking the
database, etc.) will not significantly reduce CPU utilization or dramatically improve online
response time, or reduce batch job completion time.
•
Workload definitions on the host system are unchanged.
•
Memory size and the type of disk drives are unchanged.
One CPU with Zero Growth Rate
For this example, graph the model validated in the previous exercises and assume no change in
utilization occurs for 24 months.
To create the graph:
36
Graphing the Model
1
....
QUICK TOUR FOR MPE/IX SYSTEMS
On the Forecast menu, click Forecast Options. The Forecast Options dialog box will
appear, showing the Options tab.
Figure 5.5
Forecast Options dialog box: Options tab
2
In the Forecast Options dialog box, change the number in the Periods box to 24.
3
In the Growth Type list box, select Linear.
4
Verify the Period type is Month.
5
In the Workloads list box, verify that only the All workloads check box is selected.
6
Select the Adjust Results check box.
7
In the Graph Type list box, verify that CPU Util is selected.
8
In the Growth Option list box, click Override.
9
In the CPUs list box, verify that only the 3000/957 check box is selected (clear all other
check boxes in the CPUs list box).
37
5
FORECAST CAPACITY PLANNER USER’S GUIDE
Quick Tour for MPE/iX Systems
Figure 5.6
10
In the Forecast Options dialog box, click the Rates tab.
Figure 5.7
11
38
Forecast Options dialog box: Options tab with new settings
Forecast Options dialog box: Rates tab
Verify that Tiered rate and Growth rate are both set to 0 (zero).
12
Click OK to close the Forecast Options dialog box and save your changes.
13
On the Options menu, deselect the Prompt for titles option if it has been selected.
14
On the Forecast menu, click Graph Forecast. The forecast graph displays.
Graphing the Model
Figure 5.8
....
QUICK TOUR FOR MPE/IX SYSTEMS
Baseline graph for one CPU with zero growth rate
NOTE If the graph labels are overlapped, adjust the Font and Size
parameters in the Graph Options dialog box from the Options menu
(see “Fonts Options” on page 85 and “Sizes Options” on page 86).
The upper line (XL Threshold) in the example graph (Figure 5.8) represents the CPU utilization
threshold of 85 percent. 85 percent is the default threshold limit for MPE/iX systems and is
generally considered the level at which response time and batch process completion rates
become unacceptable. For information on changing threshold limits, see “Setting Thresholds” on
page 113.
The lower line (All workload groups) in the graph represents overall CPU utilization for all
workload groups identified in the model (3000/957). The modeled CPU utilization of 67.1 percent
is approximately 18 percent below the threshold limit of 85 percent.
39
5
FORECAST CAPACITY PLANNER USER’S GUIDE
Quick Tour for MPE/iX Systems
Four CPUs with Zero Growth Rate
In this example, compare the baseline forecast for your original model with three larger CPUs.
To create the graph:
1
On the Forecast menu, click Forecast Options.
2
In the Forecast Options dialog box, select the following CPU check boxes in the CPUs list
box:
3
•
3000/957 (CPU selected in original model)
•
3000/977
•
3000/992-100
•
3000/995-200
Click OK to close the Forecast Options dialog box and update your graph.
Figure 5.9
Baseline graph for four CPUs with zero growth rate
The upper line (XL Threshold) in the graph represents the 85 percent CPU utilization threshold for
MPE/iX. The other four lines represent the CPU utilization for each of the four CPUs, based on
the workload groups identified in the original, baseline model.
As expected, the larger CPUs show a lower utilization rate for the modeled workload groups. The
3000/995-200, for example, can handle the same workload groups with approximately 21 percent
CPU utilization, compared with 67.1 percent CPU utilization on the 3000/957.
40
Graphing the Model
....
QUICK TOUR FOR MPE/IX SYSTEMS
Four CPUs with Five-Percent Growth Rate
Repeat the forecast with a five-percent growth rate for all four CPUs.
To create the graph:
1
On the Forecast menu, click Forecast Options.
2
In the Forecast Options dialog box, verify that the following CPU check boxes are selected
in the CPUs list box:
•
3000/957
•
3000/977
•
3000/992-100
•
3000/995-200
3
Click the Rates tab in the Forecast Options dialog box.
4
Click in the Growth Rate text box and type 5.
5
Click OK to close the Forecast Options dialog box and update your graph.
Figure 5.10
Baseline graph for four CPUs with five-percent growth rate
This example graph represents the modeled utilization rate for the 3000/957 relative to the rates
for the larger CPUs at a growth rate of five percent over 24 months. Notice that the model does
not simply add five-percent utilization to the rate for each month. The five-percent growth rate is a
factor used to calculate the growth of each of the workload groups, subject to the modeled
capacity of the system.
41
5
FORECAST CAPACITY PLANNER USER’S GUIDE
Quick Tour for MPE/iX Systems
For example, the plotted curve for the 3000/957 begins to flatten at the threshold limit of 85
percent. The amount of increase in CPU utilization is constrained by the model as the CPU
approaches 100 percent utilization.
Without remedial action, the 3000/957 will reach the threshold capacity in December 2000.
Remedial action might include replacing the 3000/957 with a larger CPU, or improving system
performance.
Utilization by Workload Group for One CPU
For the last example, graph your original model for the 3000/957 for each workload group,
assuming a five-percent growth rate.
To create the graph:
1
On the Forecast menu, click Graph Forecast to close the graph and return to the Main
Program window.
2
Note the percent utilization for each workload group displayed in the global validated
workloads pane.
Figure 5.11
Main Program window: global validated workloads pane
The CPU utilization for each workload group should read:
3
42
•
NETBASE:
3.0
•
NET SERVIC:
4.5
•
UTIL:
2.1
•
TELEMARKET
5.8
•
CHICAGO
13.2
•
ORDER ENTR
19.1
•
JOBS
19.4
On the Forecast menu, click Forecast Options.
Graphing the Model
....
QUICK TOUR FOR MPE/IX SYSTEMS
4
In the Workloads list box, deselect the All Workloads check box. Select each of the seven
workloads individually.
5
In the Forecast Options dialog box, deselect all of the CPUs except the 3000/957 in the
CPUs list box.
Figure 5.12
Forecast Options dialog box, Options tab
6
Click OK to close the Forecast Options dialog box and save your changes.
7
On the Forecast menu, click Graph Forecast. The forecast graph displays.
Figure 5.13
Graph showing utilization by workload group for one CPU
43
5
FORECAST CAPACITY PLANNER USER’S GUIDE
Quick Tour for MPE/iX Systems
The utilization growth for each workload group is plotted based on the workload definition given in
the data collection file and the constraints in the baseline model.
As expected, the larger workload groups, JOBS and ORDER ENTR, contribute the most to the
85-percent system threshold.
This type of forecasting can predict the impact of adding workload groups to an existing system. It
is also useful in balancing workload groups across multiple systems.
Individual Workload Group Growth
What if, on top of your assessed 5% growth, you figured that one or more individual workload
groups would increase as well? Forecast Capacity Planner allows you to change the growth rate
of individual workload groups in order to see the final outcome. To change individual workload
groups from the previous example:
1
Under the Forecast menu, click on Graph Forecast to deselect the option and close the
graph.
2
Double-click on the row that contains the CHICAGO workload. This opens the Edit
Workload dialog box.
3
Click on Growth Rate. This opens the Edit Growth Rate dialog box.
Figure 5.14
a
44
Edit Growth Rate (Individual Workload Group) dialog box
In the first row, change the rate to 5.00.
b
Change the months from 999 to 24.
c
Click OK.
4
Click OK again to exit the Edit Workload dialog box.
5
Under the Forecast menu, open Forecast Options.
....
QUICK TOUR FOR MPE/IX SYSTEMS
Graphing the Model
6
On the Options tab, change the Growth Option to Add.
7
Click OK.
8
Under the Forecast menu, select Graph Forecast to open the graph.
Figure 5.15
Graph showing 5% individual growth for the CHICAGO workload group.
As you can see by comparing this graph to the graph generated in the previous section, the
CHICAGO workload group increases more noticeably. (ORDER ENTRY and JOBS show an
increase only because they are stacked on top of CHICAGO.) At this rate of growth, CPU
utilization will surpass the 85% mark by November of 2000.
On the File menu, click Close. If you want to use this model again, save your sample file at the
prompt.
45
6
QUICK TOUR FOR HP-UX SYSTEMS
Overview
The Quick Tour in this chapter introduces first-time users to the features and functions of Forecast
Capacity Planner. For users upgrading from earlier versions of the software, these tours provide a
quick and easy way to get acquainted with the changes in the current version.
Before beginning the tour, install Forecast Capacity Planner along with the appropriate sample
files on your personal computer.
Running Forecast Capacity Planner
Run Forecast Capacity Planner on your personal computer as described in “Starting Forecast
Capacity Planner” on page 11.
Loading a New Model
Forecast Capacity Planner creates a model of your system based on the data collection (*.col)
files transferred from the host system. (See “HP-UX Host Data” on page 22 for information on
host data collection and data transfer.)
Your software includes a sample collection file (HP9000A1.col) for use with this tour.
To load the collection file:
1
On the File menu, click Load/Validate model. The Open dialog box displays (see Figure
6.1).
2
In the Files of type list, click Collections (*col).
3
Click once on the collection file, HP9000A1.col, to select the file.
47
6
FORECAST CAPACITY PLANNER USER’S GUIDE
Quick Tour for HP-UX Systems
Figure 6.1
4
Open dialog box
Click Open to load the collection file.
Choosing a CPU Equivalent
In some instances, the CPU naming conventions on the host will differ from those on the PC.
When that happens, Forecast will generate the Choose CPU dialog.
Figure 6.2
Choose CPU dialog box
The Choose CPU dialog states which CPU type cannot be found by the Forecast application. To
resolve the issue, select the equivalent CPU name from the pull-down list and click OK.
48
....
QUICK TOUR FOR HP-UX SYSTEMS
Loading a New Model
Validation Messages
As the loading process runs, you will receive a list of warnings and informational messages in the
Validation Messages dialog box (see Figure 6.3). These messages provide information about
workload groups that may violate one or more modeling algorithm assumptions. (See “Validation
Failures” on page 118 for information on modeling algorithm assumptions.)
Figure 6.3
Validation Messages dialog box
Normally, you would investigate the causes of these messages and determine what, if any,
influence they have on your model. It may be necessary to repeat running the data collection
process to collect another sample from the host system. (See “Identifying and Characterizing
Workload Groups” on page 14 for more information on evaluating workload groups.)
For this exercise, assume that the messages do not affect the validity of the model. Click OK to
continue.
Main Program Window
When the loading procedure is complete, the Main Program window displays. This window
contains the unvalidated data loaded from your host system. The model is not validated until it is
saved in the Model (*.mdl) format.
49
6
FORECAST CAPACITY PLANNER USER’S GUIDE
Quick Tour for HP-UX Systems
Figure 6.4
Main Program window
The Main Program window contains the following panes:
•
50
The file manager pane is a representation of the unvalidated model in outline form.
•
To expand or collapse the outline, click the Plus (+) or Minus (-) icons (respectively).
•
To access detailed information, click the individual CPU, Disk, or Workload icons.
•
To edit items within the file manager pane, double-click the associated icon.
•
The global unvalidated centers pane displays the results for each CPU and disk drive in
the model. To view detailed information on a single resources in the model, click on the
associated icon in the file manager pane.
•
The global unvalidated workloads pane displays the results for each workload group
included in the model. To view detailed information on a single workload group in the model,
click on the associated icon in the file manager pane.
....
QUICK TOUR FOR HP-UX SYSTEMS
Reviewing Validation Thresholds
Reviewing Validation Thresholds
Normally, you would review the data in the Main Program window to determine if the model is a
valid representation of the system’s baseline performance. For this exercise, assume that the
model is valid.
Acceptable validation thresholds are listed in Table 6.1.
Table 6.1
Acceptable resource validation thresholds
Resource
Acceptable Validation Threshold
CPU utilization
15 percent
Transaction/hour (throughput)
15 percent
Response time
30 percent
Disk I/O/second
Variances for disk I/O/second and disk
queue length are ignored because most
real-world situations do not account for
issues like database spreading.
Disk queue length
It is common for values to be outside the acceptable range on the first attempt at validating a
model. If your numbers are out of range, review your workload definitions as described in
“Identifying and Characterizing Workload Groups” on page 14.
Validating the Baseline Model
Validate the baseline model you have created:
1
On the Forecast menu, click Validated Model.
2
In the Forecast dialog box, click Yes to begin the validation process. Notice that the name
of the document changes from HP9000A1.col to HP9000A1.mdl.
3
On the File menu, click Save Model.
4
In the Save As dialog box, click Save to save the model in the default location on your
computer.
Graphing the Model
The validated model created in the previous steps provides an accurate snapshot of your host
system. The real power of Forecast Capacity Planner is its ability to predict future performance
based on user-supplied "what-if" scenarios designed to illustrate the forecasting and graphing
capabilities of the software.
51
6
FORECAST CAPACITY PLANNER USER’S GUIDE
Quick Tour for HP-UX Systems
The examples in this section are based on the following assumptions:
•
Standard system performance tuning (defragging and balancing disk drives, repacking the
database, etc.) will not significantly reduce CPU utilization or dramatically improve online
response time, or reduce batch job completion time.
•
Workload definitions on the host system are unchanged.
•
Memory size and the type of disk drives are unchanged.
One CPU with Zero Growth Rate
For this example, graph the model validated in the previous exercises and assume no change in
utilization occurs for 12 months.
To create the graph:
1
On the Forecast menu, click Forecast Options.
Figure 6.5
52
Forecast Options dialog box: Options tab
2
In the Forecast Options dialog box, verify the number in the Periods box is 12.
3
In the Growth Type list box, select Linear.
4
Verify the Period type is Month.
5
In the Workloads list box, verify that only the All Workloads check box is selected.
6
Select the Adjust Results check box.
7
In the Graph Type list box, verify that CPU Util is selected.
8
In the Growth Option list box, click Override.
9
In the CPUs list box, verify that only the S/9000/867 check box is selected (clear all other
check boxes in the CPUs list box).
Graphing the Model
Figure 6.6
Forecast Options dialog box: Options tab with new settings
10
In the Forecast Options dialog box, click the Rates tab (see Figure 6.7).
11
Verify that Tiered Rate and Growth Rate are both set to 0 (zero).
Figure 6.7
....
QUICK TOUR FOR HP-UX SYSTEMS
Forecast Options dialog box: Rates tab
12
Click OK to close the Forecast Options dialog box and save your changes.
13
On the Options menu, ensure that Prompt for titles is not enabled. (See “Prompt for all
disks” on page 100.)
14
On the Forecast menu, click Graph Forecast. The forecast graph displays (see Figure 6.8).
53
6
FORECAST CAPACITY PLANNER USER’S GUIDE
Quick Tour for HP-UX Systems
Figure 6.8
Baseline graph for one CPU with zero growth rate
NOTE If the graph labels are overlapped, adjust the Font and Size
parameters in the Graph Options dialog box from the Options menu
(see “Fonts Options” on page 85 and “Sizes Options” on page 86).
The graph in Figure 6.8 has the parameters listed in the following
two tables:
Table 6.2
Suggested Font parameters
Font Parameter
54
Font
Bold
Header font
Times New Roman
3
Footer font
Times New Roman
3
Legend font
Arial
Label font
Arial
Italic
....
QUICK TOUR FOR HP-UX SYSTEMS
Graphing the Model
Table 6.3
Suggested Size parameters
Size Parameter
Size
Header font size
16
Footer font size
14
Legend font size
10
Label font size
10
The lower line in the graph (HP-UX Threshold) represents the CPU utilization threshold of 85
percent. This is the default threshold limit for the HP-UX and is generally considered the level at
which response time and batch process completion rates become unacceptable. (For information
on changing threshold limits, see “Setting Thresholds” on page 113.)
The upper line in the graph represents overall CPU utilization for all workload groups identified in
the model. The modeled CPU utilization of 87 percent is 2 percent above the threshold limit of 85
percent.
Four CPUs with Zero Growth Rate
For this example, compare the baseline forecast for your original model with three larger CPUs.
To create the graph:
1
On the Forecast menu, click Forecast Options.
2
In the Forecast Options dialog box, select the following CPU check boxes in the CPUs list
box:
3
•
S/9000/867 (CPU selected in original model)
•
S/9000/897
•
S/870S/400
•
S/890/400
Click OK to close the Forecast Options dialog box and update your graph.
55
6
FORECAST CAPACITY PLANNER USER’S GUIDE
Quick Tour for HP-UX Systems
Figure 6.9
Baseline graph for four CPUs with zero growth rate
The second line in the graph (XL Threshold) represents the 85 percent CPU utilization threshold
for HP-UX. The other four lines represent the CPU utilization for each of the four CPUs, based on
the workload groups identified in the original model.
As expected, the larger CPUs show a lower utilization rate for the modeled workload groups. The
S/890/400, for example, can handle the same workload groups with approximately 29 percent
CPU utilization, compared with 87 percent CPU utilization on the S/9000/867.
Four CPUs with Five-percent Growth Rate
Utilization and other system variables change over time. Repeat the forecast with a five-percent
growth rate for all four CPUs.
To create the graph:
56
1
On the Forecast menu, click Forecast Options.
2
In the Forecast Options dialog box, verify the check boxes for the following CPUs are
selected in the CPUs list box:
•
S/9000/867
•
S/9000/897
•
S/870S/400
•
S/890/400
....
QUICK TOUR FOR HP-UX SYSTEMS
Graphing the Model
3
Click the Rates tab in the Forecast Options dialog box.
4
Click in the Growth Rate text box and type 5.
5
Click OK to close the Forecast Options dialog box and update your graph.
Figure 6.10
Baseline graph for four CPUs with five-percent growth rate
This graph represents the modeled utilization rate for the S/9000/867 relative to the rates for the
larger CPUs at a growth rate of five percent over 12 months. Notice that the model does not
simply add five-percent utilization to the rate for each month. The five-percent growth rate is a
factor used to calculate the growth of each of the workload groups, subject to the modeled
capacity of the system.
57
6
FORECAST CAPACITY PLANNER USER’S GUIDE
Quick Tour for HP-UX Systems
Utilization by Workload Group for One CPU
For the last example, graph your original model for the S/9000/867 for each workload group,
assuming a five-percent growth rate.
To create the graph:
1
On the Forecast menu, click Graph Forecast to return to the Main Program window. Note
the percent utilization for each workload group displayed in the global unvalidated
workloads pane (see Figure 6.11).
Figure 6.11
Main Program window: global unvalidated workloads pane
The CPU utilization for each workload group should read:
58
•
MMX:
29.5
•
LPSMID:
4.0
•
POSTING:
3.9
•
DETACH:
3.7
•
ATTACH:
44.5
•
SYSPROCS: 1.3
2
On the Forecast menu, click Forecast Options.
3
In the Forecast Options dialog box, deselect all of the CPUs except the S/9000/867 in the
CPUs list box.
4
In the Workloads list box, deselect the All Workloads check box. Select each of the five
workload groups individually.
Graphing the Model
Figure 6.12
Forecast Options dialog box, Options tab
5
Click OK to close the Forecast Options dialog box and save your changes.
6
On the Forecast menu, click Graph Forecast. The forecast graph displays.
Figure 6.13
....
QUICK TOUR FOR HP-UX SYSTEMS
Graph showing utilization by workload group for one CPU
The utilization growth for each workload group is plotted based on the workload definition given in
the data collection file and the constraints in the original model. As expected, the larger workload
groups, JOBS and ORDER ENTR, contribute the most to the 85-percent system threshold. Some
59
6
FORECAST CAPACITY PLANNER USER’S GUIDE
Quick Tour for HP-UX Systems
workload groups show a decline in CPU utilization. This is due to the fact that the CPU has
reached its maximum load potential. Since these groups are less important and run in a lower
priority status, they will receive less of the CPU resource as the higher priority groups take more.
This type of forecasting can predict the impact of adding workload groups to an existing system. It
is also useful in balancing workload groups across multiple systems.
On the File menu, click Close. Save your sample file if desired.
60
7
FORECAST WINDOW PANES
Main Program Window Panes (Unvalidated)
The Main Program window enables you to review data on the host system for accuracy before
the model is validated. Although the window structure is the same, some of the sub windows in
the Main Program window function differently when viewing an unvalidated model.
Figure 7.1
Main Program window (unvalidated model)
61
7
FORECAST CAPACITY PLANNER USER’S GUIDE
Forecast Window Panes
The Main Program window is divided into three panes:
•
The file manager pane.
•
The global unvalidated centers pane.
•
The global unvalidated workloads pane.
File Manager Pane
The file manager pane contains an outlined view of the model. It provides a quick and easy way
to access and change information about the model.
Figure 7.2
Main Program window: file manager
From the file manager, you can:
62
•
Expand or collapse the outline by clicking the Plus (+) or Minus (-) icons.
•
Change the view in the right-hand side of the Main Program window by clicking the icons in
the file manager pane:
•
Click the Centers icon to change the right part of the window to and expanded view of
the global unvalidated centers pane.
•
Click the Workloads icon to change the right part of the window to and expanded view
of the global unvalidated workloads pane.
....
FORECAST WINDOW PANES
Main Program Window Panes (Unvalidated)
•
Edit the model name by double-clicking the Model icon.
•
Edit the individual resources (CPU or disk drive) or workload groups by double-clicking the
appropriate icon in the file manager pane.
Global Unvalidated Centers Pane
The global unvalidated centers pane in the Main Program window displays the results for each
CPU and disk drive in the model.
Figure 7.3
Main Program window: global unvalidated centers pane
Global results are listed by:
•
Resource Name
•
Resource Type
•
Access Time
•
IO/sec:
•
•
Actual
•
Model
•
Variation between the model and the actual data as a percentage
Average Queue Length:
•
Actual
•
Model
•
Variation between the model and the actual data as a percentage
63
7
FORECAST CAPACITY PLANNER USER’S GUIDE
Forecast Window Panes
Global Unvalidated Workload Pane
The global unvalidated workloads pane displays the results for each CPU and disk drive in the
model.
Global results are listed by:
•
Number
The number of each workload group.
•
Priority
Which queue the workload group is in.
•
Type
Whether the workload group is a JOB or TRANSACTION.
•
Number of users
The number of users who were on the system during the sampling interval.
•
Workload
The name given to the workload groups.
•
Description
If the workload group was given a description beyond a name and definition.
•
•
•
Transactions/Hour:
•
Actual
•
Model
•
Variation between the model and the actual data as a percentage
Response Time:
•
Actual
•
Model
•
Variation between the model and the actual data as a percentage
CPU Utilization:
•
Actual
•
Model
To view detailed information on a single resource in the model, click the associated icon in the file
manager pane.
64
....
FORECAST WINDOW PANES
Main Program Window Panes (Validated)
Main Program Window Panes (Validated)
Once the model is validated, the data fields in the global validated centers pane and the global
validated each workload group pane change to reflect the validated model as shown in Figure
7.4 and Figure 7.5, respectively.
Global Validated Centers Pane
The global validated centers pane displays the modeled data for each CPU and disk drive in the
model.
Figure 7.4
Main Program window (validated model): global centers pane
To view detailed information on a single resource in the model, click on the associated icon in the
file manager pane.
Results are listed by:
•
Resource Name - name of the hardware device as seen by the operating system.
•
Resource Type - identification name of the hardware.
•
Access Time - average access time for all processes.
•
Utilization as a percent of total.
•
Average Queue Length for the validated model.
•
IO/sec for the validated model.
65
7
FORECAST CAPACITY PLANNER USER’S GUIDE
Forecast Window Panes
Global Validated Workload Pane
The global validated workload pane in the Main Program window displays the modeled data
for each workload group included in the model (see Figure 7.5).
Figure 7.5
Main Program window (validated model): global workloads pane
To view detailed information about a particular workload in the model, click the associated icon in
the file manager pane.
Results are listed by (see “Global Unvalidated Workload Pane” on page 64 for descriptions):
66
•
Number
•
Priority
•
Type
•
Number of Users
•
Workload Name
•
Description
•
Transactions/Hour for the validated model.
•
Response Time for the validated model
•
CPU Utilization for the validated model
8
MENUS AND COMMANDS
Overview
Forecast Capacity Planner has a total of seven main menus. (The Edit, Forecast, and Window
menus will not display until a collection or model is loaded.)
Figure 8.1
Forecast Menu Bar (validated model)
The Forecast Capacity Planner menus and their contents change as you proceed through the
loading, validation, and forecast graphing processes, depending on the current open window and
the status of the current model. There are three main windows in the program:
•
Logo screen
•
Main Program window (unvalidated model)
•
Main Program window (validated model)
File Menu and Commands
The File menu (shown in Figure 8.2) lists commands to:
•
Create, load, save, close, and delete models
•
Print and send reports
•
Load and save resources
•
Load, save, and restore a desktop
•
Recall a recently-used file
•
Exit the program
67
8
FORECAST CAPACITY PLANNER USER’S GUIDE
Menus and Commands
Figure 8.2
File menu before and after loading a collection
New Model
The New Model command enables you to create a blank model and enter the data manually
without the use of a data collection file. If you plan to use this option, please contact Lund
Performance Solutions for assistance (see “Lund Performance Solutions Technical Support
Team” on page 4).
To open a new model:
68
1
On the File menu, click New Model.
2
On the File menu, click Save Model As....
3
In the Save As dialog box, click Save to save the model to the default location on your
computer.
....
MENUS AND COMMANDS
File Menu and Commands
NOTE When creating a new model, it is possible to populate the new
model from an existing one. Open an existing model and a new
model, select a workload group from the existing model and drag
the workload group to the Workloads pane of your new model.
Load/Validate Model
The Load/Validate Model command opens an existing model file (*.mdl) or a new collection file
(*.col).
To load and validate a new model:
1
On the File menu, click Load/Validate Model. The Open dialog displays.
Figure 8.3
Open dialog box
2
In the Files of type list, select Collections (*col).
3
Click once on the collection file to select the file.
4
Click Open to load the collection file. If naming conventions between the host system and
the PC differ, the Choose CPU dialog box will appear (see Figure 8.4).
Figure 8.4
Choose CPU dialog box
69
8
FORECAST CAPACITY PLANNER USER’S GUIDE
Menus and Commands
Once you have found and selected the appropriate CPU, click OK. If you can not find your
CPU by name, then you can choose a CPU that closely resembles your CPU based on the
following settings:
5
•
Type: the type of system (i.e. MPE or HP-UX).
•
Adj: relative performance factor. This number is produced by Hewlett-Packard.
•
CM Adj: Compatibility Mode performance factor. Certain CPUs have a more difficult
time running software that is written in CM mode rather than Native mode.
•
CPUs number: how many CPUs are contained within the system.
As the loading process runs, a list of warnings and informational messages appear in the
Validation Messages dialog box.
Figure 8.5
Validation Messages dialog box
Validation messages provide information about workload groups that may violate one or
more modeling algorithm assumptions (see “Queuing Model Algorithm Assumptions” on
page 118).
6
Review the messages presented in the Validation Messages dialog box and decide what, if
any, influence they have on your model. Consider the following examples.
Table 8.1
Example validation messages
Validation Message
Workload NETBASE
contains multiple
process priorities
70
Description
"Multiple process priorities" means that there are
processes defined in the NETBASE workload group with
different queues. Therefore, the NETBASE workload
group may not be homogeneous. (See “Identifying and
Characterizing Workload Groups” on page 14 for
information on homogeneous workload groups.) In these
cases, the program assumes the highest priority for all
processes.
....
MENUS AND COMMANDS
File Menu and Commands
Validation Message
Workload LA contains
both jobs and sessions
Description
The workload group LA contains both jobs (batch
processes) and sessions (interactive processes). Batch
and interactive processes use system resources
differently. (See “Identifying and Characterizing
Workload Groups” on page 14 for information on mixing
batch and interactive processes in single workload
groups.)
In both examples, it may or may not be necessary to redefine the workload groups and
repeat the collection and reduction processes on the host system. For instance, if the
workload group NETBASE accounts for only a small percentage of total CPU utilization on
the host system, the effect on the model and your forecast may be negligible.
7
You can print the contents of the Validation Messages box for reference. (See “Print Notes”
on page 74.)
8
Once you are satisfied that the messages in the Validation Messages dialog box will not
affect the model, click OK to close the box and complete the loading process.
Save Model
The Save Model... command saves the active document to the current name and directory. If you
want to change the name or directory before saving the model, choose the Save Model As...
command instead.
To save a validated model: On the File menu, click Save Model....
Save Model As...
The Save Model As... command enables you to save and name a validated model using a
standard Windows Save As dialog box. (Refer to your Windows documentation for instructions.)
To save an active document without changing the name or directory, choose the Save Model
command instead.
Close
Use the Close command to close all active windows in the document and return to the Logo
screen. When you close an unnamed document, the Save As dialog box will display so you can
name and save the document.
71
FORECAST CAPACITY PLANNER USER’S GUIDE
Menus and Commands
8
Delete
The Delete menu item has four submenu commands that enable you to delete the forecast model
or specific components of the model:
•
Model
•
Collection
•
Desktop
•
Resources
Delete Model
The Delete Model command enables you to delete a model.
1
On the File menu, click Delete.
2
From the Delete submenu, click Model.
3
In the Delete model file dialog box, select the model file (*.mdl) to delete.
Figure 8.6
4
Delete model file dialog box
Click Delete to delete the file, or click Cancel to abort the deletion process.
Delete Collection
The Delete Collection command enables you to delete a collection file.
72
1
On the File menu, click Delete.
2
From the Delete submenu, click Collection.
....
MENUS AND COMMANDS
File Menu and Commands
3
In the Delete collection file dialog box, select the collection file (*.col) to delete.
4
Click Delete to delete the file, or click Cancel to abort the deletion process.
Delete Desktop
The Delete Desktop command enables you to delete a desktop file.
1
On the File menu, click Delete.
2
From the Delete submenu, click Desktop.
3
In the Delete desktop file dialog box, select the desktop file (*.dsk) to delete.
4
Click Delete to delete the file, or click Cancel to abort the deletion process.
Delete Resources
The Delete Resources command enables you to delete a resource file.
1
On the File menu, click Delete.
2
From the Delete submenu, click Resources.
3
In the Delete resource file dialog box, select the resource file (*.dat) to delete.
4
Click Delete to delete the file, or click Cancel to abort the deletion process.
Print Setup...
The Print Setup... command opens the Print dialog box.
1
On the File menu, click Print Setup....
2
Select the pages to print, the number of copies, the destination printer, and other standard
Windows print options.
3
Click OK.
73
FORECAST CAPACITY PLANNER USER’S GUIDE
Menus and Commands
8
Print Preview
The Print Preview command opens the report document for the active model in the Print
Preview window as it will appear when printed. Use the Print Preview toolbar to view pages in
the document, zoom in or out, and begin the printing process.
1
2
On the File menu, click Print Preview....
•
Use the Zoom In button to examine the page in closer detail, then click the Zoom Out
button to view the entire page.
•
Use the Next Page and Previous Page buttons to view multiple pages, one page at a
time.
•
Use the Two Page button to view two consecutive pages, side by side.
When you finish previewing the chart(s), either click Close to return to the program window,
or choose the Print... command button to send the chart(s) to the printer.
Print
The Print command, with the exception of the Print Resources submenu command, is not
available in the Logo screen or the Main Program window of an unvalidated model.
The Print command has four submenu commands that enable you to print a forecast model,
graph, validation notes, the current screen, or resources associated with the current model.
Print Model
The Print Model command sends the forecast report for the active model to your default printer.
Print Graph
The Print Graph command creates a graph for the active model and sends it to your default
printer.
Print Notes
The Print Notes command sends the validation notes for the active model to your default printer.
Print Screen
The Print Screen command sends a graphic representation of the current screen to your default
printer.
74
....
MENUS AND COMMANDS
File Menu and Commands
Print Resources
The Print Resources command sends the complete listing of all the available CPUs and disks
listed in Forecast to your default printer. This listing also includes the CPU adjustment factor for
HP-UX systems, the Native Mode and Compatibility Mode factors for MPE, and the Access Time
for each disk. This command is available from the Logo screen and the Main Program window of
an unvalidated model.
Send...
The Send command enables you to send the active model as an e-mail attachment file using the
Microsoft Exchange Setup Wizard. (Please refer to your Windows documentation for information.)
Load Resources
The Load Resources command loads a new resource file.
1
On the File menu, click Load Resources.
2
In the Load Resources From dialog box, select the resource file (*.dat) to load.
3
Click OK.
Save Resources
The Save Resources command saves the currently-loaded resource file using the same file
name and directory location. To change the file name or directory location, choose the Save
Resources As... command.
Save Resources As
The Save Resources As... command enables you to save the currently-loaded resource file with
a different file name or directory location using the Save Resources As dialog box.
Load Desktop
A desktop is the current state of the Forecast Capacity Planner display area, which includes the
size and position of the Main Program window, saved to disk as a desktop file (*.dsk).
The Load Desktop command loads a previously-saved desktop file (*.dsk).
1
On the File menu, click Load Desktop.
2
In the Open dialog box, select the desktop file to open.
3
Click Open to load the file or Cancel to abort the process.
75
8
FORECAST CAPACITY PLANNER USER’S GUIDE
Menus and Commands
Save Desktop
At any time during the validating and forecasting processes, you can save and rename the current
desktop to preserve any changes to the model. This can be useful if you plan to generate
multiple-performance projections from your baseline model.
The Save Desktop command saves all of your current settings, links to currently-opened files,
and window layout options, as a named file using the Save As dialog box.
Restore Layout
The Restore Layout command restores all settings from a previously-saved desktop, without
opened files or layout options.
1
On the File menu, click Restore Layout.
2
From the Open dialog box, select the desktop file (*.dsk) to restore.
3
Click Open to restore the file or click Cancel to abort the process.
Recently Used Files
The File menu contains a list of the four most-recently-used Forecast Capacity Planner files. On
the File menu, click the file name to open the file.
Exit
The Exit command ends the current session of Forecast Capacity Planner. If the current model is
not saved, the Save As dialog box displays so you can name and save the document.
Edit Menu and Commands
The Edit menu commands (Figure 8.7) are described in the following sections.
Figure 8.7
76
Edit menu
....
MENUS AND COMMANDS
Edit Menu and Commands
Undo
The Undo command cancels the last operation executed in the program. It is only available in the
Main Program window of a validated model.
Redo
The Redo command restores the last operation cancelled by the Undo command. This command
is only available in the Main Program window of a validated model.
Cut
The Cut command removes selected text or data from the document and places it in temporary
memory so that the cut portion of the document can be inserted (pasted) elsewhere. This
command is only available in the Main Program window of a validated model.
Copy
The Copy command duplicates selected text or data from a document and places it in temporary
memory so that the copied portion of the document can be inserted (pasted) elsewhere (either in
the same document or in another document). This command is only available in the Main
Program window of a validated model.
Paste
The Paste command inserts selected text or data that has been cut or copied from one document
into a different location in the same document or a different document. This command is only
available in the Main Program window of a validated model.
Edit
The Edit command opens the Edit dialog box associated with the selected item:
•
workload group (see “Editing a Workload Group” on page 122)
•
disk drive (see “Editing a Disk Drive” on page 126)
•
CPU (see “Editing a CPU” on page 126)
77
8
FORECAST CAPACITY PLANNER USER’S GUIDE
Menus and Commands
Add
The Add command adds a new disk drive or workload group to the end of the disk drive or
workload group list that contains the selected item. CPUs cannot be added.
•
workload group (see “Adding a Workload Group” on page 125)
•
disk drive (see “Adding a Disk Drive” on page 127)
The Add command is only available in the Main Program window of a validated model.
Insert
The Insert command inserts a new disk drive or workload group following the selected like item
on the screen. CPUs cannot be added.
•
workload group (see “Inserting a Workload Group” on page 125)
•
disk drive (see “Inserting a Disk Drive” on page 127)
This command is only available in the Main Program window of a validated model.
Delete
The Delete command eliminates the selected text or data from a document permanently. This
command is only available in the Main Program window of a validated model.
Options Menu and Commands
The Options menu commands (Figure 8.8) are described in the following sections.
Figure 8.8
78
Options menu
....
MENUS AND COMMANDS
Options Menu and Commands
Report Fonts
The Report Fonts command opens a standard Windows Font dialog box (Figure 8.9). The
options selected in the Font dialog box affect the fonts in all reports and possibly the first graph
display. (See also, “Fonts Options” on page 85.)
Figure 8.9
Font dialog box
79
FORECAST CAPACITY PLANNER USER’S GUIDE
Menus and Commands
8
View Options
The View Options command opens the View Options dialog box, which contains two tabs:
General and View Background.
General View Options
To set general view options:
1
On the Options menu, click View Options. The View Options dialog box will display
(Figure 8.10).
Figure 8.10
80
View Options dialog box: General tab
2
From the list box in the General tab, select the component of the model to which the option
will apply.
3
From the General tab in the View Options dialog box, enter or select new options as
described in Table 8.2.
....
MENUS AND COMMANDS
Options Menu and Commands
Table 8.2
General View options
Option
Label text color
Data text color
Instructions
1
•
Select Automatic to apply the default color.
•
Select a pre-defined color swatch.
•
Select More Colors... and define your own
custom color from the Color dialog box.
2
Click OK to apply the color.
1
From the Data text color drop-down list box, select a
color to apply to the model component:
2
3
From the Label text color drop-down list box, select
a color to apply to the model component:
•
Select Automatic to apply the default color.
•
Select a pre-defined color swatch.
•
Select More Colors... and define your own
custom color from the Color dialog box.
Click OK to apply the color.
Toolbar Tile tips
Click to deselect/select the Toolbar Tile tips check box to
disable/enable the tips associated with Toolbars.
Tile tips
Click to deselect/select the Tile tips check box to
disable/enable tips associated with Forecast Capacity
Planner tools.
Enable Sound Tooltips
Click to deselect/select the Enable Sound Tooltips check
box to disable/enable a sound wave file (*.wav) to alert
you to tool tips. Click the Change button to locate your
favorite sound wave.
Click OK to apply the change(s) and return to the Main Program window, or click the View
Background tab to change the background color.
81
FORECAST CAPACITY PLANNER USER’S GUIDE
Menus and Commands
8
View Background Options
To set general view options:
1
On the Options menu, click View Options.
2
In the View Options dialog box, click the View Background tab (Figure 8.11).
Figure 8.11
View Options dialog box: View Background tab
3
From the list box in the View Background tab, select the item to which the background will
apply.
4
Click the Change button. Browse to select a background file (*.bmp) from another file
location. (There are no preconfigured files.)
5
Click Apply. Repeat Steps 3 and 4 as needed to apply backgrounds to other items.
6
Click OK to return to the Main Program window.
To remove a custom background, click the Delete button instead of the Apply button in Step 5.
Report Options
Report Options are described in detail in “Setting Report Options” on page 135.
82
....
MENUS AND COMMANDS
Options Menu and Commands
Graph Options
The Graph Options command opens the Graph Options dialog box, which contains:
•
General tab (see “General Graph Options” on page 84)
•
Fonts tab (see “Fonts Options” on page 85)
•
Sizes tab (see “Sizes Options” on page 86)
•
Borders tab (see “Borders Options” on page 87)
•
Aspects tab (see “Aspect Options” on page 88)
•
Colors tab (see “Colors Options” on page 90)
•
Chart Colors tab (see “Chart Colors Options” on page 91)
•
Point Patterns tab (see “Point Patterns Options” on page 92)
•
Fill Patterns tab (see “Fill Patterns Options” on page 93)
The graph options affect the appearance of all forecast graphs. The graph options are saved in
memory.
Forecast Graph Components
Figure 8.12 identifies some of the key components of a forecast graph that may be modified.
Figure 8.12
Forecast graph components
83
FORECAST CAPACITY PLANNER USER’S GUIDE
Menus and Commands
8
General Graph Options
The General graph options affect the size of the graph lines and data points.
To modify the General graph options:
1
On the Options menu, click Graph Options.
2
In the Graph Options dialog box, click the General tab (Figure 8.13).
Figure 8.13
Graph Options dialog box: General tab
3
In the General tab, enter or select new options as described in Table 8.3.
4
Click OK to apply the change(s) and return to the Main Program window, or click another
tab within the Graph Options dialog box.
Table 8.3
General Graph options
Option
84
Instructions
First line thickness
Assign a line thickness size (an integer from 1 to 20) to
the first line in a graph.
Thickness increasing
step
Assign a line thickness increment (an integer from 1 to
20) to be added to each consecutive line in a graph.
Enter 0 (zero) to maintain the first line thicknesses for all
lines.
....
MENUS AND COMMANDS
Options Menu and Commands
Option
Instructions
First point size
Assign a point size (an integer from 1 to 20) to the first
data line in a graph.
Point size increasing
step
Assign a point size increment (an integer from 1 to 20) to
be added to the data points of each consecutive line in a
graph. Enter 0 (zero) to maintain the first point size for
all lines.
Black and White
(monochrome)
Select this check box to display all graphs in black and
white (gray scale). This is useful when printing to a
monochrome printer.
Fonts Options
The Fonts options affect the font and font style of the graph header, footer, legend, and labels. To
modify the Fonts options:
1
On the Options menu, click Graph Options.
2
In the Graph Options dialog box, click the Font tab (Figure 8.14).
Figure 8.14
Graph Options dialog box: Fonts tab
3
In the Fonts tab, enter or select new options as described in Table 8.4.
4
Click OK to apply the change(s) and return to the Main Program window, or click another
tab within the Graph Options dialog box.
85
FORECAST CAPACITY PLANNER USER’S GUIDE
Menus and Commands
8
Table 8.4
Fonts options
Option
Instructions
Header font
Select the font type and/or style (bold and/or italic) for
the graph header.
Footer font
Select the font type and/or style (bold and/or italic for the
graph footer.
Legend font
Select the font type and/or style (bold and/or italic for the
graph legend.
Label font
Select the font type and/or style (bold and/or italic for the
graph labels.
Sizes Options
The Sizes options affect the font size of the graph header, footer, legend, and labels. To modify
the font Sizes options:
1
On the Options menu, click Graph Options.
2
In the Graph Options dialog box, click the Sizes tab (Figure 8.15).
Figure 8.15
86
Graph Options dialog box: Sizes tab
3
In the Sizes tab, enter or select new options as described in Table 8.5.
4
Click OK to apply the change(s) and return to the Main Program window, or click another
tab within the Graph Options dialog box.
....
MENUS AND COMMANDS
Options Menu and Commands
Table 8.5
Sizes options
Option
Instructions
Header font size
Enter or select a font point size for the graph header.
Footer font size
Enter or select a font point size for the graph footer.
Legend font size
Enter or select a font point size for the graph legend.
Label font size
Enter or select a font point size for the graph labels.
Borders Options
The Borders options affect the style and width of the borders surrounding the graph header,
footer, legend, and chart. To modify the Borders options:
1
On the Options menu, click Graph Options.
2
In the Graph Options dialog box, click the Borders tab (Figure 8.16).
Figure 8.16
Graph Options dialog box: Borders tab
3
In the Borders tab, enter or select new options as described in Table 8.6.
4
Click OK to apply the change(s) and return to the Main Program window, or click another
tab within the Graph Options dialog box.
87
FORECAST CAPACITY PLANNER USER’S GUIDE
Menus and Commands
8
Table 8.6
Borders options
Option
Border
Instructions
Select a border type and width (1-99 points) to apply to
the each border.
Chart Border
Header Border
Footer Border
Legend Border
•
No Border
•
3-D In Border
•
3-D Out Border.
•
Plain Border
•
Etched In Border
•
Etched Out Border
•
Frame In Border
•
Frame Out Border
•
Bevel Border
Aspect Options
The Aspect options affect the type and characteristics of the chart. To modify the Aspect
options:
1
On the Options menu, click Graph Options.
2
In the Graph Options dialog box, click the Aspect tab (Figure 8.17).
Figure 8.17
3
88
Graph Options dialog box: Aspect tab
In the Aspect tab, enter or select new options as described in Table 8.7.
....
MENUS AND COMMANDS
Options Menu and Commands
4
Click OK to apply the change(s) and return to the Main Program window, or click another
tab within the Graph Options dialog box.
Table 8.7
Aspect options
Option
Instructions
Graph Type
Select a graph type: line, bar, pie, stacked bar, or area.
Graph Depth
Assign a graph depth value (0-100 points). This adjusts
the depth of the space surrounding the graph within the
window.
Graph Inclination
Assign a graph inclination (0-100 points). This adjusts
the three-dimensional view of a bar or stacked bar graph.
Graph Rotation
Assign a graph rotation (1-360 degrees). This adjusts
the three-dimensional view of a bar or stacked bar graph.
Horizontal Grid Lines
Click to select/deselect this check box to show/hide
horizontal grid lines.
Vertical Grid Lines
Click to select/deselect this check box to show/hide
vertical grid lines.
89
FORECAST CAPACITY PLANNER USER’S GUIDE
Menus and Commands
8
Colors Options
The Colors options affect the background and foreground colors of the chart. To modify the
Colors options:
1
On the Options menu, click Graph Options.
2
In the Graph Options dialog box, click the Colors tab (Figure 8.18).
Figure 8.18
90
Graph Options dialog box: Colors tab
3
In the Colors tab, double-click a Background or Foreground Color item. The Color dialog
box will display.
4
Select a new color or create a custom color and click OK to close the Color dialog box. Click
Apply.
5
Repeat Steps 3 and 4 as needed to modify additional colors.
6
Click OK to apply the change(s) and return to the Main Program window, or click another
tab within the Graph Options dialog box.
....
MENUS AND COMMANDS
Options Menu and Commands
Chart Colors Options
The Chart Colors options affect the color assigned to each data line or data point in a chart. To
modify the Chart Colors options:
1
On the Options menu, click Graph Options.
2
In the Graph Options dialog box, click the Chart Colors tab (Figure 8.19).
Figure 8.19
Graph Options dialog box: Chart Colors tab
3
In the Chart Colors tab, enter or select new options as described in Table 8.8.
4
Click OK to apply the change(s) and return to the Main Program window, or click another
tab within the Graph Options dialog box.
Table 8.8
Chart Colors options
Option
Instructions
Number of line colors
used
Enter the number of sequential line colors to apply to
data lines.
Number of point colors
used
Enter the number of sequential line colors to apply to
data points.
Line colors
Scroll to view the sequence of line colors.
Point colors
Scroll to view the sequence of data point colors.
91
FORECAST CAPACITY PLANNER USER’S GUIDE
Menus and Commands
8
Point Patterns Options
The Point Patterns options affect the identifying character assigned to each data point within a
chart. To modify the Point Patterns options:
1
On the Options menu, click Graph Options.
2
In the Graph Options dialog box, click the Point Patterns tab (Figure 8.20).
Figure 8.20
3
4
92
Graph Options dialog box: Point Patterns tab
•
The Available list box contains a sequential list of data point patterns that will be
applied to the data items within a graph.
•
The Disabled list box contains a list of data point patterns that have been disabled.
In the Point Patterns tab, exchange or transfer items between the Available and Disabled
list boxes:
a
To exchange an item in the Available list with an item in the Disabled list, select both
items, then click the >> << button.
b
To move an item from the Available list to the Disabled list (or vice versa), select the
item, then click the >> (or <<) button.
Click OK to apply the change(s) and return to the Main Program window, or click another
tab within the Graph Options dialog box.
....
MENUS AND COMMANDS
Options Menu and Commands
Fill Patterns Options
The Fill Patterns options affect the identifying pattern assigned to each data line within a black
and white chart, (The Black and White check box in the General graph options tab (see
“General Graph Options” on page 84) must be selected to enable fill patterns.) To modify the Fill
Patterns options:
1
On the Options menu, click Graph Options.
2
In the Graph Options dialog box, click the Fill Patterns tab (Figure 8.21).
Figure 8.21
3
4
Graph Options dialog box: Fill Patterns tab
•
The Available list box contains a sequential list of fill patterns that will be applied to the
data items within a black and white graph.
•
The Disabled list box contains a list of fill patterns that have been disabled.
In the Point Patterns tab, exchange or transfer items between the Available and Disabled
list boxes.
a
To exchange an item in the Available list with an item in the Disabled list, select both
items, then click the >> << button.
b
To move an item from the Available list to the Disabled list (or vice versa), select the
item, then click the >> (or <<) button.
Click OK to apply the change(s) and return to the Main Program window, or click another
tab within the Graph Options dialog box.
93
FORECAST CAPACITY PLANNER USER’S GUIDE
Menus and Commands
8
Resources
CPUs Options
From the CPUs tab in the Resources dialog box, you can:
•
Add a new CPU to the model resources. This concatenates the new resource to the end of
the list.
•
Insert a new CPU to the model resources. This inserts a new resource above the existing,
selected resource.
•
Edit an existing CPU resource.
•
Delete an existing CPU resource.
•
Undo or Redo the most recent change to the CPU resources (prior to closing the dialog
box.)
Add a CPU
To add a CPU to the existing resources:
1
On the Options menu, click Resources.
2
In the CPUs tab, select a CPU to edit from the list box (only one CPU may be selected at a
time). Notice the statistics for that particular CPU is displayed in the lower portion of the
CPUs tab (Figure 8.22).
Figure 8.22
94
Resources dialog box: CPUs tab
....
MENUS AND COMMANDS
Options Menu and Commands
3
Click Add.
4
From the CPU dialog box (Figure 8.23), enter the following information about the CPU:
•
CPU title
•
CPU type (MPE/iX or MPE/V)
•
Number of processors (for example, 1, 2, or 4)
•
Resources adjustment factor
•
Resource compatibility mode adjustment factor (MPE only)
Figure 8.23
5
CPU dialog box
Click Apply and continue to modify the resources, or click OK to save the change(s) and
return to the Main Program menu.
Insert a CPU
To insert a CPU in the list of CPU resources:
1
In the CPUs tab, select the CPU to edit from the list box (only one CPU may be selected at
one time).
2
Click Insert.
3
From the CPU dialog box, enter the following information about the CPU:
4
•
CPU title
•
CPU type (MPE/iX or MPE/V)
•
Number of processors (for example, 1, 2, or 4)
•
Resources adjustment factor
•
Resource compatibility mode adjustment factor (MPE only)
Click Apply and continue to modify the resources, or click OK to save the change(s) and
return to the Main Program menu.
95
FORECAST CAPACITY PLANNER USER’S GUIDE
Menus and Commands
8
Edit a CPU
To edit an existing CPU resource:
1
In the CPUs tab, select the CPU to edit from the list box (only one CPU may be selected at
one time).
2
Click Edit.
3
From the CPU dialog box, enter modify any of the following statistics:
4
•
CPU title
•
CPU type (MPE/iX or MPE/V)
•
Number of processors (for example, 1, 2, or 4)
•
Resources adjustment factor
•
Resource compatibility mode adjustment factor (MPE only)
Click Apply and continue to modify the resources, or click OK to save the change(s) and
return to the Main Program menu.
Delete a CPU
To delete a CPU from the list of CPU resources:
1
In the CPUs tab, select the CPU to edit from the list box (only one CPU may be selected at
one time).
2
Click Delete.
3
Click Yes to save the change(s) and return to the Main Program menu, or click No to cancel
the command.
Disks Options
From the Disks tab in the Resources dialog box, you can:
96
•
Add a new disk drive to the model resources.
•
Insert a new disk drive to the model resources.
•
Edit an existing disk drive resource.
•
Delete an existing disk drive resource.
•
Undo or Redo the most recent change to the disk drive resources (prior to closing the dialog
box).
....
MENUS AND COMMANDS
Options Menu and Commands
Add a Disk
To add a disk drive to the existing resources:
1
On the Options menu, click Resources.
2
In the Disks tab, select the disk drive to edit from the list box (only one disk drive may be
selected at one time). Notice that the statistics for that particular disk drive is displayed in the
lower portion of the Disks tab.
Figure 8.24
Resources dialog box: Disks tab
3
Click Add.
4
From the Disk dialog box (Figure 8.25), enter the following information about the disk drive:
•
Disk drive title
•
Disk drive response time
Figure 8.25
5
Disk dialog box
Click Apply and continue to modify the resources, or click OK to save the change(s) and
return to the Main Program menu.
97
8
FORECAST CAPACITY PLANNER USER’S GUIDE
Menus and Commands
Insert a Disk
To insert a disk drive in the list of disk resources:
1
In the Disks tab, select the disk drive to edit from the list box (only one disk drive may be
selected at one time).
2
Click Insert.
3
From the Disk dialog box, enter the following information about the disk drive:
4
•
Disk drive title
•
Disk drive response time
Click Apply and continue to modify the resources, or click OK to save the change(s) and
return to the Main Program menu.
Edit a Disk
To edit an existing disk drive resource:
1
In the Disks tab, select the disk drive to edit from the list box (only one disk drive may be
selected at one time).
2
Click Edit.
3
From the Disk dialog box, enter modify any of the following statistics:
4
•
Disk drive title
•
Disk drive response time
Click Apply and continue to modify the resources, or click OK to save the change(s) and
return to the Main Program menu.
Delete a Disk
To delete a disk drive from the list of disk drive resources:
98
1
In the Disks tab, select the disk drive to edit from the list box (only one disk drive may be
selected at one time).
2
Click Delete.
3
Click Yes to save the change(s) and return to the Main Program menu, or click No to cancel
the command.
....
MENUS AND COMMANDS
Options Menu and Commands
Download Options
From the Download tab in the Resources dialog box, you can download a current
Resources.dat file into your Forecast Capacity Planner program files. This file is updated
periodically by Lund Performance Solutions.
To download a current Resources.dat file:
1
On the Options menu, click Resources, then click the Download tab.
Figure 8.26
Resources dialog box: Download options
2
In the Download tab, enter the following information or accept the default as described in
Table 8.9.
3
Click Apply and continue to modify the resources, or click OK to save the change(s) and
return to the Main Program menu.
Table 8.9
Resources.dat file download options
Option
Default
Instructions
Change download
page address
www.lund.com/
Resources.dat
Enter the address of the appropriate FTP
download page. If you do not have this
address, please contact Lund Performance
Solutions tech support for assistance.
Click here if you
want to go to the
download page
N/A
Click this button to load the default
Browser and go to the download page.
Change direct
download address
www.lund.com/
Resources.dat
Enter the address of your download site.
99
8
FORECAST CAPACITY PLANNER USER’S GUIDE
Menus and Commands
Option
Default
Instructions
Press the button if
you want to
download the
resources directly.
N/A
Click this button to automatically download
the Resources.dat file to the default
Forecast Capacity Planner program files
location.
Use Proxy
disabled
Select this check box to download using a
proxy server.
Proxy server
N/A
Enter the proxy server address.
Port number
5060
Enter the proxy port number.
Thresholds
Forecast and validation thresholds are explained in “Thresholds” on page 100.
Prompt for all disks
The Prompt for all disks command sets the program to prompt the user for every disk
encountered during the loading process that does not match a disk type in the resource file.
To enable this prompt, click Prompt for all disks on the Options menu.
To disable this prompt, click to deselect Prompt for all disks on the Options menu.
Prompt for titles
The Prompt for titles command sets the program to prompt the user for graph titles (headers
and footers) when a new graph is created.
To enable this prompt, click Prompt for titles on the Options menu.
To disable this prompt, click to deselect Prompt for titles on the Options menu.
Change titles
The Change titles command allows you to change the graph titles (headers and footers) when
the Prompt for titles command is enabled.
100
....
MENUS AND COMMANDS
Forecast Menu and Commands
Forecast Menu and Commands
Use the Forecast menu in the Main Program window to access most of the forecasting and
graphing options for unvalidated and validated models in Forecast Capacity Planner. The
Forecast menu is not available from the Logo screen.
Figure 8.27
Forecast menu
Forecast Options
The Forecast Options command opens the Forecast Options dialog box, which contains two
tabs: Options and Rates. For information about the options available in these tabs, see “Setting
Forecast Options” on page 130.
Graph Forecast
The Graph Forecast command creates a forecast graph from your model and opens the graph
window.
Generating a Forecast Graph
To generate a forecast graph:
1
Ensure the Main Program window contains the data for a validated model.
2
On the Forecast menu, click Graph Forecast. A forecast graph will display in the Main
Program window.
Closing a Forecast Graph
To close the currently-open forecast graph and return to the data for the model, click Graph
Forecast from the Forecast menu.
101
8
FORECAST CAPACITY PLANNER USER’S GUIDE
Menus and Commands
Age Model
The Age Model command opens the Age Model dialog box.
The aging function of Forecast Capacity Planner offers a quick and easy way to generate
forecasting information about your model. The aging function enables you to fast forward to a
future date and view the effects of workload group growth rates on the model. The aged model is
based on the growth rates assigned to your workload groups in the validated model. (See “Editing
a Workload Group” on page 122 for more information about changing workload group growth
rates.)
To age the model:
1
On the Forecast menu, click Age Model.
2
In the Age Model dialog box (Figure 8.28), enter the number of months to age the model.
Figure 8.28
3
Age Model dialog box
Click OK to apply the change.
To return to a non-aged model (the original model), click Undo from the Edit menu. This can be
done even if you saved the aged model.
102
....
MENUS AND COMMANDS
Forecast Menu and Commands
Change Name
The Change Name command opens the Model Name dialog box.
To change the Model name:
1
On the Forecast menu, click Change Name.
2
In the Model name dialog box (Figure 8.29), enter the desired model name.
Figure 8.29
3
Model name dialog box
Click OK to save the change.
Copy to Clipboard
The Copy to Clipboard command copies the current model or selected item to the Clipboard.
Graph to Clipboard
The Graph to Clipboard command creates a forecast graph and copies it to the Clipboard.
To copy the current forecast graph to the Clipboard:
1
On the Forecast menu, click Graph to Clipboard.
2
In the Copy Graph to Clipboard As dialog box (Figure 8.30), select the file format in which
to save the graph:
•
Bitmap. Enter the width and height of the bitmap image (pixels) in the Width and
Height fields, or accept the default dimensions.
•
Windows Metafile.
•
Enhanced Metafile.
103
8
FORECAST CAPACITY PLANNER USER’S GUIDE
Menus and Commands
Figure 8.30
3
Copy Graph to Clipboard As dialog box
Click OK to copy the graph to the Clipboard.
Export Forecast
The Export Forecast command exports a forecast graph as a separate file.
To export the current forecast graph:
1
On the Forecast menu, click Export Forecast.
2
In the Save As dialog box:
3
a
Name the file.
b
Select the file type.
c
Select the directory location.
Click OK to save the file.
Validated Model
The Validated Model command validates the current unvalidated model. A check mark next to
the command in the Forecast menu indicates that the model is validated.
104
....
MENUS AND COMMANDS
View Menu and Commands
View Menu and Commands
Use the View menu in the Main Program window (Figure 8.31) to enable and disable the toolbar,
format bar, and status bars.
Figure 8.31
View menu
Toolbar
The Forecast toolbar (Figure 8.32) displays a set of buttons used to carry out common menu
commands. Toolbar buttons can change, depending on which window or view is currently
selected. The toolbar can be moved or docked at any edge of the Main Program window.
Figure 8.32
Toolbar
To hide the toolbar, deselect the Toolbar option from the View menu. The absence of the check
mark next to the menu item indicates the option is disabled.
To move the toolbar to another location within the program window, click the frame surrounding
the toolbar, then drag and drop it to a new location within the Main Program window.
Floating Toolbar Window
When the toolbar is placed near the center of the Main Program window, it becomes a floating
Toolbar window (Figure 8.33). A floating Toolbar window has a title bar and can be resized and
repositioned anywhere in the Main Program window.
Figure 8.33
Toolbar window
To return the toolbar to its original size and location, double-click the Toolbar window.
To close the Toolbar window, click the Close button in the upper-right corner of the window.
105
8
FORECAST CAPACITY PLANNER USER’S GUIDE
Menus and Commands
Format Bar
The format bar (Figure 8.34) displays a set of buttons used to carry out formatting commands.
Format bar buttons can change, depending on which window or view is currently selected.
Available formatting options, from left to right, are:
•
Font Type
•
Font Size
•
Bold
•
Italic
•
Underline
•
Font Color
•
Justified left
•
Centered
•
Justified right
•
Insert bullet
Figure 8.34
Format Bar
To hide the format bar, deselect the Formatbar option from the View menu. The absence of the
check mark next to the Formatbar menu item indicates the option is disabled.
To move the format bar to another location within the Main Program window, click the frame
surrounding the format bar, then drag and drop it to a new location within the program window.
Floating Format Bar Window
When the format bar is placed near the center of the Main Program window, it becomes a floating
Format Bar window. A floating Format Bar window has a title bar and can be resized and
repositioned anywhere in the Main Program window.
To return the format bar to its original size and location, double-click the Format Bar window.
To close the Format Bar window, click the Close button in the upper-right corner of the window.
106
....
MENUS AND COMMANDS
Window Menu and Commands
Main Status Bar
The Main Status Bar command switches the main status bar on or off. A check mark next to the
command indicates the main status bar is displayed in the Main Program window.
Figure 8.35
Main Status Bar
Child Status Bar
The Child Status Bar command switches the child status bar on or off. A check mark next to the
command indicates that the child status bar is displayed in the Main Program window.
Figure 8.36
Child Status Bar
Window Menu and Commands
The Window menu options are standard Windows-based options that improve the viewing
arrangement of multiple charts. These arrangements can be saved as default settings in a
desktop file. The Window menu (Figure 8.37) is not available from the Logo screen.
Figure 8.37
Window menu
Cascade
The Cascade command arranges the open windows in an overlapping fashion from the upper left
to the lower right of the screen. Windows are arranged in chronological order with the most
recently accessed window in the top position in the lower-left portion of the screen.
Tile Horizontally
The Tile Horizontally command arranges all open windows horizontally in “tiles” of proportionate
size, using the full extent of the screen.
107
FORECAST CAPACITY PLANNER USER’S GUIDE
Menus and Commands
8
Tile Vertically
The Tile Vertical option will arrange all open windows vertically in “tiles” of proportionate size,
using the full extent of the screen.
Next Pane
The Next Pane command sets the focus to the next window pane.
Previous Pane
The Previous Pane command sets the focus to the previous window pane.
Arrange Icons
The Arrange Icons command restores the icons (minimized windows) to their default
(chronological) order (left to right) across the bottom of the Main Program window.
Current Window
The Window menu contains a list of all open windows in the current session. Click on a window
name to switch to that window.
Help Menu and Commands
The Help menu (Figure 8.38) contains commands to display the Tip of the Day, load the online
Help system, and view information about the Forecast Capacity Planner application.
Figure 8.38
108
Help menu
....
MENUS AND COMMANDS
Help Menu and Commands
Tip of the Day...
The Tip of the Day command opens the Tip of the Day dialog box (Figure 8.39).
Figure 8.39
Tip of the Day dialog box
To set the program to automatically display the Tip of the Day, click the Show tips on startup
check box. To disable this option, click to deselect the check box.
To view each of the Tips, click the Next tip button.
To close the Tip of the Day dialog box, click OK.
109
8
FORECAST CAPACITY PLANNER USER’S GUIDE
Menus and Commands
Help Topics
The Forecast Help system is a quick-reference of helpful topics. These topics are indexed and
can be recalled by performing a keyword search. To access the indexed Help system, click Help
Topics in the Help menu.
Context-sensitive Help
To get context-sensitive Help on a specific dialog box, click the Help button in the dialog box. Help
about the dialog box will display in a separate window.
To get context-sensitive Help elsewhere in Forecast, do either of the following:
•
Position your mouse over the item in question and press the F1 function key. This is
especially helpful for open dialog boxes that do not contain a Help button, as the Help
Toolbar button will not open dialog boxes and cannot be selected if a dialog box is already
open.
OR
•
Select the Help toolbar button
for use with toolbar buttons or menu items. This will
change the cursor to a question mark. Move the question mark pointer over an item and click
to get Help for that item.
Using Help
The Using Help command opens the Help Topics: Windows Help dialog box. Select the
desired tab (Contents, Index, or Find) to search for help associated with Windows.
About Forecast
The About forecast... command opens the About Forecast dialog box. The dialog box contains
information regarding the version of Forecast Capacity Planner installed on your system.
110
Shortcut Menu
....
MENUS AND COMMANDS
Shortcut Menu
A shortcut menu is a context-sensitive menu containing commands that apply to a selected item.
The shortcut menu in Forecast Capacity Planner contains the commands found on the Edit menu
on the menu bar. You can access this menu by right-clicking an item.
Figure 8.40
Shortcut menu
111
9
MODEL CREATION AND VALIDATION
The model creation and validation process creates an accurate model of your system based on
the data collected on your host system for throughput, CPU utilization, and other workload values.
The key to accurate forecasting is to ensure that your calculated values accurately reflect the
actual values on the host system.
The procedures in this chapter assume:
•
Forecast Capacity Planner is installed and running on your PC. The product logo is
displayed in the Main Program window (this display will be referred to as the Logo screen.)
•
The data collection process on the host system is complete and the collection file (*.col) is
transferred to your PC.
Setting Thresholds
Before loading and validating a new model, review the default forecast and validation thresholds
to determine if they are suitable for your model. In some instances, you may want to set the
threshold CPU utilization limits higher or lower than the default.
Forecast Thresholds
The default CPU utilization values in the Thresholds dialog box are based on typical utilization
limits for MPE/iX and MPE/V CPUs. Generally, system performance is compromised at higher
utilization levels.
To change the CPU utilization threshold:
1
On the Options menu, click Thresholds.
2
In the Thresholds dialog box, click the Forecast tab.
113
9
FORECAST CAPACITY PLANNER USER’S GUIDE
Model Creation and Validation
Figure 9.1
Thresholds dialog box: Forecast tab
3
Click in the appropriate text box for your CPU.
4
Enter the desired CPU value.
5
Click the Apply button to apply the change to the current session. This change will not be
saved until you validate the model.
Validation Thresholds
The validation thresholds limit the variability allowed between your model and the actual data. If
the value predicted by the model, based on measured data values, differs from the actual values
by more than the set percentage, either a warning message will display or the validation process
will fail as described in Table 9.2 on page 117.
To view or edit the validation thresholds:
114
1
On the Options menu, click Thresholds.
2
In the Thresholds dialog box, click the Validation tab.
....
MODEL CREATION AND VALIDATION
Setting Thresholds
Figure 9.2
Thresholds dialog box: Validation tab
3
Click in the appropriate box and type the desired values. Each validation threshold is
explained in Table 9.1.
4
Click the Apply button to apply the change to the current session. The change will not be
saved until you validate the model.
Table 9.1
Validation thresholds
Validation Threshold
Description
Response time
The acceptable percentage discrepancy between the
response times predicted by the model and the actual
response times observed. Validation will fail when this
limit is exceeded.
Throughput
The acceptable percentage discrepancy between the
throughput predicted by the model and the actual
throughput observed. Validation will fail when this limit is
exceeded.
Utilization
The acceptable percentage discrepancy between the
CPU or disk utilization predicted by the model and the
actual utilization observed. Validation will fail when this
limit is exceeded.
Queue length
The acceptable percentage discrepancy between the
CPU or disk queue lengths predicted by the model and
the actual queue lengths observed. Validation will fail
when this limit is exceeded.
115
9
FORECAST CAPACITY PLANNER USER’S GUIDE
Model Creation and Validation
Validation Threshold
Description
Workload calibration
This threshold value is used during the workload
calibration phase of model validation. A warning
message is generated when this limit is exceeded.
Load calibration
When a new model is constructed from a load sample
interval, a warning message is generated if the predicted
CPU utilization or disk IO rate for any disk differs from
the actual values by more than the set Load calibration
threshold.
Session Workload Type
Click the appropriate button to select session type or
transaction type for interactive workloads:
•
Session type workloads allow specification and
throughput calculation of the user count and think
times.
•
Transaction type workloads allow specification and
throughput calculation of the user count.
Loading a New Collection File
To load a new model:
1
On the File menu, click Load/Validate Model. The Open dialog displays.
2
In the Files of type list, click Collections (*col).
3
Click once on the collection file to select it.
Figure 9.3
4
116
Open dialog box
Click Open to load the collection file.
....
MODEL CREATION AND VALIDATION
Loading a New Collection File
Validation Messages
As the loading process runs, a list of warnings and informational messages appear in the
Validation Messages dialog box. These messages provide information about workloads that
may violate one or more modeling algorithm assumptions (see “Queuing Model Algorithm
Assumptions” on page 118 for information).
Figure 9.4
Validation Messages dialog box
Review the messages presented in the Validation Messages dialog box and decide what, if any,
influence they have on your model. Consider the following examples from the validation
messages listed in Table 9.2.
Table 9.2
Example validation messages
Validation Message
Description
Workload group NETBASE contains
multiple process priorities
"Multiple process priorities" means that
there are processes defined in the
NETBASE workload group with different
queues. Therefore, the NETBASE
workload group may not be
homogeneous. (See “Identifying and
Characterizing Workload Groups” on
page 14 for information on
homogeneous workloads.)
Workload group LA contains both jobs
and sessions
The workload group LA contains both
jobs (batch processes) and sessions
(interactive processes). Batch and
interactive processes use system
resources differently. (See “Identifying
and Characterizing Workload Groups”
on page 14 for information on mixing
batch and interactive processes in single
workloads.)
117
FORECAST CAPACITY PLANNER USER’S GUIDE
Model Creation and Validation
9
In both validation message examples, it may or may not be necessary to redefine the workloads
and repeat the collection and reduction processes on the host system. For instance, if the
workload group NETBASE accounts for only a small percentage of total CPU utilization on the
host system, the effect on the model and your forecast may be negligible.
To print the contents of the Validation Messages box:
1
On the File menu, click Print.
2
From the Print submenu, click Notes.
Select the desired print options in the Windows Print dialog box. (Refer to your Windows
documentation for information on print options.)
Once you are satisfied that the messages in the Validation Messages dialog box will not affect
the model, click OK to close the box and complete the loading process.
Validating the Model
To validate the baseline model:
1
On the Forecast menu, click Validated Model.
2
In the message box, click Yes to begin the validation process. The file name extension of the
document changes to the model format (*.mdl).
3
On the File menu, click Save Model.
4
In the Save As dialog box, click Save to save the model to the default location on your
computer.
Validation Failures
On a rare basis, the validation process fails when the calibrated model and the actual data values
violate the validation thresholds in your model. To understand these assumptions, review the
basic queuing model algorithm assumptions (see “Queuing Model Algorithm Assumptions” on
page 118).
•
Making the appropriate modifications will allow you to proceed with the forecast process.
Queuing Model Algorithm Assumptions
The validation process is based on assumptions regarding the workloads and hardware
resources on your host system. If repeated attempts to validate the model fail, call the Lund
Performance Solutions technical support team for help. (See “Lund Performance Solutions
Technical Support Team” on page 4.)
Violation of the following assumptions may cause validation to fail.
118
....
MODEL CREATION AND VALIDATION
Validating the Model
CPU and disk demands are accurately calculated for each workload transaction
Verify the identity of your CPU and disk types in the model before repeating the validation
process.
Although rarely violated, this assumption is critical to successful validation.
No multi-threading of individual transactions occurs
An individual transaction uses only one resource at a time (either CPU or disk drive). In general,
this assumption is violated in one of two ways:
•
By applications that perform no-wait terminal I/O or use multiple threads to perform
simultaneous activity for one transaction.
•
By applications that perform a significant number of disk writes. Disk caching and the
operating system can each allow a transaction to continue to execute while its disk writes
are being performed. During validation, the workload group shows a predicted response
time that is higher than actually observed, while the CPU and disk utilization statistics are
accurate. The difference between the observed and predicted transaction response times is
approximately equal to the number of disk-write requests that the transaction performs,
multiplied by the disk access time.
All workload requests for disk service and all CPU requests are satisfied in nonpreferential order within each priority queue—requests, once they reach the
CPU, are handled on a first-in-first-out (FIFO) basis
•
The first request in a queue is honored before the second request in that queue.
•
MPE/iX systems fine tune some of the process priorities within sub queues.
•
Workloads performing long, CPU-intensive transactions—CPU "hogs"—tend to have a lower
priority than other workloads. In this case, the FIFO rule does not apply.
For MPE systems, you can fix the problem by manually setting CPU-intensive workloads to a twodigit priority code to distinguish them from regular workloads. When the workload group is
identified, assign it a different queue specification within the queue. For example, a CPU-intensive
workload group in the C queue is prioritized as C2. Forecast Capacity Planner will look at that
queue separately. C2 is prioritized higher than D, but lower than C.
HP-UX systems have what is called a nice system call. With nice, a process is able to influence
its own scheduling to a degree. To provide a process with less CPU time, assign a larger nice
value. The following equation explains how priorities are calculated:
priority = ("recent CPU usage" / constant) + (base priority) + (nice value)
For more information regarding the nice system call, read Chapter 6 of Taming UNIX, Volume I,
by Robert A. Lund.
119
FORECAST CAPACITY PLANNER USER’S GUIDE
Model Creation and Validation
9
No workload group is spending a significant amount of time waiting for any
resource other than the CPU, a disk drive, or a terminal read
Validation failure in this case results in relatively accurate throughput and utilization values, but
significantly negative workload response time variances.
Use a performance monitoring tool (such as SOS Performance Advisor by Lund Performance
Solutions) to determine if workload transactions are spending too much time waiting for such
things as SIRs, file locks, or database locks. Transactions requesting tape I/O or multiapplications (LANS) that pass all of their processing through a single-threaded resource may
cause this problem.
Transaction requests arrive in a random order
Validation failure in this case results in generally accurate throughput and utilization values, but
significant workload response time variances.
There is no synchronizing effect causing transactions to request CPU and disk resources at the
same time. This could happen when think times are the same. For example, two people doing file
transfers and their think time is always 10 seconds.
Workload Groups
Workload definition is critical to successful validation of your model. Review your workloads for
compliance with the following rules. (For more information about workload definitions, see
“Identifying and Characterizing Workload Groups” on page 14.)
•
Avoid mixing jobs and sessions in workloads. If you have mixed workloads and your model
validation fails, refine your workload definitions and repeat the data collection and reduction
processes described in “MPE/iX Host Data” on page 15 or “HP-UX Host Data” on page 22.
•
When possible, break work groups down by user logon rather than program name.
A workload group appears too slow
If a workload group appears too slow, you can isolate that workload group by running another
reduction from the original collection file. Choose the optimum time (the maximum period for that
workload group) and repeat the collection, transfer, loading, and validation processes. If the
validation process fails, review the original workload group definition file.
An actual resource variable is greater/less than the modeled resource variable
To analyze variables other than transaction type, such as average response time, set transactions
per hour as a constant by changing all workloads to the TRANSACTION type. For example,
actual response time may be greater than the modeled response time because of a network delay
for a workload group. Modifying the average delay time for that workload group may eliminate the
problem.
120
Changing the Model
....
MODEL CREATION AND VALIDATION
The Trans/Hr variance is greater than +/- 15 percent
Change the average delay for your workloads. Start with the highest priority. Small errors in highpriority jobs have a greater impact on lower-priority jobs. Change only one workload group at a
time and limit the amount of change to, perhaps, 10 percent. This changes the arrival rate of
transactions and response time.
Changing the Model
Forecast Capacity Planner allows you to change the baseline data in your model to try out
different what-if scenarios. Observe what happens, for example, if you alter the model by:
•
Replacing the current CPU with a larger model.
•
Adding growth rates and aging.
•
Changing the parameters for one or more workload groups.
You can edit, add, insert, or delete items associated with workloads or resource in your validated
model directly from the Main Program window. Some of these menu options are unavailable for
some items.
121
9
FORECAST CAPACITY PLANNER USER’S GUIDE
Model Creation and Validation
Editing a Workload Group
To edit a workload group:
1
Select the workload group from either the global validated workloads or file manger pane
in the Main Program window.
2
On the Edit menu, click Edit or press the Enter key.
3
Type or select the new workload group parameters in the Edit Workload dialog box.
Figure 9.5
122
Edit Workload dialog box
....
MODEL CREATION AND VALIDATION
Changing the Model
Table 9.3
Edit Workload parameters
Workload Parameter
Instructions to Edit the Workload Parameter
Workload Group Name
Enter the workload group name.
Description
Enter the description used to describe the workload
group in forecast graph legends and in the results
display.
Class
Select either Transaction, Session, or Job. Session and
job workloads are those for which the transaction
throughput is calculated based on the number of users
and average user think time.
•
Transaction workloads are those for which the
transaction throughput is known in advance.
Users
Enter the number of users in this workload group.
Avg think time
Enter the average user think time in seconds. For job
workloads, this parameter should be 0 (zero).
CPU time per
transaction
Enter the CPU time in milliseconds required to process
one transaction. For job workload groups, this parameter
should be the CPU time required to process the entire
job.
Growth rate
1
In the Edit Workload dialog box, click the Growth
Rate button.
2
In the Growth Rate dialog box, choose the monthly,
quarterly, or yearly rate of growth for this workload
group.
3
Click OK to save the change and return to the Edit
Workload dialog box.
Note: Multiple growth rate periods (split rates) can be
entered. You can also set a tiered rate and choose a
growth type for the workload group (linear, compound, or
tiered).
Priority
Enter the workload group priority. This can be any oneor two-character alphanumeric code.
123
9
FORECAST CAPACITY PLANNER USER’S GUIDE
Model Creation and Validation
Workload Parameter
Start months
Instructions to Edit the Workload Parameter
If the workload group will be continuously active during
the forecast interval, enter 0 (zero).
If the workload group will not activate for a specific time,
enter a positive number representing the number of
months.
If the workload group is initially active but will terminate
after a specific time, enter a negative number that
represents the number of months.
Avg delay time
Enter the extra delay time associated with this workload
group. This can be used to represent any loadindependent, average delay time, such as might be
required to represent network delays, or flushing
terminal output buffers.
CM percentage
Enter the percent of total CPU time that this workload
group spends executing in compatibility mode.
Throughput
Enter the total transaction throughput for this workload
group.
Actual throughput
•
Enter the actual transaction throughput, if known,
for this system configuration. This value is used to
adjust the predicted model transaction throughput to
provide a more accurate forecast result.
•
To reset the parameter to the unadjusted predicted
transaction throughput, enter 0 (zero) or leave the
box empty.
Accept response time
Enter the maximum acceptable response time in
seconds for this workload group, or 0 (zero) if no limit
should be specified.
Actual response time
•
Enter the actual response time, if known, for this
system configuration. This value will be used to
adjust the predicted model response time to provide
a more accurate forecast result.
•
To return the field to the unadjusted predicted
transaction throughput, enter 0 (zero) or leave the
box empty.
Disk IO per transaction
124
Enter the number of disk accesses on this disk drive
required to process one transaction. For job workloads,
this should be the number of disk accesses required to
process the entire job.
....
MODEL CREATION AND VALIDATION
Changing the Model
Adding, Inserting, and Deleting Workload Groups
Add, insert, or delete workload groups to observe the effects of usage changes on the model.
•
The Add menu option adds a new workload group to the end of the workload group list.
•
The Insert menu option inserts a new workload group immediately below the selected
workload group on the workload group list.
•
The Delete menu option removes the selected workload group from the workload group list.
Adding a Workload Group
1
In the global validated workloads pane or the file manger pane, select any workload
group.
2
On the Edit menu, click Add.
3
In the Edit Workload dialog box, enter or select the desired values as described in Table
9.3.
4
Click OK to save your changes and return to the Main Program window.
Inserting a Workload Group
1
In the global validated workload pane or the file manager pane, select the workload
group immediately above the position where you want the new workload group to appear.
2
On the Edit menu, click Insert.
3
In the Edit Workload dialog box, enter or select the desired values as described in Table
9.3.
4
Click OK to save your changes and return to the Main Program window.
Deleting a Workload Group
1
In the global validated workload pane or the file manger pane, select the workload group
to delete.
2
On the Edit menu, click Delete. A message box will display and ask you if you want to delete
the workload group.
3
Click Yes to delete the object, or No to cancel the process.
125
FORECAST CAPACITY PLANNER USER’S GUIDE
Model Creation and Validation
9
Editing Resources
Editing a Disk Drive
1
In the global validated centers pane or the file manger pane, select the disk drive to edit.
2
On the Edit menu, click Edit.
Figure 9.6
3
Disk Edit dialog box
In the New disk area of the Disk Edit dialog box, enter or select the new parameters for the
disk drive as described in Table 9.4.
Table 9.4
Disk Edit parameters
Disk Parameter
4
Instructions to Edit the Disk Parameter
Title
Enter a new disk drive name.
Type
Select a new disk drive type from the list.
Access Time
Enter a new access time for the selected disk drive.
Click OK to save your changes and return to the Main Program window.
Editing a CPU
1
In the global validated centers pane or the file manger pane, select the CPU to edit.
2
On the Edit menu, click Edit.
Figure 9.7
126
CPU Edit dialog box
....
MODEL CREATION AND VALIDATION
Changing the Model
3
In the CPU Edit dialog box, enter or select the new parameters for the CPU as described in
Table 9.5.
Table 9.5
CPU parameters
CPU Parameter
4
Instructions to Edit the CPU Parameter
CPU
Enter a new CPU name.
Type
Select a new CPU type from the list.
Adj
Enter a new CPU adjustment factor.
CM Adj
Enter a new compatibility mode adjustment factor.
Click OK to save your changes and return to the Main Program window.
Adding, Inserting, and Deleting Resources
Add, insert, or delete disk drives to observe the effects of usage changes on the model. You
cannot add or delete the CPU.
•
The Add menu option adds a new disk drive to the end of the list.
•
The Insert menu option inserts a new disk drive immediately below the selected disk in the
list.
•
The Delete menu option removes the selected disk drive from the model.
Adding a Disk Drive
1
In the global validated centers pane or the file manger pane, select any disk.
2
On the Edit menu, click Add.
3
In the Edit Workload dialog box, enter or select the desired values as described in Table
9.4.
4
Click OK to save your changes and return to the Main Program window.
Inserting a Disk Drive
1
In the global validated centers pane or the file manager pane, select the disk drive
immediately above the position where you want the new disk to appear.
2
On the Edit menu, click Insert.
3
In the Edit Workload dialog box, enter or select the desired values as described in Table
9.4.
4
Click OK to save your changes and return to the Main Program window.
127
FORECAST CAPACITY PLANNER USER’S GUIDE
Model Creation and Validation
9
Deleting a Disk Drive
1
In the global validated centers pane or the file manger pane, select the disk drive to
delete.
2
On the Edit menu, click Delete. A message box will display and ask you if you want to delete
the disk drive.
3
Click Yes to delete the object, or No to cancel the process.
Saving and Reusing Desktops
At any time during the validating and forecasting processes, you can save and rename the current
desktop to preserve any changes to the model. This can be useful if you plan to generate
multiple-performance projections from your baseline model. The Save Desktop command saves
all of your current settings, links to currently-opened files, and window layout options.
Saving the Active Desktop
To save the active desktop:
1
On the File menu, click Save Desktop.
2
In the Save As dialog box:
a
Enter the name of the desktop in the File name box.
b
Click the Save button to save the desktop (*.dsk).
Reloading a Saved Desktop File
To reload a saved desktop (*.dsk) file:
1
On the File menu, click Load Desktop.
2
In the Open dialog box:
a
Locate and select the desired desktop file.
b
Click OK to open the desktop file in Forecast Capacity Planner.
Restoring the Current Desktop
To restore the current desktop to the last saved version:
128
1
On the File menu, click Restore Layout.
2
In the Open dialog box:
a
Locate and select the last saved version of the desktop.
b
Click OK.
10
MODEL FORECASTING
The model creation and validation processes presented in the previous chapter, provide an
accurate snapshot of your host system. The procedures in this chapter allow you to add the
dimension of time to your model to accurately predict the future performance of your host system.
The procedures in this chapter assume:
•
Forecast Capacity Planner is installed and running on your PC.
•
The data collection process on the host system is complete and the collection file (*.col) is
transferred to your PC.
•
The loading and validation process is complete and you have a validated model (*.mdl) on
your PC.
Configuring the Forecast Model
Before graphing a performance projection from your validated model, decide what you hope to
achieve with your projection. For example:
•
•
What do you want your performance projection graph to show?
•
How fast do you expect utilization to increase on your system in the next quarter or the
next year?
•
Do you expect utilization to increase uniformly on the system, or do you expect some
workloads to grow faster?
•
How far into the future do you want to look?
How do you want the information presented?
•
Do you want to group all workloads and resources as a single line?
•
Do you want to graph some workloads or resources separately?
The answers to these questions and other questions are figured into your performance projection.
Use the Forecast Options to set the values on which your projection is based.
129
10
FORECAST CAPACITY PLANNER USER’S GUIDE
Model Forecasting
Setting Forecast Options
To set forecast options:
1
On the Forecast menu, click Forecast Options.
2
From the Options tab in the Forecast Options dialog box (Figure 10.1), enter or select new
options as described in Table 10.1.
Figure 10.1
3
Forecast Options dialog box: Options tab
Click OK to apply the change(s) and return to the Main Program window, or click the Rates
tab to change the forecast growth rates.
Table 10.1
Forecast options
Forecast Option
130
Instructions to Set Forecast Options
Start month
Verify the starting month for your performance
projection.
Periods
Enter the number of periods (months, quar ters, or years)
to be shown on the graph.
....
MODEL FORECASTING
Configuring the Forecast Model
Forecast Option
Growth type
Instructions to Set Forecast Options
Select the global growth type:
•
Select Workload to apply the growth type specified
in your validated model for each workload to your
forecast graph.
•
Select Linear to apply the linear growth type for all
workloads, regardless of the growth type specified
for that workload in your validated model.
•
Select Compound to apply the compound growth
type for all workloads, regardless of the growth type
specified for that workload in your validated model.
•
Select Tiered to apply the tiered growth type for all
workloads, regardless of the growth type specified
for the workloads in your validated model.
Period type
Select the period type: months, quarters, or years.
Workloads
Select individual workloads to char t during the
performance projection.
Selecting All Workloads reports the total of all
unselected workloads as a single line in the graph.
Start year
Verify the starting year for your performance projection.
Adjusts Results
Select the Adjusts Results check box to adjust forecast
results to match the observed system values.
Graph type
Select the graph type:
•
Resp Time
•
Throughput
•
CPU Util
•
Disk I/O
•
Disk Util
131
10
FORECAST CAPACITY PLANNER USER’S GUIDE
Model Forecasting
Forecast Option
Growth option
132
Instructions to Set Forecast Options
Select the global growth option:
•
Select Workload to apply the growth rate specified
in the Edit window of the individual workload
groups.
•
Select Override to apply the growth rate in the
Forecast Options window Rates tab to the model
globally. This setting will override the individual
settings.
•
Select Add to apply the sum of the global growth
rate and the individual workload growth rate in your
validated model.
•
Select Rep Zero to apply the global growth rate only
if the individual rate is zero.
CPUs
Select the CPU models to chart in the performance
projection.
Disks (only visible when
Graph Type is set to a
disk chart)
Select individual disks to chart in the performance
projection.
Selecting All Disks reports the total of all unselected
disks as a single line in the graph.
....
MODEL FORECASTING
Configuring the Forecast Model
Setting Forecast Growth Rates
To set forecast growth rates:
1
On the Forecast menu, click Forecast Options.
2
In the Forecast Options dialog box, click the Rates tab (Figure 10.2).
Figure 10.2
Forecast Options dialog box: Rates tab
3
Enter or select new options as described in Table 10.2.
4
Click OK to apply the change(s) and return to the Main Program window.
Table 10.2
Rates options
Rates Option
Tiered rate
Instructions to Set Rates Options
1
In the Options tab, ensure Tiered is selected as the
Growth type option.
2
In the Rates tab, enter the Tiered rate (the
percentage of the growth rate that will remain after it
is applied).
Growth rate
Enter the global growth rate for your performance
projection.
Apply growth period
Select Month, Quar ter, or Year. The growth period
determines how frequently the growth rate is applied in
the performance projection.
Based on the information in your validated model and the options set in the Forecast Options
dialog box, Forecast Capacity Planner creates a dynamic model of your system. You can view,
print, or export that model in either a graphic format or a report format.
133
10
FORECAST CAPACITY PLANNER USER’S GUIDE
Model Forecasting
Aging the Forecast Model
The aging function of Forecast Capacity Planner offers a quick and easy way to generate
forecasting information about your model. The aging function enables you to fast forward to a
future date and view the effects of workload growth rates on the model. The aged model is based
on the growth rates assigned to your workloads in the validated model. (See “Editing a Workload
Group” on page 122 for more information about changing workload growth rates.)
To age the model:
1
On the Forecast menu, click Age Model.
2
In the Age Model dialog box, enter the number of months to age the model.
Figure 10.3
3
Age Model dialog box
Click OK to apply the change.
To return to a non-aged model (the original model), click Undo from the Edit menu. This can be
done even if you saved the aged model.
Creating Forecast Reports
Use the Report Fonts and Report Options commands to change the appearance of your
printed reports.
Setting Report Fonts
1
On the Options menu, click Report Fonts.
2
In the Font dialog box, specify the following:
3
134
•
Font
•
Font style
•
Size
•
Sample
•
Script
Click OK to save the change(s) and return to the Main Program menu.
....
MODEL FORECASTING
Creating Forecast Reports
Setting Report Options
1
On the Options menu, click Report Options.
2
From the Page Setup tab in the Report Options dialog box (Figure 10.4), enter or select
new options as described in Figure 10.4.
3
In the Measure units field, select Inches or Centimeters. This field determines the unit of
measurement for the rest of the options in this tab:
•
Field minimum size
•
Field maximum size
•
Distance between fields
•
Distance between rows (row height)
Figure 10.4
Report Options dialog box: Page Setup tab
4
Click OK to apply the change(s) and return to the Main Program window, or click the
Margins Setup tab to change the report margins.
5
In the Report Options dialog box, click the Margins Setup tab (Figure 10.5).
135
FORECAST CAPACITY PLANNER USER’S GUIDE
Model Forecasting
10
Figure 10.5
Report Options dialog box: Margins Setup tab
6
Enter or select new options as described in Figure 10.5.
7
In the Measure units field, select Inches or Centimeters. This field determines the unit of
measurement for the rest of the options in this tab:
8
•
Left margin
•
Top margin
•
Bottom margin
•
Distance between rows (row height)
Click OK to apply the change(s) and return to the Main Program window.
Printing Forecast Reports
Performance Gallery Gold uses a standard Windows-based Print menu.
Setting Print Parameters
To specify the parameters for your print request, such as the paper size and orientation:
136
1
On the File menu, click Print Setup.
2
Set the print parameters.
3
Click OK to save the print parameters and return to the Main Program window.
....
MODEL FORECASTING
Creating Forecast Reports
Previewing Forecast Reports
To preview the print job prior to printing:
1
From the file manager pane in the Main Program window, select the Model icon.
2
On the File menu, click Print Preview.
3
•
Click Zoom In to examine the page in closer detail.
•
Click Zoom Out to view the entire page.
•
Click Next Page to view the next page.
•
Click Previous Page to view the previous page.
•
Click Two Page to view two consecutive pages, side by side.
After previewing the print job, either click Close to return to the Main Program window, or
select the Print... command button to send the chart(s) to the printer.
Printing Forecast Reports
To send a forecast report to the printer:
1
From the file manager pane in the Main Program window, select the Model icon.
2
On the File menu, click Print.
3
From the Print submenu, click Model.
4
Before the report is actually sent to the printer, the Print dialog box will prompt you to check
the print settings. Click OK to send the print request.
Exporting Forecast Reports
To export a forecast report to another application:
1
From the file manager pane in the Main Program window, select the Model icon.
2
On the Forecast menu, click Copy to Clipboard.
3
Paste the report into your document or presentation application.
137
A
KEYBOARD COMMANDS
Alternate Key Commands
Using the keyboard commands to access frequently-used commands can enhance your
productivity while working in Forecast Capacity Planner.
To access any command on the menu bar from the keyboard:
1
Press and hold down the Alt key.
2
Press and hold the key corresponding to the underlined letter in the menu name.
3
If applicable, press and hold the key corresponding to the underlined letter in the submenu
name.
4
Press the key corresponding to the underlined letter in the command name.
For example, the keyboard equivalent for the Delete Model command on the File menu is:
Alt + F + D + M
Two-key and Function Key Commands
Some commonly-used commands are also assigned to a two-key or function key equivalent as
described in the following tables (grouped according to menu).
139
A
FORECAST CAPACITY PLANNER USER’S GUIDE
Keyboard Commands
File Menu Command Shortcuts
Menu Command
140
Toolbar
Button
Keyboard Equivalent(s)
New Model
Alt + F + N
Ctrl + N
Load/Validate model
Alt + F + O
Ctrl + O
Save Model
Alt + F + M
Ctrl + S
Save Model As
Alt + F + S
Close
Alt + F + C
Delete Model
Alt + F + D + M
Delete Collection
Alt + F + D + C
Delete Desktop
Alt + F + D + D
Delete Resources
Alt + F + D + R
Print Setup
Alt + F + R
Print Preview
Alt + F + V
Print Model
Alt + F + P + M
Print Graph
Alt + F + P + G
Print Notes
Alt + F + P + N
Print Screen
Alt + F + P + S
Print Resources
Alt + F + P + R
Send
Alt + F + D
Ctrl + P
Menu Command
Toolbar
Button
....
KEYBOARD COMMANDS
Two-key and Function Key Commands
Keyboard Equivalent(s)
Load Resources
Alt + F + L
Save Resources
Alt + F + U
Save Resources As
Alt + F + A
Load Desktop
Alt + F + T
Save Desktop
Alt + F + K
Restore Layout
Alt + F + E
Recently Accessed Files
Alt + F + the
underlined file
number to the
left of the file
name
Exit
Alt + F + X
Alt + F4
141
A
FORECAST CAPACITY PLANNER USER’S GUIDE
Keyboard Commands
Edit Menu Command Shortcuts
Menu Command
142
Toolbar
Button
Keyboard Equivalent(s)
Undo
Alt + E + U
Ctrl + Z
Redo
Alt + E + R
Ctrl + Y
Cut
Alt + E + T
Ctrl + X
Copy
Alt + E + C
Ctrl + C
Copy to Clipboard
Alt + E + P
Ctrl + V
Edit
Alt + E + E
Enter key
Add
Alt + E + A
Insert
Alt + E + I
Delete
Alt + E + D
....
KEYBOARD COMMANDS
Two-key and Function Key Commands
Options Menu Command Shortcuts
Menu Command
Toolbar
Button
Keyboard Equivalent(s)
Repor t Fonts
Alt + O + F
View Options
Alt + O + V
Repor t Options
Alt + O + E
Graph Options
Alt + O + G
Resources
Alt + O + R
Thresholds
Alt + O + T
Prompt for all disks
Alt + O + O
Prompt for titles
Alt + O + P
Change titles
Alt + O + C
Forecast Menu Command Shortcuts
Menu Command
Toolbar
Button
Keyboard Equivalent(s)
Forecast Options
Alt + R + R
Graph Forecast
Alt + R + G
Age Model
Alt + R + A
Change Name
Alt + R + C
Copy to Clipboard
Alt + R + O
Graph to Clipboard
Alt + R + L
Export Forecast
Alt + R + E
143
A
FORECAST CAPACITY PLANNER USER’S GUIDE
Keyboard Commands
Menu Command
Toolbar
Button
Validated Model
Keyboard Equivalent(s)
Alt + R + V
View Menu Command Shortcuts
Menu Command
Toolbar
Button
Keyboard Equivalent(s)
Toolbar
Alt + V + T
Formatbar
Alt + V + F
Main Status Bar
Alt + V + S
Child Status Bar
Alt + V + C
Window Menu Command Shortcuts
Menu Command
144
Toolbar
Button
Keyboard Equivalent(s)
Cascade
Alt + W + C
Tile Horizontally
Alt + W + T
Tile Vertically
Alt + W + V
Next Pane
Alt + W + N
Previous Pane
Alt + W + P
Arrange Icons
Alt + W + A
Current Window
Alt + W + the
underlined
window
number to the
left of the
window name
....
KEYBOARD COMMANDS
Two-key and Function Key Commands
Help Menu Command Shortcuts
Menu Command
Toolbar
Button
Keyboard Equivalent(s)
Tip of the Day
Alt + H + P
Help Topics
Alt + H + H
Using Help
Alt + H + U
About forecast
Alt + H + A
F1 key
145
B
PROGRAM MESSAGES
Confirmation Messages
Message
Cause
Corrective Action
Are you sure you want to
delete all centers?
The user attempted to delete the
Centers header on the tree view.
Click Yes to save changes or No
to clear changes.
Are you sure you want to
delete all information from
the model?
The user attempted to delete the
model on the tree view.
Click Yes to save changes or No
to clear changes.
Are you sure you want to
delete all workloads?
The user attempted to delete the
Workloads header on the tree
view.
Click Yes to save changes or No
to clear changes.
Are you sure you want to
delete the CPU?
The user attempted to delete the
CPU.
Click Yes to save changes or No
to clear changes.
Are you sure you want to
delete the notes?
The user attempted to delete
Notes from the tree view.
Click Yes to save changes or No
to clear changes.
Are you sure you want to
delete the selected
center(s)?
The user attempted to delete one
or more disk(s) from the model.
Click Yes to save changes or No
to clear changes.
Are you sure you want to
delete the selected disk?
A disk resource was about to be
deleted from the Disk tab in the
Resources dialog box.
Click Yes to save changes or No
to clear changes.
Are you sure you want to
delete the selected
workload(s)?
One or more workload groups
was/were about to be deleted.
Click Yes to save changes or No
to clear changes.
Are you sure you want to
validate the model?
The user attempted to validate
the model.
Click Yes to accept the new
model or No to return to the
collection data.
147
B
FORECAST CAPACITY PLANNER USER’S GUIDE
Program Messages
Message
Cause
Corrective Action
Do you really want to copy
the center(s) here?
The user attempted to either
paste or drag-and-drop one or
more disks into the model.
Click Yes to save changes or No
to clear changes.
Do you really want to copy
the workload(s) here?
One or more workload groups
was/were about to be copied.
Click Yes to save changes or No
to clear changes.
Do you really want to delete
the selected CPU?
A CPU resource was about to be
deleted from the CPUs tab in the
Resources dialog box.
Click Yes to delete the resource
or No to abort the deletion
process.
Do you want to keep
changes to notes?
The user made changes to the
contents of the Notes window
pane, either by deleting or adding
to the text.
Click Yes to save changes or No
to clear changes.
The current resource file was
modified! Do you want to
save it?
The user attempted to close the
program after resources were
modified and not saved.
Click Yes to save changes or No
to clear changes.
Information Messages
Message
Cause
Corrective Action
Cannot copy/cut/paste the
CPU center.
The user attempted to copy, cut,
or paste the CPU center.
The program does not allow this
action, due to the number of
variables associated with it.
Couldn’t set the minimum
size bigger than the
maximum one!
The user attempted to set a
maximum value that is less than
the minimum value.
The dialog will not close unless
the proper values are filled or
Cancel is pressed, in which case
the old values are preserved.
Embedded models will be
automatically validated!
The user attempted to embed or
link a collection file into an OLE
container or an ActiveX container.
Since a collection file cannot be
embedded, it is automatically
validated. This message informs
the user about this fact.
No CPU selected!
The user attempted to insert or
delete a CPU resource from the
CPUs tab in the Resources
dialog box and there is no CPU
selected in the list box.
Select a CPU.
148
....
PROGRAM MESSAGES
Information Messages
Message
Cause
Corrective Action
No disk selected!
The user attempted to insert or
delete a disk resource from the
Disk dialog box and there is no
disk selected in the list box.
Select a disk.
Please enter a non-empty
name for the disk!
The user attempted to save
changes to the Disk dialog box
and no disk name was entered.
Enter a disk name or click
Cancel.
Please enter a signed
integer number!
The user entered an invalid
number in a dialog box or
property page.
Enter a valid number.
Please enter a valid date/
time!
The user entered an invalid date
or time value in a dialog box or
property page.
Enter a valid date or time.
Please enter a valid number!
The user entered an invalid
number in a dialog box or
property page.
Enter a valid number.
Resource adjustment
shouldn’t be 0!
The user attempted to close the
Resources dialog box and the
CPU resource adjustment factor
is set to 0 (zero).
Enter a numerical value greater
than or less than 0 (zero), or click
Cancel.
Response time shouldn’t be
0!
The user attempted to close the
Resources dialog box and the
disk response time is set to 0
(zero).
Enter a numerical value greater
than or less than 0 (zero), or click
Cancel.
The date/time is too big!
Please enter a date/time
equal or less than xxx!
The user entered an invalid date
or time value in a dialog box or
property page.
Enter a valid date or time.
The date/time is too small!
Please enter a value equal
or bigger than xxx!
The user entered an invalid date
or time value in a dialog box or
property page.
Enter a valid date or time.
The number is too big!
Please enter a number equal
or less than xxx!
The user entered an invalid
number in a dialog box or
property page.
Enter a valid number.
The number is too small!
Please enter a number equal
or bigger than xxx!
The user entered an invalid
number in a dialog box or
property page.
Enter a valid number.
149
B
FORECAST CAPACITY PLANNER USER’S GUIDE
Program Messages
Message
Cause
Corrective Action
The value is too big! Please
enter a value equal or bigger
than xxx!
The user entered an invalid
number in a dialog box or
property page.
Enter a valid number.
The value is too small!
Please enter a value equal
or bigger than xxx!
The user entered an invalid
number in a dialog box or
property page.
Enter a valid number.
There should be at least one
disk selection!
The user attempted to open a
disk capacity graph and no disks
were selected in the Forecast
Options dialog box.
Enter a disk selection or click
Cancel to keep the old
properties.
There should be at least one
workload selection!
The user attempted to open a
workload capacity graph and no
workload groups were selected in
the Forecast Options dialog box.
Enter a workload group selection
or click Cancel to keep the old
properties.
To edit a disk center you
should select one!
The user attempted to edit a disk
center and no disk is selected.
Select a disk.
You cannot add a disk until
you validate the model!
Please select a disk in order
to edit it!
The user attempted to add a disk
to an unvalidated model.
Validate the model before adding
a disk.
You cannot change the CPU
until you validate the model!
The user attempted to edit the
CPU in an unvalidated model.
Validate the model before editing
the CPU selection.
You cannot delete the CPU if
there are disk centers!
The user attempted to delete the
CPU and there are disks in the
model.
Delete the disk centers first, then
delete the CPU.
You cannot drop disks here!
The user attempted to drag-anddrop one or more disk(s) on a list
that displays workload groups.
The program does not allow this
action.
You cannot drop workloads
here!
The user attempted to drag-anddrop one or more workload
groups on a list that displays
disks.
The program does not allow this
action.
You cannot edit the CPU
until the model is validated!
The user attempted to edit the
CPU in an unvalidated model.
Validate the model before editing
the CPU selection.
150
....
PROGRAM MESSAGES
Information Messages
Message
Cause
Corrective Action
You could not select All
Disks for Disk Utilization
chart!
The user requested a disk
utilization graph type in the
Forecast Options dialog box and
"All disks" is selected.
Deselect All disks and select the
individual disk types.
You have to select an item in
both list boxes in order to
move it!
From the Fill Patterns or Point
Patterns tabs in the Graph
Options dialog box, the user
clicked the >> << button to
exchange items between the two
lists, but only one item (or no
items) was selected.
To exchange an item in the
Available list with an item in the
Disabled list, select both items,
then click the >> << button.
You have to select an item in
order to move it!
From the Fill Patterns or Point
Patterns tabs in the Graph
Options dialog box, the user
clicked the >> button or the <<
button to move a list item from
one list to the other, but no item
was selected.
To move an item from the
Available list to the Disabled list
(or vice versa), select the item,
then click the >> (or <<) button.
You should add a CPU
before dropping disk
center(s)!
The user attempted to drag-anddrop or paste disks and no CPU
is set.
Select a CPU before adding
disks.
You should select a CPU
type!
The user attempted to close the
CPU dialog and no CPU type is
selected.
Select a CPU type or click
Cancel.
You should select the disk
type!
The user attempted to close the
CPU dialog and no disk type is
selected.
Select a disk type or click
Cancel.
You should validate the
model first to be able to add
a workload!
The user attempted to add a
workload group to an unvalidated
model.
Validate the model before adding
a workload group.
151
B
FORECAST CAPACITY PLANNER USER’S GUIDE
Program Messages
Warning Messages
Message
Cause
Corrective Action
Invalid resource file!
The resource file is in the wrong
format.
File amy have been transferred
from host using ASCII rather than
binary method. Transfer the file
again using Binary transfer
method.
Trouble reading the tips file!
The tips.txt file cannot be found
or the program has not been
given the rights to access it.
Add the tips.txt file to the
Forecast program directory from
the original Forecast Capacity
Planner install disks or CD.
Warning. There is no
definition for forecast CPU
model...selection. This
selection will be ignored!
Forecast loads a model with a
CPU selection that is not found in
the resources file.
This occurs when the CPU in
question was deleted from the
resources, or when another
resource file was loaded after the
model was saved.
Error Messages
Message
Cause
Corrective Action
(calc_model) did not
converge!
An overflow occurs during a
model calculation because set
values are either too large or too
small.
Load another collection with
different values, or age the model
in smaller time increments, or set
smaller growth rates.
(calc_model) did not
converge!
The program is loading a
collection or model file and the
calibration model calculation
fails.
Load another collection with
different values, or age the model
in smaller time increments, or set
smaller growth rates.
Cannot process multiple disk
lines with multiple CPU
selections!
The user selected more than one
disk and more than one CPU in
the Forecast Options dialog,
then clicked the OK button.
Limit either the number of CPUs
or disks to one.
Cannot process multiple disk
lines with multiple workload
selections!
The user selected more than one
disk and more than one workload
group in the Forecast Options
dialog, then clicked the OK
button.
Limit either the number of disks
or the number of workload groups
to one.
152
....
PROGRAM MESSAGES
Error Messages
Message
Cause
Corrective Action
Cannot process multiple
workload lines with multiple
CPU selections!
The user selected more than one
workload group and more than
one CPU in the Forecast
Options dialog, then clicked the
OK button.
Limit either the number of
workload groups or the number of
CPUs to one.
Collection file does not
contain enough samples to
calibrate the workloads!
The program attempted to load a
collection file that contains very
little data.
Make another (larger) collection
file.
Could not evaluate
calibration model for
workload: insufficient
memory!
The program is loading a
collection or model file and the
calibration model calculation
fails.
Close all windows and
applications, restart the PC, then
restart the Forecast Capacity
Planner program.
Could not start print job.
The print job fails.
Check the system printing
configuration.
Failed to create empty
document!
The program attempted to create
a new system model. This is most
likely to occur when the program
is invoked by Microsoft® Internet
Explorer® or another application.
Close all windows and
applications, restart the PC, then
restart the Forecast Capacity
Planner program.
Failed to launch help!
The online Help system failed to
launch.
Add the Forecast.chm file to the
Forecast program directory from
the original Forecast Capacity
Planner install disks or CD.
Failed to open document!
The program failed to open a
collection or model file.
Check the file name.
File error reading collection
file!
The program attempted to load a
corrupt collection file. File
corruption can be due to disk
corruption or by performing an
ASCII file transfer instead of a
binary file transfer.
Delete the file and transfer the
file from the host system using
binary transfer format.
Insufficient memory to
continue!
The program attempted to load or
calculate a model and fails due to
insufficient memory.
Close all windows and
applications, restart the PC, then
restart the Forecast Capacity
Planner program.
153
B
FORECAST CAPACITY PLANNER USER’S GUIDE
Program Messages
Message
Cause
Corrective Action
Internal error calc_line_legends missing
legend!
The program attempted to
generate a forecast graph and
encountered an internal error.
Close all windows and
applications, restart the PC, then
restart the Forecast Capacity
Planner program.
Internal workload calibration
error of error% for xxx!
The program is loading a
collection or model file and the
calibration model calculation
fails.
Use a different collection file.
Invalid collection file!
The program attempted to load a
corrupt collection file. File
corruption can be due to disk
corruption or by performing an
ASCII file transfer instead of a
binary file transfer.
Delete the file and transfer the
file from the host system using
binary transfer format.
Invalid desktop file!
The program attempted to load a
corrupt desktop file.
Use another desktop file. Keep in
mind that Forecast Capacity
Planner cannot read Performance
Gallery™ desktop files.
No workloads have been
selected for forecast
information!
The program attempts to
generate a workload graph and
no workload groups are selected
in the Forecast Options dialog
box.
Select a workload group in the
Forecast Options dialog box.
There must be at least 3
workload groups by default.
OLE initialization failed.
Make sure that the OLE
libraries are the correct
version!
The OLE initialization failed
during program startup.
OLE libraries are missing or are
the wrong version. Reinstall OLE
from the original Forecast
Capacity Planner installation
disks or CD.
Resource utilization
discrepancy of error%!
The program is loading a
collection or model file and the
calibration model calculation
fails.
Use a different collection file.
The default resource file is
missing or there are not
enough rights to read it!
The program cannot read the
Resources.dat file that resides in
Forecast’s program directory.
Add the Resource.dat file to the
Forecast program directory from
the original Forecast Capacity
Planner install disks or CD. Or,
reset the rights to the existing
Resource.dat file.
154
....
PROGRAM MESSAGES
Error Messages
Message
Cause
Corrective Action
Unrecognized collection file
version!
The program attempts to load an
outdated collection file.
Load a current version of SOS
Performance Advisor™ on the
host machine and repeat the data
extraction process. You can
request a current version from
your account manager.
Validation discrepancy of
error% in calibration model
for workload group: xxx!
The program is loading a
collection or model file and the
calibration model calculation
fails.
Use a different collection file.
155
LIST OF FIGURES
Chapter 1
Introduction . . . . . . . . . . . . . . . . . . . . . . . . . . . . . . . . . . . . . . . . . . . . . . 1
Initial Forecast Capacity Planner screen . . . . . . . . . . . . . . . . . . . . . . . . . . . . . . . . . . . . . . . . . . . 1
Chapter 2
Product Overview. . . . . . . . . . . . . . . . . . . . . . . . . . . . . . . . . . . . . . . . . . 7
Chapter 3
Product Startup . . . . . . . . . . . . . . . . . . . . . . . . . . . . . . . . . . . . . . . . . . 11
Chapter 4
Data Collection, Extraction, and Export. . . . . . . . . . . . . . . . . . . . . . . 13
Workload definition file (example). . . . . . . . . . . . . . . . . . . . . . . . . . . . . . . . . . . . . . . . . . . . . . . . 17
SOSLOGX Main Option Menu . . . . . . . . . . . . . . . . . . . . . . . . . . . . . . . . . . . . . . . . . . . . . . . . . . 20
SOSLOGX Forecast Data Reduction Configuration Menu . . . . . . . . . . . . . . . . . . . . . . . . . . . . . 20
HP-UX sample workload definition file . . . . . . . . . . . . . . . . . . . . . . . . . . . . . . . . . . . . . . . . . . . . 23
SOSLOGD command line switches . . . . . . . . . . . . . . . . . . . . . . . . . . . . . . . . . . . . . . . . . . . . . . 25
Sample of user-defined configuration parameters (.soslogrc file) . . . . . . . . . . . . . . . . . . . . . . . 27
SOSLOGX Main Option Menu (HP-UX) . . . . . . . . . . . . . . . . . . . . . . . . . . . . . . . . . . . . . . . . . . . 28
SOSLOGX Forecast Data Reduction Configuration Menu (HP-UX) . . . . . . . . . . . . . . . . . . . . . 28
Chapter 5
Quick Tour for MPE/iX Systems . . . . . . . . . . . . . . . . . . . . . . . . . . . . . 31
Open dialog box (showing *.col files) . . . . . . . . . . . . . . . . . . . . . . . . . . . . . . . . . . . . . . . . . . . . . 32
Choose CPU dialog box . . . . . . . . . . . . . . . . . . . . . . . . . . . . . . . . . . . . . . . . . . . . . . . . . . . . . . . 32
Validation Messages dialog box . . . . . . . . . . . . . . . . . . . . . . . . . . . . . . . . . . . . . . . . . . . . . . . . . 33
Main Program window panes (unvalidated model) . . . . . . . . . . . . . . . . . . . . . . . . . . . . . . . . . . . 34
Forecast Options dialog box: Options tab. . . . . . . . . . . . . . . . . . . . . . . . . . . . . . . . . . . . . . . . . . 37
Forecast Options dialog box: Options tab with new settings . . . . . . . . . . . . . . . . . . . . . . . . . . . 38
Forecast Options dialog box: Rates tab . . . . . . . . . . . . . . . . . . . . . . . . . . . . . . . . . . . . . . . . . . . 38
Baseline graph for one CPU with zero growth rate. . . . . . . . . . . . . . . . . . . . . . . . . . . . . . . . . . . 39
Baseline graph for four CPUs with zero growth rate. . . . . . . . . . . . . . . . . . . . . . . . . . . . . . . . . . 40
Baseline graph for four CPUs with five-percent growth rate. . . . . . . . . . . . . . . . . . . . . . . . . . . . 41
Main Program window: global validated workloads pane . . . . . . . . . . . . . . . . . . . . . . . . . . . . . . 42
Forecast Options dialog box, Options tab. . . . . . . . . . . . . . . . . . . . . . . . . . . . . . . . . . . . . . . . . . 43
Graph showing utilization by workload group for one CPU . . . . . . . . . . . . . . . . . . . . . . . . . . . . 43
Edit Growth Rate (Individual Workload Group) dialog box . . . . . . . . . . . . . . . . . . . . . . . . . . . . . 44
157
FORECAST CAPACITY PLANNER USER’S GUIDE
List of Figures
Graph showing 5% individual growth for the CHICAGO workload group. . . . . . . . . . . . . . . . . . 45
Chapter 6
Quick Tour for HP-UX Systems. . . . . . . . . . . . . . . . . . . . . . . . . . . . . . 47
Open dialog box . . . . . . . . . . . . . . . . . . . . . . . . . . . . . . . . . . . . . . . . . . . . . . . . . . . . . . . . . . . . . 48
Choose CPU dialog box . . . . . . . . . . . . . . . . . . . . . . . . . . . . . . . . . . . . . . . . . . . . . . . . . . . . . . . 48
Validation Messages dialog box . . . . . . . . . . . . . . . . . . . . . . . . . . . . . . . . . . . . . . . . . . . . . . . . . 49
Main Program window . . . . . . . . . . . . . . . . . . . . . . . . . . . . . . . . . . . . . . . . . . . . . . . . . . . . . . . . 50
Forecast Options dialog box: Options tab. . . . . . . . . . . . . . . . . . . . . . . . . . . . . . . . . . . . . . . . . . 52
Forecast Options dialog box: Options tab with new settings . . . . . . . . . . . . . . . . . . . . . . . . . . . 53
Forecast Options dialog box: Rates tab . . . . . . . . . . . . . . . . . . . . . . . . . . . . . . . . . . . . . . . . . . . 53
Baseline graph for one CPU with zero growth rate. . . . . . . . . . . . . . . . . . . . . . . . . . . . . . . . . . . 54
Baseline graph for four CPUs with zero growth rate. . . . . . . . . . . . . . . . . . . . . . . . . . . . . . . . . . 56
Baseline graph for four CPUs with five-percent growth rate . . . . . . . . . . . . . . . . . . . . . . . . . . . . 57
Main Program window: global unvalidated workloads pane . . . . . . . . . . . . . . . . . . . . . . . . . . . . 58
Forecast Options dialog box, Options tab. . . . . . . . . . . . . . . . . . . . . . . . . . . . . . . . . . . . . . . . . . 59
Graph showing utilization by workload group for one CPU. . . . . . . . . . . . . . . . . . . . . . . . . . . . . 59
Chapter 7
Forecast Window Panes . . . . . . . . . . . . . . . . . . . . . . . . . . . . . . . . . . . 61
Main Program window (unvalidated model) . . . . . . . . . . . . . . . . . . . . . . . . . . . . . . . . . . . . . . . . 61
Main Program window: file manager. . . . . . . . . . . . . . . . . . . . . . . . . . . . . . . . . . . . . . . . . . . . . . 62
Main Program window: global unvalidated centers pane . . . . . . . . . . . . . . . . . . . . . . . . . . . . . . 63
Main Program window (validated model): global centers pane . . . . . . . . . . . . . . . . . . . . . . . . . 65
Main Program window (validated model): global workloads pane . . . . . . . . . . . . . . . . . . . . . . . 66
Chapter 8
Menus and Commands . . . . . . . . . . . . . . . . . . . . . . . . . . . . . . . . . . . . 67
Forecast Menu Bar (validated model). . . . . . . . . . . . . . . . . . . . . . . . . . . . . . . . . . . . . . . . . . . . . 67
File menu before and after loading a collection . . . . . . . . . . . . . . . . . . . . . . . . . . . . . . . . . . . . . 68
Open dialog box . . . . . . . . . . . . . . . . . . . . . . . . . . . . . . . . . . . . . . . . . . . . . . . . . . . . . . . . . . . . . 69
Choose CPU dialog box . . . . . . . . . . . . . . . . . . . . . . . . . . . . . . . . . . . . . . . . . . . . . . . . . . . . . . . 69
Validation Messages dialog box . . . . . . . . . . . . . . . . . . . . . . . . . . . . . . . . . . . . . . . . . . . . . . . . . 70
Delete model file dialog box . . . . . . . . . . . . . . . . . . . . . . . . . . . . . . . . . . . . . . . . . . . . . . . . . . . . 72
Edit menu . . . . . . . . . . . . . . . . . . . . . . . . . . . . . . . . . . . . . . . . . . . . . . . . . . . . . . . . . . . . . . . . . . 76
Options menu . . . . . . . . . . . . . . . . . . . . . . . . . . . . . . . . . . . . . . . . . . . . . . . . . . . . . . . . . . . . . . . 78
Font dialog box . . . . . . . . . . . . . . . . . . . . . . . . . . . . . . . . . . . . . . . . . . . . . . . . . . . . . . . . . . . . . . 79
View Options dialog box: General tab. . . . . . . . . . . . . . . . . . . . . . . . . . . . . . . . . . . . . . . . . . . . . 80
View Options dialog box: View Background tab . . . . . . . . . . . . . . . . . . . . . . . . . . . . . . . . . . . . . 82
158
....
LIST OF FIGURES
Forecast graph components . . . . . . . . . . . . . . . . . . . . . . . . . . . . . . . . . . . . . . . . . . . . . . . . . . . . 83
Graph Options dialog box: General tab . . . . . . . . . . . . . . . . . . . . . . . . . . . . . . . . . . . . . . . . . . . 84
Graph Options dialog box: Fonts tab . . . . . . . . . . . . . . . . . . . . . . . . . . . . . . . . . . . . . . . . . . . . . 85
Graph Options dialog box: Sizes tab . . . . . . . . . . . . . . . . . . . . . . . . . . . . . . . . . . . . . . . . . . . . . 86
Graph Options dialog box: Borders tab . . . . . . . . . . . . . . . . . . . . . . . . . . . . . . . . . . . . . . . . . . . 87
Graph Options dialog box: Aspect tab . . . . . . . . . . . . . . . . . . . . . . . . . . . . . . . . . . . . . . . . . . . . 88
Graph Options dialog box: Colors tab. . . . . . . . . . . . . . . . . . . . . . . . . . . . . . . . . . . . . . . . . . . . . 90
Graph Options dialog box: Chart Colors tab . . . . . . . . . . . . . . . . . . . . . . . . . . . . . . . . . . . . . . . . 91
Graph Options dialog box: Point Patterns tab . . . . . . . . . . . . . . . . . . . . . . . . . . . . . . . . . . . . . . 92
Graph Options dialog box: Fill Patterns tab . . . . . . . . . . . . . . . . . . . . . . . . . . . . . . . . . . . . . . . . 93
Resources dialog box: CPUs tab . . . . . . . . . . . . . . . . . . . . . . . . . . . . . . . . . . . . . . . . . . . . . . . . 94
CPU dialog box . . . . . . . . . . . . . . . . . . . . . . . . . . . . . . . . . . . . . . . . . . . . . . . . . . . . . . . . . . . . . . 95
Resources dialog box: Disks tab . . . . . . . . . . . . . . . . . . . . . . . . . . . . . . . . . . . . . . . . . . . . . . . . 97
Disk dialog box . . . . . . . . . . . . . . . . . . . . . . . . . . . . . . . . . . . . . . . . . . . . . . . . . . . . . . . . . . . . . . 97
Resources dialog box: Download options. . . . . . . . . . . . . . . . . . . . . . . . . . . . . . . . . . . . . . . . . . 99
Forecast menu . . . . . . . . . . . . . . . . . . . . . . . . . . . . . . . . . . . . . . . . . . . . . . . . . . . . . . . . . . . . . 101
Age Model dialog box . . . . . . . . . . . . . . . . . . . . . . . . . . . . . . . . . . . . . . . . . . . . . . . . . . . . . . . . 102
Model name dialog box. . . . . . . . . . . . . . . . . . . . . . . . . . . . . . . . . . . . . . . . . . . . . . . . . . . . . . . 103
Copy Graph to Clipboard As dialog box . . . . . . . . . . . . . . . . . . . . . . . . . . . . . . . . . . . . . . . . . . 104
View menu . . . . . . . . . . . . . . . . . . . . . . . . . . . . . . . . . . . . . . . . . . . . . . . . . . . . . . . . . . . . . . . . 105
Toolbar . . . . . . . . . . . . . . . . . . . . . . . . . . . . . . . . . . . . . . . . . . . . . . . . . . . . . . . . . . . . . . . . . . . 105
Toolbar window. . . . . . . . . . . . . . . . . . . . . . . . . . . . . . . . . . . . . . . . . . . . . . . . . . . . . . . . . . . . . 105
Format Bar . . . . . . . . . . . . . . . . . . . . . . . . . . . . . . . . . . . . . . . . . . . . . . . . . . . . . . . . . . . . . . . . 106
Main Status Bar . . . . . . . . . . . . . . . . . . . . . . . . . . . . . . . . . . . . . . . . . . . . . . . . . . . . . . . . . . . . 107
Child Status Bar . . . . . . . . . . . . . . . . . . . . . . . . . . . . . . . . . . . . . . . . . . . . . . . . . . . . . . . . . . . . 107
Window menu . . . . . . . . . . . . . . . . . . . . . . . . . . . . . . . . . . . . . . . . . . . . . . . . . . . . . . . . . . . . . . 107
Help menu . . . . . . . . . . . . . . . . . . . . . . . . . . . . . . . . . . . . . . . . . . . . . . . . . . . . . . . . . . . . . . . . 108
Tip of the Day dialog box . . . . . . . . . . . . . . . . . . . . . . . . . . . . . . . . . . . . . . . . . . . . . . . . . . . . . 109
Shortcut menu . . . . . . . . . . . . . . . . . . . . . . . . . . . . . . . . . . . . . . . . . . . . . . . . . . . . . . . . . . . . . 111
Chapter 9
Model Creation and Validation . . . . . . . . . . . . . . . . . . . . . . . . . . . . . 113
Thresholds dialog box: Forecast tab. . . . . . . . . . . . . . . . . . . . . . . . . . . . . . . . . . . . . . . . . . . . . 114
Thresholds dialog box: Validation tab . . . . . . . . . . . . . . . . . . . . . . . . . . . . . . . . . . . . . . . . . . . . 115
Open dialog box . . . . . . . . . . . . . . . . . . . . . . . . . . . . . . . . . . . . . . . . . . . . . . . . . . . . . . . . . . . . 116
Validation Messages dialog box . . . . . . . . . . . . . . . . . . . . . . . . . . . . . . . . . . . . . . . . . . . . . . . . 117
159
FORECAST CAPACITY PLANNER USER’S GUIDE
List of Figures
Edit Workload dialog box . . . . . . . . . . . . . . . . . . . . . . . . . . . . . . . . . . . . . . . . . . . . . . . . . . . . . 122
Disk Edit dialog box . . . . . . . . . . . . . . . . . . . . . . . . . . . . . . . . . . . . . . . . . . . . . . . . . . . . . . . . . 126
CPU Edit dialog box . . . . . . . . . . . . . . . . . . . . . . . . . . . . . . . . . . . . . . . . . . . . . . . . . . . . . . . . . 126
Chapter 10
Model Forecasting . . . . . . . . . . . . . . . . . . . . . . . . . . . . . . . . . . . . . . . 129
Forecast Options dialog box: Options tab. . . . . . . . . . . . . . . . . . . . . . . . . . . . . . . . . . . . . . . . . 130
Forecast Options dialog box: Rates tab . . . . . . . . . . . . . . . . . . . . . . . . . . . . . . . . . . . . . . . . . . 133
Age Model dialog box . . . . . . . . . . . . . . . . . . . . . . . . . . . . . . . . . . . . . . . . . . . . . . . . . . . . . . . . 134
Report Options dialog box: Page Setup tab . . . . . . . . . . . . . . . . . . . . . . . . . . . . . . . . . . . . . . . 135
Report Options dialog box: Margins Setup tab . . . . . . . . . . . . . . . . . . . . . . . . . . . . . . . . . . . . . 136
160
LIST OF TABLES
Chapter 1
Introduction . . . . . . . . . . . . . . . . . . . . . . . . . . . . . . . . . . . . . . . . . . . . . . 1
Chapter 2
Product Overview. . . . . . . . . . . . . . . . . . . . . . . . . . . . . . . . . . . . . . . . . . 7
Chapter 3
Product Startup . . . . . . . . . . . . . . . . . . . . . . . . . . . . . . . . . . . . . . . . . . 11
Chapter 4
Data Collection, Extraction, and Export. . . . . . . . . . . . . . . . . . . . . . . 13
SOSLOGX Forecast Analysis prompts . . . . . . . . . . . . . . . . . . . . . . . . . . . . . . . . . . . . . . . . . . . . 21
SOSLOGD command line switch functions . . . . . . . . . . . . . . . . . . . . . . . . . . . . . . . . . . . . . . . . 25
SOSLOGD default configuration parameters . . . . . . . . . . . . . . . . . . . . . . . . . . . . . . . . . . . . . . . 26
SOSLOGD advanced configuration parameters. . . . . . . . . . . . . . . . . . . . . . . . . . . . . . . . . . . . . 26
Forecast prompts . . . . . . . . . . . . . . . . . . . . . . . . . . . . . . . . . . . . . . . . . . . . . . . . . . . . . . . . . . . . 29
Chapter 5
Quick Tour for MPE/iX Systems . . . . . . . . . . . . . . . . . . . . . . . . . . . . . 31
Chapter 6
Quick Tour for HP-UX Systems . . . . . . . . . . . . . . . . . . . . . . . . . . . . . 47
Acceptable resource validation thresholds . . . . . . . . . . . . . . . . . . . . . . . . . . . . . . . . . . . . . . . . . 51
Suggested Font parameters . . . . . . . . . . . . . . . . . . . . . . . . . . . . . . . . . . . . . . . . . . . . . . . . . . . . 54
Suggested Size parameters . . . . . . . . . . . . . . . . . . . . . . . . . . . . . . . . . . . . . . . . . . . . . . . . . . . . 55
Chapter 7
Forecast Window Panes . . . . . . . . . . . . . . . . . . . . . . . . . . . . . . . . . . . 61
Chapter 8
Menus and Commands . . . . . . . . . . . . . . . . . . . . . . . . . . . . . . . . . . . . 67
Example validation messages . . . . . . . . . . . . . . . . . . . . . . . . . . . . . . . . . . . . . . . . . . . . . . . . . . 70
General View options . . . . . . . . . . . . . . . . . . . . . . . . . . . . . . . . . . . . . . . . . . . . . . . . . . . . . . . . . 81
General Graph options . . . . . . . . . . . . . . . . . . . . . . . . . . . . . . . . . . . . . . . . . . . . . . . . . . . . . . . . 84
Fonts options . . . . . . . . . . . . . . . . . . . . . . . . . . . . . . . . . . . . . . . . . . . . . . . . . . . . . . . . . . . . . . . 86
Sizes options . . . . . . . . . . . . . . . . . . . . . . . . . . . . . . . . . . . . . . . . . . . . . . . . . . . . . . . . . . . . . . . 87
Borders options. . . . . . . . . . . . . . . . . . . . . . . . . . . . . . . . . . . . . . . . . . . . . . . . . . . . . . . . . . . . . . 88
Aspect options . . . . . . . . . . . . . . . . . . . . . . . . . . . . . . . . . . . . . . . . . . . . . . . . . . . . . . . . . . . . . . 89
Chart Colors options . . . . . . . . . . . . . . . . . . . . . . . . . . . . . . . . . . . . . . . . . . . . . . . . . . . . . . . . . . 91
161
FORECAST CAPACITY PLANNER USER’S GUIDE
List of Tables
Resources.dat file download options . . . . . . . . . . . . . . . . . . . . . . . . . . . . . . . . . . . . . . . . . . . . . 99
Chapter 9
Model Creation and Validation . . . . . . . . . . . . . . . . . . . . . . . . . . . . . 113
Validation thresholds. . . . . . . . . . . . . . . . . . . . . . . . . . . . . . . . . . . . . . . . . . . . . . . . . . . . . . . . . 115
Example validation messages . . . . . . . . . . . . . . . . . . . . . . . . . . . . . . . . . . . . . . . . . . . . . . . . . 117
Edit Workload parameters . . . . . . . . . . . . . . . . . . . . . . . . . . . . . . . . . . . . . . . . . . . . . . . . . . . . 123
Disk Edit parameters. . . . . . . . . . . . . . . . . . . . . . . . . . . . . . . . . . . . . . . . . . . . . . . . . . . . . . . . . 126
CPU parameters . . . . . . . . . . . . . . . . . . . . . . . . . . . . . . . . . . . . . . . . . . . . . . . . . . . . . . . . . . . . 127
Chapter 10
Model Forecasting . . . . . . . . . . . . . . . . . . . . . . . . . . . . . . . . . . . . . . . 129
Forecast options . . . . . . . . . . . . . . . . . . . . . . . . . . . . . . . . . . . . . . . . . . . . . . . . . . . . . . . . . . . . 130
Rates options . . . . . . . . . . . . . . . . . . . . . . . . . . . . . . . . . . . . . . . . . . . . . . . . . . . . . . . . . . . . . . 133
Appendix A
Keyboard Commands . . . . . . . . . . . . . . . . . . . . . . . . . . . . . . . . . . . . 139
Appendix B
Program Messages . . . . . . . . . . . . . . . . . . . . . . . . . . . . . . . . . . . . . . 147
162
....
INDEX
INDEX
Symbols
paste selected text or data 77
redo last operation (cancel last undo) 77
*.col files 7
undo last operation 77
*.dat files 8
File menu
*.dsk 8
close all active windows 71
*.dsk (Forecast Desktop) 8
*.mdl 7
create a new model 68
delete a collection file from memory 72
delete a desktop from memory 73
A
delete a model from memory 72
Aging a model 102,
134
Algorithms 118– 120
Alternate key commands 139– 145
delete a resource file from memory 73
exit the application 76
load a desktop file 75
load a new resource file 75
load and validate a model 69– 71,
C
116
open a recently-accessed file 76
Centers 8
Child status bar 107
Collecting HP-UX performance data 25
Collecting MPE performance data 18
Collections 7
Commands
Edit menu
add a disk drive 127
add a workload 125
copy selected text or data 77
cut selected text or data 77
delete a disk drive 128
delete a workload 125
edit a CPU 126– 127
edit a disk drive 126
edit a workload 122– 124
insert a disk drive 127
insert a workload 125
preview a print job 74,
137
print a forecast report 137
print a graph 74
print a model 74
print setup 73,
136
print the active resource file 75
print the screen 74
print validation notes 74,
118
reload a desktop file 128
re-save a model as... 71
restore the desktop settings 76,
128
save a model 71
save active resource file 75
save active resource file as... 75
save the active desktop 76,
128
send the active model via e-mail 75
Forecast menu
aging a model 102,
134
closing a forecast graph 101
163
FORECAST CAPACITY PLANNER USER’S GUIDE
Index
copying a model or item 103
Windows menu
exporting a forecast graph 104
arrange icons 108
exporting a forecast report 137
bring any open window to the front 108
generating a forecast graph 101
bring next open window to front 108
naming a forecast graph 103
bring previous open window to front 108
validate an unvalidated model 104
cascade open windows 107
Help menu
tile open windows horizontally 107
open Tip of the Day dialog 109
view copyright and version information 110
tile open windows vertically 108
Components 7
view indexed help topics 110
center 8
Options menu
collection 7
change titles 100
desktop 8
enable/disable custom backgrounds 82
model 7
enable/disable monochrome display 85
resource 8
enable/disable sound (alerts) 81
enable/disable the toolbar tips 81
workloads 8
CPU resources 126,
132
enable/disable tile tips 81
prompt for all disks 100
D
prompt for titles 100
select report fonts 79,
134
select the data text color 81
select the label text color 81
identifying system resources 13– 14
Data collection (HP-UX) 26
set forecast thresholds 113– 114
collecting performance data 25
set validation thresholds 114– 116
command line switches 25
specify footer font 86
creating an HP-UX workload definition file 22– 24
specify header font 86
creating the SOSLOGX reduction file 29
specify label font 86
exporting performance data 30
specify legend font 86
extracting data 27– 30
specify size of first data point 85
running SOSLOGX 27
specify size of subsequent data points 85
soslogd 25
specify thickness of first line 84
soslogd -h 25
specify thickness of subsequent lines 84
View menu
164
Data collection
Data collection (MPE)
changing the sampling interval length 19
show/hide the child status bar 107
creating an MPE workload definition file 15– 18
show/hide the format bar 106
exporting MPE data 22
show/hide the main status bar 107
extracting data 19– 22
show/hide the toolbar 105
reducing data 21– 22
streaming the collector job
Forecast options 130– 132
with SOS/3000 18
adjusting the results 131
without SOS/3000 18
selecting a growth option 132
Desktop Files
selecting CPU(s) 132
*.dsk (Forecast Desktop) 8
selecting disk(s) 132
Desktops 8
selecting workload(s) 131
reloading a saved desktop 128
specifying the graph type 131
restoring the desktop to last saved version 128
specifying the growth type 131
saving the active desktop 128
specifying the period type 131
Disk I/O 124
Disk resources 126,
....
INDEX
specifying the start month 130
127,
128,
132
specifying the start year 131
specifying the time period 130
Format bar 106
E
Function key commands 139– 145
Error messages 152– 155
Exit instructions 12
Exporting HP-UX performance data 30
G
Exporting MPE performance data 22
Graph options 83– 93
Extracting HP-UX performance data 27
Graph types 131
Extracting MPE performance data 19
Growth options 132
Growth rate 123
Growth rates 133
F
Growth types 131
File Formats
*.col 7
H
*.dat 8
Help
*.dsk 8
accessing online context-sensitive Help 11
*.dsk (Forecast Desktop) 8
Help Menu
*.mdl 7
Context Sensitive help 110
Fonts
Topics 109
for graphs 85– 86
for reports 79,
134
Forecast Capacity Planner
L
product documentation
conventions 5
LDEV specifications 16– 17
online help system 6
Load calibration 116
user’s guide 5
Lund Performance Solutions
Forecast growth rates 133
certified trainers 5
165
FORECAST CAPACITY PLANNER USER’S GUIDE
Index
documentation team 5
loading a new model 116– 118
IT consultants 5
setting validation thresholds 113– 116
main offices
validating a new model 118
e-mail addresses 3
fax number 3
O
Internet URL 3
postal address 3
Online help
Tip of the Day 12
telephone number 3
sales team 4
technical support team 4
P
Lund Training Institute 5
Program messages 147– 155
confirmation messages 147– 148
M
error messages 152– 155
information messages 148– 151
Main Program window (unvalidated model)
warning messages 152
file manager pane 34
global unvalidated centers pane 34
Program specifications 16
global unvalidated workloads pane 35
Main status bar 107
Q
Menus
Edit menu 76– 78
File menu 67– 76
Forecast menu 101– 104
Help menu 108– 110
Queue length 115
Queuing model algorithm assumptions 118– 120
Quick Tour tutorial for HP-UX 47– 60
Quick Tour tutorial for MPE 31– 45
Options menu 78– 100
Shortcut menu 111
View menu 105– 107
Windows menu 107– 108
Messages
confirmation messages 147– 148
error messages 152– 155
information messages 148– 151
warning messages 152
Models 7
aging a model 134
changing the model 121– 128
configuring a model 129– 133
166
R
Report fonts 79
Report options 82,
135,
135– 137
Resource options 94– 100
Resources 8
CPUs
editing CPU information 126
disk drives
adding a disk drive to a model 127
deleting a disk drive from a model 128
editing disk drive information 126
inserting a disk drive into a model 127
identifying 13– 14
....
INDEX
Two-key commands 139– 145
validation thresholds 35
Response time 115,
124
U
S
Uninstalling 12
SOS/3000 Performance Advisor 18
Utilization 115,
User specifications 16
123
soslogd file 25
soslogd -h 25
V
soslogrc 26
soslogrc file 26
Validation failures 118
SOSLOGX Historical Data Collector
Validation messages 117– 118
running SOSLOGX 19
Validation thresholds 35,
114– 116
load calibration 116
SOSLOGX Historical Data Collector (MPE)
creating the SOSLOGX reduction file (MPE) 21–
22
queue length 115
evaluating the SOSLOGX reduction file (MPE) 22
session workload type 116
exiting SOSLOGX (MPE) 22
throughput 115
response time 115
soswkdef file 16
utilization 115
Startup instructions 11
System requirements
workload calibration 116
View options 80– 82
hardware 2
software 2
W
Wildcard specifications (MPE) 16
T
Workload Groups 8
Technical support
identifying and characterizing workload groups
14– 15
by e-mail 4
Workload Groups (HP-UX)
by phone 4
default workload groups
in emergency 4
ATTACH 24
Think time 123
Thresholds 100,
113– 116
forecast thresholds 113
validation thresholds 114
Throughput 115,
124
SYS 24
user defined workload groups 22
workload definition file 23
Workload Groups (MPE)
Toolbar 105
creating a definition file 18
buttons
help 11,
DETACH 24
110
default workload groups
167
FORECAST CAPACITY PLANNER USER’S GUIDE
Index
JOB 15,
16
SESSION 15,
CM percentage 124
16
SYSPROCS 15,
CPU time per transaction 123
16
growth rate 123
setting MPE wildcards 16
priority 123
setting program specifications 16
start months 124
setting user specifications 16
throughput 124
Workloads
users 123
adding a workload 125
workload class 123
choosing session workload type 116
workload description 123
choosing transaction workload type 116
workload name 123
deleting a workload 125
inserting a workload 125
editing a workload 122– 124
setting the workload calibration threshold 116
accept response time 124
actual response time 124
actual throughput 124
average delay time 124
average think time 123
168
disk I/O per transaction 124
setting logical device specifications 16– 17
troubleshooting validation failures 120– 121
Workloads (HP-UX)
creating a definition file 22– 24
Workloads (MPE)
creating a definition file 15