1
NETWORK POWER MONITOR R8 / NPM-R8
Innovative Electronics for a Changing World
INDEX
1. SYSTEM DESCRIPTION
2. BOARD CONNECTIONS terminals and indicators
3. CONNECTION DIAGRAM
4. START UP GUIDE and passwords
5. HOME PAGE
6. STATUS PAGE
7. RELAY CONTROL PAGE
8. NETWORK CONFIGURATION PAGE – (DHCP)
9. SNMP CONFIGURATION PAGE – (SNMP)
10. TFTP Boot-loader – firmware upgrade via Ethernet
MODELS :
12-24Vdc / 30Amp
12-48Vdc / 30Amp
12-24Vdc / 100Amp
12-48Vdc /100Amp
SNMP+DHCP
MDI/MDIX
NETWORK POWER MONITOR R8 / NPM-R8
SNMP+DHCP
MDI/MDIX
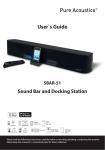
1 SYSTEM DESCRIPTION
Main Board
Relay Board
The NPM-R8 (NETWORK POWER MONITOR R8) was designed to assist Network and Wireless
Network specialists with Power related information via Ethernet Communication.
Battery Voltage, Charging Current, Mains 220Vac Status, 2x External dc input voltages,
Alarm input and temperature information is available.
Embedded Web pages for monitoring and configuration of the system.
The unit supports the SNMP V1 and SNMP V2C communication platform to be compatible
with MIB Browsers (SNMP monitoring software platforms). Unit supports DHCP.
SNMP+DHCP
MDI/MDIX
NETWORK POWER MONITOR R8 / NPM-R8
NPM
The Ethernet port supports MDI/MDIX auto select for straight and crossover cables
The NPM-R8
R8 is powered by C language firmware and the code was written to function as a
co-operative RTOS.(Real time operating system)
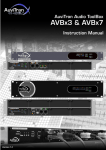
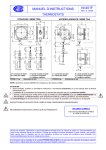
2 BOARD CONNECTIONS
Factory Reset jumper J9
Run Led
To Relay Board
Mains Indicator
2x External DC
220Vac fuse
volt input 60Vmax
External Temp
sensor
sensor/can
be
extended with 3
wires
LAN
220Vac in
N/C Alarm input
Battery Input
Charge Loop
Relay Board connector pin 1 marked with
Factory Reset jumper next to relay board connector – J9 – insert jumper –
power up and wait until green led top left corner of Main board flash onces.
External Temperature sensor can be extended with 2 wires (10K NTC
Thermistor)
Alarm input – potential free contact only.
NETWORK POWER MONITOR R8 / NPM-R8
SNMP+DHCP
MDI/MDIX
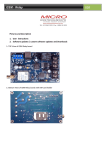
3 CONNECTION DIAGRAM
V1 and V2 External Vdc inputs can be used to monitor eg. DC-DC converters.
Also note that the V1 and V2 external power input GND terminal is common
with the GND of the system.
Use only one Battery voltage input at a time,12-24V or 48V never both
Depending on the model used, connect 12 to 24 v Dc systems only to the first
terminal marked 12/24 and for 48Vdc systems only to the 48 terminal.
Battery Input terminal 12/24 and 48v protected by TVS diode and electronic
fuse for surge voltages.
External V1 and V2 inputs protected by TVS diode for spikes and surge
voltages.
NETWORK POWER MONITOR R8 / NPM-R8
SNMP+DHCP
MDI/MDIX
DO NOT CONNECT IN THIS WAY !
The centre tap with blue line in drawing becomes a OV terminal with a +12V on the one side of the
battery pack and a – 12V on the other side. (the unit can tolerate minus voltages below Ground and
damage to the unit will occur)
NETWORK POWER MONITOR R8 / NPM-R8
SNMP+DHCP
MDI/MDIX
4 START UP
By default the unit is shipped with DHCP enabled with a default IP address of
192.168.1.2
Micro Instruments Network Power Monitor R8 will be display where after the
current TCPIP stack version will be displayed.
192.168.1.2 will appear on the LCD as the default IP address , if the board is
connected to a DHCP enabled network host the address should change as soon
as the DHCP address is received from the host and will be re displayed as the
new IP address.
Connect to the IP address via a web browser (Tested Google Chrome and
Internet Explorer) to access the web pages.
To Factory reset the unit, install the jumper provided over J9 next to the relay
board 10way connector, power the unit, Display will show model number etc
and then go blank, notice the run led close to the jumper J9 will give one flash
as soon as the board is restored to factory settings. Cycle the power to the
board to initiate a restart.
The MIB file for the NPM-R8 can be downloaded from
www.microinstruments.co.za
The MIB file can be imported to an SNMP monitoring program to
help identify the OID’s received from the NPM-R8.
Micro Instruments registered private enterprise number (PEN)
45501
To login to the Relay control page , Network settings or SNMP
configuration pages the following must be used.
admin
microi
NETWORK POWER MONITOR R8 / NPM-R8
SNMP+DHCP
MDI/MDIX
5 HOME PAGE
The Stack version is displayed, the build date of the firmware programmed on
to the device, the units serial number as well as the model number.
A visual indication of the status of Relays 5 to 1 is given and indicated by a
green dot if the relay is active (powered)
A “module heartbeat” indication by a green dot flashes once per second as the
software runs through the TCPIP applications.
Only inputs 1 and 2 is functional, and indicated by a ^ for inactive and V for
active, inputs 3 and 4 is for future expansion.
Rapid Battery voltage measurements is displayed for quick information
regarding battery voltage.
Left hand menu will navigate to different applications on the unit.
NETWORK POWER MONITOR R8 / NPM-R8
SNMP+DHCP
MDI/MDIX
6 STATUS PAGE
Manufacturing date and serial number is displayed.
External temperature sensor is displayed in degrees Celsius.
External Voltage input V1 and V2 is displayed as 0 to 60Vdc
A reflection of the module’s LCD display is captured and displayed on this page
Battery voltage , charge current , Mains status on or off and the on board
temperature sensor .
NETWORK POWER MONITOR R8 / NPM-R8
SNMP+DHCP
MDI/MDIX
7 RELAY CONTROL PAGE
Admin and microi gains access
Relay 5 and 4 can be controlled to the on/off status and will keep their
positions, Relay 3 to 1 can only be toggled for 10 second periods and is
typically used to reset radios or routers without logging yourself out
completely from the remote site after a relay was accidently switched , relay 3
to 1 will return automatically after 10 seconds to the off position (relay not
powered)
NETWORK POWER MONITOR R8 / NPM-R8
SNMP+DHCP
MDI/MDIX
8 NETWORK CONFIGURATION PAGE
Admin and microi gains access
MAC address is displayed and cannot be changed
DHCP enable or disable function will grey out IP settings if active or give user
rights to change settings if DHCP is disabled.
Setup IP address, Gateway and Subnet Mask
Primary DNS and Secondary DNS is not functional and is reserved for future
use.
NETWORK POWER MONITOR R8 / NPM-R8
SNMP+DHCP
MDI/MDIX
Save Config
After the configuration was saved the “ Reboot in Progress” page will load
The unit will reboot and configure and should be live in maximum 5 seconds
Information on how to clear Browser cache is also given
NETWORK POWER MONITOR R8 / NPM-R8
9
SNMP+DHCP
MDI/MDIX
SNMP Configuration
Admin and microi gains access.
Configure read and write communities
Write communities is functional on the device via SNMP SET and GET functions
but is beyond the scope of this user manual as the relay’s can also be
controlled via the relay control page.
NETWORK POWER MONITOR R8 / NPM-R8
SNMP screenshot from “the dude” freeware SNMP manager
SNMP V2c /SNMP walk screenshot
SNMP+DHCP
MDI/MDIX
NETWORK POWER MONITOR R8 / NPM-R8
OID table / number of services = 10
45501.1.3.1.0 = Relay 4 status (integer) 0 off / 1 on
45501.1.3.2.0 = Relay 5 status (integer) 0 off/1 on
45501.1.3.3.0 =Mains status (integer) 0 off / 1 on
45501.1.3.4.0 = Battery voltage (octet string)
45501.1.3.5.0 = Charge current (octet string)
45501.1.3.6.0 = External Temperature sensor (octet string)
45501.1.3.7.0 = External DC Volts V1 (octet string)
45501.1.3.8.0 = External DC Volts V2 (octet string)
45501.1.3.9.0 = Alarm status (integer) 0 off/ 1 on or active
45501.1.3.10.0 = LCD display text string (octet string)
SNMP+DHCP
MDI/MDIX
NETWORK POWER MONITOR R8 / NPM-R8
SNMP+DHCP
MDI/MDIX
To add a device to the Dude and add all settings
In the top screen Click on + and click on device to add a device, enter the
device IP and click next and finish , right click on the device icon, select
appearance in the drop down menu, double click in the Label: window and
copy and paste the code below to the label window.
[Device.Name]
[device_performance()][Device.ServicesDown]
**copy it in below the above text that appears automatically***
MAINS:[oid("1.3.6.1.4.1.45501.1.3.3.0")]
BATT:[oid("1.3.6.1.4.1.45501.1.3.4.0")]
Charge:[oid("1.3.6.1.4.1.45501.1.3.5.0")]
Relay4:[oid("1.3.6.1.4.1.45501.1.3.1.0")]
Relay5:[oid("1.3.6.1.4.1.45501.1.3.2.0")]
Temp:[oid("1.3.6.1.4.1.45501.1.3.6.0")]
EXTV1:[oid("1.3.6.1.4.1.45501.1.3.7.0")]
EXTV2:[oid("1.3.6.1.4.1.45501.1.3.8.0")]
Alarm:[oid("1.3.6.1.4.1.45501.1.3.9.0")]
Select label refresh value to 5 or 10sec
Click on arrow next to up (green) partially down(orange) and down(Red) to
display colours
Click apply and OK
Right click the new created icon again and select settings
Give a Name to the unit that makes sense to the user and select
SNMP profile as V2 public
NETWORK POWER MONITOR R8 / NPM-R8
SNMP+DHCP
MDI/MDIX
Go to polling and select your probe interval and Probe timeout time
Click on apply
Under services click the + sign
Under Probe: select ping and apply and ok
At this time the Icon for the device should be Green and indicating all
values.
Add a probe and function to the dude for Mains failure
To be notified by the Dude for a change in mains status or alarm add a function and a
probe
In the right hand side navigation window of the Dude double click Functions
Click the + sign to add a function
Type the Name as NPM_Mains
Copy and paste the text below as above (note the OID is the Mains OID)
oid("1.3.6.1.4.1.45501.1.3.3.0")
Click apply and ok
In the right hand side navigation window of the Dude double click Probes
Click the + sign to add a Probe
Under Probes create a new probe:
NETWORK POWER MONITOR R8 / NPM-R8
SNMP+DHCP
MDI/MDIX
Type the name exactly as the function created earlier - : NPM_Mains
Change Type to : Function
Agent: default
Copy and paste the text below one by one and insert
Available:
NPM_Mains()
Error:
if(NPM_Mains()=1, "", "Mians OFF")
Value:
NPM_Mains()
Leave Unit blank
Rate:
minute
Click Apply and ok
Right click the device icon on the monitoring screen and select “ Settings”
Go To services
Click the + sign to add a service
Under Probe: select -
NPM_Mains
Select the probe interval and probe timeout time and set the Probe down count to 1
Click apply and ok to exit
At this time switching the Mains power off to the unit will result in the monitoring Icon in the Dude
to turn Orange and indicate at the top of the icon that it is a Mains failure that occurred.
NETWORK POWER MONITOR R8 / NPM-R8
SNMP+DHCP
MDI/MDIX
Add a probe and function to the dude for ALARM failure
To be notified by the Dude for a change in alarm status add a function and a probe
In the right hand side navigation window of the Dude double click Functions
Click the + sign to add a function
Type the Name as NPM_Alarm
Copy and paste the text below as above (note the OID is the ALARM OID)
oid("1.3.6.1.4.1.45501.1.3.9.0")
Click apply and ok
In the right hand side navigation window of the Dude double click Probes
Click the + sign to add a Probe
Under Probes create a new probe:
NETWORK POWER MONITOR R8 / NPM-R8
SNMP+DHCP
MDI/MDIX
Type the name exactly as the function created earlier - : NPM_Alarm
Change Type to : Function
Agent: default
Copy and paste the text below one by one and insert
Available:
NPM_Alarm()
Error:
if(NPM_Alarm()=0 , "", "Alarm OFF")
Value:
NPM_Alarm()
Leave Unit blank
Rate:
minute
Click Apply and ok
Right click the device icon on the monitoring screen and select “ Settings”
Go To services
Click the + sign to add a service
Under Probe: select -
NPM_Alarm
Select the probe interval and probe timeout time and set the Probe down count to 1
Click apply and ok to exit
At this time Activating the Alarm input to the unit will result in the monitoring Icon in the Dude to
turn Orange and indicate at the top of the icon that it is a active Alarm that occurred.
NETWORK POWER MONITOR R8 / NPM-R8
SNMP+DHCP
MDI/MDIX
Add a probe and function to the dude for low Battery Voltage
To be notified by the Dude for a change in low Battery status add a function and a probe
In the right hand side navigation window of the Dude double click Functions
Click the + sign to add a function
Type the Name as NPM_Volts
Copy and paste the text below as above (note the OID is the Battery voltage OID)
oid("1.3.6.1.4.1.45501.1.3.4.0")
Click apply and ok
In the right hand side navigation window of the Dude double click Probes
Click the + sign to add a Probe
Under Probes create a new probe:
NETWORK POWER MONITOR R8 / NPM-R8
SNMP+DHCP
MDI/MDIX
Type the name exactly as the function created earlier - : NPM_Volts
Change Type to : Function
Agent: default
Copy and paste the text below one by one and insert
Available:
NPM_Volts()
Error:
if(NPM_Volts() > 11.5, "", "BATT LOW")
YOU can change your battery low level in decimal , currently at 11.5V
Value:
NPM_Volts()
Leave Unit blank
Rate:
minute
Click Apply and ok
Right click the device icon on the monitoring screen and select “ Settings”
Go To services
Click the + sign to add a service
Under Probe: select -
NPM_Volts
Select the probe interval and probe timeout time and set the Probe down count to 1
Click apply and ok to exit / At this time lowering the Battery input voltage to the unit will result in
the monitoring Icon in the Dude to turn Orange and indicate at the top of the icon that it is a low
battery condition.
NETWORK POWER MONITOR R8 / NPM-R8
Add a probe and function to the dude for Charge Current
To be able to Graph the charge current
In the right hand side navigation window of the Dude double click Functions
Click the + sign to add a function
Type the Name as NPM_Charge
Copy and paste the text below as above (note the OID is the Charge current OID)
oid("1.3.6.1.4.1.45501.1.3.5.0")
Click apply and ok
In the right hand side navigation window of the Dude double click Probes
Click the + sign to add a Probe
Under Probes create a new probe:
SNMP+DHCP
MDI/MDIX
NETWORK POWER MONITOR R8 / NPM-R8
SNMP+DHCP
MDI/MDIX
Type the name exactly as the function created earlier - : NPM_Amps
Change Type to : Function
Agent: default
Copy and paste the text below one by one and insert
Available:
NPM_Amps()
Error:
if(NPM_Amps(), "", "")
Value:
NPM_Amps()
Leave Unit blank
Rate:
minute
Click Apply and ok
Right click the device icon on the monitoring screen and select “ Settings”
Go To services
Click the + sign to add a service
Under Probe: select -
NPM_Amps
Select the probe interval and probe timeout time and set the Probe down count to 1
Click apply and ok to exit / At this time we don’t have an alarm on charge current but no it will
Graph the charge data in your graph – it is possible to add a charge alarm - follow the low battery
voltage alarm setup for the Charge amps to do create an alarm.
NETWORK POWER MONITOR R8 / NPM-R8
Add a probe and function to the dude for Over Temperature
To be notified by the DUDE of a Over temperature alarm.
In the right hand side navigation window of the Dude double click Functions
Click the + sign to add a function
Type the Name as NPM_Temp
Copy and paste the text below as above (note the OID is the Temperature OID)
oid("1.3.6.1.4.1.45501.1.3.6.0")
In the right hand side navigation window of the Dude double click Probes
Click the + sign to add a Probe
Under Probes create a new probe:
SNMP+DHCP
MDI/MDIX
NETWORK POWER MONITOR R8 / NPM-R8
SNMP+DHCP
MDI/MDIX
Type the name exactly as the function created earlier - : NPM_Temp
Change Type to : Function
Agent: default
Copy and paste the text below one by one and insert
Available:
NPM_Temp()
Error:
if(NPM_Temp() < 40.0, "", "Over Temp")
CURRENTLY SET AT 40 deg C – you can change the value
Value:
NPM_Temp()*60 (ps! I had to *60 to get correct chart values however SNMP from
NPM-R8 is continuously correct in SNMP walk and monitor icon )
Leave Unit blank
Rate:
minute
Click Apply and ok
Right click the device icon on the monitoring screen and select “ Settings”
Go To services
Click the + sign to add a service
Under Probe: select -
NPM_Temp
Select the probe interval and probe timeout time and set the Probe down count to 1
Click apply and ok to exit / At this time the Icon will turn orange in case of a Over Temperature
situation.
NETWORK POWER MONITOR R8 / NPM-R8
SNMP+DHCP
MDI/MDIX
CREATE the Graphs in the DUDE
Right hand top left menu click on Charts
Click on the + sign to add a chart
Give the Chart a name that make sense to the user
Click on the + sign below to add services to the Dude
Select source in the window that have opened and select for instance the
NPM_Volts@ NPM as the source
Click on apply and ok
*** If you get a Error message “ Unknown type” then please close the window to return to
the previous window of Charts and Remove the Chart – you will be prompted with “Remove
this Chart . Yes or No” Click yes to remove it , then click on the undo button top left corner
of the dude screen to undo the Chart delete , you can now go back to the Chart and add the
required data sources for Graphing to it
********** This is a Dude problem with V 3.6 ************
After all chart data sources was added like NPM_Volts@NPM and NPM_Amps@NPM the
graphing of your voltage and charge current etc will start. You can add the temperature ,
mains status whatever you want to the graph
The scaling of the graphs might appear wrongly between a scale of 0 to 1 , after about
20min the graphing will be scaled between data received from unit.
NETWORK POWER MONITOR R8 / NPM-R8
SETTING UP EMAIL NOTIFICATIONS IN THE DUDE
Top left on screen click on SETTINGS
Add your Primary DNS address
Add your Primary SMTP address
Add your email address of this server
Click Apply and OK
Go to Notifications in the left tree menu
Select email by double click or add email if not present
In the email window add your To: email address and click test
If successful “ OK “ will appear in the bottom of the email window
Right click on the NPM icon on the local map(monitoring screen)
Go to services
Double click on the service you would like to receive an email from
Tick (enable) use notifications and select email in the list
Click apply
Also double check :
Right click NPM icon , go to settings , under Polling tab make sure use
notifications an email is selected
SNMP+DHCP
MDI/MDIX
NETWORK POWER MONITOR R8 / NPM-R8
SNMP+DHCP
MDI/MDIX
9. TFTP Boot-loader
Units shipped from 10 August 2015 supports the TFTP software
NPM-R8 supports TFTP Boot-loader for upgrading device software remotely
over a network.
The MAC address of the unit is hard coded into software for safety reasons
so first obtain a .hex file from us for the specific unit.
Send e-mail to info@microinstruments.co.za , state serial number of unit
(displayed on home page via web browser) and the type of unit
eg: NPM R8 , and the fault detected in software or why you need the
software modified.
We will then send you a .hex file with the appropriate MAC address to be
uploaded.
Simply download the Mi – TFTP file up-loader from our website
The Mi-TFTP file up-loader automatically insert the TFTP commands needed
to communicate with the target device and is transparent to the user
making it easier to use TFTP.
Run the program – Enter the device IP address, browse for the .hex file
location and click on “UPLOAD” – you will be notified upon successful data
transfer. The unit will re-program itself and re-boot with the new software
and changes.
Security has been added if the connection is lost while uploading to the unit
it will ignore the TFTP session.