1
OPERATING INSTRUCTIONS
UviLine 9100 | 9400
SPECTROPHOTOMETER
Gebrauchsanleitung ........................................................................................................ Seite 3 . 114
Wichtige Hinweise: Die Gebrauchsanleitung vor der ersten Inbetriebnahme sorgfältig lesen und beachten.
Aus Sicherheitsgründen bitte die Spektralphotometer UviLine 9100 und UviLine 9400 ausschließlich für die in
dieser Gebrauchsanleitung beschriebenen Zwecke einsetzen. Beachten Sie auch die Gebrauchsanleitungen
für die mitzuverwendenden Geräte. Alle in dieser Gebrauchsanleitung enthaltenen Angaben sind zum Zeitpunkt der Drucklegung gültig. Es können jedoch durch SI Analytics sowohl aus technischen oder kaufmännischen Gründen, als auch aus der Notwendigkeit heraus, gesetzliche Bestimmungen anderer Länder zu berücksichtigen, Ergänzungen an den Spektralphotometern UviLine 9100 und UviLine-9400 vorgenommen werden, ohne dass die beschriebenen Eigenschaften beeinflusst werden.
Operating Instructions ................................................................................................ Page 115 . 226
Important notes: Read and observe these operating instructions carefully before using the Spectral Photometers UviLine 9100 and UviLine 9400. For safety reasons the Spectral Photometers UviLine 9100 and
UviLine 9400 may only be used for the purpose described in these operating instructions. Please also observe the operating instructions for the units to be connected. All specifications in this instruction manual are
guidance values which are valid at the time of printing. However, for technical or commercial reasons or in
the necessity to comply with the statuary stipulations of various countries, SI Analytics may perform additions
to the Spectral Photometers UviLine 9100 and UviLine 9400 without changing the described properties.
TABLE OF CONTENT
1
PAGE
Remarks ............................................................................................................ 117
1.1
Informationen ................................................................................................................... 117
2
Warning and safety instructions ..................................................................... 118
3
General .............................................................................................................. 119
3.1
3.2
4
Overview ............................................................................................................ 120
4.1
4.2
4.3
4.4
5
5.1
5.2
6
Measurement principle ..................................................................................................... 157
Calculations ..................................................................................................................... 157
Method programming ....................................................................................................... 159
Method storing ................................................................................................................. 161
Method deletion ............................................................................................................... 161
Method selection .............................................................................................................. 163
Method application ........................................................................................................... 164
Printing results ................................................................................................................. 166
Method editing ................................................................................................................. 166
Spectrum mode................................................................................................. 167
9.1
9.2
9.3
9.4
9.5
9.6
9.7
10
General ............................................................................................................................ 154
Measurement ................................................................................................................... 155
Printing results ................................................................................................................. 156
Saving results .................................................................................................................. 156
Multi wavelengths mode .................................................................................. 157
8.1
8.2
8.3
8.4
8.5
8.6
8.7
8.8
8.9
9
Method programming ....................................................................................................... 131
Method storage ................................................................................................................ 136
Methode deletion ............................................................................................................. 136
Method application ........................................................................................................... 137
Method editing ................................................................................................................. 153
Absorption / Transmission Mode .................................................................... 154
7.1
7.2
7.3
7.4
8
Overview of the device .................................................................................................... 120
Keyboard ......................................................................................................................... 121
Display ............................................................................................................................. 124
Cell chamber.................................................................................................................... 124
Start up ............................................................................................................................ 125
Packaging ........................................................................................................................ 125
First start up ..................................................................................................................... 125
Concentration mode ......................................................................................... 131
6.1
6.2
6.3
6.4
6.5
7
About UviLine Spectrophotometers .................................................................................. 119
About navigation inside the user’s manual........................................................................ 119
General ............................................................................................................................ 167
Method programming ....................................................................................................... 168
Saving method ................................................................................................................. 169
Method deletion ............................................................................................................... 169
Method selection .............................................................................................................. 170
Measurement application ................................................................................................. 171
Spectrum editing .............................................................................................................. 173
Kinetics mode ................................................................................................... 185
10.1
10.2
10.3
10.4
10.5
General ............................................................................................................................ 185
Method programming ....................................................................................................... 186
Method saving ................................................................................................................. 188
Method deletion ............................................................................................................... 188
Method selection .............................................................................................................. 189
10.6
10.7
10.8
10.9
11
Method application ........................................................................................................... 190
Method editing ................................................................................................................. 192
Kinetics treatment ............................................................................................................ 193
Printing curve................................................................................................................... 197
Memory .............................................................................................................. 198
11.1 General view.................................................................................................................... 198
11.2 Memorized results............................................................................................................ 199
11.3 Management of memorized results .................................................................................. 200
12
User management............................................................................................. 211
12.1
12.2
12.3
12.4
13
Various adjustments ........................................................................................ 215
13.1
13.2
13.3
13.4
13.5
13.6
13.7
13.8
14
Language selection .......................................................................................................... 215
Setting date and time ....................................................................................................... 216
Adjusting contrast............................................................................................................. 217
Reset ............................................................................................................................... 217
Lamp servicing count down .............................................................................................. 218
Device information ........................................................................................................... 218
Timer ............................................................................................................................... 219
Software update ............................................................................................................... 220
Maintenance ...................................................................................................... 221
14.1
14.2
14.3
14.4
14.5
15
User groups ..................................................................................................................... 211
Details of user rights ........................................................................................................ 211
Activating/deactivating user management ........................................................................ 212
Creating, editing, and deleting a user account .................................................................. 213
Changing lamp ................................................................................................................. 221
Changing buffer batteries ................................................................................................. 223
Cleansing ......................................................................................................................... 223
What to do, if …? ............................................................................................................. 224
Troubleshooting ............................................................................................................... 225
Connecting accessories .................................................................................. 226
15.1 Communication interface ................................................................................................. 226
last page of document
Version 130425 US
Declaration of conformity
Remarks
1
117
Remarks
The information contained in this document may be the object of patents or patent applications by SI
Analytics. The possession of this document does not confer any license to such patents.
The following names are SI Analytics registered trademarks throughout the world.
UviLine 9100 and UviLine- 9400
This manual is updated periodically. The updates are included in the new editions.
All information supplied in this edition of the manual may be amended before the products described
herein are available.
All reproduction rights reserved.
1.1 Information
The SI Analytics equipment has been designed, manufactured, tested and inspected according to the ISO
9001:2008 standards.
If the unit is not immediately installed, it should be stored in a dry and clean area. The storage temperature should be between 10 and 35°C.
SI Analytics equipment is carefully inspected before it is packed. As soon as you receive your equipment,
check the condition of the packaging and if you notice any problems, notify your carrier within 48 hours.
Then consult the packing list and check that everything is in order. Finally, if you discover that something
is missing, or if the goods are damaged immediately notify SI Analytics.
SI ANALYTICS
Hattenbergstr. 10
D-55122 Mainz
Germany | Allemagne | Alemania
Tel: +49.(0)6131.66.5111
Fax: +49.(0)6131.66.5001
E-mail: si-analytics@xyleminc.com
____________________________________________________________________________________
Guarantee
The new equipment and material sold by SI ANALYTICS is guaranteed against any manufacturing defects for 2 years (unless otherwise stated by SI Analytics).
The SI ANALYTICS company guarantee applies exclusively to defectiveness arising from a design fault
or from a concealed defect. It is strictly limited to the free dispatching of replacement parts (except for
consumable items) or to the repairing of the equipment in our workshops within a deadline of 10 working
days (shipping delay not included).
By express agreement, the following are strictly excluded from our guarantee:
− All damages, notably for staff costs, loss of earnings, business trouble, etc.
− Any breakdown due to an incorrect use of the equipment (non-adapted mains, fall, attempt at transformation, etc.) or to a lack of maintenance by the user or to poor storage conditions.
− Any breakdown due to the use of parts not supplied by SI ANALYTICS, on SI ANALYTICS equipment
− Any breakdown due to the transporting of the equipment in packaging which is not its original packaging
− The lamps, the cells and generally any item which appears in the "accessories" section on the price
list.
118
Warning and safety instructions
2
Warning and safety instructions
Always make sure that the instrument is connected on the good voltage.
(Between 100 – 240V 50-60Hz)
Always disconnect the mains plug before starting any work inside the instrument.
When substances dangerous for health and environment are used, the laboratory or site
rules, where the instrument is installed must be followed.
Take all the necessary precautions, during the use the instrument, to protect the operator
from eventual liquids leaks or spills or possible radiations (protective gloves, anti-UV radiation glasses, protected clothes, etc.)
Keep the sample compartment clean.
The Xenon lamp used in the UviLine 9400 emits UV radiation.
Install the instrument in a ventilated area because it is likely to generate ozone, which, beyond the limits below, can harm health.
Exposure average value = 100 ppb
Exposure limits value = 200 ppb
All operations made inside the instrument, must be done by SI Analytics or by SI Analytics’ authorized technicians.
Using spectrophotometer without danger
Use of the spectrophotometer without danger.
If it is necessary to suppose that it is not possible any more to use the spectrophotometer without danger, it is necessary to put it out of service and to protect it from involuntary starting up
again.
Use without danger will not be possible when the spectrophotometer
• suffered damage during transportation.
• was stored under inadequate conditions for a relatively long period
• shows some visible damages.
• does not function as described in the user’s manual anymore.
In case of doubt, consult the spectrophotometer supplier.
General
3
119
General
3.1 About UviLine Spectrophotometers
The main differences between UviLine 9100 and UviLine 9400 spectrophotometers are the wavelengths
ranges and the light sources.
UviLine 9100
Wavelengths range:
Light source:
320 – 1100 nm
Halogen lamp 5VDC 10W
UviLine 9400
Wavelengths range:
Light source:
190 – 1100 nm
Xenon lamp.
The software for UviLine 9100 and UviLine 9400 is identical; only the wavelengths ranges are different
(see above). For this reason, the user’s manuals are the same for both instruments except chapter about
lamp change.
3.2 About navigation inside the user’s manual
In this operating manual, the introductory navigation steps leading to individual menus or dialogs are
clearly shown in a gray box. The box indicates a section of the menu tree.
Starting point of the description is always the main menu, which can be reached with the <HOME> key
from any operating situation.
From there navigation takes place downward.
The following example shows the elements of the menu tree with the relevant operating steps:
<HOME>
– [Configuration]
- Langague
Bold letters and angle brackets indicate a
key on the photometer (except function
keys).
- Press the <Home> key.
The main menu is called up.
Square brackets indicate a function key F1 to F4.
The text between the brackets corresponds to the
assignment according to the function key menu on
the bottom edge of the display.
- Press the function key with the assignment i.e.
[Setup].
The corresponding menu appears.
Text without square brackets indicates a
menu item indicated on the display (list item).
- Select the menu item with the arrow keys
« ▲ » and « ▼ ». The current selection is
displayed in reverse video.
- Then press <START·ENTER>.
Other possibilities of navigation:
• The <ESC> key moves the operator one level up in the menu tree.
• The <HOME> key directly calls up the main menu.
Remark
If the operator is "lost" in a menu, he has to press <HOME> key and restart navigating from the main
menu.
120
Overview
4
Overview
4.1 Overview of the device
4
1
3
2
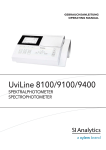
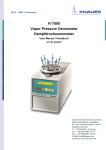
Fig. 1 Front of the meter with control elements
1: LCD graphic screen.
2: Membrane keyboard.
3: Cell compartment.
4: Cover of the cell compartment.
Overview
121
5
7
8
6
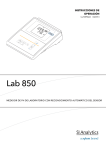
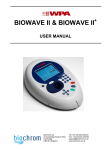
Fig. 2 Back of the meter with the interfaces
5: Connection for power supply.
6: RS232C plug
7: USB-A plug
8: USB-B plug
4.2 Keyboard
4.2.1 Overview
2
1
33
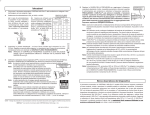
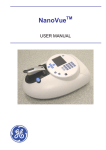
Fig. 3 Keyboard
1: F1 to F4 function keys (functions which depend on the menu)
2: Fix function keys.
3: Alphanumeric key block.
122
Overview
4.2.2 Keys function
Key
Designation
Function
<ON/OFF>
Switch the spectrophotometer ON and OFF
<HOME>
Switches to the main menu from any operating
situation. Actions that are not completed are
canceled.
<PRINT>
Downloads the displayed value to an interface.
<STORE>
Saves a displayed value or spectrum or kinetic
curve.
<ZERO BLANK>
Starts one of the following measurements, depending on the operating situation:
- Zero adjustment
- Blank value measurement
- Baseline measurement
<TIMER>
Open “Timer” menu.
<Esc>
Cancels the running action.
- Entries that have not yet been accepted are
discarded.
– Switches to the next higher menu level.
<START ENTER
– Starts an action (e.g. measurement)
– Opens a selected menu
– Confirms a selection or entry
« ▲ » or « ▼ ».
Moves the selection in menus and lists one position up or down.
«◄»
- Deletes the character left of the cursor during
character entries
- Moves the cursor to the left in a spectrum or
kinetic diagram.
«►»
– Moves the cursor to the right in a spectrum or
kinetic diagram.
Function keys F1 to F4
The function keys F1 to F4 have different functions depending on the operating situation. The current
functions are displayed in the function key menu at the bottom edge of the display.
Overview
123
4.2.3 Use of alphanumeric keyboard
Numerals, letters, punctuation marks and special characters are entered with the alphanumeric keypad of
the meter or using an external keyboard.
4.2.3.1 Zeichensatz
The following characters are available:
• Numerals (0 ... 9)
• Letters (A ... Z) and (a ... z).
• Punctuation marks (. and -)
• Special characters ° / + Δ, Σ, µ, #, %, : et ()
4.2.3.2 Command principle
Entering characters is always possible if there is an input field on the display.
The numerals and characters (expect for the small letters) assigned to the keys of the alphanumeric keypad are printed on the keys.
Example: With the <2/ABC> key you can enter the following characters: 2, A, B, C, a, b, c.
Select the required character by pressing the key several times (similar to a mobile phone). When pressing a key that is assigned to several characters once, the respective numeral appears first.
To enter a numeral, one key pressing is always sufficient.
When pressing the key for the first time a line pops up that displays all characters possible with this key.
The currently selected character is highlighted.
A character is taken over in the input field if
•
the character is highlighted for more than one second,
•
the character is confirmed with <START·ENTER>,
•
another alphanumeric key is pressed.
Remark
During mere number entries (such as entering a wavelength), the keys of the alphanumeric keypad are
assigned to the respective numeral only. Each pressing key directly enters the numeral (like a pocket calculator).
4.2.3.3 Special characters
To enter special characters, use <1/*> key.
4.2.3.4 Correction of bad character
Use <◄> key, to delete all characters until THE INCORRECT one and start the entries from there again.
124
Overview
4.3 Display
1
1
2
3
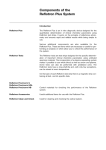
Fig. 4 Screen
1: Status line (actual status, date and time).
2: Displaying area for the menus or measurement results.
3: Menu for function keys.
4.4 Cell chamber
Fig. 5 Cuvettes well
- The beam goes from left to right.
1
Start up
5
125
Start up
5.1 Packaging
The UviLine 9100 and UviLine 9400 spectrophotometers are supplied with:
Power pack connection cable incl. adapters (international use).
Buffer batteries 4 x AA manganese alkaline.
6 diaphragms (0.9 x 11mm, 1.8 x 11mm, 3.8 x 11mm, 1.8 x 2.3mm, 3.8 x 2.3mm,1.8 x 4.8mm)
for use with special micro cuvets.
User’s manual / operating instructions.
Packing: This photometer is sent out in a protective transport packing. We recommend: Keep the packing material. The original packing protects the photometer against damage if it has to be transported.
5.2 First start up
Perform the following activities:
Insert the buffer batteries (see section 5.2.1)
Connect the power supply (see section 5.2.2)
Switch on the photometer (see section 5.2.3)
Set the language (see section 5.2.4)
Set the date and time (see section 5.2.5)
5.2.1 Buffer batteries installation
Fig. 6 Buffer batteries setting place (Instrument lower part)
1. Turn the photometer upside down and place it on a soft surface.
2. Open the lid of the battery compartment (1).
3. Insert the four batteries in the battery compartment. Make sure that the poles of the batteries are
in the correct position.
The ± signs on the batteries must correspond to the ± signs in the battery compartment.
4. Close the lid of the battery compartment.
Batteries time life
The power consumption of the clock is very low. The lifetime of high quality batteries is at least 5 years.
5.2.2 Connection of power supply
The power is supplied via the enclosed plug-in power pack. The power pack supplies the photometer with
low voltage (12 VDC).
126
Start up
Warning
The line voltage of the usage location must fulfill the specifications stated
on the power pack. Always use the supplied 12 V original power pack only.
Abb. 7 Connection of power supply
1. Connect the miniplug of the power pack to the socket (1) of the spectrophotometer.
2. Connect the power pack to an easily accessible power socket.
The display illumination switches on and then off again.
5.2.3 First photometer activation
During the initial commissioning, the spectrophotometer automatically guides the user through the setting
of the meter language, date and time after switching on (see following sections).
- Press
It displays:
key. The spectrophotometer is switched on.
The screen switches on the language setting (see paragraph 5.2.4).
After language selection the spectrophotometer carries out the self-test.
Start up
127
5.2.4 Language set up
During the first start up, the operator is guided directly to the language setting.
1.
2.
With « ▲ » and « ▼ » keys, select the language.
Confirm the choice with <START·ENTER> key.
The language is selected.
The actually selected language is marked with this symbol
The screen switches on the adjustment of the parameters « Date and Time » (see paragraph 5.2.5).
NOTE: After the initial commissioning, the operator can change the language at any time. From the main
menu <HOME> enter in the menu “General setup”, then “Language” menu.
5.2.5 Date and time set up
During the initial commissioning, the instrument automatically guides the operator to the setting of the
time and date after the setting of the language.
The menu « Date / Time » is opened.
128
Start up
1. With « ▲ » and « ▼ » keys, select one option from the menu. Confirm this option with
<START·ENTER> key.
The input field for the current date pops up.
2. Enter the current date with <0...9> keys and confirm.
The input field closes. The date is accepted.
3. Select « Time » and confirm.
The input field for the current hour pops up.
4. Enter the current hour with <0...9> keys and confirm.
The input field closes. The time is accepted.
NOTE: After the initial commissioning, the operator can change the date and time at any time. From the
main menu <HOME> enter in the menu “General setup”, then “Date/time” menu.
During the initial commissioning, the instrument automatically guides the operator to the self-test after the
setting of the date and time.
5.2.6 Self test
IMPORTANT
During self-test, the cuvette compartment must be empty (without any cuvette inside the cuvette
well) and the cover of the cuvette compartment must be closed.
1. Be sure that the cuvette compartment is empty.
Start up
2. Press <START ENTER> key to run the self-test.
During self-test, different parts of the spectrophotometer are checked.
If the test is OK, the symbol
is displayed on the corresponding line.
This self-test includes:
– tests of the memory, processor, interfaces, filter and lamp.
– checking of the wavelength calibration.
After the end of the self-test, the screen displays the main menu.
It is possible to see and print the self-test results by pressing F4 key [Info] (see paragraph 15.6).
1. select a measuring mode with « ▲ » and « ▼ » keys.
2. Confirm with <START ENTER> key.
129
130
Start up
5.2.7 Warm-up time
After switching on the photometer requires a warm-up time of 15 minutes. Reproducibility of measurement data is restricted during the warm-up time.
Therefore, do not measure during the warm-up time.
During the warm-up time, a progress bar appears on the display next to the date. The progress bar disappears as soon as the warm-up time is over.
Progress bar during warm-up time
5.2.8 Screen backlight
The photometer automatically switches off the display illumination if no key has been pressed for 5
minutes. The illumination is switched on again with the next keystroke. The function of the key becomes
active only with the following keystroke.
5.2.9 Spectrophotometer switch off
To switch the photometer off, keep the <ON/OFF> key depressed until the photometer is switched off.
Concentration mode
6
Concentration mode
6.1 Method programming
<HOME>
- Concentration
– [New method] or [Last used]
- If necessary, come back to the main menu with <HOME> key.
- Select with « ▲ » and « ▼ » keys, the « Concentration » mode.
- Enter in the concentration mode:
- Confirm with <START ENTER> key.
If there is no method in memory, the following screen will appear:
131
132
Concentration mode
- Press F1 key [New method]. It displays:
The following parameters can be modfied:
* Number
Automatic classification of methods (From 1001 to 1100).
* Wavelength
320 – 1100 nm for UviLine 9100
190 – 1100 nm for UviLine 9400
* Resolution
From 0 to 3
It is the number of figures after comma for the result.
* Unit
i.e.: mg/L (10 characters maximum).
* Citation form
(18 characters maximum).
Enter the chemical formula of the compound to be measured. i.e.: NO3
* Designation
(18 characters maximum).
Enter the compound name. i.e.: Nitrate
* Version
(18 characters maximum).
Enter the parameter concentration range. i.e.: 0.9 – 75.3 mg/L
Concentration mode
133
* Calibration curve
There are several possibilities:
– To measure the standard solutions.
– To enter the equation of the calibration curve or the factor value.
– To simulate measurements while entering of the couples of Absorbance/Concentration values
Select an option and press F4 key [Next].
MEASUREMENT OF STANDARD SOLUTIONS
* Standard ID
Enter the identification number of the standards if this one exists.
* Standard manufacturer
Enter the standard manufacturer name if this one exists
* Blank value
YES or NO.
Measure d or not of the reagent blank
Measurement example without reagent blank (blue curve) and with reagent blank (purple curve.
It is easy to notice that for a same sample, which absorbance measured against the zero is 0,200 Abs;
the concentration value will not be the same. The blank value is subtracted from the measure.
134
Concentration mode
14,9 mg/L
20 mg/L
* Standard conc 1
Enter the concentration of standard 1.
Remark
It is possible to add other standards (Maximum 10) by pressing F2 key [Add] and to enter their concentration.
To delete a standard, select it with « ▲ » and « ▼ » keys and press F3 key [Delete].
When all standards are entered, press F4 key [Next] to continue.
ENTER COUPLES OF VALUES
Concentration mode
- Press F4 key [Next]. It displays:
For the choice of the blank and the possibility to add some standards, proceed as before.
When the standards are entered, press F4 key [Next]
ENTER FORMULA
- Press F4 key [Next]. It displays:
Enter a function as:
5
4
3
2
C = a5.A + a4.A + a3.A + a2.A + a1.A + a0
With C = Concentration
135
136
Concentration mode
A = Absorbance
a0 to a5 free factors (from 0.000 to 9999.000)
Example: Use of a K factor K (C = a1A)
• a0 = 0
• a1 = K (factor)
• a2, a3, a4, a5 = Zero
Example: straight line regression (C = a1A + a0)
•
•
•
a0 = bias
a1 = slope
a2, a3, a4, a5 = Zero
Example: third degree curve (Nitrate test in sea water)
C = 0.1493A3 – 2.5154A2 + 36.524A + 1.865
a0 = 1.865
a1 = 36.524
a2 = - 2.5154
a3 = 0.1493
a4 & a5 = 0
* Lower and upper limit of measuring range
Choice between zero and the maximum value of measured parameter.
When the formula is entered, press F4 key [Next]
6.2 Method storage
The methods are automatically stored under the classification name from 1001 to 1100.
Remark: However, methods using standards will be stored only after standards measurement.
6.3 Method deletion
<HOME>
Concentration,
– Select method
– [Setup]
– Delete method
- Select method to be deleted with « ▲ » and « ▼ » keys and press <START ENTER> key.
Concentration mode
- Press F1 key [Setup]. It displays:
- Select « Delete method » with « ▲ » and « ▼ » keys and press <START ENTER> key.
6.4 Method application
6.4.1 With standard solutions
137
138
Concentration mode
6.4.1.1 Measurement
When standard (s) are entered, press F4 key [Next]. It displays:
- Press F3 key [Measurement] to start the measure.
- Press on <ZERO BLANC> key to perform the zero of the meter.
- Install the blank (if necessary) inside the cuvette holder.
- Start the blank measurement (if this one was programmed) by pressing <START ENTER> key.
Concentration mode
139
It is possible, in the event of error, to refuse the value and to measure again the solution. Press then on
F2 key [Discard].
- Then remake measurement while pressing on <START ENTER> key.
It is also possible, if the solution is unstable, to measure it again several times. The software will make
the average of the various measured values.
- To measure the solution once again, press F1 key [Next meas.].
- Press <START ENTER> key to measure the solution once again.
Remark: The number of times that the operator can measure again the solution is not limited.
The value will take in account is displayed under « Median » term.
- Press, then F4 key [Apply]. It displays:
The operator can choose to preserve the last measured value by validating the option "Last measured
absorbance" or to use the average value calculated by choosing and validating the option "Median".
140
Concentration mode
It displays:
-Install the first standard to be measured
- Press F3 key [Measurement]. It displays:
- Start measurement of the first standard by pressing <START ENTER> key.
As for the blank, the operator can reject measurement (F2 key [Discard]) or make several times the
measurement of the same standard (F1 key [Next meas.]) and preserve the average value.
- Make, in the same way, the measurement of the other standards.
After the standards measurement, it displays:
Concentration mode
141
- Press on F4 key [Next].
NOTE:
If the programming of standards concentration is not increasing or decreasing in a monotonous way or if
the measurement of the blank and standards absorbances is not, also increasing or decreasing in a monotonous way (see example below), the spectrophotometer will display an error prompt (see below)
Increasing and monotonous absorbances
The following message will appear:
No monotonous absorbances
142
Concentration mode
6.4.1.2 Calibration curve displaying
F1 key [Back]
- It allows to the user, in the event of error, to return back to the analysis programming and to modify the
acquiring way of the values to make the curve (standards measurement, use of the curve equation or
entry of the Concentration/absorbance couples). That also enables him to change the standards concentration.
F2 key [Curve type]
It allows changing the curve calculation mode.
Straight line
The straight line calibration curve is consisted of line segments connecting the calibration points between
them.
Linear regression
Curve whose equation is form ax + B.
Quadratic regression
Curve which equation is: ax² + bx + c.
Curves through 0
The calculation of these curves takes in account item 0.
- Select the type of curve with « ▲ » and « ▼ » keys and confirm with <START ENTER> key.
The software will redraw the curve taking in account of the new calculation mode.
The equation of the calculated curve is displayed as well as the coefficient of R² determination
Concentration mode
143
F3 key [Meas.range]
It allows to the operator to reduce the parameter measuring range.
Lower limit entered by the operator
Upper limit entered by the operator
These limits are materialized by an arrow « ▼ » on the concentration axis.
Any value under or above limits fixed by the operator will be declare as > or < to the limits, but absorbances will be displayed (see example under).
144
Concentration mode
6.4.1.3 Point deletion
To delete a point press F1 key [Back]. It will display once again:
- Press F4 key [Next]. It displays:
- Select the point to delete with « ▲ » and « ▼ » keys.
- Delete the point by pressing F3 key [Delete].
Concentration mode
145
- Press on F4 key [Next].
During this stage, it is always possible to measure a standard once again.
- Select the standard to measure again.
- Press F3 key [Measurement] to start the standard measurement.
- Press F4 key [Next] to display the curve.
- To set back the removed standard, press F4 key [Back].
- Add the standard.
- Enter its concentration.
- Measure the concentration of this standard once again, or enter its absorbance following the curve building mode selected.
146
Concentration mode
6.4.1.4 Kalibrierungskurve ausdrucken
- Drücken Sie die Taste <PRINT>.
UviLine 9100 7449001 1.14
WILLY
1001 Nitrate 0.9 / 75.3 mg/L
500 nm
f(x) = 0.03207x + 0.0427
R² = 0.9993
Messbereich : 0.00 _ 30.00 mg/L
6.4.1.5 Method saving
See paragraph 8.2.
6.4.1.6 Sample measurement
- Press <ZERO BLANK> key to start the blank measurement.
It performs the zero and displays:
Concentration mode
147
- Press < START ENTER> key to start sample measurement.
If the operator does not want that the samples absorbance is displayed at the same time as the concentration, he has to select it in the [Setup] menu.
- Press on F1 key [Setup]. It displays:
- Select « Display absorbance» with « ▲ » and « ▼ » keys and confirm with <START ENTER> key.
- Proceed as the same way to display again the samples absorbance.
at the end of « Display absorbance » means that the absorbance will be displayed
NOTE: The symbol
at the same time as their concentration.
148
Concentration mode
6.4.1.7 Printing results
- Press <PRINT> key to send data on printer.
UviLine 6100 7449001 1.16
Willy
Time of measurement:
Method:
Measured value:
Sample absorbance:
3/20/2008 16:28:23
Nitrate
>30.00 mg/l
1.119
Time of measurement:
Method:
Measured value:
Sample absorbance:
3/20/2008 16:28:23
Nitrate
17.50 mg/l
0.604
6.4.1.8 Sample dilution
It is possible to program a dilution factor (From 0 to 999) that will be taken in account during sample
measurement.
Before sample measurement, when the screen displays:
- Press F1 key [Setup]. It displays:
- Press on <START ENTER> key.
Concentration mode
149
Enter the dilution factor.
1 + 0 = no dilution.
1 + 1 = dilution by 2.
……………
When the dilution factor is entered, confirm with <START ENTER> key. It displays:
The dilution factor (i.e.: [1 + 1]) is displayed on the top left part of the screen.
NOTE: This dilution factor will be maintained with the value entered by the operator for all measurements
to come. At the time of the exit of the mode of analysis or analysis in progress it will be given to 0 (no dilution).
6.4.1.9 Sample blank value
It is possible to subtract a sample blank for each measured sample.
- Press F1 key [Setup] after zero measurement. It displays:
Remark: The symbol
at the end of « Sample blank value » means that the option is selected.
- Select « Sample blank value » with « ▲ » and « ▼ » keys and confirm with <START ENTER> key.
150
Concentration mode
The symbol [SB] appears at top left corner of the screen and stays here and will remain all the time that
this option is selected or that the operator did not leave the analysis in progress or the mode of concentration measurement.
- Insert the first sample blank and run the measurement by pressing <START ENTER> key.
As for the blank, the operator can reject measurement (F2 key [Discard]) or make several times the
measurement of the same sample blank (F1 Key [Next meas.]) and preserve the average value.
- Press F4 key [Apply] to run the sample measurement. It displays:
- Insert the sample corresponding to the measured sample blank and start the measurement by pressing
<START ENTER> key. It displays:
Concentration mode
151
It displays the sample absorbance read against the zero (i.e.: 0.630) and the sample concentration calculated as following:
Sample concentration = sample absorbance read against the zero minus sample blank absorbance read
against the zero multiply by the factor or reported to the calibration curve.
6.4.2 With value couples
- Press on F4 key [Next].
- Enter, with keyboard, the absorbance values of the blank (if necessary) and the one of each standard.
- Press F4 key [Next].
152
Concentration mode
It displays then the calibration curve.
From this point, the continuation proceeds as if the operator had measured the standards. See paragraph
6.4.1.2.
6.4.3 With a formula
When the formula is entered, press F4 key [Next];
It displays:
From this point, the continuation proceeds as if the operator had defined his calibration curve. See paragraph 6.4.1.6.
Concentration mode
6.5 Method editing
<HOME>
Concentration,
– Select method
– [Setup]
– Edit method
- Enter in « Concentration » mode.
- Select a method with « ▲ » and « ▼ » keys, then confirm with <START ENTER> key.
- Press F1 key [Setup]. It displays:
- Select « Edit method » with « ▲ » and « ▼ » keys, then confirm with <START ENTER> key.
153
154
7
Absorption / Transmission mode
Absorption / Transmission Mode
7.1 General
The absorbance or transmittance is measured respectively without the use of any methods. All settings
are configured during measurement.
The absorbance or transmittance can alternatively be measured against the air or against a reference solution determined by the operator.
<HOME>
Absorption / % transmission
- If necessary, come back to the main menu with <HOME> key.
- Select with « ▲ » and « ▼ » keys, « Absorption / % transmission » mode.
- Enter in the absorption mode:
It displays:
The settings of the last measurement are active.
Absorption / Transmission mode
155
7.2 Measurement
- Press F2 key [Wavelength] to enter a new wavelength.
- Press <ZERO BLANK> key to start the zero measurement.
- Press <START ENTER> key to start the sample measurement
It displays:
Absorbance and transmittance are displayed.
- Press <START ENTER> key to start a new measurement.
If there are several measurements, the last four are displayed at the same time as the measurement in
progress.
- Press F4 key [Continuous] to measure the same sample several time again.
The measurement is about every 2 seconds.
- Press F4 key [Stop] to stop the continuous measurement.
156
Absorption / Transmission mode
7.3 Printing results
- Press <PRINT> key to print the results.
UviLine 9100 7449001 1.14
Administrator
Time of measurement:
Wavelength:
Measured value:
07/01/2008 14:05:46
525 nm
0.278 52.8 %
7.4 Saving results
<HOME>
Absorption / % transmission
– [Setup] or [General setup] from the main menu
– Measurement data memory
See paragraph 11.3 and especially paragraph 11.3.3.
Multi wavelengths mode
8
157
Multi wavelengths mode
8.1 Measurement principle
This measuring mode allows making different calculations on a sample measured at several wavelengths (ratio, Allen correction,...). It also makes it possible to have the absorbance value of a solution read at several
wavelengths (up to 10).
The general calculation is:
Equation 1
R=
a 0 + a1. A1 + a 2. A2 + ... + a10. A10
b0 + b1. A1 + b 2. A2 + ... + B10 A10
R is the result of the calculation.
a 0, a1, a 2,...a10, b0, b1, b 2,...b10 are factors which allow calculations on the absorbances.
A1, A2,..., A10 are absorbances read at different wavelengths.
The operator must judiciously choose the value of the factors a0, a1, a2... a10 and the value of the factors b0,
b1, b2..., b10 in such way that the general equation (Equation 1) is identified with calculation to carry out. See
the examples hereafter.
8.2 Calculations
Determination of DNA purity index
DNA purity index is given by the ratio of absorbance read at 260 nm on the absorbance read at 280 nm with
elimination of a cloudy part of the solution by a measurement at 320 nm.
Equation 2
R=
Abs 260 nm − Abs320 nm
Abs 280 nm − Abs320 nm
To convert the general equation (1) in specific equation (2), the operator has to make the following programming:
WL
(nm)
Abs (nm)
a
Value
b
Value
a0
0
b0
0
Wavelength 1
260 nm
A1
Abs (260 nm)
a1
1
b1
0
Wavelength 2
280 nm
A2
Abs (280 nm)
a2
0
b2
1
Wavelength 3
320 nm
A3
Abs (230 nm
a3
-1
b3
-1
Wavelength 4
A4
a4
0
b4
0
Wavelength 5
A5
a5
0
b5
0
Wavelength 6
A6
a6
0
b6
0
Wavelength 7
A7
a7
0
b7
0
Wavelength 8
A8
a8
0
‘b8
0
Wavelength 9
A9
a9
0
b9
0
Wavelength 10
A10
a10
0
b10
0
Warburg Christian formula for proteins quantification
158
Multi wavelengths mode
Equation 3
C[Pr oteins ] = (1,55 × Abs 280 nm ) − (0,575 × Abs 260 nm ) given in mg/mL
To convert the general equation (1) in specific equation (3), the operator has to make the following programming:
WL
(nm)
Abs (nm)
a
Value
b
Value
a0
0
b0
1
Wavelength 1
280 nm
A1
Abs (280 nm)
a1
1,55
b1
0
Wavelength 2
260 nm
A2
Abs (260 nm)
a2
0,757
b2
0
Wavelength 3
A3
a3
0
b3
0
Wavelength 4
A4
a4
0
b4
0
Wavelength 5
A5
a5
0
b5
0
Wavelength 6
A6
a6
0
b6
0
Wavelength 7
A7
a7
0
b7
0
Wavelength 8
A8
a8
0
‘b8
0
Wavelength 9
A9
a9
0
b9
0
Wavelength 10
A10
a10
0
b10
0
Allen correction
It allows measuring the pick high inside a first order chemical noise.
Equation 4
Abs = Abs 2 −
( Abs1 + Abs3) = 2 × Abs 2 − Abs1 − Abs3
2
2
To convert the general equation (1) in specific equation (4), the operator has to make the following programming:
WL
(nm)
Abs (nm)
a
Value
b
Value
a0
0
b0
2
Wavelength 1
xxx nm
A1
Abs (xxx nm)
a1
-1
b1
0
Wavelength 2
yyy nm
A2
Abs (yyy nm)
a2
2
b2
0
Wavelength 3
zzz nm
A3
Abs (zzz nm)
a3
-1
b3
0
Wavelength 4
A4
a4
0
b4
0
Wavelength 5
A5
a5
0
b5
0
Wavelength 6
A6
a6
0
b6
0
Wavelength 7
A7
a7
0
b7
0
Wavelength 8
A8
a8
0
‘b8
0
Wavelength 9
A9
a9
0
b9
0
Wavelength 10
A10
a10
0
b10
0
Multi wavelengths mode
159
8.3 Method programming
<HOME>
Multi-wavelengths
– [Setup]
- New Method
- If necessary, come back to the main menu with <HOME> key.
- Select with « ▲ » and « ▼ » keys, « Multi-wavelengths » mode.
- Enter in the multi-wavelengths mode.
- Confirm with <START ENTER> key. It displays:
- Press F1 key [New method].
It displays:
- Enter here general data of the method. The next number of method available is already registered as next
number of analysis to be used.
160
Multi wavelengths mode
To fill the fields with entry, it is possible to proceed as follows:
- Fill the entire empty fields with entry ones after the others.
- Press the key F2 [Method list] to select a method already recorded
- Press the F3 key [Delete] to remove the method completely.
- Press the F4 key [Next] to confirm all the entries and to pass in the following page.
- Press F2 key [Add] to add another wavelength.
- Press F3 key [Effacer] to delete the last wavelength.
- Press F4 key [Next] to confirm all the entries and to pass in the following page.
- Enter the factors value (for more information about the equation programming, see paragraph 8.2).
- Press on the F4 key [Next] to confirm all the entries and to pass in the following page.
- Enter the factors value (for more information about the equation programming, see paragraph 10.2).
- Press on the F4 key [Next] to confirm all the entries and to pass in the following page.
Multi wavelengths mode
161
All data are displayed once again.
- Press on F1 key [Back] to correct erroneous entries on the previous pages.
- Press on the F4 key [Next] to confirm all the entries and to pass in the following page.
The method is programmed.
The programmed equation is displayed (for more information about the equation programming, see paragraph
10.2).
- Press on F4 key [Complete] to leave the programming.
8.4 Method storing
The method is automatically stored in the memory.
8.5 Method deletion
<HOME>
Multi-wavelengths
– Select method
– [Setup]
– Edit method
- [Delete]
- Select the method to be deleted with « ▲ » and « ▼ » keys and confirm with <START ENTER> key.
162
Multi wavelengths mode
- Press F1 key [Setup]. It displays:
- Select « Edit method » with « ▲ » and « ▼ » keys and confirm with <START ENTER> key.
- Press F3 key [Delete].
- Answer « YES » to the message « Delete method? ».
The method will be deleted.
Multi wavelengths mode
163
8.6 Method selection
<HOME>
Multi-wavelengths
– Select method
The method list is displayed.
Methods are ordered by method number.
Method selection:
- Select a method with « ▲ » and « ▼ » keys.
The active selection is displayed in reverse video.
- Accept the selection with <START·ENTER> key.
The spectrophotometer is ready to measure.
8.6.1 Limitation of methods list
If the list is very long, the operator can narrow down the method list and thus make the search easier as follows:
• Press F4 key [Last used], it is possible to restrict the method list to the ten methods last used.
• With the search function, the operator can search certain character strings in the list. The search takes
place as a full-text search of the entire list contents.
The operator can search for a method number or certain citation form.
8.6.2 Research function
Search for a character string:
- Enter the character string to be searched for in the search window with <A...9>.
The list appearing below shows all hits containing the character string. The hit list is updated with each character that is entered.
Remark
Note the case sensitivity when searching.
164
Multi wavelengths mode
8.7 Method application
<HOME>
Multi-wavelengths
– Select method
- Select a method with « ▲ » and « ▼ » keys and confirm with <START·ENTER> key.
It displays:
- Press <ZERO BLANK> key.
Zero is performed at the programmed wavelengths. Then it displays:
- Press <START ENTER> key to start the sample measurement.
Multi wavelengths mode
165
The spectrophotometer runs the measurement automatically.
- Press on F3 key [Transmission] to have the transmission values (%).
It displays at the same time the absorbance values (or transmittance values) of the sample read at the different wavelengths.
- Press on <START ENTER> key to run a new measurement.
166
Multi wavelengths mode
8.8 Printing results
UviLine 9100 7449001 1.14
Administrator
Time of measurement:
Method:
Measured value:
Function:
Raw values
07/01/2008 14:05:46
2002
1.02
1.000*A(260 nm)
R=------------------------1.000*A(280 nm)
35.57
A(260 nm) = 0.586
A(280 nm) = 0.572
8.9 Method editing
<HOME>
Multi-wavelengths,
– Select method
– [Setup]
– Edit method
- Enter in the « Multi-wavelengths » mode.
- Select a method with « ▲ » and « ▼ » keys then confirm with <START ENTER> key.
- Press F1 key [Setup]. It displays:
- Select « Edit method» with « ▲ » and « ▼ » keys then confirm with <START ENTER> key.
Spectrum mode
9
167
Spectrum mode
9.1 General
The Spectrum mode makes it possible to measure and record the Absorption and Transmission values according to the wavelength. The wavelength range can be freely selected inside the spectrophotometer measuring
range. The measurement step is 1 nm.
Baseline
A baseline has to be recorded before a spectrum is recorded. The baseline has to cover at least the wavelength range of the spectrum to be recorded. Once the baseline is measured, it remains stored in the photometer until a new baseline is recorded, the Spectrum mode is exited or the photometer is switched off.
<HOME>
Spectrum
- If necessary, come back to the main menu with <HOME> key.
- Select with « ▲ » and « ▼ » keys, «Spectrum» mode.
- Enter in the “Spectrum” mode:
168
Spectrum mode
9.2 Method programming
<HOME>
Spectrum
– [Setup]
- Press on F1 key [Setup].
If the operator doesn’t change the acquisition parameters any more, they will be, by fault, identical to the ones
displayed above.
* Start wavelength
From 320 nm for the UviLine 9100
From 190 nm for the UviLine 9400
* Stop wavelength
Up to 1100 nm for both UviLine 9100 and UviLine 9400
* Scan speed (For UviLine 9400 only)
Select « Low », « Medium » or « High »
* Mode
Absorbance or Transmission
* Smoothing
YES or NO
* Scaling
Auto or Manual
Auto: The photometer adjusts the scaling of the axes (minimum and maximum value of the axes) to the
measured values while measuring. The entire curve is always visible.
Manual:
Abs min.
Abs max.
The scaling of the axes (minimum and maximum value of the axes) is permanently set manually.
Spectrum mode
9.3 Saving method
<HOME>
Spectrum
– [Setup]
- Parameters programming
- [Save]
- [Location]
- Enter in spectrum mode.
- Press on F1 key [Setup] to enter inside the programming parameters sub-menu.
- Program parameters.
- Press on F2 key [Save].
- Press on F1 key [Location].
- Select the place where the method will store (Internal folder DataB or USB memory)
- Give a name to the method and confirm with <START/ENTER> key.
9.4 Method deletion
<HOME>
Spectrum,
– [Setup]
– [Open]
- Select method
- [Delete]
- Enter in the « Spectrum » mode.
- Press on F1 key [Setup]. It displays:
- Press on F1 key [Open]. It displays:
169
170
Spectrum mode
- Select the method to be deleted with « ▲ » and « ▼ » keys.
- Press on F2 key [Delete].
The method is deleted.
9.5 Method selection
<HOME>
Spectrum
– [Setup]
- [Open]
- Enter in spectrum mode.
- Press on F1 key [Setup] to enter inside the programming parameters sub-menu.
- Press on F1 key [Open].
- Press on F1 key [Location] if the method is stored inside a USB memory.
- Select the method and confirm with <START/ENTER> key.
Spectrum mode
9.6 Measurement application
<HOME>
Spectrum
A message which contains instructions to follow is displayed.
- Press on F1 key [Setup].
- Enter the method parameters (see paragraph 9.2).
- Press on F4 key [Apply] to pass the following step.
- Start the baseline measurement by pressing <ZERO BLANK> key.
171
172
Spectrum mode
The spectrophotometer memorizes the baseline.
Wait until the end of measurement. It displays:
- Insert the sample inside the cuvette holder.
- Close the cover.
- Press <START ENTER> key to start the measurement.
When the spectrum is finished, it displays the following message:
- Press <START ENTER> key to confirm.
Information curseur
The cursor appears at the absolute maximum of the spectrum.
Spectrum mode
173
The operator has the following possibilities:
- Immediately realized some calculations on the spectrum (see paragraph 9.7).
- To print, with <PRINT> key, the spectrum on a connected printer as a graphic.
- To record, with <STORE> key, the spectrum as a “*.csv” file. As the memory location, it is possible to select
the spectrophotometer (Internal DataB folder) or a connected USB memory at the USB-A connection (USB
memory).
Stored spectra can be recalled and edited at any time (see paragraph 9.7.1).
9.7 Spectrum editing
9.7.1
Loading saved spectrum
<HOME>
Spectrum
– [Open]
- Press on F4 key [Open].
Stored spectra list is displayed.
• If necessary, it is possible to select a different memory location for the spectrum with F1 key [Location]
(USB medium at the USB-A connection).
• Select the required spectrum.
The original view of the curve is displayed.
Location Delete
9.7.2
Cursor
Information cursor
The cursor consists of a horizontal and vertical line that crosses each other at a point of the curve. A box
names the x and y values of the point of the curve.
Move the cursor along the x axis (wavelength) with « ◄ » and « ► » keys. It is possible to trace and evaluate
the curve point by point.
174
9.7.3
Spectrum mode
Zoom
- Press on F3 key [Zoom].
The zoom window appears.
– Press F1 key [Original], at any time, to come back to the original view of the spectrum.
The bottom left corner of the zoom window is marked by a small black square.
Adjusting the zoom window:
– Define the bottom left corner of the zoom window (small black square) with « ◄ » and « ► » keys and with
« ▲ » and « ▼ » keys.
– Use F4 [xy max] key to pass from the bottom left corner of the zoom window to the top right corner of the
zoom window.
– Define the top right corner of the zoom window (small black square) with « ◄ » and « ► » keys and with
« ▲ » and « ▼ » keys.
Scaling up the zoom window:
– Press on <START·ENTER> key. The zoom window is scaled up on the entire diagram area.
Leaving the zoom view:
- Press on <ESC> key to come back to the spectrum original view.
Spectrum mode
9.7.4
175
Manual change of absorbance scale
<HOME>
Spectrum,
– [Open]
– [Setup]
– Scaling
- Manual
- Press on F1 key [Setup], select « Scaling » and then « Manual » to determine manually the absorbance scale
(Y axis).
- Enter manually the minimum and the maximum of absorbance.
9.7.5
9.7.5.1
Calculations
Peaks and valleys detection
<HOME>
Spectrum
– [Edit]
- Peaks & valleys detection
- Press on F2 key [Edit].
- Select « Peaks & valleys detection » with « ▲ » and « ▼ » keys. Confirm with <START ENTER> key.
It displays:
Automatic
It detects automatically the peaks (maximum) and the valleys (minimum).
176
Spectrum mode
Manual input
- Enter the minimum distance between minimum and maximum.
REMARK: More the difference between minimum and maximum will be small, more peaks and valleys will be
listed.
- Press F1 key [OK] to come back to the curve.
- Press F4 key [Mark] to mark, on the curve, minimum and maximum (See paragraph 11.7.5.2).
- Press <PRINT> to print curve with minimum and maximum.
9.7.5.2
Punkte markieren
<HOME>
Spectrum
– [Edit]
- Mark points
This function makes it possible to the operator to mark on the spectrum a particular point with its coordinates
(Absorbance Wavelength).
Spectrum mode
177
- Press on F2 key [Edit].
- Select « Mark points » with « ▲ » and « ▼ » keys. Confirm with <START ENTER> key.
It displays:
- Move the cursor along the curve with « ◄ » and « ► » keys.
- Press on F4 key [Mark] to display the points coordinates.
NOTE: When the operator uses directly « Mark » function, he can mark all points on the curve without exception.
If the “Mark” function is used from the screen which displays spectrum minimum and maximum, only those
could be marked by the operator.
178
Spectrum mode
9.7.5.3 Deletion of mark points
9.7.5.3.1 Deletion of individual mark points
- Move the cursor along the curve with « ◄ » and « ► » keys.
When cursor arrives on marked point, the [Delete] key appears beside [Mark] key.
- Press F3 key [Delete] to remove the selected point.
9.7.5.3.2
Deletion of all mark points
<HOME>
Spectrum
– [Edit]
- Delete all marks
- Press on F2 key [Edit].
When there are marked points, the command « Delete all marks » appears inside the « Edit » menu.
- Select « Delete all marks » with « ▲ » and « ▼ » keys. Confirm with <START ENTER> key.
All marked points will be deleted.
Spectrum mode
9.7.5.4
Area calculation
<HOME>
Spectrum
– [Edit]
- Surface calculation
Calculate the surface under the curve between two wavelengths [X1, X2] freely chosen by the operators.
- Press on F2 key [Edit].
- Select « Surface calculation » with « ▲ » and « ▼ » keys. Confirm with <START ENTER> key.
- Press on F3 key [X1] to select left cursor.
- Move, with « ◄ » and « ► » keys, the left cursor along the curve until the first wavelength.
- Press on F4 key [X2] to select right cursor.
- Move, with « ◄ » and « ► » keys, the right cursor along the curve until the second wavelength.
The surface value and the selected wavelength range are displayed at the top right corner of the screen.
179
180
9.7.5.5
Spectrum mode
Derivative calculation
<HOME>
Spectrum
– [Editl]
- Derivative
Calculate the derivative of the complete spectrum. For the calculation of the second and the third derivative, it
is possible to carry out the function on several times.
- Press on F2 key [Edit].
- Select « Derivative » with « ▲ » and « ▼ » keys. Confirm with <START ENTER> key.
Original curve
- Press on F2 key [Edit].
- Select « Original values » with « ▲ » and « ▼ » keys. Confirm with <START ENTER> key.
NOTE: The functions as « Zoom », « Mark points », « Surface calculation » and « Derivative » are also available for a derivative curve.
A derivative curve can be also recorded in memory with <STORE> key.
Spectrum mode
9.7.5.6
181
Spectra comparison
<HOME>
Spectrum
– [Edit]
- Compare spectrum
Load a second spectrum into the same diagram for direct comparison.
WARNING: The comparisons of spectra can be done only on spectra which do not result from calculations (derivative, multiplication...)
- Press F4 key [Open] and select the first spectrum
- Press F2 key [Edit].
- Select « Compare spectrum » with « ▲ » and « ▼ » keys. Confirm with <START ENTER> key.
- Select the second spectrum and confirm with <START ENTER> key.
It displays:
To come back to a normal screen (first selected spectrum):
- Press on F2 key [Edit].
- Select « Original values » with « ▲ » and « ▼ » keys. Confirm with <START ENTER> key.
182
9.7.5.7
Spectrum mode
Addition of two spectra
<HOME>
Spectrum
– [Edit]
- Add spectrum
Add a stored spectrum to the current spectrum.
- Press F4 key [Open] and select the first spectrum or use the acquired spectrum
- Press F2 key [Edit].
- Select « Add spectrum » with « ▲ » and « ▼ » keys. Confirm with <START ENTER> key.
- Select the second spectrum and confirm with <START ENTER> key.
It displays the summary of the two spectra.
To come back to a normal screen (first selected spectrum):
- Press on F2 key [Edit].
- Select « Original values » with « ▲ » and « ▼ » keys. Confirm with <START ENTER> key.
9.7.5.8
Subtraction of one spectrum from another one
<HOME>
Spectrum
– [Edit]
- Subtract spectrum
Subtract a stored spectrum from the current spectrum.
- Press F4 key [Open] and select the first spectrum or use the acquired spectrum
- Press F2 key [Edit].
- Select « Subtract spectrum » with « ▲ » and « ▼ » keys. Confirm with <START ENTER> key.
Spectrum mode
183
- Select the second spectrum and confirm with <START ENTER> key.
It displays the difference of the two spectra.
To come back to a normal screen (first selected spectrum):
- Press on F2 key [Edit].
- Select « Original values » with « ▲ » and « ▼ » keys. Confirm with <START ENTER> key.
9.7.5.9
Division of a spectrum
<HOME>
Spectrum
– [Edit]
- Divide spectrum (ratio)
Divide the absorbance or % transmission values of the current spectrum by the values of a stored spectrum
Warning: This function always applies to the common wavelength range of both spectra only.
- Press F4 key [Open] and select the first spectrum or use the acquired spectrum
- Press F2 key [Edit].
- Select « Divide spectrum (ratio) » with « ▲ » and « ▼ » keys. Confirm with <START ENTER> key.
- Select the second spectrum and confirm with <START ENTER> key.
It displays the ratio of the two spectra.
To come back to a normal screen (first selected spectrum):
- Press on F2 key [Edit].
- Select « Original values » with « ▲ » and « ▼ » keys. Confirm with <START ENTER> key.
9.7.5.10
Addition of a constant
<HOME>
Spectrum
– [Edit]
- Add fixed value
Add a constant absorbance or % transmission value to the current spectrum.
- Press F4 key [Open] and select the first spectrum or use the acquired spectrum
- Press F2 key [Edit].
184
Spectrum mode
- Select « Add fixed value » with « ▲ » and « ▼ » keys. Confirm with <START ENTER> key.
- Enter the positive or negative fixed value and confirm with <START ENTER> key.
It displays the curve added with the constant value entered by the operator.
To come back to a normal screen:
- Press on F2 key [Edit].
- Select « Original values » with « ▲ » and « ▼ » keys. Confirm with <START ENTER> key.
9.7.5.10
Multiplication by a constant
<HOME>
Spectrum
– [Editl]
- Multiply fixed value
Multiplies the absorbance or % transmission values of the current spectrum by a constant value.
- Press F4 key [Open] and select the first spectrum or use the acquired spectrum
- Press F2 key [Edit].
- Select « Multiply fixed value » with « ▲ » and « ▼ » keys. Confirm with <START ENTER> key.
- Enter the constant value and confirm with <START ENTER> key.
It displays the curve multiplied by the constant value entered by the operator.
To come back to a normal screen:
- Press on F2 key [Edit].
- Select « Original values » with « ▲ » and « ▼ » keys. Confirm with <START ENTER> key.
Kinetics mode
185
10 Kinetics mode
10.1 General
The Kinetics function enables the temporal tracing of the absorbance or transmission of a sample at a certain
wavelength. For recording, the spectrophotometer carries out single measurements at regular intervals (measuring interval) and stores the measured values as a time function.
All measuring parameters are entered by the operator in order to create methods which can be stored, edited
and deleted.
<HOME>
Kinetics
- If necessary, come back to the main menu with <HOME> key.
- Select with « ▲ » and « ▼ » keys, « Kinetics » mode.
- Enter in the kinetics mode:
186
Kinetics mode
10.2 Method programming
<HOME>
Kinetics
- New method
- Press on F1 key [New method].
It displays:
Remark:
In kinetics mode, methods are recorded under number from 4001 to 4020.
* Number
4001…4020
* Nam
Name of the method (18 characters).
* Mode
Absorbance or Transmission
* Wavelength
320 – 1100 nm for l’UviLine 9100
190 – 1100 nm for l’UviLine 9400
* Duration (Delay + Measure)
Total duration of the kinetics including the waiting time (Delay).
Format hh:mm:ss (hours:minutes:seconds)
* Interval
It is the time interval between two successive single measurements.
Format hh:mm:ss (hours:minutes:seconds)
Kinetics mode
187
Exception:
With the setting, Measurements/interval: Max/interval setting, the interval is defined differently (see below).
* Delay
Time between the start of the recording and the start of the first single measurement. This time allows avoiding
the no linear part of a reaction
Format hh:mm:ss (hours:minutes:seconds)
* Scaling
Auto or Manual
Scaling: Auto **
The spectrophotometer adjusts the scaling of the axes (minimum and maximum value of the axis) to the
measured values while measuring. The entire curve is always visible.
Scaling: Manual
Abs min.
Abs max.
The scaling of the axes (minimum and maximum value of the axis) is permanently set manually.
- Press on F4 key [Next]. It displays:
* Measurements/interval
1/interval or Max./interval
Here, it is possible to define how many measurements will be carried out per interval.
The setting affects the calculation of the slope of the individual intervals.
The displayed slope for an interval is determined as follows, depending on the profile:
Measurements/interva
l
1/interval
Max./interval
Slopes
Difference of two measured values (2 points calculation)
Slope of the straight line determined in an interval by
linear regression
* Katalytic activity
YES or NO
Katalytic activity
NO
YES
Result
Total slope report to the minute
Total slope report to the minute multiplied by a factor
188
Kinetics mode
* Factor
Factor multiplying the average slope report to the minute.
* Units
i.e.: µkat (10 characters maximum).
* Resolution
From 0 to 3
Number of digits, after comma, for the result.
- Press F4 key [Complete] to leave the programming.
10.3 Method saving
- Methods are automatically saved in memory.
10.4 Method deletion
<HOME>
Kinetics,
– Select method
– [Setup]
– Edit method
- [Delete]
- Select the method to be deleted with « ▲ » and « ▼ » keys. Confirm with <START ENTER> key.
- Press F1 key [Setup]. It displays:
Kinetics mode
- Select “Edit method” with « ▲ » and « ▼ » keys. Confirm with <START ENTER> key.
- Press F3 key [Delete].
- Answer « Yes » to the following message « Delete method? ».
The method is then deleted.
10.5 Method selection
<HOME>
Kinetics
The methods list is displayed.
The methods are classified by method number.
Selection of one method:
- Select a method with « ▲ » and « ▼ » keys.
The active selection is displayed in reverse video.
- Press on <START·ENTER> key to confirm the method choice.
The spectrophotometer is operational.
189
190
Kinetics mode
10.5.1 Limitation of methods list
If the list is very long, it is possible to narrow down the methods list and thus make the search easier as follows:
- Press on F4 key [Last used]; it is possible to restrict the method list to the ten methods last used.
- With the search function, it is possible to search certain character strings in the list. The search takes place
as a full-text search of the entire list contents.
Thus the operator can search for a method number or name.
10.5.2 Research function
Search for a character string:
- Enter the character string to be searched for in the search window with <A...9>.
The list appearing below shows all methods containing the character string. This methods list is updated with
each character that is entered.
Remark
Note the case sensitivity when searching.
10.6 Method application
<HOME>
Kinetics
- Select a method with « ▲ » and « ▼ » keys and- Press on <START·ENTER> key to confirm the method
choice.
It displayed:
Kinetics mode
191
- Press <ZERO BLANK> key.
When zero is done, it displays:
- Insert sample.
- Press <START ENTER> key to start the measurement.
The spectrophotometer starts recording automatically.
- Wait the end of measurement.
Stopping the recording:
- Press on F4 key [Stop] to terminate the recording prematurely. The curve recorded up to this point can be
stored and edited (see paragraph 12.8.3).
- Press on <ESC> key to completely cancel measurement. The curve recorded up to this point is discarded.
After the specified Duration has expired, the cursor appears.
192
Kinetics mode
- Press on <START ENTER> key to run a new measurement.
10.7 Method editing
<HOME>
Kinetics,
– Select method
– [Setup]
– Edit method
- Enter in « Kinetics » mode.
- Select a method with « ▲ » and « ▼ » keys, confirm with <START ENTER> key.
- Press F1 key [Setup]. It displays:
- Select « Edit method » with « ▲ » and « ▼ » keys, confirm with <START ENTER> key.
Kinetics mode
193
10.8 Kinetics treatment
10.8.1 Printing kinetic curve
- Press <PRINT> key to output the kinetic curve to a connected printer as a graphic.
10.8.2 Cursor
The cursor consists of a horizontal and vertical line that crosses each other on a point of the curve. A box
names the x and y values of the point of the curve.
Move the cursor along the x axis (time axis) with « ◄ » and « ► » keys. By this way, it is possible to trace and
evaluate the curve point by point.
These points are corresponding to the measurement interval.
10.8.3 Saving kinetic curve
- Press <STORE> key to save the kinetic curve.
As the memory location, it is possible to select the spectrophotometer memory (Internal DataB folder) or a
connected USB memory at the USB-A connection (USB memory).
If the operator forgot to save the curve, this one is nevertheless kept in memory under the name of "date kineticsBackup.csv".
10.8.4 Loading a stored kinetic curve
<HOME>
Kinetics
– [Open]
- Press F4 key [Open].
The list with the stored kinetic records (Internal DataB folder) is displayed.
- Press F1 key [Location] to select another memory location of the kinetic record (USB memory) for a USB
medium at the USB-A connection).
- Select the kinetic curve and confirm.
The original view of the curve is displayed.
194
Kinetics mode
10.8.5 « Edit » Menu
10.8.5.1 Slope
<HOME>
Kinetics
– [Open]
- [Edit]
- Slope
Calculation of raw slope (without factor)
* Katalytic activity = NO
- Press F3 key [Edit].
- Select « Slope ». It displays:
* « Interval » column
It is the number of measurement interval.
* « Slope [Δ/min] » column
It is the slope report to the minute per interval.
* « Time [s] » column
It is the time at the end of each interval.
* Total slope
It is the slope, report to the minute, of the straight regression line passing through various points of measurement.
Calculation of the activity
* Katalytic activity = YES
- Press on F3 key [Edit].
- Select « Slope ». It displays:
Kinetics mode
195
* « Interval » column
It is the number of measurement interval.
* « Slope [Δ/min] » column
It is the slope report to the minute per interval.
* « Time [s] » column
It is the time at the end of each interval.
* Total slope
It is the slope, report to the minute, of the straight regression line passing through various points of measurement.
* RESULT
It is the slope, report to the minute, of the straight regression line passing through various points of measurement, multiplied by the factor and expressed with the resolution and unit selected by the operator.
10.8.5.2 Printing activity
- Press on <PRINT> key.
UviLine 9100 7449001 1.18
Willy
04/10/2008 14:05:46
4001: TEST01
Katalytic activity:
8.754 µkat
Interval
1
2
3
4
Total slope/mn
Slope [Δ/min]
-0,294
-0,942
-0,882
-0,588
-1,353
Time [s]
30 s
60 s
90 s
120 s
120 s
10.8.5.3 Kinetics comparison
Load a second kinetics curve into the same diagram for direct comparison.
- Press on F3 key [Edit].
- Select « Compare kinetics ».
- Select another kinetics curve. Confirm with <START ENTER> key. It displays:
196
Kinetics mode
To come back to a normal screen (first selected kinetics curve):
- Press on F1 key [Back].
10.8.5.4 Subtraction of a kinetic curve from one another
<HOME>
Kinetics
- Select method
– [Open]
- [Edit]
- Subtract kinetics
Subtract a stored kinetics curve from the current kinetics curve.
- Press on F3 key [Edit]
- Select « Subtract kinetics ».
- Select a kinetics curve. Confirm with <START ENTER> key.
The curve resulting of this operation can’t be saved in memory.
To come back to a normal screen (first selected kinetics curve):
- Press on F1 key [Back].
WARNING: To subtract one kinetics curve from another one, the intervals have to be identical.
10.8.6 Manual change of absorbance scale
<HOME>
Kinetics
- Select method
– [Open]
- Select a kinetics curve
- [Setup]
- Scaling
- Manual
- Press on F1 key [Setup], select « Scaling » and then « Manual » to determine manually the absorbances
scales (Y axis).
- Enter the absorbance minimum and maximum.
Kinetics mode
10.9 Printing curve
- Press <PRINT> key to print the curve on a connected printer.
UviLine 9100 7449001 1.14
Administrator
04/10/2008 14:05:46
4003
197
198
11 Memory
11.1 General view
Memory
Memory
Measurement data
Concentration
Absorption / % transmission
Multi-wavelengths
199
Saving and exporting
Measurement datasets of these modes are saved with
<STORE> or AutoStore in the measured value memory
of the spectrophotometer first (1000 locations).
The measured value memory is available via the Measurement data memory menu.
Here it is possible to view or filter stored measurement
datasets or export them into a PC readable file (*.csv)
(<STORE>).
Csv files of these modes cannot be imported back into
the photometer.
Spectrum
Kinetics
Measurement datasets of these modes are saved and
exported as a PC readable file (*.csv) with <STORE>.
Csv-files of these modes can be re-imported and viewed
on the photometer.
As the location for the PC readable files (*.csv) to be stored, it is possible to select for each export either the
spectrophotometer (Internal DataB folder) or an external memory (USB memory).
Later it is possible to transmit the files stored in the photometer (Internal DataB folder) to a connected PC or an
external memory (USB memory).
It is possible to transmit to a USB memory either individual files with measuring data or all files stored in the
Internal DataB folder.
11.2 Memorized results
11.2.1 Composition
A complete measurement dataset consists of:
- Consecutive number (is automatically assigned by the spectrophotometer).
- Date/time.
- Identification (e.g. ID or "AutoStore").
- User name.
- Measured parameter, e.g. method number, dilution, wavelength (depending on the measuring mode).
- Measured value with unit and if necessary citation form.
11.2.2 Operation on memorized results
Measurement datasets can be
• Stored (see paragraph 11.3.3).
• Displayed and printed (see paragraph 11.3.1).
• Filtered, i.e. selected or hidden based on certain criteria (see paragraph 11.3.4).
• Deleted (see paragraph 11.3.5).
• Copied (see paragraph 11.3.6).
200
Memory
11.3 Management of memorized results
11.3.1 Displaying results
From main menu
<HOME>
– [General setup]
– Measured value memory
From concentration menu
<HOME>
- Concentration
– Choice of a memorized method
- [Setup]
– Measured value memory
From Absorption/Transmission menu
<HOME>
- Absorption/Transmission
- [Setup]
– Measured value memory
From Multi-wavelengths menu
<HOME>
- Multi-wavelengths
– Choice of a memorized method
- [Setup]
– Measured value memory
Each one of these possibilities displays the contents of the measurement data memory in the form of list in the
following way:
- Select « Measurement data memory » with « ▲ » and « ▼ » keys and confirm with <START ENTER> key.
Memory
201
If there are more datasets available than can be displayed, the arrows « ▲ » and « ▼ » displayed additionally.
27.03.07 14:00 3.50 mg/l Ni Administrator AutoStore
indicates that filter settings are active. In this case, only those datasets are displayed that correspond
Filter
to the selected filter criteria (see paragraph 11.3.4).
11.3.2 Transferring results
11.3.2.1 Adjustment for results transmission
11.3.2.1.1 Decimal separator for csv-Files
<HOME>
– [General setup]
– Data transfer/Printer
- Decimal separator for csv-Files
For the output of CSV files, it is possible to select a comma or point as the decimal separator.
- Select Point (12.34) or Comma (12,34).
11.3.2.1.2 Data format
<HOME>
– [Configuration]
– Data transfer/Printer
- Data format (print
When printing measurement datasets, it is possible to select a short or long version with different information
contents.
- Select Short or Extended
11.3.2.1.3 Baud rate for RS232 interface
<HOME>
– [Configuration]
– Data transfer/Printer
- Baudrate for printer
For printers run at the RS232 interface the baud rate can be set.
- Select 1200, 2400, 4800, 9600 or 19200
11.3.2.2 Transferring data to printer
Data printing is available with the following printers:
Dot matrix printer connected on the RS232 interface.
Standard printer (ink or laser) connected to the USB-A port
202
Memory
The printer icon
indicates that the display contents can be printed. To print, press <PRINT> key.
The complete displayed list is then printed. The filter settings are applied to this printing operation.
11.3.2.3 Transferring data to PC + Hyper terminal
The data can also be received by a PC with a terminal program instead of a printer. For this the PC is connected to the photometer via the RS232 interface. The output is identical.
11.3.3 Recording results
11.3.3.1 Manual recording
After each measurement, it is possible to store the measurement data manually with the <STORE> key. It is
stored in the measurement data memory. The memory symbol
in the header indicates that the measurement data displayed on the screen is ready to be stored. With the measuring modes, Concentration and Multi
wavelengths there is the additional option to automatically store all new measured values at the time of the
measurement (AutoStore, see paragraph 11.3.3.2).
When storing manually, an input field for the identification (ID) appears after pressing the <STORE> key. Here
it is possible to enter an individual combination of alphanumeric characters for later easier identification of the
measurement datasets. 30 digits are available for this.
WARNING: MODE « Absorption / % transmission »
In « Absorption / % transmission » mode, the « AutoStore » function is not operational for data acquired during
this measurement.
If the operator wants to store data, he has to use <STORE> key. So, all results acquired during last measurement will be stored under the names given by the operator.
11.3.3.2 Automatic recording with « AutoStore » function
<HOME>
Concentration or
Multi-wavelengths
– [Setup] or [General setup] from main menu
– Measured value memory
– [Setup]
– AutoStore
- Press on F1 key [Setup]. It displays:
Memory
203
For the measuring modes, Concentration and Multi wavelengths, it is possible to save every measured value
automatically with (AutoStore) function.
All automatically saved measurement datasets are given the label "AutoStore". If the same measurement dataset is manually saved using (<STORE>) key, the "AutoStore" label is overwritten by ID code given by the
operator.
- Select « AutoStore » with « ▲ » and « ▼ » keys and confirm with <START ENTER> key.
at the end of « AutoStore » indicates that the function is active. If this function is not active, it
The symbol
means that data will be saved manually only with <STORE> key.
Remark
The AutoStore setting is only valid for the measuring modes Concentration and Multi wavelengths.
11.3.4 Filtering results
11.3.4.1 Filtering a results group
<HOME>
Concentration,
Absorption / % Transmission or
Multi-wavelengths
– [Setup] or [General setup] from main menu
– Measured value memory
– [Setup]
– Filter
It is possible to select a result or a group of results with the “Filter” function.
The functions display, delete and download stored measurement datasets refer to all stored measurement datasets that correspond to the specified filter criteria.
Filter criteria
The following filter criteria can be set:
204
•
•
•
•
•
Memory
Mode (Absorption / % transmission and Multi-wavelengths)
User
ID (identification)
Date (date from ... to ...)
Method (for the measured parameters, Concentration and Multi-wavelength)
- Select « Filter » with « ▲ » and « ▼ » and confirm with <START ENTER> key. The setting filter menu appears:
- Set the filter criteria.
- Press F1 key [Reset entry] if necessary to deactivate any selected filter criteria.
- Press F4 key [Apply] to confirm the filter selection.
The Measurement data memory list is displayed.
The following information is displayed additionally:
- Current memory allocation
)
- Active filter criteria (Filter
Remark: Alternatively, it is possible to hide measurement datasets that meet the specified filter criteria with
the “Selected values: invert selection” function (see paragraph 11.3.4.2).
Memory
205
11.3.4.2 Filters inversion
<HOME>
Concentration,
Absorption / % transmission or
Multi-longueurs d'onde
– [Setup] or [General setup] from main menu
– Measured value memory
– [Setup]
– Selected values: invert selection
With the “Selected values: invert selection” function, it is possible to hide all measurement datasets that correspond to the specified criteria of the filter (see paragraph 11.3.4).
Remark: It is possible to use this function to select and delete measurement datasets no longer used.
The list of the results which are not taken into account in the criteria of selection is displayed. These results are
isolated from the results taken into account by the criteria of selection.
11.3.4.3 Filtering a single result
<HOME>
Concentration,
Absorption / % transmission or
Multi-longueurs d'onde
– [Setup] or [General setup] from main menu
– Measured value memory
– [Single value]
- Select the result to be displayed with « ▲ » and « ▼ » keys.
- Press F2 key [Single value]. It will display:
206
Memory
Following data are displayed:
- memorized sequence number of the result.
- measurement date.
- measurement time.
- operator name.
- storage setting.
- analyze name.
- parameter concentration.
- citation form.
- dilution rate.
- absorbance
- Press on F2 key [List] to come back to all results.
11.3.5 Deletion of results
There are several ways to delete the results.
11.3.5.1 Deletion of selected single results
<HOME>
Concentration,
Absorption / % transmission or
Multi-longueurs d'onde
– [Setup] or [General setup] from main menu
– Measured value memory
– [Setup]
– Delete memory (selected values only)
It will delete only results corresponding to the normal or invert selection criteria.
- Select « Delete memory (selected values only) » with « ▲ » and « ▼ » keys and confirm with <START
ENTER> key. It will display:
Memory
207
- Select « OK » or « Cancel »
11.3.5.2 Memory deletion
<HOME>
Concentration,
Absorption / % transmission or
Multi-longueurs d'onde
– [Setup] or [General setup] from main menu
– Measured value memory
– [Setup]
– Delete memory (all values)
It will delete all memorized results.
- Select « Delete memory (all values) » with « ▲ » and « ▼ » keys and confirm with <START ENTER> key. It
will display:
- Select « OK » or « Cancel »
11.3.5.3 Deletion of results
<HOME>
Concentration,
Absorption / % transmission or
Multi-wavelengths
– [Setup] or [General setup] from main menu
– Measured value memory
– [Delete]
It is possible to delete only one result.
Proceed as follows.
- Select the result to be deleted with « ▲ » and « ▼ » keys.
208
Memory
- Press F3 key [Delete]. It will display:
- Select « OK » or « Cancel »
11.3.6 Copying a result file
To backup files with measurement data outside the spectrophotometer, it is possible to copy them to external
media in different ways.
•
•
•
Copying individual files on a USB memory.
Copying of all files on a USB memory.
Copying files on PC
11.3.6.1 Copying single files onto a flash drive
11.3.6.1.1 Spectrum and kinetic curve after measurement
<HOME>
Spectrum,
Kinetics
– Kinetic or spectrum acquisition
– [Open
– Saving or not of spectrum or kinetics
- [Location]
- Select « USB memory »
After measurements of spectrum or kinetics, the user can save his curve spectral or kinetic in a “*.csv” file:
- Press F4 key [Open] to enter in the safeguard sub-menu.
- Press F1 key [Location].
- Select « USB memory ».
- Give a name.
- Confirm with <START/E NTER> key.
If the safeguard, in “*.csv” format were not carried out, the measurement data are lost when the user leaves
the measurement mode.
Remark
With kinetic recordings, the current measurement is always saved in the "KineticsBackup.csv" file for safety
reasons.
11.3.6.1.2 Spectrum and kinetic curve are memorized inside the « Internal file DataB » already
<HOME>
Spectre,
Cinétique
– [Open]
– Downloading of spectrum or kinetics curve
- <STORE>
- [Location]
- Select «USB memory»
Memory
209
- Press F4 key [Open].
- Select a spectrum or kinetics curve.
- Confirm with <START/E NTER> key.
- Press <STORE> key to open save dialog box.
- Press F1 key [Location].
- Select « USB memory ».
- Change the name if necessary.
- Confirm with <START ENTER> key.
11.3.6.1.3 Absorption/Transmission, Concentration, Multi-wavelengths mode
<HOME>
Concentration,
Absorbance / % Transmission
Multi-wavelengths
– [Setup] or [General setup] from the main menu
– Measured value memory
- Selection of files to be exported
- <STORE>
- [Location]
- Select «USB memory»
The measurement data of Absorbance/ Transmission, Concentration and multi-wavelengths are stored in the
measurement data memory first, either automatically (see paragraph 11.3.3.2) or manually (with the
<STORE> key, see paragraph 11.3.3.1).
Data stored in the measurement data memory can be filtered with filter criteria and then exported in the PC
readable in “*.csv” format.
- Press F1 key [Setup] inside one of the measuring mode or [General setup] from the main menu
- If necessary, set any filter criteria with [Setup].
- Press <STORE> key to open a save dialog box.
The spectrophotometer automatically suggests the location, Internal DataB folder, and a file name.
- If necessary, use F1 key [Location] to change the location (USB memory).
- If necessary, change the suggested file name.
- Press <START ENTER> to save the selected results.
Data are saved.
11.3.6.2 Copying all files onto a flash drive
If no PC is directly connected to the photometer, you can very easily transmit all files containing measurement
data from the spectrophotometer (Internal DataB folder) to a connected USB memory.
<HOME>
– [General setup]
– Save all data on USB memory
210
Memory
- Set the USB memory in place.
- Press F1 [General setup] key.
- Select « Save all data on USB memory».
- Wait few seconds. It will display:
- Confirm with <START/ENTER> key.
The entire folder structure of the spectrophotometer is created in the USB memory. The individual files with
measurement data are in subfolders separated by the type of measurement data.
11.3.6.3 Exportation data onto a PC
It is possible to copy measurement data to a PC after they have been stored in csv format.
Measurement data in csv format can be directly imported and processed in spreadsheet programs such as Microsoft. Excel.
Use a USB memory as a temporary storage (see beginning of this paragraph), then connect the USB memory
to the PC on which it will be readable.
Remark
Depending on the country variant, some spreadsheet programs require a certain decimal separator for the correct import of numerical values (comma or point). The decimal separator can be selected in the following
menu:
<HOME> -> General setup -> Data transfer/Printer -> Decimal separator for csv-files.
User management
211
12 User management
There are a user name and a password by fault:
- User name:
- Password:
Administrator
admin
Respect the spaces and the letters size (Capital or small letter).
The functions of the user management are only available for users of the user group, Administrator.
An administrator can:
- activate or deactivate the user management for the spectrophotometer.
- create, change or delete individual user accounts.
The spectrophotometers UviLine 9100 and UviLine 9400 allow the management of up to 100 users. Each user
is a member of a user group with defined user rights.
12.1 User groups
There are three hierarchical user groups:
- Administrator (top level)
- User (user account registered by the administrator)
- Guest (user without user account)
Administrators and users log in to the photometer with their user name and password.
Guests can optionally enter a name for their login. Thus, documented measured values can later be assigned
to the user.
12.2 Details of user rights
Action
Select methods
Execution of methods
Record of results
Deactivate automatic records of the results
Activate or deactivate « users management » function
Edit and modify a method stored in memory
Delete a method stored in memory
Date and time setting
Delete of results stored in memory
Users management
Reset of spectrophotometer setting
Update of the software
Administrator
User
Guest
212
User management
12.3 Activating/deactivating user management
Each user can activate the user management function. If the function is deactivated, each user has administrator rights.
Only members of the user group, administrator can deactivate the user management function.
If the function is active, each user has to log in the spectrophotometer. After the login, the user has certain
rights depending on the user group.
12.3.1 Activating user management
<HOME>
[General setup]
– User management
- Select « YES » and confirm.
The user management function is active.
12.3.2 Deactivating user management
<HOME>
[General setup]
– User management
– [Setup]
- Select « Deactivate user management » and confirm. It displays:
User management
213
- Select « OK » and confirm.
The user management function is inactive. Each user has administrator rights.
REMARK
If the user management is deactivated by a user of the Administrator user group, all user accounts that were
set up are lost. The password for the administrator is reset to "admin".
12.4 Creating, editing, and deleting a user account
Bei aktivierter Benutzerverwaltung kann ein Benutzer mit Administratorrechten Benutzerkonten verwalten.
12.4.1 Creating a user account
<HOME>
[General setup]
– User management
– [Add]
During the creation of a user account, the Name, User group and Password are defined.
1 Press F2 key [Add].
The input field for the new user name opens up.
2 Enter the user name (<A...9>) and confirm.
The selection field for the user group (Administrator / User) opens up.
3 Select and confirm the user group.
The input field for the password opens up.
4 Enter the password (<A...9>) and confirm.
The user account is created and appears in the list of user accounts.
214
User management
12.4.2 Editing a user account
<HOME>
[General setup]
– User management
– [Change]
At the time of the modification of a user account, it is possible to modify the membership of User group and
the Password. Only the user having an Administrator account is authorized to make these changes.
1 Select a user account.
2 Press F4 key [Change] to modify the user account.
The selection field for the user group (Administrator / User) opens up.
3 If necessary, select and confirm another user group.
The input field for the password opens up.
4 If necessary, enter (<A...9>) and confirm another password.
The user account is changed and appears in the list of user accounts.
12.4.3 Changing password
<HOME>
[General setup]
– User management
– Change password
The administrator creates user accounts and assigns a password on each user account. As soon as a user
opened a session successfully with his user account, it can modify itself the password of his user account.
1 Enter the previous password and confirm.
2 Enter new password and confirm.
The password is modified.
User management
12.4.4 Deleting a user account
<HOME>
[General setup]
– User management
– [Delete]
1 Select a user account.
2 Press F3 key [Delete] to delete the user account.
A security prompt appears.
3 Confirm the security prompt.
The user account is deleted.
13 Various adjustments
13.1 Language selection
<HOME>
– [General setup]
- Language
1 With « ▲ » and « ▼ » keys, select the language.
2 Confirm the selected language with <START·ENTER> key.
The language is selected.
The language actually selected is noted with the symbol
.
215
216
Various adjustments
13.2 Setting date and time
<HOME>
– [General setup]
- Date/Time
The menu « Date/Time » is opened.
1 With « ▲ » and « ▼ » keys, select an option of the menu. Confirm this option with <START·ENTER> key.
The input field which allows entering the current date opens up.
2 Enter the current date with <0...9> keys and confirm.
The input field closes. The date is accepted.
3 Select « Hour » and confirm.
The input field which allows entering the current hours opens up.
4 Enter the current hour with <0...9> keys and confirm.
The input field closes. The time is accepted.
Various adjustments
13.3 Adjusting contrast
<HOME>
– [General setup]
- Display settings
Here, it is possible to adapt the contrast to the lighting conditions.
1 Select and confirm « Contrast ».
An adjustment system using a cursor is displayed to adjust the screen contrast.
2 Adjust the screen contrast by pressing « ◄ » and « ►» keys and confirm with <START/ENTER> key.
3 Come back to the main menu with <ESC> key.
13.4 Reset
It is possible to reset (initialize) the measurement settings or all settings.
Remark
The reset function is only available for users belonging to the user group « Administrator ».
There are different possibilities to reset the instruments settings.
Parameters reset
All settings are deleted except the memory
which contains measurements results, methods
defined by the user and the measured blank
values.
Delivery conditions
All settings (including measurement data
memory and user-defined methods) are deleted
and the spectrophotometer is reset to the delivery condition.
Service lamp counter
Allow to reset to zero the service lamp counter
after the lamp changing
<HOME>
– [General setup]
- Reset
The menu where to select the reset type (Delivery condition / Reset configuration) is displayed.
1 Select and confirm the reset type.
The reset is carried out.
217
218
Various adjustments
13.5 Lamp servicing count down
The photometer counts the operating hours of the lamp. The information on the operating hours of the lamp is
given in the “Info” menu.
For UviLine 9100 the number quoted there corresponds to the number of operating hours of the halogen lamp.
For UviLine 9400 this number corresponds to the number of flashes of the xenon lamp.
Don’t forget to set this counter to zero after changing the halogen lamp of UviLine 9100 (See previous paragraph). The lamp of UviLine 9400 usually does not need to be changed.
13.6 Device information
Following information relating to the spectrophotometers are displayed:
•
Instrument designation.
•
Instrument serial number.
•
Number of the instrument software version.
•
Updating date of the software.
•
Hardware version
•
Hardware status (for servicing).
•
Number of lamp working hour.
•
Results of the tests of the most important parts of the spectrophotometer.
•
Memory status.
•
Registered user.
<HOME>
– [Info]
The information about the instrument and the autotest results are displayed and can be printed.
- Press <ESC> key to come back to the main menu.
Various adjustments
219
13.7 Timer
This « Timer » menu allows storing in memory a waiting time before to start a measurement (Ex: Incubation
time of a reactional mixture). This « Timer » acts like a stop watch.
- Press F3 key [Edit] to enter a delay.
- Press F1 key [Start] to start the time count down.
- Press F2 key [Stop] to stop the time count down.
When the programmed delay is ended,
• The timer displays 00:00:00,
• Its status commutes from « Running » to « Expired » and
• One can hear a “bip”.
•
Press F2 key [Stop] to deactivate the timer.
220
Various adjustments
13.8 Software update
The software and method update is used to continuously update the spectrophotometer.
Remark:
Only users of the user group, Administrator are allowed to carry out a software and method update.
The update comprises
• The newest firmware (meter software)
• New or changed method data
Data transfer to the spectrophotometer can be made with USB medium as a temporary storage.
To realize the update, the new software version or new methods have to be recording on USB medium. This
one has to be connected to the spectrophotometer.
Execution
1 Connect the USB medium to the PC.
2 Unpack the contents and complete folder structure of the downloaded exe or zip file in the main directory
(top level) of the USB medium.
Remark: If an unpacking program such as WinZip is used, the option, "Nutze Ordnernamen" or "Use Folder
Names" must be set.
3 Connect the USB medium to the spectrophotometer.
4 Switch on the spectrophotometer if necessary.
<HOME>
– [General setup]
- Software update
5 Press « ▲ » and « ▼ » keys to select « USB memory » as a source and press <START·ENTER> key.
The update process takes approx. three minutes.
The spectrophotometer switches itself off and then on again.
Note
If the photometer does not correctly start after a software update (e.g. no self test due to a power failure during
the software update): Press the <F3> key and continue the software update.
Maintenance
221
14 Maintenance
14.1 Changing lamp
In this chapter only the change of the halogen lamp of the UviLine 9100 spectrophotometer will be explained.
Indeed, the UviLine 9400 spectrophotometer works with xenon lamp which life time approaches the one of the
apparatus. Any time, if it prematurely stops working, then contact the services of SI ANALYTICS for a change
of this lamp.
The tungsten halogen lamp is a wear part with a certain average service life. It has to be replaced if defective.
The spectrophotometer has a service hour counter for the lamp module (see paragraph 13.6).
Remark
The replacement lamp is readily assembled as a lamp module and optically adjusted in the factory. Therefore,
treat it with utmost care. Fingerprints on the glass will shorten the service life of the lamp. Do not touch the
bulb of the new lamp module with bare fingers. If you have touched the bulb inadvertently, carefully clean it
with a clean cloth soaked in alcohol.
The halogen lamp is located behind a protection cover (Aluminum sheet) at the rear part of the spectrophotometer. To change it, proceed as follows:
2
1
.Fig. 8 Halogen lamp protection cover
1 Switch off the spectrophotometer and disconnect it from the main power.
2 Remove the two screws (1) and remove the lamp protection cover (2).
WARNING
The lamp becomes very hot during operation. Do not touch the hot lamp because it can
cause burns! The lamp should cool down for approx. 10 minutes before it is exchanged.
222
Maintenance
3
4
5
.Fig. 9 Halogen lamp changing
3 Disconnect the electrical plug connection (3). Disconnecting it might take a lot of effort.
4 Unscrew the two knurled-head screws (4) and remove the defective lamp module (5).
5 Fix the new lamp module with the knurled-head screws. When doing so, the metal-plated side of the PCB
must point outward, toward the knurled-head screws.
6 Reconnect the power supply cable.
7 Reinstall the protection lamp cover.
8 Reset the service hour counter for the lamp module (see paragraph 13.5).
Maintenance
223
14.2 Changing buffer batteries
Information
Only use leak proof alkaline manganese batteries. If you leave the spectrophotometer switched on during the
exchange or insert the new batteries within a minute after taking out the old ones, the date and time are retained in the spectrophotometer.
.Fig. 10 Changing buffer batteries
1 Turn on the spectrophotometer upside down and place it on a soft surface.
2 Remove the cover (1) of batteries compartment.
3 remove out of the compartment the old batteries.
4 Insert the four new batteries in the battery compartment. Make sure that the poles of the batteries are in the
correct position.
The ± signs on the batteries must correspond to the ± signs in the battery compartment.
5 Close the batteries compartment cover.
Batteries life time
The power consumption of the clock is very low. The lifetime of high quality batteries is at least 5 years.
14.3 Cleansing
WARNING
The housing components are made out of synthetic materials (ABS, PMMA and PC).
Thus, avoid contact with acetone, ethyl alcohol and similar detergents that contain solvents. Any splashes must be wiped off immediately.
Clean your photometer as follows:
• If the housing surface is dirty, wipe it with a soft cloth and mild soapy water.
• Remove any chemicals splashes as soon as possible.
• For disinfection, you can use isopropanol for cleaning for a short time.
224
Maintenance
14.4 What to do, if …?
14.4.1 Measures if cell is broken
WARNING
Cells can contain dangerous substances. If the contents are released, follow the safety
instructions in the package insert. If necessary, take corresponding protective measures
(protective goggles, protective gloves etc.).
CAUTION
Do not turn the photometer upside down to remove the liquid! When doing so, the liquid could come into contact with electronic components and damage the photometer.
The photometer has a drain device through which the contents of a broken cell can drain off
without causing any damage.
Proceeding after a cuvette is broken.
1. Switch off the spectrophotometer and disconnect it from the main power supply.
2. Let the liquid drain off into a suitable container and dispose of it properly according to the instructions of
the reagent package.
3. Carefully clean the cuvette well using a wet, lint-free cloth.
4. Let dry the cuvette well.
Remark
After recommissioning, check out the spectrophotometer for all measurements.
Maintenance
14.5 Troubleshooting
The spectrophotometer doesn’t switch on
Cause
Remedy
– The power cable is not connected
– Connect correctly the power cable
Acoustic signal when operator presses the key
Cause
Remedy
– The key has not function in actual part of
the software.
– Press another key.
Measurement range undercut or exceeded
Cause
Remedy
– Method not suitable.
- Select another method which has an appropriate measuring range.
- Press another key.
Not stable results
Cause
Remedy
- The cover of cuvette compartment is
opened
- Close the cover of the cuvette compartment
– The halogen lamp arrives at its end life
– Change the halogen lamp
Erroneous measured values
Cause
Remedy
- Cuvette dirty
- Clean the cuvette
- Wrong dilution
- Make a dilution again
- The selected method is not appropriated
- Select another method
- Erroneous zero measurement
- Perform the zero again
– Erroneous blank value
– Measure the blank again
225
226
Connecting accessories
15 Connecting accessories
15.1 Communication interface
3
2
1
.Fig. 11 Back of the instrument with connections
1: RS232C connection.
2: USB-A connection.
3: USB-B connection.
15.1.1 RS232C port
Connect the RS232C interface with the instruments as follows:
• PC: with a commercially available zero modem cable.
• Printer: with a commercially available RS232 printer cable.
The cables are available in specialized computer shops.
Set up the following interface data at the PC/printer:
Baud rate
1200, 2400, 4800, 9600, 19200.
The spectrophotometer baud rate must be
the same as the one programmed on the
used PC/Printer.
Flow control("Handshake")
None
Parity
None
Data bits
8
Stop bit
1
With <PRINT> key, data are sent to the RS232C interface.
• If a printer is connected, data are printed.
• If a computer is connected, data can be received using a terminal program (see paragraph 11.3.2.3).
15.1.2 USB-A port
The USB-A port allows:
• To print data when a printer is connected. With <PRINT> key data are sent on the printer.
• To records data on USB memory (USB key) when it is connected.
• To update spectrophotometer software and methods data.
• To connect an external USB keyboard.
15.1.3 USB-B port
Allows a direct connection between spectrophotometer and PC.
Typ / type / type / tipo
UviLine 9100 & UviLine 9400
Bescheinigung des Herstellers
Wir bestätigen, dass das oben genannte Gerät gemäß DIN EN ISO 9001, Absatz 8.2.4 „Überwachung
und Messung des Produkts“ geprüft wurde und dass die festgelegten Qualitätsanforderungen an das
Produkt erfüllt werden.
Supplier’s Certificate
We certify that the above equipment has been tested in accordance with DIN EN ISO 9001,
Part 8.2.4”Monitoring and measurement of product” and that the specified quality requirements for the
product have been met.
Certificat du fournisseur
Nous certifions que le produit a été vérifié selon DIN EN ISO 9001, partie 8.2.4 ”Surveillance et mesure
du produit” et que les exigences spécifiées pour le produit sont respectées.
Certificado del fabricante
Certificamos que el aparato arriba mencionado ha sido controlado de acuerdo con la norma
DIN EN ISO 9001, sección 8.2.4 „Seguimiento y medición del producto“ y que cumple con los requisitos de
calidad fijados para el mismo.
SI Analytics GmbH
Hattenbergstr. 10
Tel. +49.(0)6131.66.5111
Fax. +49.(0)6131.66.5001
55122 Mainz
Deutschland, Germany, Allemagne, Alemania
E-Mail: support.si-analytics@xyleminc.com
www.si-analytics.com
SI Analytics is a trademark of Xylem Inc. or one of its subsidiaries.
© 2013 Xylem, Inc. Version 130425 US EDV 8252588