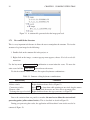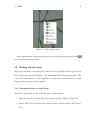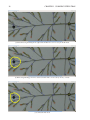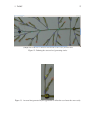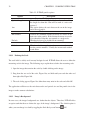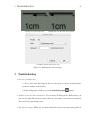
1
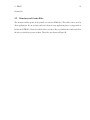
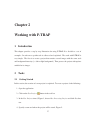
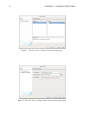
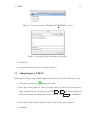
P-TRAP: Panicle Traits Phenotyping Tool
User Manual
Faroq AL-Tam1 : faroq.al.tam@gmail.com, Helene Adam2 : adam.helene@gmail.com,
Ant´onio dos Anjos4,5 : antoniodosanjos@gmail.com, Mathias Lorieux3 : mathias.lorieux@ird.fr,
,Pierre Larmande 2 :Pierre.Larmande@ird.fr, Alain Ghesqui`ere2 : alain.ghesquiere@ird.fr,
Stephane Jouannic2 : stephane.jouannic@ird.fr and Hamid Reza Shahbazkia 1 : shahbazkia@gmail.com
1- DEEI-FCT Universidade do Algarve, 8005-139 Faro, Portugal
2- IRD, UMR DIADE, Genome and Development of Rice group, 911 avenue agroplois, 34000
Montpellier, France
3- CIAT, Agrobiodiversity and Biotechnology Project, Cali, Colombia
4- DCT, ISMAT - Instituto Superior Manuel Teixeira Gomes 8500-508 Portim˜ao, Portugal
5- CCMAR-CIMAR Laborat´orio Associado Universidade do Algarve 8005-139 Faro, Portugal
contact: ptrap.ird@gmail.com
Application website:
http://bioinfo.mpl.ird.fr/index.php?option=com content&view=article&id=67&Itemid=78
2013
2
Contents
Contents
3
List of Figures
5
1 Installation and Main Components
7
1
Introduction . . . . . . . . . . . . . . . . . . . . . . . . . . . . . . . . . . . .
7
1.1
System Requirements . . . . . . . . . . . . . . . . . . . . . . . . . . .
7
1.2
Installation . . . . . . . . . . . . . . . . . . . . . . . . . . . . . . . .
8
1.2.1
Linux . . . . . . . . . . . . . . . . . . . . . . . . . . . . . .
8
1.2.2
Windows . . . . . . . . . . . . . . . . . . . . . . . . . . . .
8
The Main Window . . . . . . . . . . . . . . . . . . . . . . . . . . . .
8
1.3
2
1.3.1
Commands . . . . . . . . . . . . . . . . . . . . . . . . . . .
10
1.3.2
Project Manager . . . . . . . . . . . . . . . . . . . . . . . .
10
1.3.3
Workspace . . . . . . . . . . . . . . . . . . . . . . . . . . .
10
Files . . . . . . . . . . . . . . . . . . . . . . . . . . . . . . . . . . . . . . . .
13
2.1
Images . . . . . . . . . . . . . . . . . . . . . . . . . . . . . . . . . . .
13
2.2
Structure and Grains Files . . . . . . . . . . . . . . . . . . . . . . . .
15
2 Working with P-TRAP
17
1
Introduction . . . . . . . . . . . . . . . . . . . . . . . . . . . . . . . . . . . .
17
2
Tasks . . . . . . . . . . . . . . . . . . . . . . . . . . . . . . . . . . . . . . . .
17
2.1
Getting Started . . . . . . . . . . . . . . . . . . . . . . . . . . . . . .
17
2.2
Adding Images to P-TRAP . . . . . . . . . . . . . . . . . . . . . . . .
19
3
CONTENTS
4
2.3
Working with Images . . . . . . . . . . . . . . . . . . . . . . . . . . .
20
2.4
View the Source Images . . . . . . . . . . . . . . . . . . . . . . . . .
20
2.5
Crop an Image . . . . . . . . . . . . . . . . . . . . . . . . . . . . . .
22
2.6
Scaling Images . . . . . . . . . . . . . . . . . . . . . . . . . . . . . .
22
2.7
Working with the Panicle Structure . . . . . . . . . . . . . . . . . . . .
23
2.7.1
The Structure of a Single Image . . . . . . . . . . . . . . . .
23
2.7.2
The Structure of Multiple Images . . . . . . . . . . . . . . .
23
2.7.3
View and Edit the Structure . . . . . . . . . . . . . . . . . .
24
Working with the Grains . . . . . . . . . . . . . . . . . . . . . . . . .
25
2.8.1
Detecting the Grains in a Single Image . . . . . . . . . . . .
25
2.8.2
Detecting the Grains in Multiple Images . . . . . . . . . . .
28
2.8.3
Color-Segmentaion for grains detection . . . . . . . . . . . .
28
2.8.4
View/Edit the Grains Files . . . . . . . . . . . . . . . . . . .
28
2.9
Collecting the Reports . . . . . . . . . . . . . . . . . . . . . . . . . .
29
2.10
Options . . . . . . . . . . . . . . . . . . . . . . . . . . . . . . . . . .
31
2.10.1
Defining the Scale . . . . . . . . . . . . . . . . . . . . . . .
32
2.10.2
Image’s Background . . . . . . . . . . . . . . . . . . . . . .
32
Troubleshooting . . . . . . . . . . . . . . . . . . . . . . . . . . . . . . . . . .
33
2.8
3
A XML Files
1
Structure XML File . . . . . . . . . . . . . . . . . . . . . . . . . . . . . . . .
35
35
List of Figures
Installation and Main Components
7
1
The Linux installation window of P-TRAP . . . . . . . . . . . . . . . . . . . . . .
8
2
The Windows installation window of P-TRAP . . . . . . . . . . . . . . . . . . . .
9
3
The main window of P-TRAP. . . . . . . . . . . . . . . . . . . . . . . . . . . . .
9
4
The toolbar of the main window. . . . . . . . . . . . . . . . . . . . . . . . . . . .
10
5
P-TRAP project folders. . . . . . . . . . . . . . . . . . . . . . . . . . . . . . . .
11
6
The images editor. . . . . . . . . . . . . . . . . . . . . . . . . . . . . . . . . . . .
11
7
The panicle structure editor. . . . . . . . . . . . . . . . . . . . . . . . . . . . . . .
12
8
The grains editor. . . . . . . . . . . . . . . . . . . . . . . . . . . . . . . . . . . .
13
9
The grains editor can be also used for editing separated grains. . . . . . . . . . . .
14
10
The files that P-TRAP uses/produces. . . . . . . . . . . . . . . . . . . . . . . . .
14
Working with P-TRAP
17
1
The New Project dialog: Select the project type . . . . . . . . . . . . . . . . . . .
18
2
The New Project dialog: Name and location of the project . . . . . . . . . . . . . .
18
3
A new project named “RicePanicleSet IRD2010” is created . . . . . . . . . . . . .
19
4
The Open dialog: Add images to the project . . . . . . . . . . . . . . . . . . . . .
19
5
New images are imported to the project. . . . . . . . . . . . . . . . . . . . . . . .
20
6
View/edit image in the Image Editor. . . . . . . . . . . . . . . . . . . . . . . . . .
21
7
Zoom in/out in the scene in the Image Editor . . . . . . . . . . . . . . . . . . . . .
21
8
Image editor menu. . . . . . . . . . . . . . . . . . . . . . . . . . . . . . . . . . .
22
5
6
List of Figures
9
Scale images in a selected project . . . . . . . . . . . . . . . . . . . . . . . . . . .
22
10
Structure detection notifications . . . . . . . . . . . . . . . . . . . . . . . . . . .
23
11
A structure file generated after the image processed . . . . . . . . . . . . . . . . .
24
12
Circles context menu . . . . . . . . . . . . . . . . . . . . . . . . . . . . . . . . .
25
12
Defining the start and end generating circles . . . . . . . . . . . . . . . . . . . . .
27
13
An error hint generated by the application to allow the user locate the error easily. .
27
14
A grains file generated from processing a panicle image. . . . . . . . . . . . . . .
28
15
The anchors of the grains. . . . . . . . . . . . . . . . . . . . . . . . . . . . . . . .
29
16
Grains number correction. . . . . . . . . . . . . . . . . . . . . . . . . . . . . . .
30
17
The panicle options dialog . . . . . . . . . . . . . . . . . . . . . . . . . . . . . .
31
18
Defining the scale in image. . . . . . . . . . . . . . . . . . . . . . . . . . . . . . .
33
Chapter 1
Installation and Main Components
1 Introduction
P-TRAP is an application for analyzing plant panicle images. It is a cross-platform application
developed in Java and designed on top of Netbeans Platform 7.1. It allows the user to process the
images in a project-based approach. The images to be processed are added to a project and when
analyzed, the intermediary results are saved in separate files. The final results can be collected
in master and details files. Additionally, The panicle structure and the grains are stored in XML
files which can be exported to be used by other applications. Besides this manual, several video
tutorials can be found in the application website.
1.1 System Requirements
1. System: Platform-independent
2. Processor: Core 2 Due or higher
3. Memory: 2 GB or more
7
CHAPTER 1. INSTALLATION AND MAIN COMPONENTS
8
Figure 1: The Linux installation window of P-TRAP
1.2 Installation
1.2.1
Linux
Open the terminal, go to the folder where the grain-linux.sh is located and type: sh grain-linux.sh
The installer window will then appear, Figure 1. Once you press Next button, the installer will
ask you where to put the application and its shortcuts.
1.2.2
Windows
In Windows operating system, locate the file grain-windows.exe and open it. The installer,
Figure 2, will open, click Next button and follow the on-screen simple instructions.
1.3 The Main Window
The main window of P-TRAP is shown in Figure 3. This window has three main areas as
explained in this figure.
1. INTRODUCTION
9
Figure 2: The Windows installation window of P-TRAP
"
!
Figure 3: The main window of P-TRAP.
#
CHAPTER 1. INSTALLATION AND MAIN COMPONENTS
10
#
"
!
!
Figure 4: The toolbar of the main window.
1.3.1
Commands
In the commands area, the tool bar has several buttons with different functionalities explained
in Figure 4
1.3.2
Project Manager
In this area, Figure 5, all files and folders in the project can be dealt with very easily. A context
menu (right-clicked menu), Figure 5b, can be used to manage the files.
1.3.3
Workspace
In Workspace, the user can view and edit: images, structure and grains’ results. In this area,
specialized editors for the images, structure and grains are available. These editors share the
same commands for zooming and moving the scene1 . The ImageEditor, Figure 6, allows the
user to select the region-of-interest and crop the image, Figure 6.
1 In
the editor, the scene is the entire area where the user can work
1. INTRODUCTION
11
(a) Project components
(b) Project components
menu
Figure 5: P-TRAP project folders.
Figure 6: The images editor.
CHAPTER 1. INSTALLATION AND MAIN COMPONENTS
12
(a) Structure editor
(b) Structure editor menu
(c) Structure components menu
Figure 7: The panicle structure editor.
In order to crop the image, first select the area where the panicle is, then click save
.
button. By using the handles of the cropping frame the user can easily choose the exact area to
be crop out.
This editor is used for both editing the grains detected on the branches of the panicle or the
grains used for detecting grains’ traits, Figure 9.
2. FILES
13
(a) Grain editor
(b) Grain editor menu
(c) Grains menu
Figure 8: The grains editor.
2 Files
In this section, the files that the application works with and generates are described. These files
are described and shown in Figure 10.
2.1 Images
The application works on most of the well-known image formates. It supports both the colored
and grayscale images. For better performance, it is better to scale the images as we will see in
14
CHAPTER 1. INSTALLATION AND MAIN COMPONENTS
Figure 9: The grains editor can be also used for editing separated grains.
Figure 10: The files that P-TRAP uses/produces.
2. FILES
15
Section 2.6.
2.2 Structure and Grains Files
The structure and the grains of the panicle are stored in XML files. These files can be used by
other applications. If you are interested to use them in your application please see Appendix A.
In fact, the P-TRAP’s editors described earlier uses these files to visualize the results and allow
the user to visually post-process them. These files are shown in Figure 10.
Chapter 2
Working with P-TRAP
1 Introduction
This chapter provides a step by step illustration for using P-TRAP. It is divided to a set of
examples. In each one a specific task is addressed and explained. The work with P-TRAP is
very simple. The idea is to create a project that contains several images with the same scale
and background intensity (i.e dark or light background). Then process the project with options
suitable for its images.
2 Tasks
2.1 Getting Started
In this section, the creation of a new project is explained. To create a project do the following:1. Open the application
2. Click on the New Project
button in the tool bar
3. In the New Project wizard, Figure 1, choose Rice Processing Project and click Next button.
4. Specify a name and where the project will be stored, Figure 2.
17
18
CHAPTER 2. WORKING WITH P-TRAP
Figure 1: The New Project dialog: Select the project type
Figure 2: The New Project dialog: Name and location of the project
2. TASKS
19
Figure 3: A new project named “RicePanicleSet IRD2010” is created
Figure 4: The Open dialog: Add images to the project
5. Click Finish.
A new project will be then created as shown in Figure 3.
2.2 Adding Images to P-TRAP
In this step one or more images will be imported to the project. To do that, follow these steps:1. Click on the Import Images
button in the toolbar
2. In the Open dialog, Figure 4, locate your images files and click OK. You can choose
single or multiple files to add to the project. Hold ctrl or shift keys during clicking on
the files to select/deselect multiple file. To select all files, press ctrl+A key combination.
3. Click OK, the image will be added to the images folder in the project, Figure 5.
4. Click finish.
CHAPTER 2. WORKING WITH P-TRAP
20
Figure 5: New images are imported to the project.
It is important to note, at this point P-TRAP does not uses the original images. Instead, it
imports a copy of the original ones. So the original images are kept intact.
2.3 Working with Images
This step has some optional tasks if your images do not have huge size (we consider more than
1024 × 1024 as a big image) and do not have labels or additional hand-made marks.
2.4 View the Source Images
To view an image you can do one of the following:1. Double click on the image file in the project, or
2. Right click on the image, a context pop-up menu appears, choose Open Rice Image,
Figure 5b.
3. The Image Editor will then open the image and let you tweak it, Figure 6.
4. Hold the ctrl+mouse wheel to zoom in/out the scene, Figure 7. Please note that, this
key/mouse combination can be used in all editors in P-TRAP to perform the zoom in/out
task.
Besides, this editor has a popup menu to select the color of the grain and background. This is
be used in grain detection task later on this chapter.
2. TASKS
21
Figure 6: View/edit image in the Image Editor.
Figure 7: Zoom in/out in the scene in the Image Editor
CHAPTER 2. WORKING WITH P-TRAP
22
Figure 8: Image editor menu.
(a) Scale images command
(b) Scale images factor dialog
Figure 9: Scale images in a selected project
2.5 Crop an Image
1. Select the cropping area on the image by using the movable and resizable frame, see
Figure 7.
2. Click
.
2.6 Scaling Images
This step allows you to scale your images if they have huge or very small sizes, otherwise it is
not necessary. To scale images do the following:
1. Select the project name.
2. Go to the Tools menu and select Scale images, Figure 9a.
3. In the scaling dialog, choose the scale factor depending on the scale you want to work
with and click OK, Figure 9b.
Usually, 1024 × 1024 images are enough for good processing. However, huge-sized images
have to be scaled down for better processing, especially for the grain detection task. Therefore,
it is strongly recomended to scaledown the images if the grain detection detects only partial
parts of the grains.
2. TASKS
23
(a) Processing progress
(b) Structure processing notification message
Figure 10: Structure detection notifications
2.7 Working with the Panicle Structure
This section describes how to find the structure both for a single image and for all images in the
project.
2.7.1
The Structure of a Single Image
To process a single image in order to find the structure, do the following:1. Select the image file and right click to open the pop up menu, Figure 5b.
2. Choose Find Structure
During processing the panicle image, a progress bar in the status panel of the main window
shows the current situation, Figure 10a. When the processing finished the system will notify
you by a message as shown in Figure 10b.
When the processing finished, a structure file will be added to the result/images folder,
Figure 11.
2.7.2
The Structure of Multiple Images
1. Select the project
2. Click on
button.
CHAPTER 2. WORKING WITH P-TRAP
24
Figure 11: A structure file generated after the image processed
2.7.3
View and Edit the Structure
This is a very important task because it allows the user to manipulate the structure. To view the
structure of a given image do the following:1. Double click on the structure file in the project, or
2. Right click on the image, a context pop-up menu appears, choose View/edit results file
menu item.
Use the key-mouse ctrl+ mouse wheel combination to zoom in/out the scene. To move the
entire scene hold the mouse wheel down and move the mouse.
To edit the structure, Table 2.1 shows the required key/mouse combinations:Table 2.1: Structure editing key/mouse combinations
Functionality
Add a circle
Delete a circle
Connect two circles
Remove a link
To change the type of a circle
Command
Double click
Right click then choose Delete, Figure 12
Hold ctrl key down then while pointing on one circle drag the mouse
Click on the link, then move one of its ends to an empty place
Right click then choose the type you want, see Figure 12
Due to the variation from one panicle to another, the user has to define the start and end
generating points (yellow-colored circles). This is described in details in Figure 12:During post processing the results, the application will show hint if some circles need to be
connected, Figure 13.
2. TASKS
25
Figure 12: Circles context menu
Once you finished the editing and specifying the start and end generating circles, click
to save the changes you have made.
2.8 Working with the Grains
There are two methods to detect the grains. The first one deals with the clustered grains and is
able to detect the grains on the branches. The other method deals with separated grains. This
section deals with both cases. In the beginning we explain how to find the grains of a single
image, then the post-processing is explained.
2.8.1
Detecting the Grains in a Single Image
To process a single image in order to find the grains, do the following:1. Select the image file and right click to open the pop up menu, (Chapter 1, Figure 5b).
2. Choose Find Grains if the image has clustered grains, otherwise choose Find Grains’
Traits
26
CHAPTER 2. WORKING WITH P-TRAP
(a) Select the start generating circle, right click, and then choose Generating from the menu
(b) If the end generating point is not detected, double click to create a flying circle (i.e black)
(c) Connect the new circle
2. TASKS
27
(d) Right click on this new “connected” circle and choose Generating from the menu
Figure 12: Defining the start and end generating circles
Figure 13: An error hint generated by the application to allow the user locate the error easily.
CHAPTER 2. WORKING WITH P-TRAP
28
Figure 14: A grains file generated from processing a panicle image.
Once the application finished finding the grains, it will notify the user by a message. As a
result, a grain file will be generated as shown in Figure 14.
2.8.2
Detecting the Grains in Multiple Images
1. Select the project.
2. Click
button, if the grains are clustered. Otherwise click
button.
A progress bar will appear in the right bottom of the main window to show the percentage
of images being processed. Once it finished, it will show a notification message.
2.8.3
Color-Segmentaion for grains detection
In some cases, the main automatic segmentaton method may have problems finding the acurate
bounds of the grains. For this porpose a manual-guided method is available. In this method, the
user has to specify the grain and background colors. To define these colors:
• Open the image in the image editor.
• Right-click to open a pop up menu as shown in Figure 8.
• select the colors.
To run in color-segmentation mode, toggle ON the color segemention,
2.8.4
View/Edit the Grains Files
To view a grain file do one of the following:
2. TASKS
29
Figure 15: The anchors of the grains.
1. Double click on the grain file in the project, or
2. Right click on the image, a context pop-up menu appears, choose View/edit grains file.
To view the the grains major and minor axes, Figure 15, toggle the View Anchors
button
ON.
Editing the grains file includes adding, removing, and correcting the number of grains. To
add a grain, right click in the place you want to add a grain and then choose add grain. To
remove a grain or a grains’ cluster, right click on the grain and then choose remove grains. For
modifying the number of grains, double click on the grain then write the correct number of
grains, Figure 16.
Once you finish post-processing the grains, click the save button
to save the changes
you have made.
2.9
Collecting the Reports
As mentioned before, P-TRAP generates three reports in Comma Separated Values (CSV) format. Once the processing and post-processing tasks are performed, the final reports can be
CHAPTER 2. WORKING WITH P-TRAP
30
(a) Incorrect number of grains
(b) Edit the number of grains
(c) Corrected number of grains
Figure 16: Grains number correction.
2. TASKS
31
Figure 17: The panicle options dialog
generated by:
1. Select the project
2. Click
button.
When the application finished collecting the results of all images, it will notify the user by
a message. The reports files are shown in Figure 10.
2.10 Options
P-TRAP offers a set of options for the graphical interface and the core process as well. This
sections describes the processing options. The panicle options can be found in: Tools −→
Options menu, then choose Panicle Options, Figure 17. These options are explained in Table
2.2.
CHAPTER 2. WORKING WITH P-TRAP
32
Table 2.2: P-TRAP panicle options
Option
Spikelet Length
1cm
Min distance
Exclude
Method
2.10.1
Description
Structure Finding
Controls the minimum length of the branch, any branch that
has length less than this value will be mark as a noise and
removed.
This option defines the ratio between the cm in the image
and in th real panicle.
Nodes
Controls the minimum distance between two nodes in the
main axis in the panicle. If the distance between two nodes
is less than this value they are counted as a single node.
Which nodes has to be excluded from counting?
Calculation Method
Which method that applications has to use in order to detect the panicle structure? Usually the incremental method
works better.
Defining the Scale
The scale label is widely used in many biological work. P-TRAP allows the user to define the
measuring scale in the image. The following steps explain how to define the measuring scale.
1. Open the image that contains the scale by double-clicking on the image.
2. Drag from the one end of the scale, Figure 18a, and hold until you reach the other end
then right click, Figure 18b.
3. The scale dialog appear, Figure 18c define how many unite in the scale and click OK.
The application will then use the ratio between the real panicle size and the panicle size in the
image to make accurate calculations.
2.10.2
Image’s Background
In some cases, the images backgrounds are darker than the objects. Therefore, P-TRAP offers
an option such that the user defines the type of the image’s background. The default option is
white, you can change it to dark by toggling the Dark Background button
ON.
3. TROUBLESHOOTING
33
(a) Drage on one end of the scale
(b) Righ-click once the other end is reached
(c) Define how many unites in the scale
Figure 18: Defining the scale in image.
3 Troubleshooting
• Not very good detection.
1- Try to scale down the images if they are very large or crop the unwanted background or artifacts at the borders.
2- If the background is dark try to use the dark background
option.
• Unable to save the detected structure. Try to remove all flying circles (black colors) you
can use the right-click menu to remove them all. Also make sure you have determined
the start and end generating points.
• The report is empty. Make sure you have defined the start and end generating points in
CHAPTER 2. WORKING WITH P-TRAP
34
the structure.
Appendix A
XML Files
1 Structure XML File
The structure XML file is compactly describing the structure of the panicle as a mathematical
graph composed of vertices and edges. What is needed to use this file is any XML parser
plugged in your application to convert this file into your graph data structure, by tackling only
the <graph> entity and its components. The entire structure of the file is described as the
following:
• <result signature=“STRUCTUE” imagepath=“18 2 2 1 2 DSC09873.JPG”>
The is the main tag, which means this is a structure result file identified by the signature,
“STRUCTURE”.
• <graph> Describes a graph of vertices and edges, this graph represents the panicle structure.
• <vertices> contains a set of vertices (these are converted to cycles as you can see them
in the application). They describ the junctions and the ends of the panicle structure.
• <vertex id=“java.awt.Point[x=994,y=1282” x=“994” y=“1282” type=“End” fixed=“false”/>
A single vertex. Its attributes are:– id: an identifier of the vertex,
35
APPENDIX A. XML FILES
36
– x and y: the xy-coordinates of the vertices,
– type: the type of the vertex,
– isfixed: true if the vertex has been edited by the user.
• <edges> The edges that connects the graph vertices
• <edge vertex1=“java.awt.Point[x=1047,y=1053]” vertex2=“java.awt.Point[x=1149,y=1015]”/>
an edge that connects two vertices given their identifiers “vertex1” and “vertex2”.