1
RERC Report
Accessible Home Vital Signs Monitoring System
by
Robert Croce and Jenna M. Sullivan
Team #3
Client Contact
Dr. John Enderle
Director and Professor of Biomedical Engineering Program
University of Connecticut
Bronwell Building
260 Glenbrook Road
Storrs, CT 06269-2247
Phone: (860) 486-5521
1 Introduction
1.1 Background
With the aging baby boomer population, home health care is a growing and changing industry.
The advent of telemedicine and advanced communications technology has allowed medical patient
monitoring to move from the hospital to the home. By monitoring patients’ statuses remotely, health care
facilities can free up hospital beds and doctors’ time for more critical patients. An integral part of
remotely monitoring a patient’s condition is the vital signs monitor.
There are many clients who are in need of an accessible home vital signs monitoring system. To
make this device as accessible as possible, we have to address the many needs of all of our clients. An
overview of these needs can be seen in three of our clients: Mat, Sani, and Dolores. Mat is a 52-year-old
male in good physical condition. He is blind and works as a radio commentator. Mat just had a small
stroke, and his doctor wants to monitor his vital signs from home for the next 90 days. Mat does not like
devices that are very technologically advanced, but lives with his vision-impaired wife who loves the
internet. Sani is a 31-year-old female who recently experienced a head injury from an automobile
accident. This accident has left the right side of her body paralyzed (her dominant side). Sani is a lawyer
and is now working part time from home. She must sleep in a hospital bed, and she administers pain
medication to herself using an infusion pump. Her doctor monitors her vital signs by a computer system
that is installed in her home. Sani does not want to appear sick to her family and friends. She would like
a vital signs monitoring device that blends in with the other furniture in her home. Our last client is
Dolores. She is an 86-year-old female who lives with her son, his wife, and her grandson. Dolores is
deaf and has severe arthritis. She also has heart problems that cause her to receive infusions at home.
These infusions are normally administered by one of her family members. Dolores’ grandson Tyler is 11
years old, and he likes all kinds of electrical gadgets. He loves to help his grandmother collect her vital
signs and send them to her doctors on the computer.
1.2 Purpose of the Project
The purpose of this project is to create an accessible home vital signs monitoring system.
Although there are already similar devices on the market, it is our goal to design a monitoring system that
meets our clients’ specific needs. This device will improve our clients’ quality of life by allowing health
care professionals to monitor them from home, rather than from a bed in a hospital or nursing home. Our
clients want to maintain their health, not appear sick to their friends, and continue to live with their
families. The device we design will allow them to do these things. It will be accessible to the vision and
hearing impaired, and it will be cost effective. Most systems available today are very expensive, and our
purpose is to make an affordable device that is also accessible and easy to use.
2 Project Design
2.1 Alternative Design
2.1.1 Thermometer
To measure body temperature, a thermistor circuit will be used. The probe chosen for this is the
Welch-Allyn # 02893-000 Sure Temp 690 Oral Probe from DREMed.com. For our use as an oral
temperature probe, the thermistor needs to be linearized (calibrated) around 98.6° F (37°C), for a
temperature range of at least 90-104° F (32-40°C). After being linearized, the signal will be filtered,
amplified, and then passed to the microprocessor where it will be analyzed and sent to an LCD screen to
be displayed.
1
The thermometer will be tested by placing the probe in a beaker of water heated to a certain
temperature and comparing the resulting temperature given by the thermometer to the actual temperature
of the water. We feel an appropriate temperature range to test this would be from 32°C to 40°C. Final
testing will be done by taking group members’ temperature with the thermometer and comparing the
reading with that taken by a commercial digital thermometer.
2.1.2 Pulse Oximeter
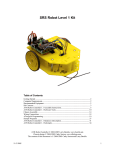
To measure blood oxygen saturation, a pulse oximeter will be used [16]. The circuit design can
be seen in Fig 1. A finger probe will be constructed, rather than bought (to reduce cost). The finger
probe that we will use with our device will need a red LED, a NIR LED, and a photodiode. The LEDs
will be placed opposite the photodiode within a casing that can be clipped to a finger. One LED will
work at a red wavelength (660nm) and the other at a near-infrared (NIR) wavelength (910nm). Also, in
the probe will be a photodetector that will detect the light transmitted through the finger.
Figure 1. Pulse Oximeter Circuit Diagram
Calibration of the pulse oximeter will be done through the lookup table stored on the
microprocessor. Manufacturers of pulse oximeters determine calibration curves or lookup tables for their
devices. The pulse oximeter will be calibrated tested through a pulse oximeter simulator, a device
designed to test the accuracy of pulse oximeters. We plan to find a simulator to use at a local hospital or
the UConn Health Center.
2
Heart Rate
Pulse oximetry will also be used to determine heart rate. There are pulsatile signals detected in
the intensity of the detected light by the photodiode. One pulse is one cardiac cycle. The microprocessor
will count the pulses to determine heart rate (beats per minute), which will be displayed on an LCD
screen. This function will be tested by comparing the heart rate given by the pulse oximeter to that of a
group member taken manually.
2.1.3 Non Invasive Blood Pressure
Blood pressure will be automatically measured through the oscillometric method [15]. The blood
pressure cuff used will be a DRE Adult single lumen cuff from DREMed.com. The cuff will be inflated
by a Sensidyne AA Series Micro Air Pump. A microprocessor, second to the microprocessor controlling
the rest of the device, will control the inflation of the cuff. The sensor used to sense cuff pressure will be
the NPC-1210 low-pressure sensor from GE. Once the pressure sensor determines that the cuff has been
inflated to 160mmHg, the cuff will deflate slowly at a rate of 2-3mmHg/sec. Deflation will occur through
a release valve (brand to be determined).
As blood begins flowing through the brachial artery again, it will cause small pulsations that will
be picked up by the pressure sensor in the cuff. This waveform will be analyzed by the microprocessor to
determine the systolic and diastolic pressures. Due to the safety issues that arise with automatic blood
pressure systems, we have incorporated a “kill switch” into our design [18]. If at any time during the
blood pressure measurement the user wants to stop the inflation of the cuff and rapidly deflate it, they just
need to press the vital signs monitor “On/Off” button. This will cut power to the whole device and open
the pressure release valve. This method bypasses the microprocessor, avoiding any software bugs that an
emergency stop button might encounter.
The automated blood pressure system will be calibrated experimentally. This will be done
through establishing a threshold voltage by which correct pressure measurements for systolic and
diastolic pressures can be made. Final testing of the device will be done by comparing its blood pressure
readings to those of a sphygmometer.
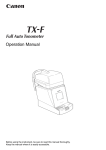
2.1.4 Respiratory Rate
Respiratory rate in this design will be measured using a thermocouple. The thermocouple will be
clipped to the client’s nose and will measure the change in temperature caused by inspiration and
expiration (Fig. 2). The thermocouple will convert the changes in temperature it detects to changes in
voltage. Through experimentation, voltages thresholds will be set to define the changes in temperature
that correspond to inspiration and expiration. By counting the number of inspiration and expiration pairs
that occur in a given period of time, we can determine respiratory rate.
Figure 2. Image of Thermocouple Nose Clip
The voltage from the thermocouple will be linear over our range (approx. 65°F to 98°F), so the signal
from the thermocouple only needs to be filtered and amplified before being A/D converted and processed
by the microprocessor.
As mentioned previously, this circuit will be calibrated experimentally. Voltage output from the
thermocouple will be measured for inspiration and expiration. From these measurements voltage
thresholds will be set for inspiration and expiration. Testing will be done by comparing the readings from
3
our respiratory rate monitor to those taken by the Biopac respiratory belt from the Biopac software used
in the ENGR 166 lab.
2.1.5 Weight
Weight will be monitored by digital bathroom scale. The scale that will be used is the Homedics
SC-200 Digital Scale. We plan on taking apart the scale and breaking the connection between the circuit
and its digital display. From here we will connect the scale’s circuit to our output display. The scale will
already have been calibrated and tested by its manufacturer. We will do additional testing by comparing
known weight values (dumbbells) to the values displayed by the scale when we place the weights on it.
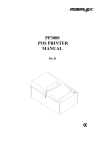
2.1.6 USB Device
Vital signs readings will be stored via a USB flashdrive. This device will then be connected to a
computer to download vital signs. The USB device that we decided to use is the Philips PDIUSBD11.
This device uses I2C technology to connect to the microprocessor. This allows for easy communication
between the two. By writing a computer program in the microprocessor, we will be able to send the data
received by the machine to the USB device and then to the computer.
Figure 3. Sample USB Schematic
2.1.7 Power Supply
The device will mainly be run from an external power source by using a power cord. It will also
be equipped with backup batteries in case of a power failure. For the power supply, we plan on using a
very generic universal power cord, which will plug into the back of our device and then also plug into the
wall. For the backup power supply we determined the best way would be to use nickel cadmium
rechargeable batteries.
2.1.8 Secure E-mail System
In other designs, we sent the vital signs data through a secure website. Another viable option that
we explore in this design is a secure e-mail system. This can be accomplished through certifiedmail.com.
This website provides the software necessary to protect e-mail using transparent encryption. It provides
easy to use software that the recipient of the e-mail does not need to download in order for complete
security to occur. There is no password required and information is automatically secured every time
with the Certified Mail software. It is also possible to track the e-mail to determine that the e-mail was
received and who opened it. A one-time download and $10 per month provides these features.
4
2.1.9 Processing, Display, and Alarm
The processor we are going to use for this design is the Blackfin ADSP-BF535P Digital Signal
Processor by Analog Devices. Like the PIC microcontrollers, the Blackfin contains an internal analog to
digital converter. We will use the PF pins (I/O ports on microcontrollers) on the Blackfin to function as
inputs for the transducers and outputs for the LCD screens and speaker. Due to the Blackfin’s abilities, it
should be the only microprocessor we need for our device. The Blackfin can take C/C++ code as well as
LabVIEW Vi’s.
After the data has been processed the information will be sent to 4 different areas: the LCD
display, the speech module, the speaker, and alarm. The process and parts to produce audio include the
Magnevation SpeakJet IC in conjunction with the TTS256 Text to Code IC to produce speech. To play
these sounds (and the alarm), a commercial .5W, 8 Ohm speaker will be purchased. The alarm will
include audio and visual features that will turn on when the client’s vital signs become abnormal.
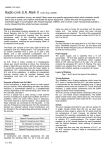
2.2 Final Design
Figure 4. Flowchart of Accessible Vital Signs Monitor Operation
5
2.2.1 Thermometer
To measure body temperature, a thermistor circuit is used. The thermistor is in the form of a
commercially purchased, oral temperature thermometer that was converted into a temperature probe. In
order to reduce costs and make a recognizable probe, a digital thermometer was purchased from CVS and
all of the circuitry pulled out of it, leaving just the casing and the thermistor in the tip. A hole was drilled
in the cap of the thermometer with a drill press so that a cable purchased from RadioShack (6-ft. shielded
cable, 1/8” plug to stripped wires) could fit into the thermometer. The thermistor leads and these cable
leads were soldered to a small piece of PCB, inside the thermometer casing. This completes the
thermometer probe (Fig. 5).
Figure 5. Thermometer Probe with Attached Cable
The thermistor within the probe converts changes in temperature to changes in voltage.
Unfortunately, thermistors are inherently non-linear. This output can be linearized over a small range of
temperatures through the use of a Wheatstone bridge (Fig. 6).
Figure 6. Thermistor Linearizing Circuit [11]
The value of the resistors, R, used to linearize the thermistor will be determined from the reference
temperature and other values given by the manufacturer (β or α) using the above equations. For our use
as an oral temperature probe, the thermistor needs to be linearized (calibrated) around 98.6° F (37°C), for
a temperature range of at least 90-104° F (32-40°C). When linearizing the thermistor, we must be careful
to keep the accuracy of the thermometer high (+ .1°C) so as to be able to take appropriate measurements.
After being linearized, the signal is sent to a3rd order Butterworth low-pass filter to remove any
noise. The cutoff frequency for the filter is about 60Hz to remove any noise from room lights and other
sources ( f c = 1 ) [9]. The final circuit for the thermometer is seen below (Fig. 7).
2πR2 C
6
Figure 7. Completed Thermometer Circuit Including Amplifiers and Filter
Because we did not have the manufacturer’s thermistor coefficient data, we had to determine our
temperature versus resistance curve experimentally to calibrate the thermometer. The thermometer was
calibrated by calculating a curve that relates thermistor resistance to temperature in degrees Fahrenheit.
Calculations yielded the following equation:
T° F =
1
+ 133.199 .
− 2.82857
+ .857143
V0 + 1.65
Final testing done by taking group members’ temperature with the thermometer and comparing the
reading with that taken by a commercial digital thermometer, showed that the thermometer was accurate
to within .5°F.
2.2.2 Pulse Oximeter
To measure blood oxygen saturation, a pulse oximeter is used. Pulse oximetry uses the optical properties
of blood to determine oxygen saturation. Due to the scattering effects of blood, Beer’s Law does not
apply for a pulse oximetry system [19]. Therefore, blood oxygen saturation equations are good for theory
but not for practice [19]. Pulse oximeters are usually calibrated by comparing the oximeter R value (SpO2
ratio) to the oxygen saturation ratio obtained from in vivo samples using human test subjects.
Manufacturers of pulse oximeters do this and determine calibration curves or lookup tables for their
devices. Because of this need for in vivo testing for calibration, even if we constructed a pulse oximeter
from scratch, we would not be able to test it or calibrate it. Therefore, to save time in construction, we
purchased a commercial fingertip pulse oximeter to incorporate into our monitor. The pulse oximeter
chosen is the Drive Reflectance Fingertip Pulse Oximeter (Fig. 8).
Figure 8. Drive Fingertip Pulse Oximeter.
For simplicity, the signal from the pulse oximeter is taken across the photodiode. It was found by
mapping the pins that connect to the ribbon string that connect to the photodiode and power source (Fig.
9).
7
Figure 9. Mapped Pulse Oximeter
Pins 1 and 5 were found to connect across the battery, and pins 2 and 3 connect across the photodiode
itself.
Since the voltage/blood oxygen saturation curves for this pulse oximeter belong to Drive and we
did not have access to them, we calibrated the pulse oximeter by setting a voltage threshold, above which
the LCD screen on the monitor outputs “98% Blood Oxygen Saturation”. This voltage threshold was set
by scoping the outputs of pins 2 and 3, while the pulse oximeter was operating on the finger of a healthy
individual (Fig. 10).
Figure 10. Pulse Oximeter Signal Across the Photodiode
The voltage threshold for when the photodiode is detecting the light transmitted through the finger of a
healthy adult was found to be approximately, 250mV. Though the pulse oximeter in our monitor will not
actually measure blood oxygen saturation, it is included because it is an important vital sign to monitor.
Should we have been able to calibrate a pulse oximeter, we could have constructed one from the pulse
oximeter design in the alternative design.
2.2.3 Non Invasive Blood Pressure
Blood pressure is automatically measured through the oscillometric method [15]. This is done by
wrapping a blood pressure cuff around the upper arm and inflating it until the pressure around the arm due
to the cuff collapses (or occludes) the brachial artery. The cuff is then slowly deflated. As the cuff
deflates, blood starts pumping through the brachial artery causing minute vibrations of .5 to 1 mmHg in
the cuff [4]. The pressure at which these vibrations start is the systolic pressure, and the pressure at which
they stop is the diastolic pressure [5]. When the blood pressure “Start” button on the vital signs monitor
is pressed, the blood pressure cuff is inflated to about 40mmHg above normal (160mmHg). The blood
pressure cuff used is a Large Adult Cuff from CVS (Fig. 11).
8
Figure 11. Adult Large CVS Blood Pressure Cuff
The cuff is inflated by a Hargraves Fluidics CTS Series Micro Air Pump. The microprocessor controls
the inflation of the cuff. The sensor used to sense cuff pressure is the MPX2050. Once the pressure
sensor determines that the cuff has been inflated to 160mmHg, the cuff will deflate slowly at a rate of 23mmHg/sec. Deflation occurs automatically at this rate through the tubing with the help of two pin holes.
A basic circuit for the automated blood pressure system is seen in Figure 12. The pump and valve are
powered by the battery and controlled by the microprocessor. The pressure sensor also receives power
from the battery, and it sends signals to the microprocessor.
Figure 12. Automated Blood Pressure System Circuit
As blood begins flowing through the brachial artery again, it causes small pulsations that are
picked up by the pressure sensor in the cuff (Fig. 13). This waveform is analyzed by the microprocessor
to determine the systolic and diastolic pressures.
Figure 13. Blood Pressure Waveform Picked Up by Pressure Sensor [17]
Where: MAP = Maximum Arterial Pressure
SBP = Systolic Blood Pressure
DBP = Diastolic Blood Pressure
A threshold voltage level has been set by experimentally comparing blood pressure readings from a
sphygmometer to those detected by our pressure sensor. Once pulsations peak above the threshold level,
the voltage is recorded and from that value the systolic pressure determined. The microprocessor
continues to monitor the blood pressure readings, and the diastolic pressure is taken when the voltage
drops below the threshold voltage[18].
Due to the safety issues that arise with automatic blood pressure systems, we have incorporated a
“kill switch” into our design [18]. If at any time during the blood pressure measurement the user wants to
stop the inflation of the cuff and rapidly deflate it, they just need to press the vital signs monitor “On/Off”
button. This will cut power to the whole device and open the pressure release valve. This method
bypasses the microprocessor, avoiding any software bugs that an emergency stop button might encounter.
9
As stated previously, the automated blood pressure system was calibrated experimentally while
relying on the work done by Wattanapanitch et al [18]. This was done through establishing a threshold
voltage by which correct pressure measurements for systolic and diastolic pressures could be made. Final
testing of the device was done by comparing its blood pressure readings to those of a sphygmometer.
Nevertheless, we expected and encountered slight differences in the measurements from our device and
the sphygmometer because of the inherent degree of imprecision in manual blood pressure measurement.
2.2.4 Respiratory Rate
Respiratory rate is measured using a thermocouple. The thermocouple is clipped to the client’s
nose and measures the change in temperature caused by inspiration and expiration (Fig. 14). The
thermocouple converts the changes in temperature it detects to changes in voltage. Through
experimentation, voltages threshold were set to define the changes in temperature that correspond to
inspiration and expiration. By counting the number of inspiration and expiration pairs that occur in a
given period of time, we can determine respiratory rate.
Figure 14. Image of Thermocouple Nose Clip
The respiratory rate probe itself was made with a two-way 3.5mm retractable cable. By pulling the jacks
off each end of the cable, one end was soldered to the thermocouple and the other end to a 3/32” phone
plug.
The circuit for the thermocouple is powered by the battery. The voltage from the thermocouple is
linear over our range of interest (approx. 65°F to 98°F), so the signal from the thermocouple only needs to
be filtered and amplified before being A/D converted and processed by the microprocessor. The
thermistor circuit uses the same low pass filter as the thermometer circuit (Fig. 15).
Figure 15. Circuit for Respiratory Rate
As mentioned previously, this circuit was calibrated experimentally. Voltage output from the
thermocouple was measured for inspiration and expiration (Table 1).
Table 1. Thermocouple Testing Data
10
From these measurements the voltage threshold was set as .535V.
2.2.5 Weight
Weight is monitored through a commercial digital scale (Homedics SC-202 Digital Scale) that is
connected to our device. Determining to connect the scale to the monitor was done through
experimentation. Opening up the scale, two load cells were found at the rear corners. The positive and
negative outputs from these load cells were connected together at the same spot on the PCB (Fig. 16).
Figure 16. Location of Load Cells in Scale
Because the signal from the scale cannot be taken after it has been processed by the microprocessor
within the scale, it was taken from these two load cells. The load cell signal was then processed through
an instrumentation amplifier and filtered (Fig. 17).
Figure 17. Scale Circuit Schematic
The scale itself had already been calibrated and tested by its manufacturer, but we still had to calibrate our
scale (the signal we are processing). This was done by having lab members stand on the scale and
comparing the voltage coming from our circuit to the weight displayed on the digital scale LCD (in
pounds). The equation relating weight to voltage found by this was W = 9000V0 – 32374, where W is
weight in pounds and V0 is the voltage out from the filter of the scale circuit.
2.2.6 Microprocessor
The main component of this system is Microchip PIC16F877 microprocessor shown below. The
PIC16F877 is a 40 pin 8-bit microcontroller that was chosen due to the fact that it is capable of processing
every aspect of the monitor. This chip is required to make every part of the monitor function. Needing
only 5V to power up, the microprocessor was used to read the voltages sent to it by the probes, convert
11
this reading to digital data, and send this result to the LCD display. The analog pins used for analog
inputs were AN0, AN1, AN2, AN3, and AN5. After the voltage was read into the analog pins, the
corresponding digital number was used in calculating the correct number to be sent to the LCD screen.
The internal A/D conveter does this using the following equation.:
Vin
* 1024
5V
Where :
Vin = Voltage input to ana log pin
5V = reference voltage of 5V
1024 = number of bits in A / D
To configure the analog to digital converter, the ADCON0 and ADCON1 registers were used.
The ACON0 register controls the operation of the A/D converter. Each vital sign required its own A/D
conversion. This was done by changing bits 5-3 as needed, to select the appropriate input channel. Also,
FOSC/32 was selected for the conversion clock. The ADCON1 register controls the function of the port
pins. Since all of our inputs were analog, bits 3-0 were configured as “0000”, allowing for all analog
inputs. Also, the result of the A/D conversion was right justified (bit 7). Shown below is a sample of
how the AN0 pin was initialized for the body temperature.
void init_a2dtemp(void)
{
ADCON0=129; // select Fosc/32, AN0, A/D on
ADCON1=128; // select right justify result.
ADON=1;
// turn on the A2D conversion module
DelayMs(50);
}
2.2.7 LCD Screen
The digital information from the output of the microcontroller will be sent to a character LCD
screen (Fig. 18).
http://www.crystalfontz.com/products/1602l/CFAH1602L-YYH-JP_front_bl_on.jpg
Figure 18. LCD Screen
The CFAH1602L-GGH-JP LCD screen is ideal for our design due to its easy to read characters,
ideal size, and wide viewing angles. It measures 122mm x 44mm, with a viewing area of 99mm x 24mm,
and a character height of 8.06mm. Since this screen has a wide viewing angle, clients will have no
problem seeing their vital signs from their bed. Also, the yellow backlight makes this LCD screen easy to
read, especially in dark or dim-lighted areas. The 99mm x 24mm viewing area makes the screens easy to
read from a distance as well.
2.2.8 Speech Output
12
As well as being displayed onto the LCD screen, the vital signs are also spoken. This was made
possible by utilizing the SP03 text-to-speech module, which takes strings of ASCII text and produces the
resulting speech.
Figure 19. SP03 Module Image
This was made possible by the use of RS232 serial communication. The only pins that needed to be used
on the SP03 were the Rx, Tx, ground, and 5V pins. A SP232ACP, 16-pin chip was used to convert the
TTL to serial.
The Rx and Tx pins from the SP03 were connected to the corresponding pins 13 and 14 on the
SP232ACP, then sent to pins 25 and 26 on the PIC16F877. To communicate between the SP03 and
microchip, USART was used. This communication allows the SP03 to speak a line of text, by sending it
a sequence of commands.
Figure 20. SP03 Commands
To send the SP03 a line of text, a small subroutine had to written. This subroutine, programmed in C,
allows the microchip to send the SP03 text one character at a time. To play these computer generated
sounds, a speaker was used.
2.2.9 Secure Website
After the client’s vital signs have been gathered and recorded, they need to be sent to their
primary healthcare provider. To maximize client privacy, an encrypted, password protected website is
used, to which the client can upload their vital signs. To ensure that the website is secure, HTML
encryption software will be used to encrypt the contents of the website, allowing only those with the
correct username and password to access it. This website is currently being stored on the BME server.
An approved username and password are required to enter the site. When access is granted, the user is
brought to a page where they can choose to upload any files on their computer. Once the file(s) are
uploaded, they are saved to a database on the server. The user can then download these files or leave the
website. A physician or remote healthcare provider can access these files through the same site sequence.
13
2.2.10 Power Supply
To power the monitor we are using an 11.4V lithium ion rechargeable battery pack
Although lead acid batteries can sometimes produce more voltage, lithium ion batteries are safer and will
recharge quicker. These batteries are internal to the device and can be recharged with the included wall
charger. The need for a rechargeable battery is so the client can take their vital signs even if the power is
gone and so that the system can be portable.
Regarding the power source, it will be in charge of taking power from a battery and transferring
that power into our system. To bring down the voltage levels, linear voltage regulators are used.
2.2.11 Bluetooth
To increase accessibility, we added a Bluetooth option to transmit the data collected by the vital
signs monitor to the client’s computer wirelessly. The weak signals that Bluetooth uses, combined with
frequency hopping, makes it a secure way to transmit data. The EmbeddedBlue eb505-SER OEM
Bluetooth Serial Module from A7 Engineering provides Bluetooth connectivity for our monitor (Fig. 21).
Figure 21. EmbeddedBlue eb505-SER OEM Bluetooth Serial Module
The interface between our processor and the eb505-SER radio is done through UART communication.
When a connection is made to another Bluetooth device, the link will appear as a cabled serial connection
which eliminates the need for any special wireless protocol knowledge. Assuming that our clients’
computers are not Bluetooth ready, a USB Bluetooth dongle provides connectivity on the PC end.
Our Bluetooth communications system was calibrated through UART communication. It was
programmed to set up a network with the Bluetooth USB dongle when it detects it. The Bluetooth system
was tested by acquiring vitals signs from the monitor and sending them to a computer in the design lab to
which the USB dongle is installed.
2.2.12 Pushbuttons and Casing
Three-buttons were used in our design. This was intentionally done to create an easy and nonthreatening user interface. Two square buttons (one to transmit data, the other to inflate the blood
pressure cuff) with wings (allowing the button to be “snapped” in) are on the front on the monitor. A
rocker switch on the left side of the monitor turns the device on and off. This differentiation between the
function buttons and the on/off switch was also done to increase accessibility and ease of use.
In order to safely enclose the internal circuitry of our design, a plastic enclosure needs to be
manufactured. A casing from BoxEnclosures was ordered and holes for the buttons, LCD screen, and
probes machined in the machine shop and design lab
2.2.13 Accessible Vital Signs Monitor Circuit Diagram
14
Figure 22. Accessible Vital Signs Monitor Circuit Diagram
Figure 23. PCB Diagram of the Board
The previous figure combines all of the above subunits into a circuit diagram. This is a basic diagram of
our complete vital signs monitor (Figs. 22, 23).
2.3 Prototype
2.3.1 Overview
The Accessible Home Vital Signs Monitoring System uses noninvasive existing medical
technologies to monitor a client’s vitals signs from home. It includes probes to monitor six (6) different
vital signs: heart rate, blood pressure, temperature, weight, blood oxygen saturation, and respiratory rate.
A 16x2 character LCD screen displays a client’s vital signs as they are acquired, and a speaker outputs the
spoken vitals signs from a text-to-speech module. A rocker switch on the left side of the monitor turns
15
the device on and off, and four jacks on the right side of the monitor accept probes that acquire 4 of the 6
vital signs. When depressed, a square, red button on the bottom, left corner of the monitor sends the
acquired vital signs to a computer via a Bluetooth module within the device. The square, green button on
the bottom, right corner of the monitor starts the inflation of the blood pressure cuff. A cloth casing and
cover provides style and pouches on the back of the monitor to hold probes and accessories (Figs. 24, 25,
26, 27).
Figure 24. Front View of the Accessible Home Vital Signs Monitoring System Monitor
Figure 25. Side View of the Accessible
Home Vital Signs Monitoring System Monitor
Figure 26. Open View of Top of Accessible
Vital Signs Monitoring System Monitor
Figure 27. Read View of the Accessible Home Vital Signs Monitoring System Monitor
2.3.2 Probes for Vital Sign Acquisition
Four detachable probes are included with the Accessible Home Vital Signs Monitoring System.
Each of the four probes plugs into a jack on the right side of the monitor. All four probe plugs are
different sizes and only fit into one jack on the right side of the monitor.
16
The thermometer probe is attached to a 6-ft cable that ends in a 1/8” phone plug. To use, the probe plug
must be inserted into the corresponding 1/8” phone jack and the thermometer placed under the tongue
(Fig. 28).
Figure 28. Thermometer Probe
The respiratory rate probe included is on a retractable cable. This probe terminates in a 3/32” plug. On
the other end of the probe is a thermocouple which measures changes in temperature (Fig. 29). To
measure respiratory rate, the plug must be inserted into the corresponding 2/32” plug on the right side of
the monitor. Breathing regularly with the mouth closed (through the nose only), the thermocouple end of
the probe must be clipped or held up to the nose so that the thermocouple hangs under one of the nostrils.
Figure 29. Thermocouple Probe on Retractable Cable
To measure weight, a digital bathroom scale is included with a 1/4” phone plug that connects to the
corresponding jack on the monitor. To use only as a bathroom scale, do not plug the scale into the
monitor. When the scale is plugged into the monitor, the weight measured is saved by the microprocessor
and sent with the other vital signs to the computer via Bluetooth. The scale is activated by stepping on it
(Fig. 30.
Figure 30. Digital Bathroom Scale that Can Be Used as a Stand Alone or as Part of the Monitoring
System
The last part to be plugged into the right side of the monitor is the blood pressure cuff (Fig. 31).
17
Figure 31. Blood Pressure Cuff
The cuff plugs into the connector at the top of the right side of the monitor, which leads to the air pump.
For safety, the cuff does not inflate immediately upon power-up of the system. To operate, wrap the cuff
around the upper arm, aligning the artery mark on the cuff correctly. When ready, press the blood
pressure button and the cuff will begin to inflate. The cuff will automatically deflate upon reaching
160mmHg. Should any discomfort occur during blood pressure measurement, the cuff can be
immediately deflated by turning off the monitor (toggle the on/off button on the left side of the monitor to
the “off” position). The blood pressure system measures not only but pressure, but also heart rate.
Blood oxygen saturation is measured through a pulse oximeter that is installed inside the monitor. The
pulse oximeter is mounted to the inside rear of the monitor (Fig. 32).
Figure 32. Pulse Oximeter Mounted Inside the Monitor
The pulse oximeter is accessed through a hole drilled in the top of the monitor. To activate the pulse
oximeter and measure blood oxygen saturation, stick a finger in the rubber-lined hole on the top of the
monitor (Fig. 33).
Figure 33. Pulse Oximeter in Use
2.3.3 Monitor Communications
Upon power-up, the LCD screen displays a welcome message to the user (Fig. 34), which is
echoed auditorally at the same time by a spoken message.
18
Figure 34. Welcome Message Display on the LCD Screen on Power-up
Vitals signs can be acquired in any order, but they must be taken one at a time. As each vital sign is being
measured, a message is displayed on the LCD screen indicating as such (Fig. 35).
Figure 35. Example of the Message Shown While the Monitor is Taking a Vital Sign
Once the vital sign is acquired, it is displayed on the LCD screen as well as spoken by the text-to-speech
module through a speaker on the front of the monitor (Fig. 36).
Figure 36. The Speaker is Mounted Inside the Front of the Monitor, Behind the Speaker Holes in
between the Two Buttons
Once all (or any) of the vital signs have been measured, pressing the red button sends them via
Bluetooth to the computer. The Bluetooth module within the monitor is activated as soon as the device is
powered. A phantom serial port connection is automatically made between the Bluetooth module and the
Bluetooth dongle (also included). If the Bluetooth dongle is not plugged into one of the computer’s USB
ports, the “Send” button will have no effect (Fig. 37).
Figure 37. Bluetooth Dongle Plugged into One of the Computer’s USB Ports
Once the Bluetooth dongle has been plugged into the computer, the Bluetooth module may have to be
installed. To check to see if the Bluetooth module needs to be installed, press the “Send” button and see
19
if the data sends. If the module needs to be installed, the following steps can be followed to do so, once
the monitor and computer have been turned on.
Once the vital signs have been sent to the computer, they can be save (as a text file), and then
uploaded to the secure website. A mock-up of the website is currently held on the Team #3 website on
the BME server (Fig. 38).
Figure 38. Secure Login Site
Once the client logs in, they are taken to a site where they can upload their files (Fig. 39).
Figure 39. Upload Site When the User Can Upload up to Three Files at a Time
Once upload, the client is taken to a site containing the files that they have just uploaded. This site also
allows the vital signs files to be downloaded. A remote healthcare provider can use the same path to
download vital signs files, simply by not entering a file name in the upload field on the Upload Site.
2.3.4 Client Testing
Because our clients our hypothetical, we tested our device with our clients by simulating their disabilities.
The Accessible Home Vital Signs Monitoring System was tested by simulating blindness and dominant
side paralysis. Only the use of the monitor was tested, as from the RERC project brief it is assumed that
the clients can already use a computer or have family or assistants that can use a computer. Multiple
subjects were tested plugging in and using the probes and the monitor.
2.3.4.1 Partial Paralysis
20
Simulating partial paralysis on the dominant side, subjects were able to plug all of the probes into the side
of the device one-handed.
Figure 40. Subject Inserting the
Scale Plug into the Jack
Figure 41. Subject Plugging
Probes in with One Hand
Though it was difficult, the subject was also able to attach the blood pressure cuff using only one hand.
This should not pose a problem to our clients because they all have assistance available at home.
Figure 42. Subject Simulating Partial Paralysis Wrapping the Blood Pressure Cuff Around His Arm
2.3.4.2 Blindness
To simulate blindness, subjects were blindfolded and asked to operate the device. With no description of
the device, subjects were able to plug all of the plugs into the proper jacks, locate buttons, and use the
pulse oximeter.
Figure 43. Subject Using Touch to
Find the Thermometer Probe
Figure 44. Blindfolded Subject
Plugging in the Probes
21
Figure 45. Subject Finding and Operating
the Blood Pressure Button
Figure 46. Blindfolded Subject
Using the Pulse Oximeter
3 Budget
Table 2: Design Budget
ORDER
DATE
Beg.
Budget
1/1/2007
$2,000.00
VENDOR
COST
CREDITS
ITEM RCVD.
DESCRIPTION
1/3/2007
Analog Devices
$48.62
1/15/2007
Blackfin BF535 Processor
1/3/2007
Crystal Fontz
$176.97
1/9/2007
122mm x 44 mm PCB Size, Green LED Backlight
1/3/2007
Crystal Fontz
Whole Sale Point
$26.95
1/3/2007
Digi Key
$16.40
1/9/2007
Credit for returning (5) crystal Fontz LCD Screens
RMA: DP7245
Homedics Digital Bathroom Scale
USB Chip and
Linear Voltage Regulator
1/4/2007
Open Tip
$26.64
1/16/2007
9V Rechargable Battery
1/22/2007
ACRONAME
$115.95
1/29/2007
Devantech Speech Synthesizer
1/30/2007
Newark IN One (w/o shpg)
$4.41
2/1/2007
Infrared LED-Fairchild Semi Conductor
1/30/2007
Omega Eng.
$47.00
1/31/2007
Glass Insulated T/C's 5 PK
1/30/2007
Digi Key
$32.35
2/5/2007
Sensor Pressure, Photodiode 2.xx2.8mm, LED 3mm
$95.79
2/22/2007
1/9/2007
2/13/2007
Hargraves Fluidics
$57.47
2/26/2007
Micropump E-Z Mount
2/13/2007
$172.74
2/15/2007
Fingertip Pulse Oximeter # 18700
2/20/2007
America RX.Com
CT Fluid Power
(without shipping)
$37.60
2/26/2007
Parker Pneumatic Valve
3/28/2007
Amazon
$43.93
3/30/2007
Homedics LED Digital Bathroom Scale
3/28/2007
A7 Engineering
$214.00
3/30/2007
eb505 Development Kits on 50% student sponsor
ship
4/6/2007
Digi Key
$29.04
4/10/2007
Microchip w/2 day shipping
4/17/2007
Battery Space
$56.34
4/20/2007
Li-ion 18650 11.1V Battery & Smart Charger
4/17/2007
Digi Key
$30.06
4/19/2007
PIC18F4620
4/18/2007
Box Enclosures
$38.04
4/20/2007
Instrument Case
4/23/2007
Express PCB
$232.42
4/30/2007
PCB Board
4/25/2007
Digi Key
$29.40
4/26/2007
PIC16F877 Microchip
Newbury Comics
$8.47
3/1/2007
3.5mm retractable cable
Sew on snaps and velcro
TOTAL
EXPENDITURES
$1,624.76
Jo-Ann Fabrics
$10.62
4/25/2007
Target
$13.80
4/25/2007
Pocket Hobo shoulder bag
CVS
$4.23
4/25/2007
Nasal strips
Radioshack
$31.05
4/23/2007
Assorted jacks, plugs, IC sockets, perf. Board
Radioshack
$25.83
4/25/2007
PC boards, resistors
CVS
$10.60
1/19/2007
BP cuff, large
CVS
$7.05
1/9/2007
digital thermometer
Radioshack
$8.46
2/4/2007
mini jack, one-end stripped wire
Radioshack
$42.39
4/4/2007
Bluetooth dongle
Mansfield Supply
$3.70
4/3/2007
1/4" OD Plastic Tee
Newbury Comics
$16.95
3/24/2007
Retractable earbuds
Petsmart
$5.28
4/4/2007
1/4"ID tubing, Air connectors package
$95.79
TOTAL CREDITS:
REMAINING BALANCE
$654.18
Table 3. Estimated cost to manufacture
22
VENDOR
Crystal Fontz
ACRONAME
Omega Eng.
Digi Key
Hargraves Fluidics
America RX.Com
CT Fluid Power
(without shipping)
Amazon
A7 Engineering
Battery Space
Box Enclosures
Express PCB
Digi Key
Radioshack
CVS
CVS
Radioshack
Radioshack
Radioshack
Radioshack
Radioshack
Radioshack
Radioshack
Target
Jo-Ann Fabric
Newbury Comics
Petsmart
Lab
Total
COST
DESCRIPTION
$27.37
$115.95
$47.00
$12.78
$57.47
$151.74
122mm x 44 mm PCB Size, Green LED Backlight
Devantech Speech Synthesizer
Glass Insulated T/C's 5 PK
Sensor Pressure
Micropump E-Z Mount
Fingertip Pulse Oximeter # 18700
$37.60
$43.93
$49.00
$39.99
$17.99
$232.42
$29.40
$8.46
$5.99
$9.99
$42.39
$3.99
$2.99
$3.79
$2.99
$2.99
$2.99
$12.99
$2.99
$15.99
$5.28
$30.00
Parker Pneumatic Valve
Homedics LED Digital Bathroom Scale
eb505 Serial Bluetooth module
Li-ion 18650 11.1V Battery & Smart Charger
Instrument Case
PCB Board
PIC16F877 Microchip
mini jack, cable with stripped ends
Digital thermometer
Large BP cuff
Bluetooth dongle
phone plugs
3/32" phone jacks
Rocker switch
3/32" plugs
Open circuit button
Open circuit button
Pocket Hobo bag
Sew on snaps
Retractable cable
1/4"ID air tubing and connectors
Assorted resistors, capacitors, op amps, wires, etc.
$1,016.46
We’d like to note that this manufacturing cost could be brought down under $1000 by using a 2-layer
PCB instead of 4-layers (we did this due to time constraints) and by constructing a pulse oximeter from
scratch. Taking this things into account would put the manufacturing costs for one unit around $800$900. Either total ($1000 or $800) is far below current vital signs product prices.
4 Conclusion
Though in the end our prototype was never fully functional, it was designed and built with the
principles and performance measures of universal design in mind (as listed by the RERC-AMI website http://www.rerc-ami.org/ami/projects/d/2/udg/). An obvious improvement to the project is the finished
construction of a working prototype, but as everything worked on the boards, we expect that this would
just require more time. Aside from this, an alarm system for dangerous vitals signs (as described in the
alternative design, but never implemented) would be an excellent addition to improve client safety and
health.
As healthcare moves out of the hospital and into the home, reliable technology for
monitoring clients’ health is needed. Vital signs monitors provide basic, yet important, information about
a client’s physical well being. Unfortunately, many of the vital signs monitoring systems available today
are very expensive and inaccessible. Most are designed for hospital use and have complicated interfaces
that do not blend well with the home environment. More devices are needed that are designed
specifically for home use by clients, their families, and caregivers.
The accessible home vital signs monitoring system described in this report fulfills the need for an
accessible, user-friendly, home-use vital signs monitor. The simple 3-button design makes the device
easy to use for all ages and abilities. To provide comprehensive health care monitoring, our device is
designed to record the following six (6) vital signs: body temperature, blood oxygen saturation, heart rate,
blood pressure, weight, and respiratory rate. Accessibility is addressed through the speech module,
auditory and visual alarms, large LCD screens, and buttons customized with Braille or Universal
Symbols. These features allow us to meet the needs of our clients with a device that is accessible to the
hearing and visually impaired, those with motor skills impairment, and clients of all ages.
23
5 References
[1] Al-Nashash, Hasan. “Electrical Safety of Medical Equipment”. University of Sharjah, School of Engineering.
<http://www.ewh.ieee.org/r8/uae/Elect_Safety_Med_Equip.pdf>.
[2] “Basic Statistics About Home Health Care.” National Association for Home Care & Hospice.” 2004.
<http://www.nahc.org/04HC_Stats.pdf>.
[3] “Blackfin Embedded Processor: ADSP-BF535.” Analog Devices. 2006. <http://www.analog.com/
UploadedFiles/Data_Sheets/ADSP-BF535.pdf>.
[4] “Blood Pressure Monitor”, < http://www.circuitcellar.com/fi2003/abstracts/F190abstract.pdf>.
[5] Chua, C.S., and Siew Mun Hin. “Digital Blood Pressure Meter.” Freescale Semiconductor. May 2005.
<http://www.freescale.com/files/sensors doc/app_note/AN1571.pdf>.
[6] DeMarre, Dean A., and David Michaels. Bioelectronic Measurements. New Jersey: Prentice-Hall, Inc., 1983.
[7] “Design and Engineering”. Toolless Plastic Solutions. 2006. <http://www.toolless.com.>.
[8] “Getting Started with Blackfin Processors”. Analog Devices. 2006. <http://www.analog.com>.
[9] “Lineared NTC Thermistor.” eCircuit Center, 2002. <http://www.ecircuitcenter.com Circuits/therm_ckt1/therm_ckt1.htm>.
[10] Northrop, Robert B. Noninvasive Instrumentation and Measurements in Medical Diagnosis. New York: CRC Press, 2002.
[11] Northrop, Robert B. “Class notes”. BME 255. University of Connecticut: Oct. 17 2006.
[12] “Number of current home health care patients, by type of aids, devices used, sex, and race: United States, 2000.” Current Home Care
Patients. Feb. 2004. <http://www.cdc.gov/nchs/data/nhhcsd/curhomecare00.pdf>.
[13] “SpeakJet User’s Manual”. Magnivation, 2004. <http://www.speechchips.com/downloads/speakjetusermanual.pdf>.
[14] “Safe Circuit Design”. All About Electric Circuits, 2003. <http://72.14.209.104 search?q=cache:HYM2hyPm4rcJ:www
.allaboutcircuits.com/vol_1/chpt_3/8.html+circuit+design+safety&hl=en&gl=us&ct=clnk&cd=1>.
[15] Townsend, Neil. “Non Invasive Blood Pressure.” Medical Electronics, Michaelmas Term 2001.
<http://www.robots.ox.ac.uk/~neil/teaching/lectures/med_elec/notes7.pdf>.
[16] Townsend, Neil. “Pulse Oximetry.” Medical Electronics, Michaelmas Term 2001.
<http://www.robots.ox.ac.uk/~neil/teaching/lectures/med_elec/notes6.pdf>.
[17] Volk, Karl R. “Using thermistors in temperature-tracking power supplies.” EDN.
August 2, 2001. < http://www.edn.com/article/CA149117.html>.
[18] Wattanapanitch, Woradorn, and Warut Suampun. “Portable Digital Blood Pressure Monitor.” Cornell University.
<http://www.people.cornell.edu/pages/ws62/>.
[19] Webster, J.G. ed. Design of Pulse Oximeters. Philadelphia: IOP Ltd. Publishing, 1997.
6 Acknowledgements
We would like to acknowledge the following people, to thank them for their support and assistance with
our project:
Rehabilitation Engineering Research Center on Accessible Medical Instrumentation
RERC-AMI National Student Design Competition (funding)
Dr. John Enderle, Client Contact and Advisor
Mr. Willian Pruehsner, Advisor
John Chandy
David Price
David Kaputa
Lisa Ephraim
Jennifer Godino
24
Rich and Serge (Machine Shop)
A7 Engineering (partial sponsorship of Bluetooth development kit)
Emily Dufresne (EmComm)
25