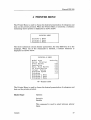
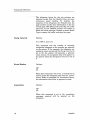
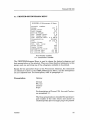
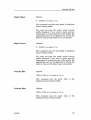
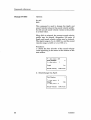
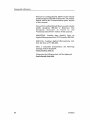
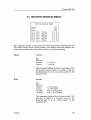
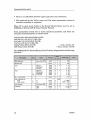
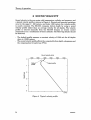
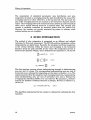
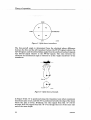
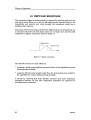
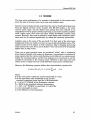
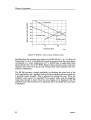
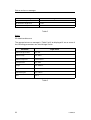
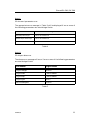
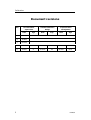
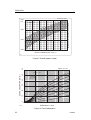
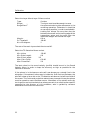
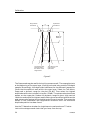
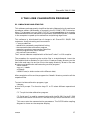
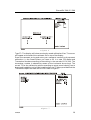
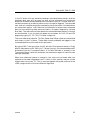
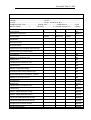
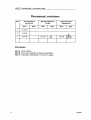
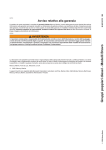
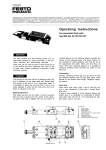
1
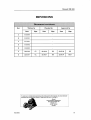
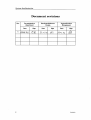
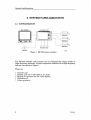
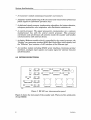
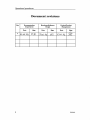
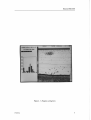
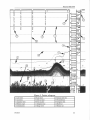
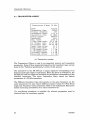
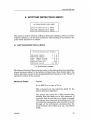
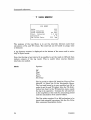
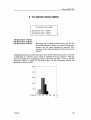
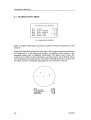
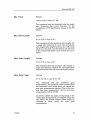
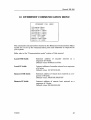
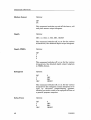
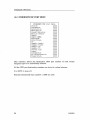
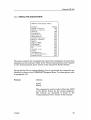
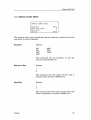
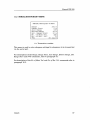
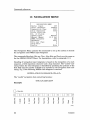
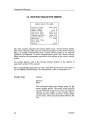
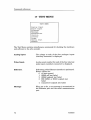
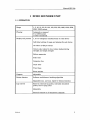
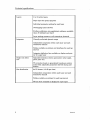
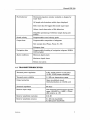
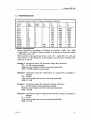
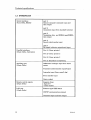
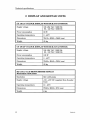
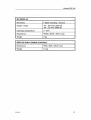
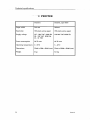
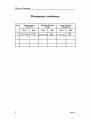
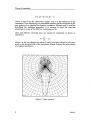
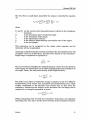
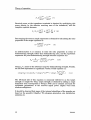
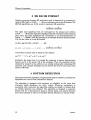
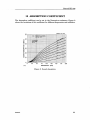
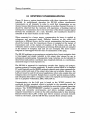
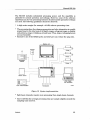
2SHUDWRUPDQXDO
6LPUDG (.
)LVKHU\ UHVHDUFK HFKR VRXQGHU
Maintenance
850-130682 / AA000 / 1-11
EA 500
Maintenance
This section of the manual describes the maintenance to be
performed by the system operator.
850-130682 / B
I
Kongsberg Simrad EA 500 / Base version
Document revisions
Rev
Date
Written by
Checked by
Approved by
A
15.03.96
CL
OL
EF
B
21.10.01
RBr
ESB
GM
C
D
(The original signatures are recorded in the company’s logistic database)
II
850-130682 / B
Maintenance
Table of contents
1
INTRODUCTION . . . . . . . . . . . . . . . . . . . . . . . . . . . . . . . . . . . . . . . . .
1
2
PREVENTIVE MAINTENANCE ACTIONS . . . . . . . . . . . . . . . . .
1
850-130682 / B
III
Kongsberg Simrad EA 500 / Base version
Document history
(The information on this page is for internal use)
Rev.A
Rev.B
IV
First edition as a combined module for EA 500 and EK 500. Was section 5
of P2158E and P2170E.
Document transferred to QS, now only valid for EA 500. No changes to
the text.
850-130682 / B
Maintenance
1 INTRODUCTION
This chapter describes the preventive maintenance to be performed
by the system operator. For details about corrective maintenance,
refer to the EA/EK/ES 500 Service Manual. For information about
error messages, refer to appendix ”Status and error Messages”.
2 PREVENTIVE MAINTENANCE ACTIONS
The preventive maintenance is very limited. When required, clean
the surfaces of the equipment with a soft, lint-free cloth and a mild
detergent. Keep the fan filter of the sounder unit free from dust and
moisture.
For information about preventive maintenance on the printer, refer
to the printer instruction manual.
850-130682 / B
1
Kongsberg Simrad EA 500 / Base version
Blank page
2
850-130682 / B
Simrad EA 500 / EK 500
STATUS AND ERROR MESSAGES
P2265E / 859-043870 / 4AA005
This section of the manual details the status and error messages that may be
displayed by the echo sounder from time to time. All the possible messages
are listed, and an explanation is given for each.
P2265E/F
1
Status and error messages
Document revisions
Rev
2
Documentation
department
Hardware/Software
Design
Project/Product
Management
Date
Sign
Date
Sign
Date
Sign
E
15.03.96
CL
18.03.96
OL
18.03.96
EF
F
22.05.97
CL
22.05.97
HS
22.05.97
RLN
P2265E/F
Simrad EA 500 / EK 500
List of contents
1 INTRODUCTION . . . . . . . . . . . . . . . . . . . . . . . . . . . . . . . . . . . . . . . . . . .
5
2 GENERAL MESSAGES . . . . . . . . . . . . . . . . . . . . . . . . . . . . . . . . . . . . . .
5
3 SIGNAL PROCESSOR (SP) ERROR MESSAGES . . . . . . . . . . . . . . . . . .
3.1 INTRODUCTION . . . . . . . . . . . . . . . . . . . . . . . . . . . . . . . . . . . . . . .
3.2 LIST OF SIGNAL PROCESSOR ERROR MESSAGES . . . . . . . . . .
7
7
8
P2265E/F
3
Status and error messages
Document history
(The remainder of the information on this page is for Simrad internal use).
Revisions:
Rev. A
Rev. B
Rev. C
Rev. D
Rev. E
Rev. F
4
01.02.91
25.06.92
31.08.92
16.06.93
Original edition.
Minor changes to text.
Document updated, minor changes to text.
Document re-formatted to bring it up to Simrad
standards.
Document re-formatted to bring it up to new Simrad
standards. This document now applies for both EA 500
and EK 500 echo sounders.
New error message included (Serial receive overload).
P2265E/F
Simrad EA 500 / EK 500
1 INTRODUCTION
The 500-series echo sounders may issue alarms, errors, warnings and other
messages to the display and external devices (via serial port or Ethernet).
Note that the # sign indicates the number of the transceiver unit affected
(1/2/3). No number is issued for echo sounders with only one transceiver.
Note that the lists include messages for all the echo sounders in the 500
series.
2 GENERAL MESSAGES
All messages starting with "SP-#" concern signal processor no. # (described in
chapter 3).
Message
Explanation
Bottom lost alarm #
Bottom tracking lost for transceiver-#
Display not ready
Display overload (may occur if system unable to update display
with the current ping rate)
External trigger error
Expected trigger pulse not received
Illegal remote parameter
Parameter value of received remote command out of range or
not recognized
Internal error #
*
Internal error 7
Spurious interrupt (caused by badly formed trigger pulses etc.)
LAN interrupt level fault
*
LAN invalid ind. address
The EA 500 local Ethernet address must be an individual
address, i.e. least significant bit of first byte of address must be
zero
LAN invalid multic. adr.
Invalid EA 500 multicast address
LAN multicast table full
*
LAN no command blocks
May appear while CPU is heavily loaded. Regular appearance
of this message indicates a LAN interface terminator or
hardware problem
LAN no transmit blocks
See above
LAN receive overload
Too much data received from LAN (Local Area Network), data
is lost
LAN socket table full
*
LAN too high priority
*
LAN too long message
*
P2265E/F
5
Status and error messages
Message
Explanation
LAN UDP port busy
*
LAN 82586 init error
Unable to initialize 82586 chip. Possible hardware fault.
Maximum depth alarm #
Bottom of transceiver-# has been detected deeper than the
maximum depth alarm setting
Minimum depth alarm #
Bottom of transceiver-# has been detected shallower than the
minimum depth alarm setting
Navigation telegram error
Invalid navigation telegram received
Ping interval warning
Ping interval time exceeded
Printer-1 not ready
Printer-1 not connected, offline or not ready to print yet
Printer-2 not ready
Printer-2 not connected, offline or not ready to print yet
Printer-3 not ready
Printer-3 not connected, offline or not ready to print yet
Rem. annotation received
Remote annotation has been received successfully
Remote command ignored
Remote control received while remote control disabled
Remote parameter entered
Remote parameter received, decoded and entered successfully
Remote request executed
Remote request has been executed successfully
Serial Com. load warning
Too much data is directed to serial port, data may soon be lost
Serial Com. overload
Too much data is directed to serial port, data is lost
Serial line 1 error
Serial port 1 failure
Serial line 1B error
RD display serial port failure
Serial line 2 error
Serial port 2 failure
Serial line 3 error
Serial port 3 error
Serial line 4 error
Serial port 4 error
Serial receive overload
Unable to receive more data on serial port. Data is lost
Unknown error
*
Unknown remote command
Invalid remote command path/parameter received
Unknown transceiver type
Transceiver hardware switch not recognized
Display processor error
Display/graphic processor (80786) malfunction
Disk error 0
File not found
Replay end of file
Replay data not found
Replay bad data
File create error
File open error
File write error
File close error
6
P2265E/F
Simrad EA 500 / EK 500
Message
Explanation
Disk full
External critical alarm
External critical alarm received
External alarm
External alarm received
Table 1
* = Internal software problem encountered. If this error code is displayed, the
incident should be reported to Simrad.
P2265E/F
7
Status and error messages
3 SIGNAL PROCESSOR (SP) ERROR MESSAGES
3.1 INTRODUCTION
The signal processor will read the control parameters sent by the control
processor before initiating a new ping. The program will then test each
parameter against its legal values. If the parameter is found to be illegal, or
the value does not agree with the other settings, an error message code is
sent to the control processor which will issue the error message.
At power-up the signal processors will never start real pinging until all the
parameters are granted. However, in order to receive new information from
the control processor, it will simulate pinging until no errors occur.
If the error message "SP-# not responding error" is shown on the display, the
signal processor has not answered within a time-out period. This error is
probably caused by one of the following hardware errors:
1
No signal processor PCB present.
2
A new PROM set is not properly inserted in the signal processor (check
carefully).
3
The IC used for signalling is defective (U42 = 8255). This may be
checked by inserting a new 8255.
4
The FIFO system on the digital interface pcb is not working properly.
(If the sounder uses multiple frequencies, try exchanging the digital
interface boards).
5
The signal processor is defective (replace the board, if possible).
8
P2265E/F
Simrad EA 500 / EK 500
3.2 LIST OF SIGNAL PROCESSOR ERROR MESSAGES
Note that the # sign indicates transceiver number (1/2/3) and that all error
messages end with "error".
Error message
Legal values
SP-# angle sensi. error
0 to 100 el./mech.
SP-# bandwidth error
0 to 1
SP-# beamtype error
0 to 1
SP-# btm. min. level error
-80 to 0 dB
SP-# btm. max. depth error
0 to 20000 m
SP-# btm. min. depth error
0 to 1000 m
SP-# damping coeff. error
0 to 300 dB/km
SP-# device data error
See note I
SP-# equ. beam angle error
-100 to -1 dB
SP-# FIFO input error
0 to 1
SP-# frequency error
104 to 106 Hz
SP-# heave conver. error
-10 to 10 V/m
SP-# layer data error
See note III
SP-# noise margin error
0 to 40 dB
SP-# not responding error
See paragraph 3.1
SP-# ping mode error
0 to 3
SP-# pitch conver. error
-10 to 10 V/m
SP-# product type error
0 to 1
SP-# pulse length error
0.02 to 10 ms
SP-# roll conver. error
-10 to 10 V/m
SP-# sample interval error
0.005 to 0.5 m
SP-# sound velocity error
1400 to 1700 m/s
Sample tg error
0 to 1
FIFO tg error
0 to 1
SP-# transceiv. mode error
0 to 3
SP-# transceiver HW error
SP-# transd. depth error
0 to 1000 m
SP-# transd. seq. error
SP-# transd. param. error
See note II
SP-# transd. gain error
1 to 100 dB
SP-# transmit power error
0 to 10 kW
SP-# TS phasedevia. error
0 to 10
SP-# TS min. level error
-100 to 0 dB
P2265E/F
9
Status and error messages
Error message
Legal values
SP-# TS min. length error
0 to 10
SP-# TS max. length error
0 to 10
SP-# TS max. comp. error
0 to 6 dB
Table 2
Note I
SP-# device data error
The appropriate error message in Table 2 will be displayed if one or more of
the following parameters are outside legal limits:
Parameter
Legal values
Bottom echogram dots
0 to 200.
Bottom range
0 to 100 m.
Bottom range start
-100 to 100 m.
Echogram dots
0 to 1000.
Range
0 to 10000 m.
Range start
0 to 10000 m.
Sub-bottom gain
0 to 5 dB/m.
TVG
0 to 2.
Table 3
10
P2265E/F
Simrad EA 500 / EK 500
Note II
SP-# transd. parameter error
The appropriate error message in Table 2 will be displayed if one or more of
the following parameters are outside legal limits:
Parameter
Legal values
Alongship offset angle
-20° to 20° mechanical.
Athwartships offset angle
-20° to 20° mechanical.
Three dB bandwidth
0° to 50° mechanical.
Table 4
Note III
SP-# layer data error
The above error message will occur if one or more of the following parameters
are outside legal limits:
Parameter
Legal values
Layer margin
0 to 10
Layer start
-100 to 20000
Layer stop
-100 to 20000
Layer type
0 to 3
No. of sublayers
1 to 50
Table 5
P2265E/F
11
Status and error messages
12
P2265E/F
Simrad EK 500 / EY 500
CALIBRATION OF THE EK 500 / EY 500
P2260 / 859-043867 / AA011
This document contains calibration procedures, procedures to determine the
beam compensation in a split-beam system and procedures for noise
measurements at sea.
P2260/E
1
Calibration
Document revisions
Rev
Documentation
department
Date
2
Sign
Hardware/Software
Design
Date
Sign
Project/Product
Management
Date
Sign
A
01.02.91
-
B
31.08.92
-
C
01.10.93
-
D
28.05.96
CL
29.05.96
RLN
29.05.96
RB
E
20.05.97
Cl
20.05.97
HS
20.05.97
RLN
P2260/E
Simrad EK 500 / EY 500
List of contents
1 THE PURPOSE OF CALIBRATION . . . . . . . . . . . . . . . . . . . . . . . . . . . . . 5
2 CALIBRATION PROCEDURE . . . . . . . . . . . . . . . . . . . . . . . . . . . . . . . . . . 6
3 THE LOBE CALIBRATION PROGRAM . . . . . . . . . . . . . . . . . . . . . . . . . 17
3.1 UNPACKING AND STARTUP . . . . . . . . . . . . . . . . . . . . . . . . . . . . . 17
3.2 OPERATING PROCEDURE . . . . . . . . . . . . . . . . . . . . . . . . . . . . . . . 18
4 NOISE MEASUREMENTS AT SEA . . . . . . . . . . . . . . . . . . . . . . . . . . . . . 24
P2260/E
3
Calibration
Document history
(The information on this page is for Simrad’s internal use)
Revisions:
Rev. A
Rev. B
Rev. C
Rev. D
Original issue
Minor changes to the text.
Minor changes to the text. EY 500 implemented.
Various changes in the procedures. A chapter about the lobe calibration
program is added. Ref. EM 10526.
Rev. E Some uneccessary information removed from pages 16-17, and a few
minor corrections made on page 6, 8, 15 and on the Calibration Report
sheet.
4
P2260/E
Simrad EK 500 / EY 500
1 THE PURPOSE OF CALIBRATION
The EK 500 and EY 500 are scientific echo sounders designed for quantitative
measurements, i.e. measurement of single fish target strength and
measurement of biomass backscattering coefficient. During the calibration a
reference target with a known target strength is lowered into the sound beam,
and the measured target strength is compared with the known target strength.
If it is necessary to adjust the echo sounder, this is performed by changing a
parameter in the mathematical equations in software. Since the echo sounder
is digital right from the receiver front end, there is no analog gain adjustment.
The reference target is normally a metal sphere. Simrad supplies copper
spheres, one for each frequency. The sphere diameter is selected for minimum
temperature dependence.
For acoustic surveys where accurate quantitative measurements are required
it is essential that the echo sounder is correctly calibrated. It is a safe practice
to perform the calibration before and after the survey. If experiences over time
show that no adjustments are necessary, it may be appropriate to reconsider the
need for frequent calibration. Simrad recommends that calibration is performed
at least once a year, and in areas with different summer and winter condition
at least twice a year.
In the following calibration procedure typical settings on the EK 500/EY 500 are
specified:
Ping Interval:
Transmit Power:
Pulse Length:
Receiver Bandwidth:
Transducer Depth:
1 sec.
Normal (applies only for EK 500)
Medium
Wide
0.0 m
If other settings are to be used during the survey, the calibration should be
repeated for these.
A lobe program which can be supplied from Simrad makes the TS gain
calibration procedure a relatively uncomplicated task by using an extra PC
connected to serial line 1 in a split-beam system. This program will be
noncritical with respect to movement of the reference target sphere and it will
enable the inexperienced operator to obtain a good calibration result. This
program should be used whenever possible. This procedure is described in
chapter 3.
P2260/E
5
Calibration
2 CALIBRATION PROCEDURE
Check the hardware installation
Check that the transducer cable is connected to the correct transducer plug on
the rear side of the EK 500 / EY 500.
Check the internal test oscillator
Select the Transceiver Menu and set Mode to Test.
Select the Operation Menu and set Ping Mode to Normal and Noise Margin to
0 dB.
Select the Test Menu/Transceiver.
The amplitude of the internal test oscillator is now displayed. It should be
-55 dB ±2 dB re 1W on a split-beam sounder and -61 dB ±2 dB re 1W on a
single-beam sounder. If the amplitude is outside these limits, disconnect the
transducer cable and check the amplitude to see if the fault is in the transducer
or in the receiver. The amplitude should now be -49 dB ±2 dB re 1 W on a split
beam sounder, and -55 dB ±2 dB re 1 W on a single beam sounder. If the
amplitude is still outside the limits, the problem is probably related to the
receiver. If it is inside the limits, the transducer impedance should be checked.
Rigging
The following rigging description is to a great extent reproduced from ICES
report 144. The vessel should be anchored in calm and sheltered water. The
depth must be sufficient for separation of sphere and bottom echoes. It is
desirable, moreover, to work in water as deep as possible, consistent with
maintaining a stable platform. Both bow and stern anchoring or tying are
recommended. This is illustrated in figure 1.
Placing of winches
Winches should be used to guide and steer lines to the sphere for its
centering in the echo sounder beam. Affix these winches to the deck railing
in accordance with detailed ship drawings. Place the first winch in the
transverse plane of the vessel running through the transducer. If the
transducer is mounted on one side of the keel, place the first winch on the
opposite side of the vessel. Place the second and third winches on the same
vessel side as the transducer and at equal distances from the transverse
section containing the transducer and first winch.
Each winch must be provided with a long spool of 0.60 mm diameter monofilament nylon line, which is marked with small swivels at 5 m intervals,
beginning 10 m from the loose end.
6
P2260/E
Simrad EK 500 / EY 500
WINCH 1
WINCH 3
WINCH 2
(CD481)
Figure 1 Rigging of a vessel for sphere calibration.
P2260/E
7
Calibration
The purpose of the swivels is threefold:
- to unravel rotation of the nylon line
- to mark distances on the line
- to add weight so that the line sinks in water
Attaching the sphere
Prior to commencing the sphere measurements, a rope should be drawn
beneath the hull from the first winch to the second and third winch before
anchoring. Use this rope to pull the line from the first winch beneath the hull
to the side with the second and third winches.
Attach the appropriate sphere, with affixed loop, to the three suspension
lines, refer to figure 1. For the smaller spheres it may be necessary to add a
weight to keep the sphere stable. This is done via a second line attached to
the three suspension lines. The length of the line must be at least two pulse
lengths, so that the echo from the additional weight does not interfere with
the sphere echo. Immerse the sphere in a solution of dishwashing detergent
and freshwater and lift it overboard by the fastened lines without touching
it. The soap helps to eliminate air bubbles attached to the sphere.
Lowering the sphere
Lower the sphere beneath the vessel to the desired distance, for example
25 m, which is determined roughly by counting the swivels on each line.
In general, one should use sphere distances of 15 m or more for 38 kHz or
higher frequencies. This in order to reduce the effect of pulse rise time and
resolution in distance measurements on the calibration results. Software
version 5.30 has corrected for these effects on the TS and s A calibration.
Two further considerations in choosing the range are the transducer
beamwidth and vessel geometry. The physical width of the beam, which
increases linearly with range, should be sufficiently great so that the sphere
echo is unaffected by the small, perhaps pendular movements to which it is
inevitably subjected. The minimal range must also be convenient with
respect to the vessel geometry. In particular, if the suspension lines do not
hang freely, then control of the sphere may be hindered by friction or possible
obstructions on the hull. Despite the number and variety of these considerations, it is seldom difficult in practice to find a suitable range which satisfies
all of the above criteria.
8
P2260/E
Simrad EK 500 / EY 500
Reference target.
Simrad supplies copper spheres designed as reference targets for the calibration
of scientific sounders. Copper is selected because it is a metal which can be
made electrolytically with high purity. The spheres are machined to the perfect
spherical form with great accuracy, and a nylon loop is attached. Except for 12
kHz, 49 kHz and 50 kHz, the sphere diameter is different for each frequency in
order to obtain a target strength with minimum dependence of temperature (K.
Foote 1983). A curve showing the variation of the target strength follows each
sphere. The curve for the 38 kHz sphere is shown below as an illustration.
Simrad copper spheres
Frequency
kHz
Diameter
mm
12*
18
27
38
49*
50*
70
120
200
710
45.0
63.0
42.0
60.0
45.0
45.0
32.1
23.0
13.7
10.3
TS sound at speed 1490 m/s
dB
-40.4
-34.4
-37.9
-33.6
-36.4
-36.2
-39.1
-40.4
-45.0
-50.5
SIMRAD
60 mm COPPER SPHERE
38 kHz
oct.1991
PULSE DURATION
ms
-34.5
TARGET STRENGTH (dB)
-34.0
-33.5
-33.0
* same sphere
1400
3.0
0.3
1420
1440
1460 1480 1500
SOUND SPEED (m/s)
1520
1540
1560
(CD3146)
Figure 2 Target strength
of a 60 mm copper sphere.
P2260/E
9
Calibration
Simrad sept. 1992
1550
lin
Sa
1500
ity
Mackenzie (1981) J.acoust.Soc.Am., 70,807-12.
Del Grosso (1972) J.acoust.Soc.Am., 52,1442-6.
SOUND SPEED IN SEA WATER
at depth 0 m
m/s
40
Sa
lini
ty 0
1450
1400
0
5
15
10
20
25
30
WATER TEMPERATURE (deg. C)
(CD467)
Figure 3 Sound speed in water.
60
SIMRAD sept. 1990
50
FRANCOIS & GARRISON
JASA dec. 1982
35%
10 Degrees C
200 m depth
pH = 8
SA
LIN
ITY
40
30
25
30
20
15
20
10
10
5
0
0
SOUND ABSORPTION (dB/km)
from
0
(CD468)
25
50
75
100
125
150
175
200
FREQUENCY (kHz)
Figure 4 Sound absorption.
10
P2260/E
Simrad EK 500 / EY 500
Centering of split beam
The purpose of this operation is to move the immersed, suspended sphere onto
the acoustic axis of the transducer. First the echo sounder must be set so that
the echo from the sphere is visible on the display.
Note that in the following procedures, references to transceiver 1, 2 and 3, and
printer 1, 2 and 3, only apply to the EK 500 echo sounder. The EY 500 only uses
one transceiver and one printer.
Select the Transceiver Menu and set:
Mode:
Pulse Length:
Bandwidth:
Transducer Depth
Active
Medium
Wide
0.0 m
Select the Operation Menu and set
Ping Mode:
Ping Interval:
Noise Margin:
Normal
1.0 sec.
0 dB
Select the Display/Echogram Menu and set
Range:
Range Start :
Auto Range:
Bot. Range Pres.:
Presentation:
Layer Lines:
Integration Lines:
TVG:
TS Colour Min:
Select a range from the sea surface to well below the sphere
0m
Off
Off
Normal
On
10 000
40 log r
-50 dB
Select the Log Menu and set
Mode:
Ping Interval:
Ping
100
Select the Layer Menu and set
Super Layer:
P2260/E
1
11
Calibration
Select the Layer Menu/Layer-1 Menu and set
Type:
Range:
Range Start:@
Margin:
Sv Threshold:
No. of Sublayers:
Surface
The layer must be wide enough to cover
the sphere echo during the movements in the
centering operation. Otherwise it should be
as narrow as possible, in order to exclude disturbing fish echoes. Be sure that also the
bottom echo as well as the trailing edge of the
transmitter pulse and the echo from the
additional weight are outside the layer.
0.0 m
-80 dB
1
The rest of the main layers should be turned off.
Select the TS-Detection Menu and set
Min. Value:
Min. Echo Length:
Max. Echo Length:
Max. Gain Comp.:
Max. Phase Dev.:
-50 dB
0.8
1.8
6.0 dB
2.0
The best value for the sound velocity (profile) should be set in the Sound
Velocity Menu in order to keep the accuracy as high as possible for the
calibration exercise.
If the sphere is in the beam an echo will now be seen as a steady line in the
echogram. If the sphere furthermore is inside the -6 dB limit on the beam, the
echo will show up as a dot on the TS detection window on the left-hand side of
the screen. This horizontal projection makes it easy to see which way the sphere
must be moved to reach the beam center. Movement of the sphere occurs by
turning of the various hand winches, always one winch at a time and on specific
command by the director of this procedure, who is guided by constant
observation of the echo on the screen.
12
P2260/E
Simrad EK 500 / EY 500
Centering of single beam
In a single beam system there are different methods to position the sphere in
the centre of the beam. In this system the reference sphere, when detected as
a single target, will always appear in the beam centre. Use the TS detection
window to observe the TS value and adjust the position of the reference sphere
for maximum TS value.
A second method is useful if a single beam transducer is located close to a split
beam transducer. When the distance between the centre of the single and split
beam transducers is known, the reference sphere can be positioned using simple
geometry.
Choose the split-beam transducer in the Transceiver Menu, use the TS detection
window and position the reference sphere in the centre of the beam as
previously described (when the sphere is in the centre of the beam, both the
Angle Along and the Angle Athwart in the TS window will be zero degrees).
Calculate the angle " by means of the information regarding the distance
between the two transducers and the distance between the sphere and the
transducers. Refer to figure 5.
WJ '
G
U
d = distance between single beam and split beam transducers
r = distance between the sphere and the transducers
" = refer to the figure
If, for example, the single beam transducer is located 0.6 m directly behind the
split beam transducer, the sphere must be moved straight aft until the Angle
Along shown in the TS detection window is the same as the calculated angle ".
During the movement, the sphere must be kept at the same distance from the
transducer.
The Angle Along corresponds to the calculated angle " and when these angles
are equal, the sphere will have moved 0.6 m and be in the centre of the beam of
the single beam transducer.
Now operate the system with the single beam transducer and read the TS value
in the TS detection window. To check that the sphere is in the centre of the
beam, move the sphere slightly in the athwartships and fore-and-aft directions
and check for increasing or decreasing TS value.
P2260/E
13
Calibration
Single beam
transducer
Split beam
transducer
d
Minimum
distance
r
µ
The sphere after
being moved to
the centre of the
single beam
The sphere in the
centre of the
split beam
(CD3144)
Figure 5
The Scope mode may be useful during this process as well. The scope plot starts
at the beginning of the super layer, and the horizontal axis contains 200 depth
samples. Accordingly, this depth scale is different for the different frequencies.
Check that the sphere is well within the super layer. Select the Test Menu,
Scope and a dynamic range for the plot (50 dB). Then select the highest
amplitude value to be included in the plot (-50 dB). The sphere echo should now
appear on the scope plot. Reduce the dynamic range to give a high vertical
resolution and adjust the highest amplitude to give a convenient plot where the
peak sphere echo reaches the horizontal centre line on the scale. Then move the
sphere in the transversal and longitudinal directions until the maximum
amplitude position has been found.
Use the TS detection window for single beam to read maximum TS value.
Look at the echogram and check that you have, from the top:
14
P2260/E
Simrad EK 500 / EY 500
-
transmitter pulse
upper layer limit (red line)
sphere echo
lower layer limit (red line)
echo from the additional weight (if used)
bottom echo
all well separated, and no other echoes within the layer limits.
TS-measurement
Select the TS-Detection Menu to get the horizontal projection window. With the
sphere in the center of the beam, the TS compensated and the TS uncompensated should be identical. These values are read on the screen underneath
the horizontal projection window. If there is a small difference use the TS
compensated value as the measured TS value. It is recommended that the
measured TS value is logged together with other important information. A
recommended form is attached at the end of this document.
If the measured TS value differs from the known TS value of the sphere, then
calculate a new TS transducer gain:
TS measured - TS sphere
New transd. gain = Old transd. gain + _________________________________________
2
Select the new TS Transducer Gain in the Transceiver Menu and check that the
measured target strength is correct.
In software version 5.20 and higher, TS values have been corrected for TVG
inaccuracies because of the sample intervals and the pulse rise time.
sA - measurement
The calibration of the TS-measurement described in the previous paragraph is
the primary calibration and it will in many cases be a sufficient calibration. The
TS-measurement, however, is based on the peak value of the echo samples in
the sphere echo, whereas the sA-measurement is based on integration
(averaging) of the echo samples. The received echo may have a smoothed rise
and decay. Therefore the algorithm for calculation of sA in the sounder uses an
effective pulse length rather than the nominal pulse length. A test, and if
necessary, a calibration of the sA calculation may be carried out according to the
following procedure.
P2260/E
15
Calibration
Check the cable connection to colour printer-1.
Switch on colour-printer-1.
Select the Printer1 Menu and set
Integrator Tables:
Echogram:
Number of the transceiver in use (if EK 500)
Slave
The echogram recording will then be similar to the one at the display.
Read the measured sA-value, the red number in the integrator table after each
log interval. Calculate the theoretical sA-value as follows:
TS sphere = target strength of the sphere
F bs = backscattering cross section of the sphere
F bs = 10TS sphere/10
r = distance between the transducer and the sphere
(read from the display screen, underneath the horizontal projection
window).
Q = equivalent 2-way beam angle
(from the measurement data delivered with the transducer)
Q = 10dB-value / 10
4Br02 . Fbs . (1852 m/nm)2
sA (theory) =
______________________________________
Q . r2
where r0 = 1 meter is the standard reference distance for backscattering.
If the measured sA-value differs from the theoretical value, this can be corrected
by changing the Sv Transducer Gain in the Transceiver Menu. Calculate a new
transducer gain:
10 log (s A(measured)/sA(theory))
New transd. gain = Old transd. gain + ___________________________________________________
2
Enter the Sv transducer gain in the Transceiver Menu, and the measured sAvalue will be correct.
The calibration report form at the end of this appendix may be used for
recording calibration conditions and results.
16
P2260/E
Simrad EK 500 / EY 500
3 THE LOBE CALIBRATION PROGRAM
3.1 UNPACKING AND STARTUP
This software package greatly simplifies the task of determining the optimum
transducer pattern parameters to be used in the EK 500/EY 500 Transceiver
Menu. The program runs on IBM PC/XT/AT’s and compatibles. It is strongly
recommended to have a mathematics coprocessor (8087/80287/80387) installed
in the computer to speed up the estimation and plotting algorithms.
This software is distributed free of charge to all Simrad EK 500/EY 500
customers. A self-extracting archive contains
- C source code files
- makefile for automatic compilation/linking
- the executable lobe calibration program
- example transducer measurement data files
- archive program with user’s manual
- this manual (manual.doc)
The C source code was compiled with a Borland Turbo C++ 1.01 compiler.
The procedure for unpacking the archive files is straightforward. Insert the
Simrad distribution diskette in the A drive. Create an empty directory on the
hard disk and copy the archive file to the empty directory. Move to the new
directory and execute the self-extracting archive program.
mkdir lobedir
copy a:*.* lobedir
cd lobedir
lo950117.exe (or older version with different date)
After completion of the archive program the "lobedir" directory contains all the
unpacked files.
To start the lobe calibration program, type
lobe.exe
at the DOS prompt. The function keys F1 to F5 select different operational
menus.
F1. To quit the lobe calibration program.
F2. Serial port 1 is used for communication with the EK 500. For the EY 500
connect to the serial line on the PC and set /Utility/Com1/Com2 Switch = On)
This menu sets the communication parameters. The RS232 cable coupling
diagram is shown on the computer display.
P2260/E
17
Calibration
F3. To record the reference target detections from the EK 500/EY 500 into a
measurement data file. Horizontal hit position and vertical target depth are
displayed.
A simulation mode is available for demonstration and training purposes by
starting the lobe calibration program with an option parameter
lobe.exe -s
F4. To view the true transducer pattern. A two-dimensional polynomial of the
fourth degree is least square fitted to the measured data points and
displayed. Please observe that the polynomial model has more freedom to
adjust to the measured data points than the EK 500/EY 500 internal
transducer model. Hence, the polynomial model should be used to view the
true transducer pattern.
F5. The internal transducer model of the echo sounder is least-square fitted
to the measured data points and displayed. The optimum pattern parameters
are automatically loaded into the echo sounder using the remote control
commands via the RS232 connection.
3.2 OPERATING PROCEDURE
Connect an RS232 serial line cable between the PC and Serial Port 1 on the EK
500 and the serial line on the PC for the EY 500.
Type F2. The plug connections will then be given on the computer display.
Check that the echo sounder Serial/USART Menu has settings corresponding
to those given in the LOBE RS232 Menu. Refer to figure 6.
Switch on the echo sounder and select the Serial/Telegram Menu and set
Remote Control to On. Follow the instructions previously given for Centering of
split beam until the sphere appears as a steady line in the echogram and the
sphere is positioned in the centre of the beam and at a suitable distance from
the transducer.
Switch on the PC and start the LOBE program. Then the LOBE program will
enter necessary menu settings in the echo sounder and read necessary
parameters from same. While the sounder is operating, check that the RS232
serial line connection is active by typing F2.
18
P2260/E
Simrad EK 500 / EY 500
Figure 6
Type F3. The display will show previously saved calibration files. The cursor
will appear at the end of the comment file on top of the display.
Erase the comment string and enter your comments concerning the present
calibration. In the Record Menu you have to fill in a new File Name and
Transceiver Number according to the setting in the sounder (if EK 500). The
transceiver number is selected by means of the horizontal arrow keys. The
correct TS for the calibration sphere according to actual sound velocity has to
be entered in addition to the Depth reading from the TS Menu provided that the
Transducer Depth has been set to 0.0 m. Refer to figure 7.
Figure 7
P2260/E
19
Calibration
The LOBE program will set up "windows" around TS value and Depth. The TS
window is ±4 dB and the Depth window is ±10%. TS samples outside the
windows will be rejected. When starting the calibration, check that the
measured TS value is well within the window. If it is close to the limit, you may,
when moving the sphere, easily end up with TS values outside the window that
will be rejected. To avoid this you should readjust the TS Transducer Gain in
the echo sounder's Transceiver Menu until the reading is closer to the correct
TS value. Then the LOBE program has to be restarted by typing CR/LF and
then F3. This is because the LOBE program has to collect the new settings from
the echo sounder. The Depth window is shown as the green part of the red bar
on the left hand side of the PC display. The present depth of the reference
sphere is shown as the white dot on the right hand side of the bar. Refer to
figure 8.
Then move the reference sphere slowly to collect TS data sets until the file
contains sufficient number (>100) of samples evenly distributed inside the 4
quadrants of the beam pattern. The present or last position of the sphere inside
the beam is shown in white colour (black) and the recorded samples are blue
(grey). The recorded number of Data Sets is shown. When the file is completed,
stop collecting data by typing CR/LF.
If the TS of unwanted objects like fish is recorded, note the sample numbers
when these are recorded. Before processing the recorded data, use an editor to
delete the data recorded from these unwanted echoes. They can be located using
the sample numbers noted, obviously incorrect TS or/and Depth values
appearing incidentally.
When suspect data has been removed, type F4 to check the true transducer
pattern. If this appears to be non-consistent with the expected shape or with
considerable offset values or other anomalies, the possible cause has to be
revealed before the calibration can be completed. The reason may be the
transducer or the transceiver unit.
If acceptable data has been recorded, type F5. The processing of the collected
data will start and the number of iterations is shown at the lower end of the Fit
Menu. When reaching approximately 50 iterations, the processed data will
remain even and the processing can be stopped by typing CR/LF. In the Fit
Menu there is a Relative Angle given in % ( E in old versions). 150 % means all
accepted samples are being used in the calculation. If the operator would like
to check the beam pattern for a reduced angle, decrease the setting by using the
horizontal arrow keys. Reducing to 100 % the calculation will only use samples
inside the -3 dB circles.
20
P2260/E
Simrad EK 500 / EY 500
In the Fit Menu the rms deviation between calculated beam pattern and the
collected data sets will be given as well as the minimum and maximum
deviation and where these data sets are recorded in the file. The max. and min.
values are shown by a red and a blue cross in the polar diagram. The recorded
max. and min. samples should be removed by using the editor if the deviations
are more than approx. 1 dB. Note the line numbers to locate these unwanted
data. All the remaining data sets are shown in the polar diagram by red and
blue dots. The red ones are those above the calculated beam pattern, the blue
are those below. A cut through the beam can be shown for 0, 45, 90 and 135
degrees by typing F1, F2, F3 or F4. Refer to figure 9.
The final calibration data for TS Gain, Beam and Offset values are calculated
and shown in the Fit Menu. These data should preferably be logged in the
recommended form at the end of this document.
By typing CR/LF one more time, the PC will ask if the operator wants to "Copy
best fit parameters to EK 500 (y/n) ?". When typing y, the calculated data will
be entered into the Transceiver Menu. If the echo sounder is already in the
Transceiver Menu, leave this and enter the same menu again to have the new
settings displayed.
When the reference sphere is located in the centre of the beam after the
calibration has been completed, the TS value in this position may be a little
higher than the correct TS. This is more perceptible using old versions of the
LOBE program with a little bit different algorithm.
P2260/E
21
Calibration
Figure 8
22
P2260/E
Simrad EK 500 / EY 500
Figure 9
P2260/E
23
Calibration
4 NOISE MEASUREMENTS AT SEA
The final result of the noise measurements should be a plot of the acoustic noise
in front of the transducer versus vessel speed. This plot may be compared with
similar plots for other transducers on the same vessel, or plots from other
vessels, and may thus serve as an evaluation of the transducer location and the
vessel noise radiation. In addition, the noise plot may be a guide in choosing the
vessel speed during acoustic surveys. Since the propeller pitch and revolutions
per minute influence the noise level, it is important to determine the most
favourable combination of these factors. Normally a slow rotation and a high
pitch give the lowest noise.
The noise measurements should take place at least one nautical mile off shore,
far from other ship traffic and and with favourable weather conditions. It is
preferable that the water depth is 200 m or more. The noise should be measured
at different vessel speeds, from 0 to maximum speed, with steps of 2 knots. The
vessel’s course must be kept steady during these measurements.
With the settings specified below, the printer will produce an echogram and an
integrator table. With some experience it should be possible to reveal the noise
source from looking at the echogram. Typical sources may be propeller
cavitation, small damages on the propeller blade, the machinery, or thermal
noise. It is a good routine to save the echogram with the integrator table for
comparison with later recordings.
Select the Operation Menu and set:
Ping Mode:
Ping Interval:
Transmit Power
Noise Margin:
Normal
0.0
Normal (only for the EK 500)
0 dB
Select the Transceiver Menu/Transceiver-1 Menu (if the transceiver to be tested
is transceiver No. 1) and set:
Mode:
Pulse Length:
Bandwidth:
Passive
Medium
Wide
Select the Transceiver Menu/Transceiver-2 Menu and set (only for the EK 500):
Mode:
Off
Select the Transceiver Menu/Transceiver-3 Menu and set (only for the EK 500):
Mode:
24
Off
P2260/E
Simrad EK 500 / EY 500
Select the Log Menu and set:
Mode:
Ping Interval:
Ping
200
Select the Display Menu and set:
Echogram Speed: 1:1
Echogram:
1
Select the Display Menu/Echogram-1 Menu and set:
Range:
Range Start:
According to table below
According to table below
Frequency
(kHz)
18
38
120
200
Auto Range:
Bot. Range Pres.
Presentation:
Layer Lines:
TVG:
Sv Colour Min.
Range Range
Start
5000
0
1000
100
250
0
200
0
Off
Off
Normal
On
20 log R
-80 dB
Select the Printer-1 Menu and set:
TS Distribution: Off
Integrator Tables 1
Echogram:
Slave
Select the Layer Menu and set:
Super Layer:
P2260/E
1
25
Calibration
Select the Layer Menu/Layer-1 Menu and set:
Type:
Range (layer thickness L)
Range Upper:
Sv Threshold
No. of Sublayers:
Frequency
kHz
18
38
120
200
Range L
m
50
20
10
5
Pelagic
See table below
See table below
-100 dB
1
Range Start
m
3975
990
195
147,5
2TL
dB
96
80
61
59,5
Range settings and transmission loss for different frequencies
Start the noise - speed trial with the vessel in a fixed position. Make a short
echogram recording and an integration table for the same interval. Print a
marker line when starting the recording and give the line a number that at
the same time is logged in the noise-speed report form at the end of this
document.
Print a second marker line at the end of the recording, connect the propeller
and increase the speed to 2 knots. When the vessel has reached a stable
speed, make a new echogram recording interval and integration table for the
same interval. Continue the same procedure at 2-knot intervals until
reaching maximum speed. Use marker lines to separate the different
intervals. When at maximum speed, disconnect the propeller as quick as
possible and print marker lines for each 2 knots as the speed decreases
towards 0.
If the noise level quickly decreases towards the level at 0 knots as soon as the
propeller has been disconnected, this means that the noise is generated by
the propeller. If the recording at decreasing speed is more or less equal to the
same noise level at increasing speed, the cause is probably flow-noise.
If the increase in level is propeller noise and this substantially reduces the
performance of the sounder, repeat the tests with different combinations of
pitch and propeller speed if possible, to find the most favourable conditions.
When making echogram recordings at different speed levels, select the Test
Menu/Transceiver and read the noise power P N re 1 W. Enter readings in the
same form at the end of this appendix.
26
P2260/E
Simrad EK 500 / EY 500
When the trial has been completed, the corresponding noise level, NL dB re 1
FPa can be calculated for both the recording procedures. The results from the
two procedures might differ somewhat because of the different ways they are
measured. The SA method gives the average echo level from a volume of
water during a specified time interval. The P N method is from one individual
power sample in each ping.
The equations for calculating from recorded data to NL is given below.
From SA: (based on the sonar equation)
NL = Si + 10 " log (PTX " SA " T / Z " L) - 2TL + 10 log Q - 75
NL
=
Noise level
dB re 1 FPa
=
Transducer transmitting response
dB re 1 FPa per A
Si
PTX
=
Transmitter power
W
Z
=
Transducer impedance
ohm
2TL
=
Two-way transmission loss
dB
L
=
Layer thickness
m
10 log Q = Equivalent two way beam angle
dB
I
=
Transmitter pulse length
msec
Si , Z , and 10 log Q is from the data sheet for the specific transducer
For split beam transducers Z is for all four quadrants in parallel
PTX and I is from the sounder specifications 2TL and L from the table on
page 26.
From PN:
NL= PN - 20 log 8 - G + 192.8
8=
c=
f=
G=
wavelength = c/f
speed of sound = 1500 m per sec.
frequency
Hz
transducer gain
dB
Read G in the Transceiver Menu/SV Transducer Gain
This noise level NL is comparable with the previous measurements on the
EK 400 when the EK 400 calibration procedure was followed.
The theory for the derivation of the above formula for NL from P N is given
here, now using linear quantities (not dB):
PN is received noise power
IN is plane wave sound intensity
in front of the transducer
A is the effective receiving area
of the transducer
PN = IN . A
G is the transducer gain = 4BA/82
P2260/E
W
W/m2
m2
27
Calibration
n is the plane wave sound pressure in
front of the transducer
Pa
n2 = IN . D c
D is water density = 1000
kg/m3
c is the speed of sound = 1500
m/s
NL = 20 log n + 120
dB re 1 µPa
120 dB is introduced for conversion from Pa to µPa
For the reason of documentation it is recommended to record one scope plot
at survey speed.
Select the Printer-1 Menu/Echogram-1 Menu and set:
Presentation: Scope.
When the scope printout has started, set:
Presentation: Normal
Repeat the measurement for transceiver 2 and 3 (if installed).
References
ICES
Cooperative Research Report 144:
Calibration of acoustic instruments for fish density estimation: A
practical guide.
ICES, Palægade 2, 1261 Copenhagen K, Denmark
ICES
Fish Capture Committee 1981/B:20
Improved calibration of hydroacoustic equipment with copper
spheres. By Foote, Knudsen, Vestnes, Institute of Marine Research,
Bergen and Brede, Nielsen, Simrad Subsea Horten, Norway.
Journal of the Acoustical Society of America, March 1983.
Maintaining precision calibrations with optimal copper spheres By
Ken Foote.
28
P2260/E
Simrad EK 500 / EY 500
Ref.
no
.
Revolutions
Engine
r.p.m.
0
1
2
3
4
5
6
7
8
9
10
11
12
13
14
15
16
17
18
19
20
21
22
23
24
Propeller
r.p.m.
0
Propeller
pitch
Vessel
speed
Measured
SA
Knots
0
Increasing
2
Increasing
4
Increasing
6
Increasing
8
Increasing
10
Increasing
12
Increasing
14
Increasing
16
m2/nm2
NL from
SA
dB re.
1 FPa
Test menu
NOISE
dB re.
1W
NL from
test menu
dB re.
1 FPa
Disconn.
0
0
0
0
0
0
0
P2260/E
29
Calibration
Blank page
30
P2260/E
Simrad EK 500 / EY 500
CALIBRATION REPORT EK 500 / EY 500
VESSEL:................................................................ DATE:........................................................................
PLACE:................................................................. EK/EY 500 SERIAL NO:.........................................
TRANSDUCER TYPE:......................... SERIAL NO.:.................... FREQUENCY:.................. KHZ
WATER TEMP:..................EC
SALINITY:...................% SOUND VELOCITY:............M/SEC.
Ping Interval
1
1
1
Absorption Coefficient
Pulse Length
sec.
dB//km
SHORT
MEDIUM
LONG
Bandwidth
Maximum Power
W
Transmit Power
Angle Sensitivity Alongship (fore and aft)*
Angle Sensitivity Athwartships*
TS of Sphere
dB
Default TS Transducer Gain
dB
Measured TS
dB
Calibrated TS Transducer Gain
dB
Calibrated TS
dB
Default 2-Way Beam Angle
dB
Transducer data 2-Way Beam Angle
dB
Measured Distance Transducer - Sphere
m
Default Sv Transducer Gain
dB
Theoretical sA
m2/nm2
Measured sA
m2/nm2
Calibrated Sv Transducer Gain
dB
Calibrated sA
m2/nm2
Default -3dB Beamwidth Along. *
degrees
Default -3dB Beamwidth Athw. *
degrees
Calibrated -3dB Beamwidth Along.*
degrees
Calibrated -3dB Beamwidth Athw.*
degrees
Alongship (fore-and-aft) Offset*
degrees
Athwartships Offset*
* Valid for split-beam transducers only
degrees
Calibration
Blank page
32
P2260/E
6LPUDG (. 2SHUDWRU PDQXDO
6LPUDG (. 2SHUDWRU PDQXDO
6LPUDG (. 2SHUDWRU PDQXDO
6LPUDG (. 2SHUDWRU PDQXDO