1
Sensor Tuner
User’s Guide
Software Version 3.2 for
Elekta Neuromag
May 2009
This document contains copyrighted and possibly confidential information and is intended for the exclusive use of
customers having Neuromag products and authorized representatives of Elekta Neuromag Oy. Disclosure to others or
other use is strictly prohibited without the express written authorization of Elekta Neuromag Oy.
Elekta Neuromag Oy reserves the right to make changes in the specifications or data shown herein at any time without notice or obligation.
Elekta Neuromag Oy makes no warranty of any kind with regard to this document and the related software, including
but not limited to, the implied warranties of merchantability and fitness for a particular purpose. Elekta Neuromag Oy
shall not be liable for errors contained herein or direct, indirect, incidental or consequential damages in connection
with the furnishing, performance, or use of this material and software.
Elekta Neuromag, Vectorview and Neuromag System are trade marks of Elekta Neuromag Oy, UNIX is a trademark
of UNIX System Laboratories, Inc., and Motif is a trademark of Open Software Foundation, Inc.
Editor: Matti Kajola
© 2001-2009 Elekta Neuromag Oy. All rights reserved.
Printed in Finland.
Printing History
Neuromag p/n
Software
Date
1st edition
NM21283A
tune_vv 3.0.x
2001-12-27
2st edition
NM21283A-A
tune_vv 3.0.x
2005-03-13
3rd edition
NM21283A-B
tune_vv 3.2.x
2009-05-18
NM21283A-B
Contents
Introduction
1
Part 1 Basic Usage
Chapter 1 User interface basics
5
1.1 Using menus . . . . . . . . . . . . . . . . . . . . . . . . . . . . . . . . . . . . . . . 5
1.2 Using text fields . . . . . . . . . . . . . . . . . . . . . . . . . . . . . . . . . . . . 5
1.3 Using file selection boxes . . . . . . . . . . . . . . . . . . . . . . . . . . . . 6
Chapter 2 Getting started
9
2.1 Beginning a session . . . . . . . . . . . . . . . . . . . . . . . . . . . . . . . . . 9
2.2 Using online HELP . . . . . . . . . . . . . . . . . . . . . . . . . . . . . . . . . 10
2.3 Ending a session . . . . . . . . . . . . . . . . . . . . . . . . . . . . . . . . . . . 10
Chapter 3 Basic tuning operations
3.1
3.2
3.3
3.4
3.5
3.6
Measuring the sensor noise level . . . . . . . . . . . . . . . . . . . . .
Fine tuning . . . . . . . . . . . . . . . . . . . . . . . . . . . . . . . . . . . . . . . .
Resetting channels . . . . . . . . . . . . . . . . . . . . . . . . . . . . . . . . .
Heating sensors . . . . . . . . . . . . . . . . . . . . . . . . . . . . . . . . . . .
About saving and loading settings . . . . . . . . . . . . . . . . . . . .
Noise display . . . . . . . . . . . . . . . . . . . . . . . . . . . . . . . . . . . . . .
Chapter 4 Troubleshooting
11
11
12
13
13
14
15
17
4.1 Basic checks . . . . . . . . . . . . . . . . . . . . . . . . . . . . . . . . . . . . . . 17
4.2 Viewing noise history of a channel . . . . . . . . . . . . . . . . . . . . 17
4.3 Tuning selected channels . . . . . . . . . . . . . . . . . . . . . . . . . . . 18
Chapter 5 Description of the menus
5.1
5.2
5.3
5.4
5.5
5.6
NM21283A-A
File Menu . . . . . . . . . . . . . . . . . . . . . . . . . . . . . . . . . . . . . . . . .
Parameters Menu . . . . . . . . . . . . . . . . . . . . . . . . . . . . . . . . . .
Commands Menu . . . . . . . . . . . . . . . . . . . . . . . . . . . . . . . . . .
Search Menu . . . . . . . . . . . . . . . . . . . . . . . . . . . . . . . . . . . . . .
View Menu . . . . . . . . . . . . . . . . . . . . . . . . . . . . . . . . . . . . . . . .
Help Menu . . . . . . . . . . . . . . . . . . . . . . . . . . . . . . . . . . . . . . . .
21
21
21
22
22
23
23
i
Part 2 Sensor operation principles
Chapter 6 Principles of SQUID operation
27
6.1 Operation of a SQUID magnetometer . . . . . . . . . . . . . . . . . . 27
6.2 SQUID electronics of Vectorview . . . . . . . . . . . . . . . . . . . . . . 29
6.3 Optimal point of operation . . . . . . . . . . . . . . . . . . . . . . . . . . . 31
Chapter 7 Manual tuning
7.1
7.2
7.3
7.4
7.5
7.6
7.7
33
Need for manual tuning . . . . . . . . . . . . . . . . . . . . . . . . . . . . .
Tools for manual tuning . . . . . . . . . . . . . . . . . . . . . . . . . . . . .
Measuring flux to current curves using Squiddler . . . . . . . .
Measuring flux to current curves using Tuner . . . . . . . . . . .
Measuring noise level . . . . . . . . . . . . . . . . . . . . . . . . . . . . . . .
Manual tuning procedure . . . . . . . . . . . . . . . . . . . . . . . . . . . .
Typical sensor problems . . . . . . . . . . . . . . . . . . . . . . . . . . . .
33
33
34
34
34
35
39
Part 3 Advanced features
Chapter 8 Basic measurements
8.1
8.2
8.3
8.4
8.5
8.6
8.7
8.8
43
Setting the expert level . . . . . . . . . . . . . . . . . . . . . . . . . . . . . .
Selecting and running jobs . . . . . . . . . . . . . . . . . . . . . . . . . .
Measurement parameters . . . . . . . . . . . . . . . . . . . . . . . . . . . .
View modes . . . . . . . . . . . . . . . . . . . . . . . . . . . . . . . . . . . . . . .
I-Phi measurement . . . . . . . . . . . . . . . . . . . . . . . . . . . . . . . . .
Noise measurement . . . . . . . . . . . . . . . . . . . . . . . . . . . . . . . .
FFT measurement . . . . . . . . . . . . . . . . . . . . . . . . . . . . . . . . . .
Signal . . . . . . . . . . . . . . . . . . . . . . . . . . . . . . . . . . . . . . . . . . . .
Chapter 9 Tuning procedures
43
44
45
46
46
47
49
50
51
9.1 Noise level based tuning . . . . . . . . . . . . . . . . . . . . . . . . . . . . 51
9.2 Tuning based on characteristics . . . . . . . . . . . . . . . . . . . . . . 52
9.3 Manual tuning . . . . . . . . . . . . . . . . . . . . . . . . . . . . . . . . . . . . . 52
Chapter 10 Measuring characteristics
10.1
10.2
10.3
10.4
53
Operating point parameters . . . . . . . . . . . . . . . . . . . . . . . . . .
Measuring derivative information . . . . . . . . . . . . . . . . . . . . .
Measuring and using current-voltage characteristics . . . . .
Measuring gate curves . . . . . . . . . . . . . . . . . . . . . . . . . . . . . .
Chapter 11 Miscellaneous
53
54
54
55
56
11.1 Searching channels . . . . . . . . . . . . . . . . . . . . . . . . . . . . . . . . . 56
ii
NM21283A-A
11.2
11.3
11.4
11.5
11.6
11.7
11.8
Loading and saving in special cases . . . . . . . . . . . . . . . . . .
Marking broken channels . . . . . . . . . . . . . . . . . . . . . . . . . . . .
Reverting operating points . . . . . . . . . . . . . . . . . . . . . . . . . .
Creating start-up files . . . . . . . . . . . . . . . . . . . . . . . . . . . . . . .
Updating the power-up settings . . . . . . . . . . . . . . . . . . . . . .
Synchronizing Janitor . . . . . . . . . . . . . . . . . . . . . . . . . . . . . .
Using SSP . . . . . . . . . . . . . . . . . . . . . . . . . . . . . . . . . . . . . . . .
Chapter 12 Description of full menus
12.1
12.2
12.3
12.4
12.5
12.6
12.7
File Menu . . . . . . . . . . . . . . . . . . . . . . . . . . . . . . . . . . . . . . . . .
Job Menu . . . . . . . . . . . . . . . . . . . . . . . . . . . . . . . . . . . . . . . . .
Parameters Menu . . . . . . . . . . . . . . . . . . . . . . . . . . . . . . . . . .
Commands Menu . . . . . . . . . . . . . . . . . . . . . . . . . . . . . . . . . .
Search Menu . . . . . . . . . . . . . . . . . . . . . . . . . . . . . . . . . . . . . .
View Menu . . . . . . . . . . . . . . . . . . . . . . . . . . . . . . . . . . . . . . . .
Help Menu . . . . . . . . . . . . . . . . . . . . . . . . . . . . . . . . . . . . . . . .
56
57
57
57
58
59
59
61
61
63
64
65
66
66
68
Appendix A Command line options
70
Appendix B Parameters
71
Appendix C Revision history
78
NM21283A-A
iii
iv
NM21283A-A
Introduction
This manual has two functions. It is at the same time the user’s manual of
the sensor tuning program and also a manual describing the operation
principles of Vectorview™ sensor hardware. Detailed descriptions about
the SQUID sensor system, electronics, and tuning principles, are given in
addition to the description of the tuning program.
The SQUID tuner program tune_vv, is a versatile tool that can be used in
maintenance of Vectorview™ measurement system. It facilitates the tuning and monitoring of the performance of the sensor electronics.
The key features provided by the program are:
•
•
•
•
•
Measuring white noise level.
Automatic fine tuning of the noise level.
Adjusting sensor operating point manually.
Measuring several characteristic curves of the sensors.
Manual heating of single or all sensors.
The functionality of the program depends on the expert level being used.
The lowest level 0 allows noise measurements and automatic fine tuning
of the system. The expert level 1 allows more complicated measurements
and setting of various parameters affecting the program. Using the features in level 1 requires understanding of the operation of the sensor system, and is intended to be used by service personnel.
This manual is divided in three parts. The first one describes how to tune
the system automatically using the SQUID tuning program. This is a
everyday operation, and reading of this part is recommended for all users.
All expert level 0 operations are explained.
The second part explains the operating principles of a SQUID sensor and
electronics. It also contains a detailed description how the sensors are
tuned manually. This information is essential for the maintenance personnel and for understanding advanced features of the tuning program.
The third part describes advanced features of the tuning program. These
are available when the expert level is set to 1, and are normally used only
by the maintenance personnel.
NM21283A-B
1
2
NM21283A-B
PART 1
Basic Usage
This part describes the basic usage of the SQUID tuning program. It
contains information about the functionality available in the lowest
expert level 0. This allows measuring white noise level of all channels
and automatic fine tuning. Reading of this part is recommended for all
users of a Vectorview system.
NM21283A-B
3
4
NM21283A-B
1
CHAPTER 1
User interface basics
This chapter explains the notation conventions used in this manual and the
basics of the user interface manipulation. If you are familiar with the
Motif interface, you may want to skip the rest of this chapter. The description of the interface given here is not intended to be complete, but rather
to give enough of information to let a novice user to operate the program.
For more information about the general manipulation of the operating system interface, refer to “User’s Guide” of Common Desktop Environment.
1.1 Using menus
On the top of the main window of the program lies a horizontal bar containing so called menus. Each one is represented by its name. When the
name is clicked with the mouse button 1 (usually the leftmost button), a
stack of buttons appears. This stack of buttons is called a menu. You can
initiate different kinds of operations by clicking corresponding button in a
menu. When a button within the menu is pressed, and the mouse button is
released, the corresponding action will be executed, and the menu disappears.
You may also activate a menu button by pressing the mouse button on the
name of the menu, holding the button down and dragging it on top of the
desired button. The action is now executed when the button is released on
the menu item. If you pop up a menu accidentally, you can cancel the
operation by releasing the mouse button when cursor is outside the menu,
or if you clicked the name, by clicking somewhere outside the menu.
Some menus contain so called submenus. They are connected to menu
buttons whose activation pops up yet another menu. The submenu itself is
used just similar fashion as a normal menu. Submenus are denoted by a
small triangle on the left edge of a menu button.
1.2 Using text fields
Several user interface elements use so called text fields, or text boxes.
This is a rectangle that contains some editable text inside.
NM21283A-B
5
1
User interface basics
To enter some new text into an empty field, click the rectangle to get the
active text insertion point (so called text focus) into the desired text field.
Then use keyboard to enter whatever text that is needed. If the text editor
has multiple lines, use return key to start a new line. Notice that in single
line text fields, pressing the return key may case some execution to occur.
In several dialogs it is equivalent of pressing the default button of the dialog.
If you need to alter all or some text in a text field, select first the text to be
altered by pressing the mouse button 1 on the starting point of the text to
be replaced, and dragging the cursor to the end point of the text to be
selected, and then releasing the button. The selected text should now have
different background color that rest of the text. Then simply type in the
new text. When you press the first character of the new text, the old
selected text will disappear.
Some text can be removed from a text field by first selecting it as
described above, and then pressing delete key. Note that the last selected
piece of text is also copied into the clipboard of the program. The current
selection in the clipboard can be “pasted” in any text field by clicking the
insertion point with mouse button 2. Selecting some text by button 1 and
pasting it in some other place by pressing button 2 saves often a lot of
time compared to entering the same text from keyboard. Copying long
numbers is usually also more reliable that entering them manually.
1.3 Using file selection boxes
In several phases of the analysis one must select a file to be loaded or processed. In most cases user can do this selection using a file selection box
dialog. The figure on the left shows an example dialog.
On the top there is a field that contains a directory specification along with
a file mask. This specification defines the directory from which a file can
be selected, and the subset of files within this directory that are shown as
possible choices. If the mask part after the last slash in specification is
character *, all files in the directory are shown. If the mask contains other
characters, the file names show must contain the same pattern. For example specification /neuro/dacq/tuning/*.tnp would select all files in directory /neuro/newdata/test that end to string “.tnp”.
Below the directory specification there are two selection boxes. The left
one lists all subdirectories to the directory specified above. You can
change the currently viewed directory easily by double clicking a directory name in this list. The right list contains all the files matching the
directory specification. Note that the parent directory is noted by filename
“..” (two dots) in these lists.
6
NM21283A-B
User interface basics
1
Below the lists there is a text field that shows the currently selected file. If
you must create a new file that does not exist yet, you can enter the new
name in this field and press ok button. For details of editing text fields see
“Using text fields” on page 5.
To select a file that already exists, double click the name of the file in the
right selection box. You may also select the file name by clicking it once,
and then pressing the ok button.
If you need to cancel the ongoing selection, press the cancel button on the
bottom of the dialog.
NM21283A-B
7
1
8
User interface basics
NM21283A-B
2
CHAPTER 2
Getting started
This chapter gives you an overview of the program, explains how to start
and stop it and provides some basic aspects that you need to know.
2.1 Beginning a session
The tuner program can be started in three ways:
• Selecting the Tuner... button in the Tools menu of the acquisition program. Measurements using acquisition program should be stopped
before starting the tuner. See “Data acquisition User’s Manual” for
details of the acquisition program.
• Using the graphical user interface of the operating system by double
clicking the tuner icon in “Maintenance” toolbox under the “MEG
analysis” toolbox.
• Giving a suitable command in UNIX shell. For the proper command
and options, refer to Appendix A.
Only one tuning program should be running at any time. If the tuning program is already running on the same system, the new starting program
shows an question dialog warning about the already running program. In
such a case you should answer OK to stop the new one and find out who is
running the program. It is possible that you get this message even if there
is no other instance of the program running, for example if the program
was killed or it died unexpectedly. If you are sure that there is no other
copy running you can go on using the program by responding with Cancel button.
After starting the program, a user interface similar to Figure 2.1 appears.
On the top of the window is a menu bar that allows access to several operations and parameter settings. Major part of the window area is taken by a
graphics area which is used to show the results of current operation. On
the left are controls to show and alter manually the SQUID working point
parameters and two large buttons that are used to initiate and stop operations. These buttons will be called “start button” and “stop button”
throughout the manual. The labels on these buttons change depending on
the situation. In the bottom of the window is a status display area and controls to alter graphics display scales.
NM21283A-B
9
2
Getting started
The status display area is divided in four regions described here from left
to right:
•
•
•
•
•
The leftmost small icons show the state of the acquisition.
Area showing current helium level in the dewar.
Status message area which shows information about ongoing activities.
Information area showing variable user data like cursor position.
Scale controls of the graphics display.
Menu bar
Working point
controls
Graphics area
View channel
Start button
Stop button
State icons
Helium level
Status text area
Information area
Graphics controls
Figure 2.1 Main window of the SQUID tuning program
2.2 Using online HELP
The Help menu contains currently only a button which shows the version
information about the program. No online help is currently available.
2.3 Ending a session
To exit the program, select Exit from the File menu. This menu is inactive
(gray) during active measurements, so if the menu is unavailable you must
stop the ongoing measurement by pressing the “stop button”. It is recommended that you exit the program after checking the noise levels or tuning
before starting a new acquisition.
10
NM21283A-B
3
CHAPTER 3
Basic tuning operations
This chapter explains how to measure white noise level of the sensors,
automatic fine tuning, and heating of the sensors.
3.1 Measuring the sensor noise level
The tuner program can be used to check the white noise level of all the
sensors. This can be done before the measurements to check that all channels are working properly.
To measure white noise levels using Tuner:
1. Stop any ongoing acquisition by pressing stop button of the acquisition
program, and wait for the measurement to stop.
2. Start the tuning program (if not running yet). See “Beginning a session” on page 9.
3. Press the large “Measure noise” button on the left.
Warning: If there was a measurement running when the tuner was
started, the start button is gray, and no tuner measurements can be initiated. In this case, one must exit the tuner, stop the normal acquisition
measurement, and then restart the tuner again.
Warning: Acquisition program can not perform measurements if the
tuner is accessing the measurement system. To enable measurements,
press stop button to stop current operation, and then another time to
release the collector (software part responsible for delivering the magnetometer data). It is recommended that you then exit the tuning program,
even though that is not necessary to perform normal acquisition.
The program now starts measuring the noise level of the system. The
noise level of all channels is shown on a bar display in the display area.
Normally all bars should be red and display value between 2 to 5 fT ⁄ Hz
( fT ⁄ ( cm Hz ) for gradiometers). Small negative bars indicate channels
that are saturated and probably are not operating in flux locked mode (not
functioning properly). Note that the colors can be adjusted personally. The
above description refers to default colors.
NM21283A-B
11
3
Basic tuning operations
If the noise values look good you can press the “stop button”, exit the program, and go on measuring with the acquisition program. If not, proceed
to tune the channels. This is explained in the next section.
3.2 Fine tuning
Normally the program is used to tune slight offsets from a good operating
point that is set after the installation of the system or thermal cycling. This
is referred as fine tuning.
Before tuning one should measure the noise level. See “Measuring the
sensor noise level” on page 11. If it is abnormally high, check that the
door of the shielded room is closed. If the noise still looks very high, or
some channels are saturated (small black bars appear in the display), try
heating the noisy channels. See “Heating sensors” on page 13. If the overall noise level is very high, you probably need to load suitable tuning settings from a file before doing the fine tuning. See “About saving and
loading settings” on page 14. Contact your administrator to find out the
correct tuning file.
When the channels seem to work properly, but the noise level is higher
than normally, running the auto-tuning routine of the tuning program
should be able to fine tune the noise levels to normal.
To tune sensors automatically:
1. Start a noise level measurement.
2. Press the “start button” again (the same button that was used to start the
noise measurement). The button should now have text Tune on it.
3. Wait until the tuning has obtained good noise values. (Or, hopefully
not, failed to tune the noise.) The tuning does not stop automatically. It
continues until it is explicitly stopped.
4. Press Stop tuning button.
5. Press Stop collector button (the same stop button as before which now
has different text on it), to release the acquisition system for normal
measurements.
Warning: All measurements should be made with the doors of the
shielded room closed.
Warning: Heat single noisy channels before tuning. Tuning may success
even with flux trapped SQUID but then the tuning is off when the sensor
is later returned to its normal state.
12
NM21283A-B
Basic tuning operations
3
Warning: Tuning for excessively long times (>5 min.) does not make the
tuning better. Instead, if the noise level is limited by something else than
SQUID noise, the tuning settings may drift to unstable values.
3.3 Resetting channels
The SQUID sensors are operated in so called flux locked mode. See
“SQUID electronics of Vectorview” on page 29. In some situations the
electronics is not capable following the signal and the output gets saturated. This can be due to very strong signals (e.g. environmental low frequency drift) or sharp transients. To get the sensor working again, the
integrator in the feed back loop and the zeroing mechanism (high pass filter), need to be reset. Saturated channels that need to be reset are represented as small negative bars in the noise display.
To reset all channels:
1. Select Commands > Reset channels from the menus.
3.4 Heating sensors
The coils and the SQUIDs in a sensor unit contain very thin superconducting film. Sometimes when the sensor is exposed to strong (relative to the
signals measured) magnetic field, these films “trap” magnetic flux. Strong
magnetic field can penetrate the film destroying the superconductivity
from a small patch of the film so that the field can go through it. Typically
the impurities in the films cause these “holes” to stick at some fixed position, thus this phenomenon is often called “flux trapping”.
The flux trapping in the sensor coils is not problematic if the flux really
stays in place. Unfortunately it is quite common that the trapped flux
moves between e.g. two points. Since the flux pinned into the film is
always strong, even a very small movement cause severe jumping in the
sensor signal.
If the flux trapping occurs so that the flux penetrates the Josephson junctions in the SQUID, the sensor ceases to work. If the pinning point is in
near neighborhood of the junctions, the extra field leaking through the
junctions cause the modulation depth of the SQUID to diminish. This can
manifest itself as increased noise or, if the effect is reasonably small, as
moving of the optimal operating point (bias, offset, and gate voltages) to
somewhat different values.
The magnetic flux in the thin films of the sensor can be removed by heating the sensor above the critical temperature of the films, and then letting
it cool down again. The sensors in Vectorview are equipped with small
NM21283A-B
13
3
Basic tuning operations
hearing resistors, so that this can be easily achieved by feeding a suitable
current pulse into the resistor. Note that each sensor unit contains three
SQUIDs, so three channels are always heated together.
To heat a single sensor that contains a particular channel:
1. Select the view channel by entering the channel name to the selection
box of the working point controls at the left side of the display area.
Press return and check that the name of the channel appear on the top
of the display.
2. Select Command > Heat sensor from the menus.
To heat all the sensors:
1. Select Command > Heat all sensors from the menus.
If you are making a noise measurement, you need also reset the electronics after heating. See “Resetting channels” on page 13.
3.5 About saving and loading settings
Tuning settings can be saved on disk and loaded back to magnetometer
later on. Recommended practice is that there should be two or three standard settings files that contain carefully made good values for normal
usage and some special situations like using the device just after helium
filling or when the helium level is very low. In normal conditions one
good setting file should be enough.
If the automatic fine tuning of the system does not succeed, one should try
first to heat bad channels and if that is not enough, load a well known tuning setting file. If this tuning still fails, contact your system administrator
to find out what has changed.
It is not recommended that the tuning settings are saved after each fine
tuning and then reloaded when tuning is needed next time, since then the
tuning settings files tend to “drift” and nobody really knows how the system should perform when some particular file is used. It is usually better
to have fixed files that are saved only by the administrative personnel so
that the expected performance is known and possible changes in the system can be detected.
To load tuning settings into tuner and magnetometer:
1. Select File > Load tunings from the menu. A dialog will pop up.
2. If the file suggested by the dialog is the one you want to load, press OK
to load the file. Otherwise press Load other to pop up an ordinary file
selection box and use it to select the file you want to load. See “Using
file selection boxes” on page 6.
14
NM21283A-B
Basic tuning operations
3
To save tuning settings into a file:
1. Select File > Save tunings from the menu. A dialog will pop up.
2. If the file name suggested is the one into which you want to save the
settings, press OK, if not, press Save elsewhere, and use the appearing file selection box to select the file.
If you get an error message “Could not get clean snapshot (bad params at
ch <number>)”, this means that all parameters of the tuner are not set
properly. However you can save the settings anyway if you just need to
save the regular working point parameters. To get rid of this message,
contact your administrator to set up the start-up files to contain all
required information.
3.6 Noise display
The tuner displays normally bar diagram showing the noise level of all
channels. During fine tuning this display shows the noise after each step.
The default scale should be good in normal situations. If you need to
change the y-scale of the display, use the control buttons in the lower right
corner of the display. The buttons available are following:
Make bars look bigger
Make bars look smaller
Autoscale bars heights
Give y-scale numerically
Table 3.1
Note that the autoscale button is a toggle button. If you press it once, all
following plots will be automatically scale and the scale varies from plot
to plot. To fix the scale again press the button an another time. The
autoscaling is also set off automatically if you press any other scaling button. To enter a numeric value to the scale, press the fourth button. The
whole area will change to a text box where you can enter the scale you
want to use. Pressing RETURN activates the new value and the icons are
shown again.
If you see a bar indicating a noisy channel and you want to know which
channel that is, move cursor over the bar and press the left button. The
name and noise level at that channel is shown in the information area. See
Figure 2.1 on page 10.
NM21283A-B
15
3
Basic tuning operations
It is also possible to show the noise values as a histogram. To do that
select View > Noise histogram from the menus. In the bar histogram gradiometer channels and magnetometer channels are shown separately. Gradiometers with red bars and magnetometers with blue bars (assuming
default colors). The lower bar is always in front of the higher one, so no
bars are hidden behind the others.
Histogram bin width and number of bins can be adjusted from the preferences dialog box. See Appendix B for meanings of the parameters.
16
NM21283A-B
4
CHAPTER 4
Troubleshooting
This chapter describes how to deal with the most common problems with
the sensors. For a more detailed description of the manual tuning and
trouble shooting, see “Manual tuning” on page 33. Also some more
advanced features available are explained including viewing the noise history during the tuning and how to tune only some specific channels.
4.1 Basic checks
If the noise level is very high before fine tuning, try following operations
until the situation looks better:
• Check that the door of the shielded room is closed.
• Check that there is no strong source of disturbance inside the room,
like a moving patient.
• Load a well known tuning file. See “About saving and loading settings”
on page 14.
• Heat suspicious or all sensors. See “Heating sensors” on page 13.
Try tuning even if all previous fail, system may be just in some non typical state, like just after powering up the system or helium level may be
very low. If this does not help, you need to contact the system administration or to tune manually to find out what is wrong.
If all channels are mostly out of lock (small negative bars), check that
there is helium in the dewar. If not, inform the system administrator
immediately to prevent system to warm up completely. If there are
helium, try loading a known tuning file. If this does not help, manual tuning is needed.
If just some channels are noisy, try heating the channels. See “Heating
sensors” on page 13.
4.2 Viewing noise history of a channel
If some particular channel is misbehaving in tuning, you can study the
noise values of a channel in previous noise measurements, e.g. how the
NM21283A-B
17
4
Troubleshooting
noise evolved during the tuning process. To do this select one channel to
be displayed.
Selecting a channel can be done in three ways:
• By entering the channel number into the channel number box of the
operating point controls. The number should be the ordinal number,
not the number in the sensor name. See Figure 2.1
• By inserting the channel name into the channel name box of the operating point controls. See Figure 2.1.
• By clicking the noise bar of the channel in the noise display with the
left mouse button while pressing the CTRL key.
The display will now show the name of the channel and a curve that indicates the noise level at each noise measurement made during the session.
You can scale the noise history display same way as the bar display. See
“Noise display” on page 15.
To change back to view all channels:
1. Enter 0 into the channel number box or
2. Click anywhere in the display with right mouse button having the
CTRL button simultaneously pressed down.
You can also view the previous operating point tuning values by clicking
with the left mouse button any particular measurement time. The bias, offset, and gate values are shown in the information area. This is especially
useful if the tuning has for some reason failed and the noise has been
lower with some other parameters than the current ones. You can read the
old parameters by clicking the noise history curve at the point where the
noise was low and then write the tuning values into the operating point
control area at the left top corner. This way you can easily get back the
good values.
Another typical usage for reading old tuning values is to check that some
abrupt change in noise is not due to change in tuning values but because
of a change in the sensor or environment.
The Command menu contains buttons that can be used to show noise histories of all channels at the same time and to clear the history records.
4.3 Tuning selected channels
In some cases it may be useful to tune only some selected channels. This
is possible by “locking” some channels. When channels are locked they
are ignored in all automatic tuning operations. Locked channels are shown
as black bars in the noise displays and their noise values are not taken into
account when the average value shown on top of the display is calculated.
18
NM21283A-B
Troubleshooting
4
Channels can be locked by two methods:
• by clicking the noise bar in the display using the left mouse button
while pressing the SHIFT key simultaneously.
• By using the “active channels” dialog, which can be popped up by
selecting the menu button Parameters > Active channels.
The “active channels” dialog is shown in Figure 4.1. The upper part of the
dialog contains a check box for each channel. The boxes are labeled with
the number part of the channel names. When the check box is set, tuning
is allowed for this particular channel. You can switch individual channels
by clicking the box and then closing the dialog by pressing OK button.
Figure 4.1
NM21283A-B
19
4
Troubleshooting
At the bottom of the dialog there are some extra buttons in addition to the
standard ones. By using the, you can set or reset large set of channels easily.
The buttons that alter the selections are:
Set All
Reset all
Reset mags
Reset grads
Activate all channels.
Deactivate all channels
Deactivate all magnetometers
Deactivate all gradiometers
So if you want to tune only one particular channel, press Reset all button
to deactivate all channels and then activate the channel you want to tune
by clicking its activation button.
20
NM21283A-B
5
CHAPTER 5
Description of the menus
This chapter contains descriptions of the menus as they appear in lowest
expert level. For full menu descriptions see “Description of full menus”
on page 61.
5.1 File Menu
The File menu contains commands that are related to saving and loading
of the internal state of the program and the measurement device.
Load tunings
This button enables you to load magnetometer state from a file. The
file must be in the tuner parameter format (.tnp). Using this command, only the state parameters are loaded, all the rest of the information in the file is discarded. See also “About saving and loading
settings” on page 14.
Save tunings
This button saves all currently active parameters into a file. It also
sets the “current” operating point information within the program to
values being used at the saving time. See also “About saving and
loading settings” on page 14.
Preferences
This button opens a dialog box that can be used to set preference
information, like some colors and the expert level. Preference information is always saved when program exits.
Exit
Use this button to stop the program. A verification is required to
really stop the program.
5.2 Parameters Menu
This menu contains buttons that pop up dialogs that enable the modification of parameters used in various tasks.
NM21283A-B
21
5
Description of the menus
Active channels
This button pops up a dialog that allows you to set which channels
are affected by the tuner. If a channel is not active, it is not modified.
See “Tuning selected channels” on page 18.
5.3 Commands Menu
This menu contains buttons for various commands that can be executed.
Reset channels
Pressing this button causes resetting of all active channels. See
“Resetting channels” on page 13.
Heat sensor
Pressing this button heats the sensor element containing currently
selected channel. See “Heating sensors” on page 13.
Heat all sensors
Pressing this button heats all sensor units. See “Heating sensors” on
page 13.
Sync electronics
Synchronize Janitor state to electronics. See “Synchronizing Janitor” on page 59.
Show all noise histories
Selecting this button will show a graph containing noise histories of
all channels superimposed on top of each other. See “Viewing noise
history of a channel” on page 17.
Clear histories
Clears the history records of all the channels. See “Viewing noise
history of a channel” on page 17.
5.4 Search Menu
This menu contains buttons that allows you to find channels according to
some characteristic feature of the channel. In order to make these searches
to work, the particular characteristic of the channel must be first measured.
Worst noise
Search the channel with largest white noise.
22
NM21283A-B
Description of the menus
5
Next
Search next channel. This button performs an incremental search
using the same criterion as the last search to find second, third etc.
bad channel.
5.5 View Menu
This menu contains buttons that select what information is shown in the
graphics area. This setting is also changed to a suitable default value when
a job is selected from the Job menu, so it is not needed often.
Noise
Select the white noise level to be shown on the graphics area.
Noise Histogram
Select the white noise levels to be shown as a histogram.
5.6 Help Menu
The help menu contains currently only one button that displays the version and the linking time of the program.
NM21283A-B
23
5
24
Description of the menus
NM21283A-B
PART 2
Sensor operation principles
This part describes the operation principles of a SQUID sensor and
electronics. It also contains a detailed description how the sensors are
tuned manually. Manual tuning is needed in the initial setup of the
device and when the automatic tuning fails for some reason.
Reading of this chapter is recommended for all users who want to
understand the operation of the device. Understanding of the operation
is necessary for the maintenance personnel and when reading the third
part describing the advanced features of the tuning program.
NM21283A-B
25
26
NM21283A-B
Principles of SQUID operation
CHAPTER 6
6
Principles of SQUID operation
This chapter explains the operating principles of a SQUID sensor and
readout electronics. It gives the necessary background information that is
needed in manual tuning of the sensors.
6.1 Operation of a SQUID magnetometer
The Superconducting QUantum Interference Device (SQUID) is the only
sensor with sufficient sensitivity for biomagnetic measurements. The
SQUID is a transducer that converts magnetic flux into electric signal.
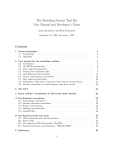
The basic structure of a SQUID magnetometer is illustrated in Figure 6.1.
The external magnetic field is not sensed directly by the SQUID; rather, it
is coupled to the SQUID detector by means of a flux transformer. The flux
transformer consists of two coils: a pickup coil that gathers the flux, and a
signal coil that couples it into the SQUID. This has the advantage of
increasing the field sensitivity by increasing the effective sensor area
(magnetic flux equals field times sensor area). Vectorview uses two kinds
of pickup loops: magnetometers and gradiometers. Magnetometer loops
are simple rectangular loops. Gradiometer loops comprise two rectangular
coils side by side, wound in opposite sense. This arrangement is “nearsighted” which greatly improves the rejection of environmental magnetic
noise.
IB
BextAp
VB
M
Ish
Lp
Ls
Flux transformer
Φa
C
R
SQUID
Figure 6.1 Schematic of a SQUID sensor
The SQUID is formed out of a superconducting ring, interrupted by two
weak links or so called Josephson junctions. Without these interruptions
the external magnetic fields, such as those generated by the brain, would
have no detectable effect on the superconducting ring. These links consist
of a microscopical isolating layer that is thin enough to ensure that the
NM21283A-B
27
6
Principles of SQUID operation
ring will maintain its superconducting properties, but only up to a certain
limit.
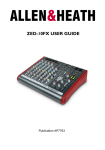
When operating the SQUID, a small current (bias current) is fed through
the SQUID ring and the voltage over the device is measured. When the
current through the SQUID is small, no voltage appears because the ring
is totally superconducting. Above a critical value (critical current) a voltage drop appears. The apparent critical current of the SQUID depends on
the magnetic flux threading the ring. Thus, maintaining the bias current at
a suitable level, a small change in the magnetic flux coupled from the
external source via the flux transformer will change the point where the
ring loses its superconductivity and voltage drop appears. This results in a
modulation of the voltage as a function of magnetic field.
IB
VB
Figure 6.2 Current-voltage characteristics of a SQUID
Another way is to fix the voltage (bias voltage) over the SQUID and measure the current through the device. Vectorview electronics uses this voltage-bias mode of operation. Figure 6.2 depicts the current vs. voltage
characteristics of a typical SQUID sensor. The characteristics consist
actually of a family of curves for each value of magnetic flux threading
the ring. However, the dependence on the magnetic flux is periodic, and it
is customary to plot only the extremum curves. As the magnetic flux
through the ring changes, the shape of the current vs. voltage curve
changes continuously between the two extrema. The period with which
– 15
the behavior repeats itself is one flux quantum Φ 0 = 2.07 ⋅ 10 Wb .
The two extremal curves shown in Figure 6.2 thus correspond to magnetic
flux values separated by Φ o ⁄ 2 .
Near the origin, the SQUID is in superconducting state and current can
flow through without a voltage loss. In Vectorview, there is a deliberately
added small series resistance which causes a finite slope near the origin as
in Figure 6.2.
28
NM21283A-B
Principles of SQUID operation
(a)
6
(b)
IB
VB3
VB2
VB1
VB1VB2
VB3
Φa = MIsh = Bext MAp / (Lp + Ls)
Figure 6.3 a) Examples of voltage bias points on I-V curve. b) Fluxcurrent characteristics at the example bias points.
If the bias voltage is set to level V B1 in Figure 6.3(a), the current through
the SQUID varies as a function of magnetic flux as given by the lowest
curve in Figure 6.3(b). The sensor remains partly in superconducting
state; therefore, there is a plateau in the current vs. flux characteristics. At
a bias voltage of V B2 the sensor is biased just above the superconducting
state, and a maximum modulation depth appears, as seen from the middle
curve of Figure 6.3(b). If the bias voltage is further increased to V B3 , the
modulation depth decreases, finally tending to zero. At large bias voltages
the SQUID looks like a resistor.
6.2 SQUID electronics of Vectorview
Figure 6.4 illustrates the principle of operation of the Vectorview readout
electronics. The signal is coupled from pickup coil to the SQUID via flux
transformer, as discussed in previous section. In addition, there is an auxiliary coil, a so-called feedback coil which is used by the readout electronics to couple various signals to the SQUID.
The bias voltage is set with the help of an operational amplifier which is
also employed to amplify the SQUID signal. The operational amplifier
tries to keep the voltage across its input terminals constant by feeding current via the feedback resistor back to the input. As a result, the voltage
over the SQUID remains at a preset value of V B , and the current through
the feedback resistor which is directly proportional to the operational
amplifier output voltage then is the actual output signal.
Even with the best operational amplifiers the noise of the amplifier
exceeds that of the SQUID. Therefore, Vectorview employs a so-called
amplifier noise cancellation circuit. The basic idea is to couple the SQUID
voltage through a variable conductance, here a field-effect transistor
(FET), and an auxiliary coil back to the SQUID magnetically. This positive feedback decreases the effect of the preamplifier voltage noise. By
adjusting the gate voltage of the FET the strength of this coupling can be
NM21283A-B
29
6
Principles of SQUID operation
Amplifier
Amplifier/Integrator
VBias
+
VOffset
+
A
D
Loop
switch
VGate
Pickup
coil
VOut
PI
Buffer
A
D
Feedback coil
SQUID
+
VExcitation
Analog part
Digital part
Figure 6.4 SQUID electronics
adjusted: with large negative gate voltage the conductivity is low, and the
effect of the amplifier noise cancellation circuit remains small. When the
gate voltage is made less negative, the compensating effect increases and
finally cancels the amplifier noise. If the gate voltage is further increased
the feedback coupling becomes too large, leading to instability and
increased noise.
Since the current vs. flux characteristics are periodic with respect to flux,
the sign of the derivative ( ∂V ) ⁄ ( ∂Φ ) may be either positive or negative.
Therefore, the amplifier noise cancellation circuit only works where ∂the
derivative has a proper sign, say, on the falling slope. (The actual sign of
the slope where amplifier noise cancellation is effective depends on how
the feedback coil is arranged.) On the opposite slope, the noise is
increased rather than decreased. The proper tuning of the gate voltage is
discussed in more detail in section 6.3.
To linearize the periodic current vs. flux characteristics, a so-called fluxlocked loop is employed. The output of the SQUID is integrated and fed
back to the feedback coil. When the feedback loop switch (see Figure 6.4)
is closed, a current proportional to the time integral of the SQUID output
voltage is fed to the feedback coil. As a result, the point of operation along
the current vs. flux characteristics changes and the corresponding current
through the SQUID changes. A stable point is only reached if the input of
the integrating amplifier reaches zero. Therefore, an offset is added to the
current vs. flux characteristics to make the curve pass through zero line.
The system then “locks” to the point of operation where the apparent output of the SQUID (containing the additional offset) is zero; any change in
the input flux from the gradiometer causes a change in the feedback current that exactly compensates the input flux change. Thus, the feedback
30
NM21283A-B
Principles of SQUID operation
6
current is a replica of the input flux. Since the SQUID with its periodic
response is now operated as a null detector, the final output signal, a voltage directly proportional to the feedback current, is linear.
For tuning purposes, it is necessary to feed in external flux to see the current vs. flux characteristics. Therefore an external flux signal can be fed
through the feedback coil.
In Vectorview the flux-locked loop is implemented using digital signal
processors which allow accurate operation and plenty of flexibility. All
loop characteristics, operating modes, and filters are digital and easy to
control. Signal processors reside physically in the electronics cabinet by
the shielded room. The analog part consists of preamplifiers and circuits
that generate the bias, offset, and gate voltages. These are on top of the
dewar. All the signals between the two parts are converted from analog
regime to digital and vice versa on the signal processor boards.
The operation of both analog and digital parts are controlled by the realtime computers of the system. The program controlling the analog part is
called Janitor, and the program controlling the signal processors and data
stream to acquisition workstation is called Collector. Normally these programs are not used directly, but through either the acquisition program or
the tuning program.
6.3 Optimal point of operation
The optimal point of operation of the SQUID is the combination of bias,
offset and gate settings that gives the minimum noise. The noise depends
on all those parameters.
Normally, the voltage bias that gives the maximum modulation depth also
gives minimum noise. The current vs. flux characteristics should be above
superconducting state everywhere (no visible plateaus). For stable operation, the adjustment should not be just on the edge but rather slightly
above. In some rare cases it may happen that minimum noise is achieved
at a higher bias; this is usually the case if the current vs. flux characteristics is not smooth. Then it may be necessary to adjust the bias higher.
Note that the shape of the current vs. flux characteristics is also affected
by the gate voltage setting. When in doubt, always set the gate voltage to
value 150 to decouple the amplifier noise cancellation before trying to
find a bias setting at which the current vs. flux characteristics looks
smooth.
Warning: Do not adjust gate setting to values below 150 unless the optimum noise is achieved with a lower value. Some FET transistors may
alter their characteristics with low bias voltages. This manifests as a shift
in the optimal gate setting which relaxes in a couple of hours.
NM21283A-B
31
6
Principles of SQUID operation
The offset should be set so that the current vs. flux characteristics curve
crosses zero in order to be able to operate the flux-locked loop. The actual
point of operation to which the system locks is determined by the point
where the curve crosses zero line. The noise of the SQUID depends in
general on the value of the input flux. It has been found experimentally,
that for Vectorview SQUIDs the minimum noise is most often achieved
for an offset setting where the zero level crosses the current vs. flux characteristics one-quarter above the minimum of the curve.
The gate voltage setting affects the amount of amplifier noise cancellation. It is set to a value where the noise is at minimum.
32
NM21283A-B
Manual tuning
CHAPTER 7
7
Manual tuning
This chapter deals with the manual tuning procedure. We assume here that
the user is familiar to SQUID working principles (see “Principles of
SQUID operation” on page 27) and to basic Tuner operation (see “Basic
Usage” on page 3). The manual tuning can be done using two different
programs and both are described here only as much as it is needed to perform the manual tuning.
7.1 Need for manual tuning
When the system is cooled down for the first time, a manual tuning must
be performed for all channels. The tuning settings are strictly valid only
for a certain SQUID sensor-electronics card pair. Therefore, if a SQUID
sensor is changed or if an electronics card is changed, new settings must
be searched manually. Note that each electronics card drives 12 SQUIDs;
if a card is changed, all channels belonging to that card must be adjusted.
After major service operations, e.g., warm up – cool down cycle, it is
advisable to check the tuning settings by going through the manual tuning
cycle.
If you encounter degraded performance, try first heating (see “Heating
sensors” on page 13), then loading a previously loaded setting file that
corresponds most closely to the actual Helium level (see “About saving
and loading settings” on page 14). If that does not help, point of operation
should be tuned manually.
7.2 Tools for manual tuning
Since Vectorview flux locked loop electronics are digital, all tuning displays are computer generated and no physical tools are needed. What is
needed is a x-y -display to show the flux vs. current (I- Φ) characteristics,
a display to show real time signal or noise level, and controls to alter the
bias, offset, and gate settings of a SQUID. There are two tools for manual
tuning. You can either use the SQUID tuning program in expert level 1, or
Squiddler, which is a small controller dialog accessing the electronics settings directly. The SQUID tuning program provides more auxiliary functionality to ease the tuning, but the Squiddler works faster (has better
response times) since it does not make any measurements. Squiddler is
used in conjunction with the normal acquisition program to make the
required measurements. The tuning program is used for both measuring
and adjusting.
NM21283A-B
33
7
Manual tuning
7.3 Measuring flux to current curves using Squiddler
The I- Φ curves of a SQUID sensor can be measured using Squiddler and
acquisition program. For the meaning of I- Φ curve, see “Operation of a
SQUID magnetometer” on page 27.
To measure I-Phi curves using Squiddler:
1. Start both acquisition program and the Squiddler program. See “Data
Acquisition User’s manual”.
2. Press the x-y button at the lower part of the raw data display to show
the x-y display.
3. Start acquisition. Default parameters are fine.
4. Set the measurement mode to tuning mode by selecting Mode > Tune
from the Squiddler menu.
5. Select the channel to be viewed using Squiddler. You can either enter
the name of the channel into the text field Channel or use the slider by
the text field.
The I- Φ curve should now be on the x-y display.
7.4 Measuring flux to current curves using Tuner
You can also use Tuner to measure the I- Φ curves. To do this, you must
be using expert level 1. To change the expert level see “Setting the expert
level” on page 43.
To measure I-Phi curves using Tuner:
1. Select Job > Manual tune from the Tuner menu.
2. Press the “start button”.
3. You should now see a bar diagram showing the modulation depths of
all channels. Select one particular channel to see the I- Φ curve.
4. To stop the measurements, press the “stop button”.
The various options available in Tuner are described in more detail in
Chapter 8. The information here should be enough to carry on the basic
manual tuning.
7.5 Measuring noise level
Manual tuning process also requires an ability to measure the noise level
of a sensor. Though the acquisition program does not provide this possibility explicitly, the tuning of the noise level can be made by judging the
changes in noise level by eye, looking at the raw data display.
34
NM21283A-B
Manual tuning
7
To measure the approximate noise level using Squiddler:
1. Select Mode > Meas from the Squiddler menu.
2. Use the navigation buttons in the raw data display to show a particular
channel on the display.
To measure the noise level with the Tuner, see “Measuring the sensor
noise level” on page 11. The right edge of the noise history trace shows
the current noise level. You can also use the raw data display in a similar
manner as when using Squiddler.
7.6 Manual tuning procedure
Manual tuning is a process to set the SQUID operating point parameters
to optimal values. This section describes this process step by step using
the measurement methods described in previous sections.
Warning: Do not adjust gate setting to values below 150 unless the optimum noise is achieved with a lower value. Some FET transistors may
alter their characteristics with low bias voltages. This manifests as a shift
in the optimal gate setting which relaxes in a couple of hours.
Warning: In some Vectorview systems pre-amplifiers are capable to
deliver signal levels which saturate the inputs of DSP boards enough to
cause them to “fold” the signals. If the signal is very noisy and changes to
opposite direction than normally when bias or offset is adjusted, scan the
whole bias/offset range to get the signal into normal regime again.
To tune a sensor manually:
1. Set the measurement system into tuning mode using either Squiddler
or Tuner.
2. Choose the channel to be tuned.
3. Adjust the bias voltage to find the maximum modulation depth of the
current vs. flux characteristics. The number in the bias setting (0…255)
is proportional to the bias voltage. Use the mouse or up and down
arrow keys to position the cursor to bias setting field. The value can
then be entered by typing in a number followed by a return or by
changing the setting one-by-one using the right arrow and left arrow
keys.
•
NM21283A-B
If the system has been tuned earlier, start from the current bias and
offset values. Otherwise set the offset voltage to a value near the
middle (128). Adjust the bias until you find the point where the
lower end of the current vs. flux characteristics curve shows a plateau like curve V B1 of Figure 7.1(a). Start the bias search from
about 150 and decrease the value using the left arrow key until you
35
7
Manual tuning
see the plateau. If you go down too much, the current vs. flux characteristics goes via zero and turns over, see Fig. Figure 7.1(b). Be
sure to be on the right side.
(a)
VB1
VB2
IB
VB3
Φa
(b)
IB
Φa
Figure 7.1 Bias tuning
•
•
•
Adjust the offset voltage so that the current vs. flux characteristics is
approximately in the middle of the screen
From the point where the plateau on the bottom appears, increase
the bias setting until it has completely disappeared, see curve V B2 .
You may decrease the bias further by one or two units to ensure stability. The current vs. flux characteristics should look rather smooth
now.
If the current vs. flux characteristics is not smooth, set the gate voltage to 150. If this does not remove irregularities, try increasing the
bias setting, even with the expense of loosing some modulation
depth.
4. Adjust the gate voltage.
36
NM21283A-B
Manual tuning
7
(a)
IB
Φa
(b)
IB
Φa
(c)
IB
Φa
Figure 7.2 Gate tuning
•
•
If the system has been tuned earlier start from the current value of
the gate setting. Otherwise start from 150. Increase the value by the
right arrow key. The noise on the falling slope diminishes, see
Figure 7.2(b), until an irregularity appears as in Figure 7.2(c). Stop
increasing the gate at that point. In the actual SQUID, the noise
might be difficult to distinguish on the 10V-scale; the appearance of
a hump in the current vs. flux characteristics is a clear sign indicating that the gate voltage has been increased too much.
Decrease the gate voltage step-by-step back until the hump has
completely disappeared and the current vs. flux characteristics looks
again smooth
5. Adjust the offset voltage so that approximately one quarter of the current vs. flux characteristics is below the zero line and three quarters
above it. See Figure 7.3 (c).
6. Change Squiddler/Tuner settings to make a noise measurement. Now
you should see a signal trace on the raw data display screen or the
noise level trace of Tuner. The noise seen should be minimized by finetuning the gate and offset. At this point, you can either use automatic
NM21283A-B
37
7
Manual tuning
(a)
IB
Φa
(b)
IB
Φa
(c)
IB
Φa
Figure 7.3 Offset tuning
fine tuning (See “Fine tuning” on page 12.), or tune the noise level
manually using the following instructions:
•
•
•
•
38
Adjust the gate voltage by the arrow keys step by steps on both
sides. Observe the noise amplitude and see whether it can be made
smaller by adjusting the gate.
If you are uncertain about the optimum, try the following technique:
lower the gate voltage until you see the noise to increase clearly.
Then go back by increasing the gate voltage until the extra noise is
gone.
Finally, try adjusting the offset a few steps on both sides to see
whether the noise can be made smaller. If there is no clear change,
leave the setting at its original value.
If the signal shows extra white noise (evenly distributed) the gate
probably needs adjustment; if the signal shows spikes, especially
NM21283A-B
Manual tuning
7
with an unsymmetrical distribution, probably the offset needs readjustment
7. If the noise level is still higher than in other channels, check the current
vs. flux characteristics again and try readjusting the bias (step 3).
7.7 Typical sensor problems
This section describes several types of sensor problems and the procedures how to deal with them.
Tuning the sensors in presence of strong disturbances, may cause the
noise level measurements to be affected by them. This appears as abnormally high average noise level on magnetometer channels. This external
noise masks the sensor noise, and makes the tuning difficult and inaccurate. In such conditions, SSP should be used in noise measurements. See
Section 11.8 on page 59 and Section 8.6 on page 47.
If the current v.s. flux curve shows hysteresis, this is most often due to
trapped flux in the sensor. To cure the problem, heat the sensor. If this
does not help, try repeating the heating a couple of times, or try changing
the heating time temporarily to 2 seconds.
Sometimes the current v.s. flux curve is tilted, that is, one end of the curve
is higher than the other as if the zero line was tilted. This is most likely
due to moisture in the preamplifier connector on the top flange of the
dewar. To fix this problem, the connectors must be dried. Tuning is not
likely to remove the problem. This kind of phenomenon may also be
result of other types of hardware failures.
If the real time signals (on raw data display) in the normal measurement
mode show jumping between two levels (also called “popcorn noise”),
most likely reason for this is trapped flux. To cure the problem, heat the
sensor.
If the real time signals show low frequency drifting in a small set of channels, this may due to oxygen snow in the dewar. If this is the case, only
way to remove the problem is to heat the whole dewar. This can be performed only by skilled maintenance personnel. Note that this kind of phenomenon may also rise due to bad SSP vectors. Check carefully the
channels both with and without the SSP and compare the behavior to good
channels.
NM21283A-B
39
7
40
Manual tuning
NM21283A-B
PART 3
Advanced features
This part describes the advanced features of the SQUID tuning program. These include measuring various characteristics of the sensors
and manual and automatic tuning of several parameters. Features
described here are intended for maintenance personnel and require
that the user expert level is set to 1. For the basic automatic fine tuning
process for everyday use, see Part 1.
The basic knowledge on SQUID operating principles and Vectorview
electronics given in Part 2 is assumed. For a general description of
manual tuning refer to Part 2.
NM21283A-B
41
42
NM21283A-B
Basic measurements
CHAPTER 8
8
Basic measurements
The tuning program is a versatile tool that can be used measure several
characteristics of a SQUID sensor. These measurements are used with
suitable adjustment routines to perform various optimization and characterization operations. This chapter describes the basic measurements that
can be made.
The basic measurements available are the following:
I/Phi
Measure flux to current transfer function of the SQUIDs. This measurement is used to view the SQUID characteristics, to measure
modulation depths for detecting flux trapped sensors, and to measure I-V curves of the SQUIDs.
Noise
Measure the white noise level of the sensors. This provides a fast
measurement of the white noise levels. Also the dc and line frequency level of disturbances are measured. These can be viewed
manually or used in automatic noise level tuning.
FFT
Measure the spectrum of the sensor signal. This gives more detailed
information about the noise compared to the “Noise” measurement,
but is slower. Spectra can be shown on a display and noise values in
selected bands can be printed.
Signal
Measure a sample of the time trace of the sensor signal. This measurement can be used to get a sample of signal to visually examine
its quality.
8.1 Setting the expert level
In order to use features described in this part, the “expert level” must be
set to 1. The setting defaults to zero but it is saved in the preferences of the
user so that once it has been changed it is kept from session to session.
To change the expert level setting:
1. Select File > Preferences from the menu. A dialog box containing all
the values regarded as preferences is popped up.
NM21283A-B
43
8
Basic measurements
2. Change the entry in the text field expertLevel and press RETURN.
After changing the level new entries should appear in to the preferences dialog. Also some new menus will appear.
3. Close the dialog by pressing Close.
The rest of the parameters in preferences settings dialog are explained in
Appendix B.
8.2 Selecting and running jobs
Before staring an operation you need to select what to do. You can select
the operation from the Job menu. The jobs are described in more detail in
the following sections.
The “jobs” available are:
I/Phi
Measure flux vs. current curves.
Noise
Measure white noise levels.
FFT
Measure spectra.
Signal
Measure signal trace.
Tune
Tune noise.
Tune (fine) Fine tune noise.
Tune (gate) Tune noise adjusting only gate values.
Tune (offs) Tune offset setting.
Manual tune Measure I/Phi curves fast to allow manual tuning.
Meas derivatives Measure parameter derivatives at operating point.
To run a measurement, select it from the Job menu, unless it is already
selected. The text on the “start button” changes according to the job so
that you can identify the currently selected job. To start a measurement
press the “start button”, to stop it, press the “stop button”.
There are two kinds of jobs. Some of them are continuous; they continue
until they are explicitly stopped. Others are one time jobs which are
started and they automatically stop when they are ready.
The acquisition system runs in three different states during the usage of
Tuner. It can be either idle, suspended, or active. When the program starts,
the acquisition is idle (unless somebody else is performing a measurement). When a job is initiated the acquisition system is started and it
becomes active. When a job stops, the acquisition is suspended, not
stopped. This means that the front end (Collector program) is actually collecting data continuously, but it is not sent to the clients like Tuner. The
benefit of this arrangement is that if the measurement parameters are not
changed, a new measurement can be started without delays. The stop button has a dual action. When a measurement is running, pressing it stops
the current operation and suspends the acquisition. The label on the “stop
44
NM21283A-B
Basic measurements
8
button” is changed to “Stop collector”. Another press will then stop the
acquisition and release the acquisition front end.
The measurement system must be idle to start new measurements using
the normal acquisition program. It is not necessary (but recommend) to
exit the Tuner in order to use acquisition, but the measurement must be
stopped into idle mode.
8.3 Measurement parameters
Each measurement or job has a set of parameters associated to it. These
affect the exact details how some operation is performed. Typical examples are sampling frequencies and number of averages taken. The default
values are adjusted to be good for normal usage, but some times it is useful to be able to adjust them. In addition to measurement parameters, program uses also various other parameters for defining operating points,
preferences etc.
The following sections describing a job also describe the associated
parameters. For a complete list of all parameters see Appendix B.
The parameters can be adjusted using dialogs that can be accessed
through the Parameters menu. They are classified using two classification schemes: parameter sets and classes. The parameter set defines which
parameter dialog is used to edit them, and the class defines the general
context in which the parameter is used. Typical sets are e.g. “Noise measurements” and “Tuning settings”, containing the parameters affecting the
noise measurements, and fine tuning. Typical classes are e.g “Measurement parameters” and “State parameters”, giving instructions to measurement routines and describing operating point settings.
To change a parameter value:
1. Select the button corresponding the parameter set of the parameter in
the Parameters menu.
2. Edit the value in the text box by the parameter name and press
RETURN.
3. Close the parameter box.
Closing the box is not necessary since the values are changed immediately
when RETURN is pressed.
NM21283A-B
45
8
Basic measurements
8.4 View modes
In most cases the result of a measurement can be displayed in several formats, or different aspects of the result can be shown. For each measurement/job there are two principal displays. One showing all channels and
another showing one specific channel. Typically the data shown for all
sensors are somehow compressed.
To select the overview (all channels), set the active channel to 0. To show
some particular channel, select the channel either by clicking the bar representing it or by using the operating point controls. See “Noise display”
on page 15.
Specific measurement results can be selected for viewing from the View
menu. The displays that are associated to each measurement mode are
listed in the description of each mode.
8.5 I-Phi measurement
The I-Phi job measures the flux versus current characteristics of all sensors. It can average several measurements and the data is arranged so that
it is possible to estimate factors like feedback voltage corresponding one
Φ o , modulation depth etc.
If these characteristics are needed for manual tuning purposes, use “Manual tune” instead. It performs the same measurement without any averaging showing the raw x-y data. The basic I-Phi job is rarely used manually,
however the measurement is used as a building block in several other jobs,
so that adjusting the parameters in “I-Phi measurements” does affect several other jobs.
The parameters affecting the I-Phi measurements are shown in table
Table 8.1.
Parameter
Type
Description
AveLength
integer
Number of x bins in x-y trace curves used
in averages.
NumAverages
integer
Number of averages taken.
TuneSfreq
float
Sampling frequency used. [Hz]
FuncAmp
float
Excitation amplitude. [V]
FuncFreq
float
Excitation frequency. [V]
Table 8.1 Parameters affecting I-Phi measurements
46
NM21283A-B
Basic measurements
8
The I-Phi measurement results can be displayed using following view
modes:
I-Phi curve
This mode shows the I-Φ curve of the sensor SQUID when a single
channel is selected. The overview mode (all channels) shows a bar
diagram where the top and bottom of the bar show the maximum
and minimum values of the I-Φ curve. This view is useful to check
that the offset settings of all channels are proper. Each bar should
cross the zero line so that about one third of the bar is below the
line.
Modulation (abs)
This mode shows the I-Φ curves of the sensors same way as the IPhi mode, except that in the overview display all bars have been
shifted to start from the zero line, so that they display the modulation depth clearly.
Modulation
This mode is similar to “Modulation (abs)” except that the modulation depths have been normalized using the nominal modulation
depth at the nominal operating point. For setting / resetting the nominal operating point, see “Operating point parameters” on page 53.
In this view all bars should have height of exactly 1.0. Any change
in modulation depth is easily noticeable. This mode is useful for
checking the presence of flux trapped SQUIDs and shifts from the
nominal operating point.
8.6 Noise measurement
Another basic operation is to measure the white noise level of the sensors.
This measurement gives a reasonably good and robust estimate of the
noise level with a quick measurement. The measurement band is in high
frequencies, so that normal external disturbances do not affect it much. As
a further refinement, line frequency disturbances are filtered away from
the data.
This mode is a tool that can be used to check quickly the quality of the
data on all channels. It is also a building block used in all noise optimization jobs. In addition to white noise level, this job measures also the dc
NM21283A-B
47
8
Basic measurements
level and line frequency disturbance amplitude on each channel. The
parameters affecting the noise measurements are shown in table Table 8.2.
Parameter
Type
Description
NoiseHpf
float
High pass filter corner frequency. [Hz]
NoiseLpf
float
Low pass filter corner frequency. [Hz]
NoiseSfreq
float
Sampling frequency. [Hz]
NoiseNAve
integer
Number of averages.
NoiseSsp
0 or 1
Is SSP used?
IgnoreAfterReset
integer
How many buffers to ignore after reset.
GoodEnough
float
Noise level regarded as good enough.
Table 8.2 Parameters affecting noise measurements
The noise measurement results can be displayed using following view
modes:
Noise
This mode shows the sensor white noise level. Overview shows a
bar for each channel showing the noise. Single channel view shows
the noise history (results of previous measurements within the session).
Noise histogram
This mode is similar to “Noise” mode, except that the overview
shows a noise histogram.
DC levels
This mode shows the dc levels of the channels.
DC level histogram
This mode shows the DC levels as a histogram.
Line freq. levels
This mode shows the level of the fundamental frequency of the line
frequency.
Line freq. level histogram
This mode shows the line frequency levels as a histogram.
48
NM21283A-B
Basic measurements
8
8.7 FFT measurement
The job “FFT” is for measuring power spectra of the channels. This can
be used to examine the external disturbances and noise characteristics in
more detail compared to the “Noise” measurement. The spectrum estimation uses a Hanning window and non-overlapping averaging.
The parameters affecting the FFT measurements are shown in table below.
Parameter
Type
Description
TimeBufSize
integer
Time buffer length. [samples]
FFTsize
integer
FFT transformation length. [samples]
FFThpf
float
High pass filter setting. [Hz]
FFTlpf
float
Low pass filter setting. [Hz]
FFTsfreq
float
Sampling frequency. [Hz]
FFTaverages
integer
Number of averages.
FFTssp
0 or 1
Is SSP used?
FFTlowStart
float
Start of low freq. estimation range. [Hz]
FFTlowEnd
float
End of low freq. estimation range. [Hz]
FFTwhiteStart
float
Start of white noise estimation range.[Hz]
FFTwhiteEnd
float
End of white noise estimation range. [Hz]
Table 8.3 Parameters affecting FFT measurements
The Time buffer size defines the length of the time trace that is actually
measured. From the beginning of each time trace, FFTsize samples are
taken and transformed into Spectral noise density per unit band (1/Hz).
The length of the time buffer should be at least the length of the Fourier
transform. In order to get better statistics, several spectra can be averaged.
The number of averages is controlled by parameter FFTaverages. It is possible to apply SSP noise reduction to the data before calculating the FFT
in order to diminish the contribution of external disturbances.
The last four parameters in Table 8.3 define two bands, one for numerical
estimation of the low frequency noise and another for estimating the white
noise level. The noise power in these bands can be shown as a bar diagram.
NM21283A-B
49
8
Basic measurements
The FFT measurement results can be displayed using following view
modes:
FFT
This mode shows the sensor/environment noise level. Overview
shows three sets of bars superposed on top of each other. Bars from
front to back: aliasing noise level (white), white noise level (red),
and low frequency noise level (black). All noises are displayed in
RMS (per Hz ). Single channel view shows the RMS spectrum of
the selected channel.
8.8 Signal
This job measures a sample of time signal trace. The length of the trace is
controlled by the parameter TimeBufSize in parameter set “FFT measurements”. When this job is selected, the single channel view shows the time
trace of that particular channel. The overview mode shows the last FFT
measurement result, if any.
50
NM21283A-B
Tuning procedures
CHAPTER 9
9
Tuning procedures
The tuning program is capable to perform several automatic tuning operations in addition to manual tuning. This chapter describes the tuning operations available.
All the tuning operations are based on the measurements described in the
previous chapter. They typically employ a loop containing a measurement
and adjusting of some parameters.
The tuning procedures available are the following:
Tune
Optimize the white noise level by adjusting bias, offset, and gate
settings.
Tune (fine)
Same as “Tune”, but with smaller steps in adjustments.
Tune (gate)
Same as “Tune”, but only the gate value is adjusted.
Tune (offs)
Adjusts the offset setting so that the zero line in the I-Φ plot crosses
the curve at specified level.
9.1 Noise level based tuning
To optimize the noise level of the sensors, Tuner provides procedures to
automatically tune the operating point parameters. All three routines are
similar. They differ only on adjusted parameters and the size of the adjustment steps.
The basic job “Tune” is provided for general purpose everyday tuning. A
detailed description of its usage is given in part “Basic Usage” starting on
page 3. It measures the white noise level, adjusts one parameter, and then
measures again. If the new noise level was lower than the previous, the
new settings are accepted. The sequence of adjustment is such that the
gate value is optimized first starting with rather large steps that then
shorten quite quickly. After the initial rounds on gate, the routine enters
into a loop optimizing sequentially bias, offset and gate values with a step
size of 2.
The “Tune(fine)” works similarly optimizing all parameters using step of
one unit.
NM21283A-B
51
9
Tuning procedures
The “Tune(gate)” mode adjusts only gate values. Bias and offset values
are left intact.
9.2 Tuning based on characteristics
The tuning mode “Tune(offs)” differs considerably from the tuning modes
described in the previous section. Instead of measuring the noise level, it
measures the I- Φ curve, and adjusts the offset so that the curve meets an
predefined criterion. The “fraction” parameter describing the level at
which the I- Φ curve crosses the zero level is adjusted so that it matches
the value defined for the nominal operating point. Only the offset settings
are changed.
9.3 Manual tuning
To perform manual tuning, the tuning program provides a special measurement mode “Manual tune”. This is optimized for manual operation so
that the measurement speed and update frequency are maximized. No
adjustments are made automatically. You can alter the settings using the
controls in the upper left corner of the user interface.
52
NM21283A-B
Measuring characteristics
CHAPTER 10
10
Measuring characteristics
This chapter describes how to measure several characteristic curves of a
SQUID sensor. These measurements are based on the basic measurements
described in Chapter 8. Typically a curve is measured by repeating a measurement with different parameter settings and picking up some particular
aspects of the measurement result.
Measuring the I- Φ curve is regarded as a basic measurements and is
described in “I-Phi measurement” on page 46.
10.1 Operating point parameters
The operating point of a SQUID is defined by the bias, offset, and gate
settings as described in Chapter 6. In addition to these settings, the characteristics of the SQUID at some particular operating point can be
described by a set of parameters like modulation depth etc. Some of these
parameters are needed by the tuning routines, some are useful in checking
the proper operation of the sensor.
The program has two concepts for the operating point: the current operating point and the nominal operating point. The first one is naturally the
current state of the sensors, the second one is the “correct” operating point
that was either loaded from a state file, or the state which prevailed when a
state file was saved (which ever has occurred last). The current state can
be set as the “nominal” operating point also by selecting Commands >
Snapshot from the menus.
One can examine the estimated parameters of each channel using “Channel info” dialog available through View > Channel info menu button. For
each parameter two values are shown; one for the current state (from last
measurement performed, if any) and for the nominal operating point
(from the state last loaded or saved from/to a parameter file).
The parameters shown in the channel info dialog are:
Channel
Bias
Offs
Gate
Modulation
Phi0
Fraction
dV/dB
dV/dO
Bias drift
NM21283A-B
Running channel number of the sensor.
Bias setting.
Offset setting.
Gate setting.
Modulation depth (volts in input).
Flux quantum size (“volts” in excitation line).
Where I- Φ curve crosses the zero line (0% = lower edge,
100% = higher edge).
Voltage change per bias adjustment unit in I- Φ mode.
Voltage change per offset adjustment unit in I- Φ mode.
(Not used)
53
10
Measuring characteristics
Offs drift
He level
(Not used)
helium level.
Operating point settings, modulation depth, and fraction are updated in
every I- Φ measurement. Helium level is automatically checked when the
program starts. The flux quantum sizes can be estimated after a I-Φ measurement by selecting Commands > Estimate phi0 from the menus. The
derivative information must be measured with a separate routine
described in next section.
10.2 Measuring derivative information
To measure the operating point derivative information:
1. Check that the current operating point is correct.
2. Check that all I- Φ traces are on the screen, and none of them is very
near saturation (near highest or lowest signal level available).
3. Select Job > Meas. derivatives from the menus.
4. Press the “start button” and wait until the measurement is finished.
This measurement calculates also estimates for the flux quantum sizes.
Note that the dV/dB value is not needed in any of the current optimization
of characterization routines, and that the dV/dO value is independent of
the operating point, so in many cases the operating point does not matter,
as long as the signals do not saturate during the measurement.
10.3 Measuring and using current-voltage characteristics
To measure the I-V curve of the SQUIDs:
1. Check that derivative information is available, If not measure it (See
Section 10.2).
2. Select Job > I-V curve from the menus.
3. Press the “start button” and wait until the measurement stops.
The I-V curves are displayed using three curves: two showing the extremum values, and one showing the modulation depth. A cursor cross hair
shows the current operating point in the graph. The curves are available
until the end of the session.
One usage for the I-V curves is a quick initial tuning. When the I-V
curves have been measured, one can set the operating point of the SQUID
by clicking a point in the graph with the left mouse button, having both
SHIFT and CTRL buttons pressed.
54
NM21283A-B
Measuring characteristics
10
10.4 Measuring gate curves
To measure the noise as a function of the gate value setting (with fixed
bias and offset settings), select Job > Scan gate from the menus and wait
until the measurement ends.
NM21283A-B
55
11
Miscellaneous
C H A P T E R 11
Miscellaneous
This chapter describes some miscellaneous operations related to searching
channels, settings files, and Janitor program.
11.1 Searching channels
The program offers several search routines to search channels for some
particular feature.
Following searches can be performed from the Search menu:
Worst offset Find channel whose I-Φ curve crosses zero line at a level
that differs most from the value defined for the current
working point.
Worst noise Find channel having largest white noise level.
Weird Phi0 Find channel whose flux quantum size differs most from
the other channels.
Next
Find next worst channel. Before this command one of the
first three commands must be issued to select which
parameter should be searched.
11.2 Loading and saving in special cases
In addition to normal saving and loading of tuning parameters, there are
two options: loading of parameters of a single channel, and saving and
loading of some selected parameters only.
The normal File > Save tunings operation saves all parameters, except
the preference parameters. The normal File > Load tunings loads only
operating point parameters, all other parameters are neglected. Therefore
one can for example check from a tuning file, what kind of measurement
settings were used, when the file was made, but these measurement settings do not affect the current settings when the file is loaded.
Using the command File > Save > Load current channel only one can
load only the operating point parameters of the current channel (channel
selected to be viewed).
To save or load only some selected parameters to all of the channels, use
menu commands File > Load > Load selected params or File > Save >
Save selected params. These commands pop up a special file selection
dialog button which has a toggle button for each parameter group. By
selecting and deselecting these buttons, one can choose which parameter
groups are saved or loaded.
56
NM21283A-B
Miscellaneous
11
11.3 Marking broken channels
Some channels can be marked broken in the start-up files. This causes that
these channels will automatically behave as if they were marked inactive
from the active channels dialog. See “Tuning selected channels” on
page 18. The flag indicating a broken channel can be toggled using menu
command Commands > Toggle broken status. The change of the status
flag is temporary and affects only the current session, unless the settings
are saved into the start-up file. See Section 11.5.
11.4 Reverting operating points
The program has two options to undo tuning settings. It is possible either
to return to the state which prevailed when the program was started, or to
the “nominal” operating point.
To revert settings to state at program start-up time:
1. Select File > Revert to start-up state from the menus.
To revert to the previous nominal point of operation:
1. Select File > Revert to previous o.p. from the menus.
11.5 Creating start-up files
To make the tuner run easily and properly, one should have two start-up
files properly set. When the program is started, it loads four files in following order:
1.
2.
3.
4.
/neuro/dacq/tuning/system.tnp (start-up script may alter this name).
/neuro/dacq/tuning/static.tnp (may be altered in the previous file).
“Current operating point file” deduced from the helium level.
~/.tuneprefs containing the personal preference settings.
The first one is intended for fixed measurement parameters etc. and it
gives default values for all parameters defined in the file. It should not be
altered unless there is a need to permanently change the default values.
Usually the file delivered with the system should be ok.
The second one is a file that should contain values for “static parameters”,
that is parameters that are assumed to be independent from the operating
point, but which vary from device to device. From this file only parameters in classes “static” and “state” are loaded, so it may contain also other
parameters which are neglected. See Appendix B.
NM21283A-B
57
11
Miscellaneous
The “static” file needs to be generated for each system after any larger
maintenance operation, like changing an electronics board or a sensor.
Before saving the file, the system should be tuned, and the derivative
information should be measured. See “Measuring derivative information”
on page 54. The file can be saved normally using the File > Save settings
menu command.
The third file loaded is deduced from the current helium level, and is
assumed to contain the nominal operating point settings. Only the operating point settings are loaded. However, these settings are not activated
automatically, so that the current operating point is not changed. If the
nominal and current operating point do differ, one can get to the nominal
one either by reloading the file explicitly or by File > Revert to previous
op menu command. This file should be saved after tuning the system. See
“About saving and loading settings” on page 14.
Note: Loading of the operating point parameters works differently during
the initial loading and when the parameters are loaded explicitly by issuing a menu command. During the initial loading the settings of the magnetometer are not changed. Only the variables defining the “correct”
operating point are changed. When the settings are loaded explicitly, the
new values are sent also to the magnetometer.
The last file loaded is the preferences file, which contains the personal
preferences settings for each user. Only the parameters in class “preferences” are loaded. The preferences are saved automatically each time the
program is exited.
11.6 Updating the power-up settings
The power-up settings contain the sensor tuning parameters that are automatically loaded after a power cycle completes. These have been initially
set at the factory to values that should enable reasonable operation of the
system. Normally these values should not be changed unless there is a
major service operation which results in a substantial change of the tuning.
To update the power-up settings file:
1. Using a Unix shell, connect first to the Janitor program at the real-time
computer (assuming that the server runs on computer called
“kaptah1”): telnet kaptah1 janitor.
2. Enter the password: pass <password>
3. Issue a dump command: dump current, take note of the response
observing that the command succeeded. Now issue command quit
4. Make a backup copy of a file “/neuro/dacq/setup/janitor.powerup” on
the workstation. Copy the newly created power-up file from “/tmp/jan58
NM21283A-B
Miscellaneous
11
itor.dump” located on the real-time computer to “/neuro/dacq/setup/
janitor.powerup” on the workstation as follows: enter telnet
kaptah1 . Enter user name root, no password. Then issue command: cp
/tmp/janitor.dump
/neuro/dacq/setup/
janitor.powerup. Then exit the telnet terminal.
11.7 Synchronizing Janitor
If the pre-amplifier power is brought down, the registers on the boards
lose their contents. Currently this situation is not automatically noticed by
the Janitor (electronics software driver running at the real time computers). Janitor can be forced to update all values in the electronics by giving
a “sync” command. This can be easily achieved by selecting the Commands > Sync electronics command from the menus. In normal situation this command just refreshes all registers in the dewar-top electronics,
so it should not cause any harm to issue the command.
11.8 Using SSP
Noise reduction based on signal space projection (SSP) can be used in
several measurement mode. Modes that allow the noise reduction have a
parameter xxxSSP, where xxx depends on the measurement. The need of
using the noise reduction depends on case to case. The normal tuning can
be performed without SSP, unless the environment is very noisy. On the
other hand, spectra calculated for the magnetometers are severely affected
by the external noise, unless SSP is used.
NM21283A-B
59
11
60
Miscellaneous
NM21283A-B
12
CHAPTER 12
Description of full menus
This chapter lists reference information about all menu functions. There is
only a brief description of the actions here and possibly a reference to a
more detailed description. The availability of the menu functions depends
on the chosen expert level setting. Menu entries described below are available on expert level 1 (recommended experienced user level) unless indicated to be available only on expert level 2 (recommended only for very
special needs).
12.1 File Menu
The file menu contains commands that are related to saving and loading of
the internal state of the program and the measurement device.
Load tunings
This button enables you to load magnetometer state from a file. The
file must be in the tuner format (.tnp). Using this command, only the
state parameters are loaded, all the rest of the information in the file
is discarded. If you need to load some other information, use Load
> Load selected params button. See “About saving and loading
settings” on page 14.
Save tunings
This button saves all currently active parameters into a file. It also
sets the “current” operating point information within the program to
values being used at the saving time. See “About saving and loading
settings” on page 14.
Revert to previous o.p.
This button returns the magnetometer tuning state to the “current”
tuning state. This state reflects the state of the magnetometer at the
time when the program was started, or the state specified in the
parameter file last loaded or saved. See “Reverting operating points”
on page 57.
Revert to start-up state
This button returns the magnetometer tuning state to the state that
was prevailing when the tuner program was started. It undoes all
NM21283A-B
61
12
Description of full menus
changes made by the tuning program. See “Reverting operating
points” on page 57.
Load > Current channel only
Load settings of the currently selected channel only. See “Loading
and saving in special cases” on page 56.
Load > Load selected params
Load some selected parameter sets to all channels. See “Loading
and saving in special cases” on page 56.
Load > Load I-V curve (Level 2 only)
Load “current” operating point I-V curves from a file.
Load > Load gate curve (Level 2 only)
Load “current” operating point gate curves from a file.
Load > Load I-V (on meas) (Level 2 only)
Replace (existing) measured I-V curves from a file.
Load > Load gate (on meas) (Level 2 only)
Replace (existing) measured gate curves from a file.
Save > Save selected params
Save some selected parameter groups only. See “Loading and saving in special cases” on page 56.
Save > Save noise in ASCII (Level 2 only)
Save selectable noise values into a text file.
Save > Save I-V curve (Level 2 only)
Save the measured (scanned) I-V curves.
Save > Save gate curve (Level 2 only)
Save the measured (scanned) gate curves.
Print > Print all I-V curves (Level 2 only)
Print all I-V curves.
Preferences
This button opens a dialog box that can be used to set preference
information, like some colors and the expert level. Preference information is always saved when program exits. For description of the
preference parameters, see Appendix B.
Exit
Use this button to stop the program. A verification is required to
really stop the program. See “Ending a session” on page 10.
62
NM21283A-B
Description of full menus
12
12.2 Job Menu
This menu contains buttons that define the operation that should be performed. The job is not executed immediately. These buttons only select
which job will be run when the “start button” is pressed. For more detailed
descriptions of the jobs see Chapter 8 and Chapter 9.
I/Phi
Select measurement of flux to current characteristics.
Noise
Select white noise measurement. This gives less information, but is
faster than a measurement of noise spectrum. It also provides the
level of line frequency disturbance and the dc-levels of all the channels.
FFT
Select FFT measurement that gives the spectrum of the signals. This
gives information about the noise as a function of frequency, but it is
slower than a measurement of white noise only.
Signal
Measure signal samples.
Tune
Select automatic tuning of all operating point parameters. This version uses larger steps than the fine tuning (below). Faster than the
fine tuning but not as robust.
Tune (fine)
Select the automatic tuning of all operating point parameters using
small steps.
Tune (gate)
Select automating tuning of gate settings only.
Tune (offs)
Select automatic adjustment of offset values.
Manual tune
Select manual tuning mode.
Meas. derivatives
Select measurement of operating point derivative information.
Meas I-V curve (Level 2 only)
Select measurement of current versus voltage curves.
NM21283A-B
63
12
Description of full menus
Scan gate (Level 2 only)
Select measurement of noise versus gate value.
12.3 Parameters Menu
This menu contains buttons that pop up various dialogs that enable the
modification of parameters used in various tasks. The parameters are
described briefly in Appendix B.
Active channels
This button pops up a dialog that allows you to set the channels that
are affected by the tuner. If a channel is not active, it is not modified,
and it set to a “passive” state to minimize its effect on other channels. See “Tuning selected channels” on page 18.
System Parameters
Open an editor for system parameters.
I-Phi measurements
Open an editor for I-Phi measurement parameters. See “I-Phi measurement” on page 46.
Noise measurements
Open an editor for noise measurement parameters. See “Noise measurement” on page 47.
FFT measurements
Open an editor for spectrum measurement parameters. See “FFT
measurement” on page 49.
Signal measurements
Open an editor for signal measurement parameters. See “Signal” on
page 50
Tuning settings
Open an editor for tuning parameters.
Bias scan (Level 2 only)
Open an editor for bias scan parameters. See “Measuring and using
current-voltage characteristics” on page 54.
Gate scan (Level 2 only)
Open an editor for gate scan parameters. See “Measuring gate
curves” on page 55.
64
NM21283A-B
Description of full menus
12
12.4 Commands Menu
This menu contains buttons for various commands that can be executed.
Reset channels
Pressing this button causes resetting of all active channels. See
“Resetting channels” on page 13.
Heat sensor
Heat a single sensor. See “Heating sensors” on page 13.
Heat all sensors
Heat all sensors. See “Heating sensors” on page 13.
Sync electronics
Synchronize Janitor state to electronics. See “Synchronizing Janitor” on page 59.
Snapshot
Mark current state as the nominal operating point. See “Operating
point parameters” on page 53.
Estimate phi0
Estimate flux quantum sizes from a I-Phi measurement results. See
“Operating point parameters” on page 53.
Set biases to maxima (Level 2 only)
Set bias value for each channel to achieve maximum modulation as
determined from a bias scan.
Set gates to minima (Level 2 only)
Set gate values to achieve minimum noise as determined from a gate
scan.
Fractions to 1/3 (Level 2 only)
Set offset value target point to 1/3 level of the modulation range.
Set dVdO to ... (Level 2 only)
Manually set the offset adjustment unit to voltage scaling.
Show all noise histories
Selecting this button will show the a graph containing noise histories of all channels superimposed on top of each other. See “Viewing noise history of a channel” on page 17.
Clear histories
Clears the history records of all the channels. See “Viewing noise
history of a channel” on page 17.
NM21283A-B
65
12
Description of full menus
Toggle broken status
Toggle status flag used for marking broken channels. See “Marking
broken channels” on page 57.
12.5 Search Menu
This menu contains buttons that allows you to find channels according to
some characteristic feature of the channel. In order to make these searches
to work, the particular characteristic of the channel must be first measured. See “Searching channels” on page 56.
Worst offset
Find channel with largest error in “fraction” parameter.
Worst noise
Search the channel with largest white noise.
Weird phi0
Search the channel whose measured flux quantum differs most from
the average.
Next
Search next channel. This button performs an incremental search
using the same criterion as the last search (activated by one of the
buttons described above) to find second, third etc. bad channel.
12.6 View Menu
This menu contains buttons that select the information shown on the
graphics area. This setting is also changed to a default value when a job is
selected from the Job menu, so it is not often needed.
Channel info
This button pops up a dialog box that shows miscellaneous information about the current settings of the selected channel. See “Operating point parameters” on page 53.
Raw trace
Show the I-Phi data time trace.
I-Phi curve
Select the I-Phi curve to be shown on the graphics area. Curve is
shown only if a I-Phi measurement has been performed during the
session. See “I-Phi measurement” on page 46.
66
NM21283A-B
Description of full menus
12
Modulation
Select the overview of relative modulation depths. See “I-Phi measurement” on page 46.
Modulation (abs)
Select the overview of absolute modulation depths. See “I-Phi measurement” on page 46.
I-V curve
Show the last measured I-V curve. See “Measuring and using current-voltage characteristics” on page 54.
Noise
Select the white noise level to be shown on the graphics area. See
“Measuring the sensor noise level” on page 11.
Noise histogram
Select the white noise level histogram to be shown. See “Measuring
the sensor noise level” on page 11.
FFT
Select the spectrum of the signal on the selected channel, or a overview of noises on all of the channels when channel zero is selected.
See “FFT measurement” on page 49.
Signal
Select viewing of signal samples. See “Signal” on page 50.
Gate curve (Level 2 only)
Select viewing of noise versus gate setting curve. See “Measuring
gate curves” on page 55.
DC levels
Select the graph showing dc-levels of the channels.
DC level histogram
Select the graph showing the dc-levels as a histogram.
Line freq. levels
Select the line frequency levels to be shown on the graphics area.
Line freq. level histogram
Select the graph showing line frequency levels as a histogram.
Bias history
Show history of bias value settings.
Offset history
Show history of offset value settings.
NM21283A-B
67
12
Description of full menus
Gate history
Show history of gate value settings.
12.7 Help Menu
The help menu contains only one button that displays the version and the
linking time of the program.
68
NM21283A-B
Description of full menus
NM21283A-B
12
69
A
Command line options
APPENDIX A
Command line options
This appendix describes the command line arguments and options of the
tuning program.
Command syntax: tune_vv <options>
Command line options:
-nolock
Ignore lock files.
-expert <number>
Set the expert level of the user.
-default <measurement>
Set the default measurement mode. The valid values for the measurements with this option are: tune, fine-tune, noise, i-phi, manualtune, fft, gate, bias, offs, modu, signal.
-defs <filename>
Define the name of the file containing the system parameters
(default values).
-static <filename>
Define the name of the file containing the “static” parameters.
-load <filename>
Define the name of the state file to load in start-up.
-site <filename>
Define the name string describing the measurement site.
-device <filename>
Define the name string describing the device.
The valid values for the measurements with the -default option are:
tune, fine-tune, noise, i-phi, manual-tune, fft,
gate, bias, offs, modu, signal.
70
NM21283A-B
Parameters
APPENDIX B
B
Parameters
This appendix lists all parameters that can occur in a tuner parameter
(.tnp) file. The parameters are arranged by their parameter set. Each set
contain parameters that are (or would be) displayed in same dialog box.
The class of a parameter is a tag that is used to group functionally similar
parameters together. Parameters can for example be loaded per class
basis, and e.g. class preferences is saved to a special file. Parameter name
is the name used in the setup files. If the type name contains brackets []
after the name, this means that the parameter is a vector (typically one
value for each channel). If the type contain braces {} the type is a set of
the base type objects
The system parameters contain parameters that describe the structure of
the measurement system and its environment. The parameters are shown
in Table B.2.
class
parameter name
type
description
system
SysType
string
Type of the device
system
LineFrequency
float
Power line frequency of the site [Hz]
system
OVLlevel
float
Overload voltage level [V]
system
UseHeNames
integer
Use helium level in state file names?
system
HeLevels
integer{}
List of helium levels used [%]
system
HeLevelLog
string
Name of the helium level log file
system
HeatingTime
float
How long to heat a sensor [s]
system
JanitorService
string
Janitor service name
system
JanitorBoot
string
janitor boot file name
system
CurrentPar
string
Directory for current parameter settings
system
HistoryDir
string
Directory for history files
system
ReferenceIV
string
Reference I-V
system
NoiseLog
string
Noise log file name
system
AuxCollVar
string
Auxiliary collector variable to be sent
system
ReferenceCh
integer
X-signal name
Table B.1 System Parameters
NM21283A-B
71
B
Parameters
The I-Phi parameters contain parameters that are related to I-Phi measurements. The parameters are shown in Table B.2.
class
parameter name
type
description
measurement
AveLength
integer
Number of x bins in x-y trace curves
measurement
NumAverages
integer
Number of averages in I-Phi measurements
measurement
TuneSfreq
float
Sampling frequency used in I-Phi measurements [Hz]
measurement
FuncAmp
float
Function generator amplitude [V]
measurement
FuncFreq
float
Function generator frequency [Hz]
measurement
WuFuInterval
integer
(reserved)
Table B.2 I-Phi measurement parameters
The noise measurement parameters describe how to make a white noise
measurement. The parameters are described in Table B.3.
class
parameter name
type
description
measurement
NoiseHpf
float
High pass filter used [Hz]
measurement
NoiseLpf
float
Low pass filter to be used [Hz]
measurement
NoiseSfreq
float
Sampling frequency to be used [Hz]
measurement
NoiseNAve
integer
Number of averages taken
measurement
NoiseSsp
integer
Is SSP used? [0 or 1]
measurement
IgnoreAfterReset
integer
How many buffers to ignore after reset
measurement
GoodEnough
float
Level below which the tuning is stopped
Table B.3 Noise measurement parameters
The FFT parameters describe how the spectral calculations are performed.
The parameters are listed in Table B.4.
class
parameter name
type
measurement
TimeBufSize
integer
Time buffer length [s]
measurement
FFTsize
integer
Length of the FFT transforms [samples]
measurement
FFThpf
float
High pass filter used in FFT meas [Hz]
Table B.4 FFT measurement parameters
72
NM21283A-B
Parameters
class
parameter name
B
type
measurement
FFTlpf
float
Low pass filter used in FFT meas [Hz]
measurement
FFTsfreq
float
Sampling frequency used in FFT meas [Hz]
measurement
FFTaverages
integer
Number of averages in spectra
measurement
FFTssp
integer
is SSP used in spectra calculation?
measurement
FFTlowStart
float
Start of low frequency interval [Hz]
measurement
FFTlowEnd
float
End of the low frequency interval [Hz]
measurement
FFTwhiteStart
float
Start of the white noise interval [Hz]
measurement
FFTwhiteEnd
float
End of the white noise interval [Hz]
Table B.4 FFT measurement parameters
The tuning setting gives parameters that affect the offset value tuning. The
parameters are listed in Table B.5
class
parameter name
type
description
measurement
Accuracy
integer
Required accuracy needed to stop [relative]
measurement
SettlingTime
integer
Length of the settling time after parameter
changes [s]
measurement
LogCh
integer
Channel to be logged for testing
Table B.5 Tuning settings
The bias scan settings affect the measurement of I-V curves.
class
parameter name
type
description
measurement
BiasScanStep
integer
Step size in bias scans
measurement
BiasScanInitialWait
integer
Settling time in the beginning [s]
measurement
BiasScanSettlingTime
integer
Settling time between measurements [s]
measurement
IVPlotBottomScale
float
Lower y-bound for I-V plots
measurement
IVPlotTopScale
float
Higher y-bound for I-V plots
Table B.6 Bias scan
NM21283A-B
73
B
Parameters
The gate scan parameters affect the measurements of noise versus gate
setting curves.
class
parameter name
type
description
measurement
GateScanStart
integer
Start value for gate scans
measurement
GateScanStop
integer
End value for gate scans
measurement
GateScanStep
integer
Step size in gate scans
measurement
GateScanInitialWait
integer
Settling time in the beginning of the scan [s]
measurement
GateScanSettlingTime
integer
Settling time between measurements.
measurement
GateFork
integer
(reserved)
Table B.7 Gate scan parameters
The operating point parameters define the nominal operating point and
some sensor features at that point.
class
parameter name
type
description
state
OpHeLevel
integer
Helium level at the operating point
state
OpBias
integer[]
Bias setting at the operating point
state
OpOffs
integer[]
Offset setting at the operating point
state
OpGate
integer[]
Gate setting at the operating point
state
OpFract
float[]
I-Phi curve “fraction” at the o.p.
state
OpBiasDrift
float[]
(reserved)
state
OpOffsDrift
float[]
(reserved)
Table B.8 operating point parameters
The static parameters define sensor characteristics, that are independent of
the operation point.
class
parameter name
type
description
static
OpBtoV
float[]
Bias current change per setting unit
static
OpOtoV
float[]
Offset current change per setting unit
static
GateLow
integer[]
(reserved)
static
GateHigh
integer[]
(reserved)
static
OpMod
float[]
Modulation depth at o.p.
Table B.9 Static parameters
74
NM21283A-B
Parameters
class
parameter name
type
B
description
static
OpPhi0
float[]
Flux quantum size of a channel
static
OpNoise
float[]
Noise at the operating point
static
BrokenCh
integer[]
Is the channel broken?
Table B.9 Static parameters
The preference parameters define values that are saved separately for each
user. Color names defined for the X-window system are used as values of
the color settings. A complete list of these names can be found from file
/usr/lib/X11/rgb.txt.
class
parameter name
type
description
preference
TraceColor
string
Color used in curves
preference
BgTraceColor
string
Backgroung trace color
preference
TextColor
string
Text color
preference
HistogramColor
string
Histogram boundary color
preference
LowFreqColor
string
Low frequency histogram fill color
preference
BandColor
string
White noise color for gradiometers.
preference
BandColor2
string
White noise color for magnetometers
preference
AliasedColor
string
Aliased noise color for histograms
preference
LockedColor
string
Histogram color for locked channels
preference
IgnoredColor
string
Histogram color for ignored channels
preference
ReadyColor
string
Histogram color for ready channels
preference
CursorColor
string
Cursor color
preference
NoiseNBins
integer
How many bins in noise histograms
preference
NoiseBinWidth
float
Bin width in noise histograms
preference
DCNBins
integer
How many bins in DC-level histograms
preference
DCBinWidth
float
Bin width in DC-level histograms
preference
LineNBins
integer
How many bins in line frequency histograms
preference
LineBinWidth
float
Bin width in line frequency histograms
preference
expertLevel
integer
Current expert level
Table B.10 Preferences
NM21283A-B
75
B
Parameters
Scaling parameters are used to preserve the display scales from one session to another.
class
parameter name
type
description
preference
DispScaleTrace
float
I-Phi curve scale
preference
DispOffsTrace
float
I-Phi curve offset
preference
DispScaleNoise
float
Noise plot scale
preference
DispOffsNoise
float
Noise plot offset
preference
DispScaleFFT
float
FFT plot scale
preference
DispOffsFFT
float
FFT plot offset
preference
DispScaleSign
float
Signal plot scale
preference
DispOffsSign
float
Signal plot offset
Table B.11 Scales
Testing parameters are used only in internal test mode, not in actual use.
class
parameter name
type
description
testing
TestMode
integer
(reserved)
testing
TestOffset
float
(reserved)
testing
TestNoise
float
(reserved)
testing
TestLfNoise
float
(reserved)
testing
TestAmp
float
(reserved)
testing
TestSine
integer
(reserved)
Table B.12 Testing parameters
The curve matching parameters are currently not used. They are defined
for compatibility reasons.
class
parameter name
type
description
measurement
CurveMatchDelta
integer
(reserved)
measurement
CurveMatchLimit
float
(reserved)
measurement
CurveMatchMaxTry
integer
(reserved)
testing
CurveMatchVerbose
integer
(reserved)
Table B.13 Curve match parameters
76
NM21283A-B
Parameters
B
The obsolete parameters are defined to make the program backward compatible with old parameter files. They are not used by the program.
class
parameter name
type
description
obsolete
VErrorNBins
integer
(obsolete)
obsolete
VErrorBinWidth
float
(obsolete)
obsolete
MarkerStyle
integer
(obsolete)
obsolete
TuneBand
float
(obsolete)
obsolete
Npoles
integer
(obsolete)
obsolete
Step
integer
(obsolete)
obsolete
SpectrumLen
integer
(obsolete)
Table B.14 Obsolete parameters
NM21283A-B
77
C
Revision history
APPENDIX C
Revision history
This appendix describes changes made both to the manual and the program.
This manual applies to program tune_vv version 3.2.x which is a tuning
program for Elekta Neuromag, Vectorview and Neuromag System
devices. The program was developed from program tune version 2.0
which is used with Neuromag-122 systems. Due to such historical reasons
the first release of tune_vv is numbered 3.0 rather than 1.0.
This is the third edition of the manual. The differences from the second
edition are: (a) the company logo has been updated, and (b) Commandmenu labels have been updated.
78
NM21283A-B
INDEX
i
Index
A
Acquisition modes 44
B
Beginning a session 9
Bias
current 28
setting 53
voltage 28, 29
Broken channels 57
C
Channel info 53
Controlling displays 15
Histograms
changing resolution 16
viewing noise level 16
I
I-Phi measurement 46
I-V characteristics 28
I-V curve 54
L
Loading
settings 14, 56
Locking channels 19
M
E
Electronics
description 29
Exiting program 10
Expert level 1
setting of 43
F
FFT measurements 49
File selection box
using 6
Flux locked loop 30, 31
Flux quantum 28
G
Gate
setting 53
voltage 29, 32
Gradiometer 27
H
Heating sensors 13
Help
online 10
Histogram
changing bin width 16
Magnetometer 27
Main window 10
Manual tuning 33, 35
Measurement modes 43
Measurement parameters 45
Measuring
characteristics 53
derivative information 54
flux quantum size 54
gate curves 55
I-Phi curves with Squiddler 34
I-Phi curves with Tuner 34
I-V curve 54, 59
noise level 47
Noise level with Squiddler 34
signal samples 50
spectra 49
white noise level 11, 17
Menu
Command 22
File 21
Help 23
Parameters 21, 45
Search 22
View 23
Menus
using 5
Modulation depth
explanation 28
79
i
INDEX
N
Noise cancellation
of the electronics 29
Noise history 17
O
Offset
setting 53
voltage 32
Operating point 31, 53
parameters of 53
reverting 57
P
Parameter class 45
Parameter set 45
Parameters
measurement 45
of FFT measurement 49
of I-Phi measurement 46
of noise measurement 48
Point of operation. See Operating point
Power-up settings 58
Preferences 21
Start button 9
Starting
measurement 44
program 9
Starting program 9
Start-up files 57
Status area 10
Stop button 9
Stopping program 10
T
Text fields
using 5
Troubleshooting 17
Tuning
manually 35, 52
offset level 52
procedures 51
selected channels 18
white noise level 12, 51
V
View modes 46
W
R
Resetting channels 13
Reverting operating points 57
S
Saving
settings 14, 15, 56, 58
Searching 56
Selecting
channels to be shown 18
job 44
view of all channels 18
Sensor operation 27
Setting
expert level 43
Showing
noise level as histogram 16
Snapshot 53
SQUID
operation 27
SSP
and sensor problems 39
how to use 59
80
Workspace 10
List of procedures
To change a parameter value: 45
To change back to view all channels: 18
To change the expert level setting: 43
To heat a single sensor that contains a particular channel: 14
To heat all the sensors: 14
To load tuning settings into tuner and magnetometer: 14
To measure I-Phi curves using Squiddler: 34
To measure I-Phi curves using Tuner: 34
To measure the approximate noise level using Squiddler: 35
To measure the I-V curve of the SQUIDs: 54
To measure the operating point derivative information: 54
To measure white noise levels using Tuner: 11
To reset all channels: 13
To revert settings to state at program start-up time: 57
To revert to the previous nominal point of operation: 57
To save tuning settings into a file: 15
To tune a sensor manually: 35
To tune sensors automatically: 12
To update the power-up settings file: 58
NM21283A
81
Elekta Neuromag Oy
Siltasaarenkatu 18-20
FI-00530 Helsinki, Finland
Tel:
+358 9 756 2400
Fax:
+358 9 756 24011
E-mail:
neuromag@elekta.com
Web:
www.elekta.com